© Imation Corp. Imation, the Imation logo, Defender...
86
© Imation Corp. Imation, the Imation logo, Defender, Memorex, the Memorex logo, XtremeMac, and the XtremeMac logo are trademarks of Imation Corp. and its subsidiaries. The TDK Life on Record logo is a trademark of TDK Corporation. All other trademarks are property of their respective owners.
Transcript of © Imation Corp. Imation, the Imation logo, Defender...

© Imation Corp.
Imation, the Imation logo, Defender, Memorex, the Memorex logo, XtremeMac, and the XtremeMac logo are trademarks of Imation Corp. and its subsidiaries. The TDK Life on Record logo is a trademark of TDK Corporation. All other trademarks are property of their respective owners.

Imation’s Strategic Transformation: Investing for Growth – 2.28.2012 2
Risks and UncertaintiesCertain information which does not relate to historical financial information may be deemed to constitute forward-looking statements within the meaning of the Private Securities Litigation Reform Act of 1995. The words or phrases "is targeting," "will likely result," "are expected to," "will continue," "is anticipated," "estimate," "project," "believe," or similar expressions identify "forward looking statements." Such statements are subject to certain risks and uncertainties that could cause our actual results in the future to differ materially from our historical results and those presently anticipated or projected. We wish to caution investors not to place undue reliance on any such forward-looking statements. Any forward-looking statements speak only as of the date on which such statements are made, and we undertake no obligation to update such statements to reflect events or circumstances arising after such date. Risk factors include our ability to successfully implement our strategy; our ability to grow our business in new products with profitable margins and the rate of revenue decline for certain existing products; the ability of our data security products to withstand cyber-attacks; the ability to quickly develop, source, introduce and deliver differentiating and innovative products; our potential dependence on third parties for new product introductions or technologies in order to introduce our own new products; the ready availability and price of energy and key raw materials or critical components including due to the effects of natural disasters such as the October 2011 flooding in Thailand and our ability to pass along raw materials price increases to our customers; continuing uncertainty in global and regional economic conditions; our ability to identify, integrate and realize the expected benefits from any acquisition which has occurred or may occur in connection with our strategy; the possibility that our goodwill or any goodwill that we acquire may become impaired; the seasonality and volatility of the markets in which we operate; foreign currency fluctuations; changes in European law or practice related to the imposition or collectability of optical levies; significant changes in discount rates and other assumptions used in the valuation of our pension plans; the possibility that our intangible assets may become impaired; changes in tax laws, regulations and results of inspections by various tax authorities; our ability to successfully defend our intellectual property rights and the ability or willingness of our suppliers to provide adequate protection against third party intellectual property or product liability claims; the outcome of any pending or future litigation; failure to adequately protect our information systems from cyber-attacks; our ability to meet our revenue growth, gross margin and earnings targets and the volatility of our stock price due to our results or market trends, as well as various factors set forth from time to time in our filings with the Securities Exchange Commission.

Our Revenue Transformation


Imation’s Strategic Transformation: Investing for Growth – 2.28.2012 7


Imation’s Strategic Transformation: Investing for Growth – 2.28.2012 9
Our Revenue Transformation
Imation’s Strategic Transformation: Investing for Growth – 2.28.2012 10
Imation’s Strategic Transformation: Investing for Growth – 2.28.2012 11
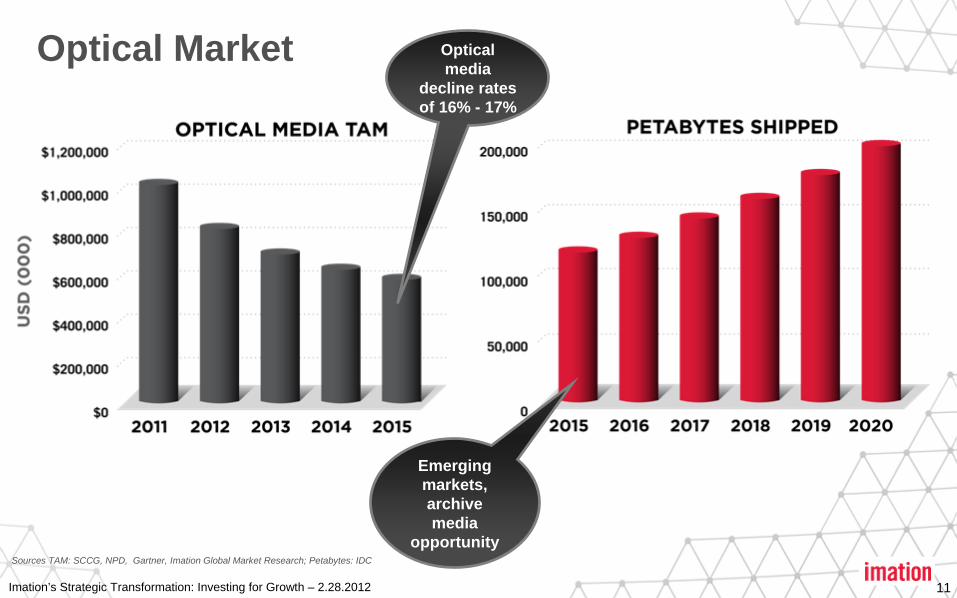
Optical Market
Sources TAM: SCCG, NPD, Gartner, Imation Global Market Research; Petabytes: IDC
Emerging markets, archive media
opportunity
Optical media
decline rates of 16% - 17%

Imation’s Strategic Transformation: Investing for Growth – 2.28.2012 12
Magnetic Tape Market
Primary option for disaster recovery
and archiving (1.6ZB of cloud storage in 2015)
20% of Tape petabytes will be consumed in the
Cloud by 2015
Sources TAM: SCCG, NPD, Gartner, Imation Global Market Research; Petabytes: IDC

Imation’s Strategic Transformation: Investing for Growth – 2.28.2012 13
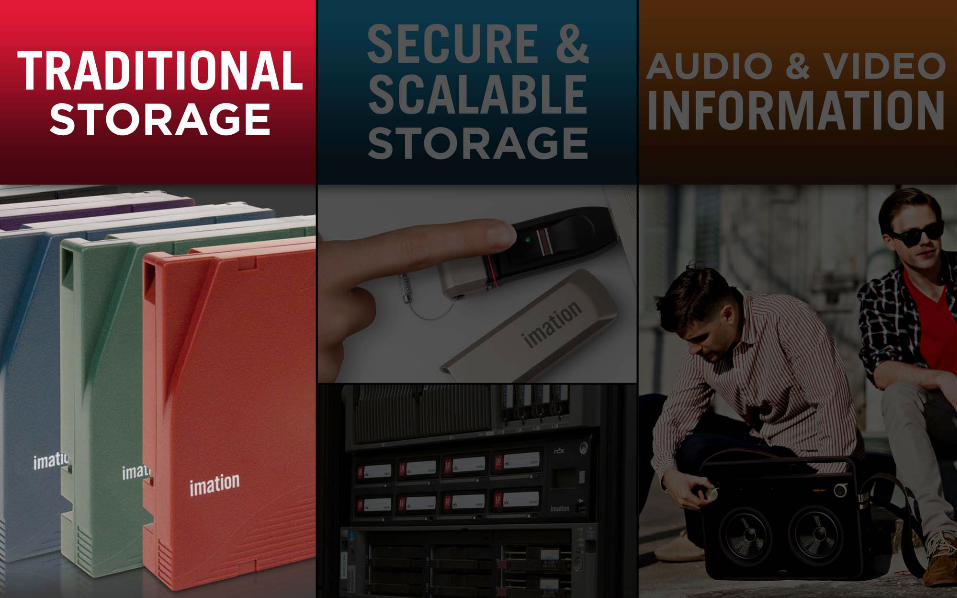
Traditional Storage Future State

SUMMARY:
• Solution offering with Secure & Scalable Storage
• New market intersections– Emerging markets– Cloud – Archive
• Future differentiation– Data security– BaFe– Time to market with
new formats


Imation’s Strategic Transformation: Investing for Growth – 2.28.2012 16
Secure & Scalable Storage Market
Sources TAM: SCCG, NPD, Gartner, Imation Global Market Research; Petabytes: IDC

Imation’s Strategic Transformation: Investing for Growth – 2.28.2012 17
PRICE*
Storage Market Landscape
Note: *Pricing based on weighted average SMB product line; Revenue capped at $750M for representational purposesSource: Company websites, Gartner, L.E.K. analysis
FEA
TUR
E SE
T

Imation’s Strategic Transformation: Investing for Growth – 2.28.2012 18
Secure & Scalable Future State

CONTINUED GROWTH in Revenue and Margin

2010/2011: MARKET
LEADERSHIP in Mobile Security

2012: UNIFIED Mobile Security
Solutions

Q2 11:
A8 First Imation Network Attached Storage Device

2012: DATAGUARD Data Protection Appliances
Q3 11: INFINIVAULT Data Archive Appliances (Global in Q2 12)

2012-2014: CONTINUED Organic and Inorganic Growth

Imation’s Strategic Transformation: Investing for Growth – 2.28.2012 25
2011: Acquisition of Nine Technology DEDUPLICATION ENGINE

Imation’s Strategic Transformation: Investing for Growth – 2.28.2012 26
Mid-Sized Enterprises100-999 employees
Small business10-99 employees
Tom GelsonBusiness Development Director
DEMO:SCALABLE STORAGE
SOLUTIONS

Imation’s Strategic Transformation: Investing for Growth – 2.28.2012 28
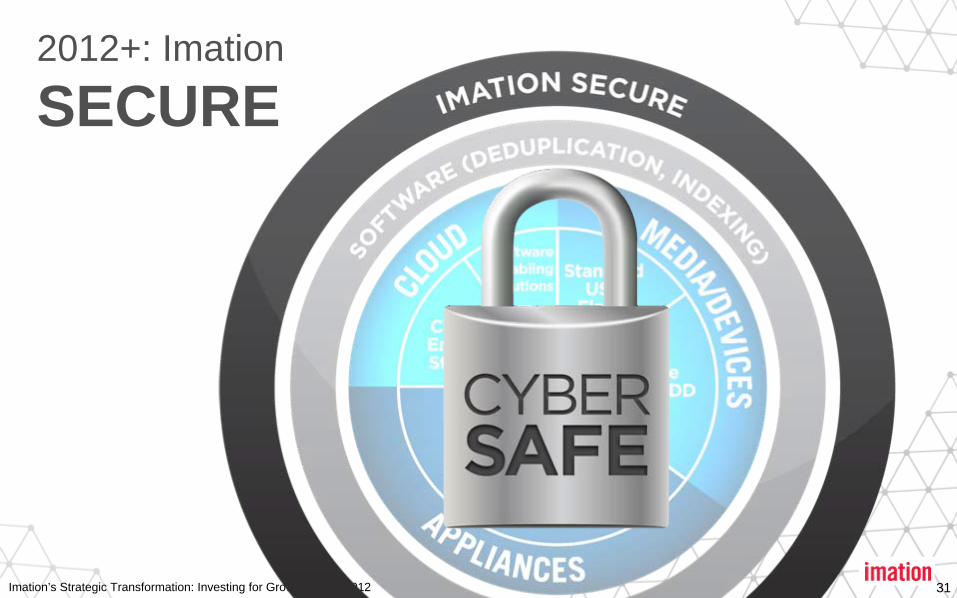
2012+: Imation
SECURE

Imation’s Strategic Transformation: Investing for Growth – 2.28.2012 29
Encryption
Identity and Access Management
Unified Security Policy Management
Imation Secure is an integrated and extensible security storage architecture that includes the following components:
The Imation Secure Promise:Ensures the safety, privacy and control of your digital content.
Key Management
Future Strategic Advantage: Imation Secure
Dave DuncanSoftware & Security Solutions Marketing Director
DEMO:SECURE SOLUTIONS
Imation’s Strategic Transformation: Investing for Growth – 2.28.2012 31
2012+: Imation
SECURE

SUMMARY:
• Integrated solutions– Media, PBBA, software
• Global availability– SMB– Channel-optimized
• Future differentiation– Robust IP portfolio– Data security integration– Deduplication with rapid
recovery engine

Imation’s Strategic Transformation: Investing for Growth – 2.28.2012 34
AVI Market
Sources: CEA, Planet Retail, Gartner, NPD (US), Imation Global Market Research
7 % CAGR for Personal
Audio
Content Everywhere
10% CAGR for Multi-
room Audio

Imation’s Strategic Transformation: Investing for Growth – 2.28.2012 35
The New User & IT Relationship

Imation’s Strategic Transformation: Investing for Growth – 2.28.2012 37
AVI Future State

Fall 2012: DIFFERENTIATED Audio Products
TDK Life on Record Universal Wireless Audio Products
Memorex Universal Speakers
TDK Life on Record Partnership for Headphones
XtremeMac Tango Air AirPlay Speaker
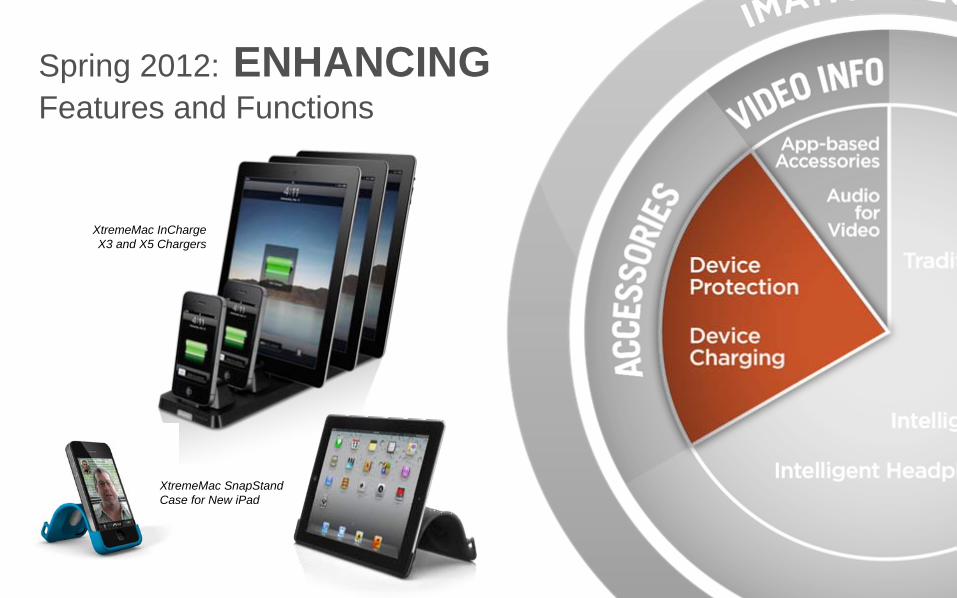
XtremeMac InCharge X3 and X5 Chargers
Spring 2012: ENHANCING Features and Functions
XtremeMac SnapStand Case for New iPad
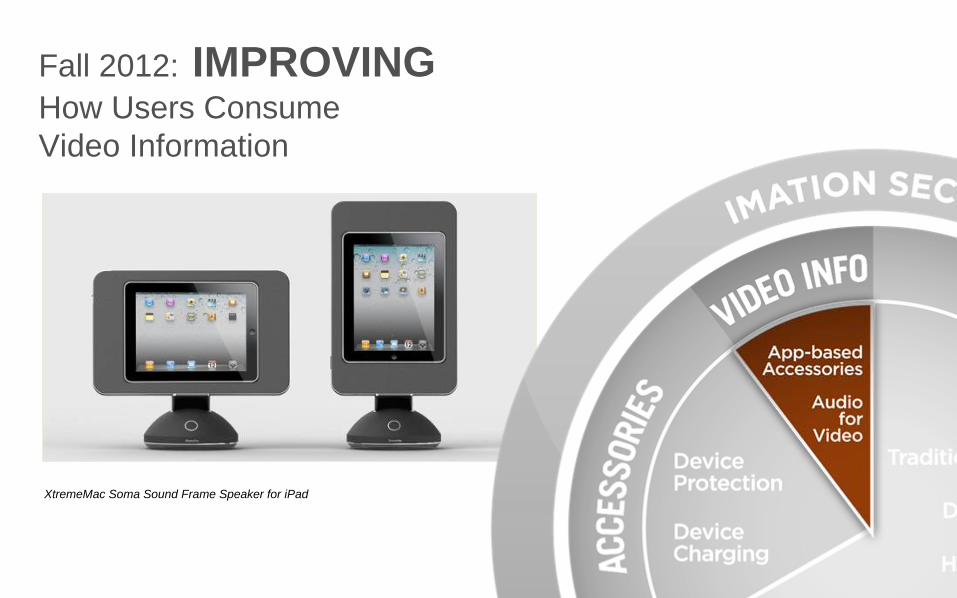
XtremeMac Soma Sound Frame Speaker for iPad
Fall 2012: IMPROVING How Users Consume Video Information

SUMMARY:
• Global availability • Regional expertise• Compelling brand value• Future differentiation
– Secure technology integration
– Audio quality– Next generation
movement of audio & video information

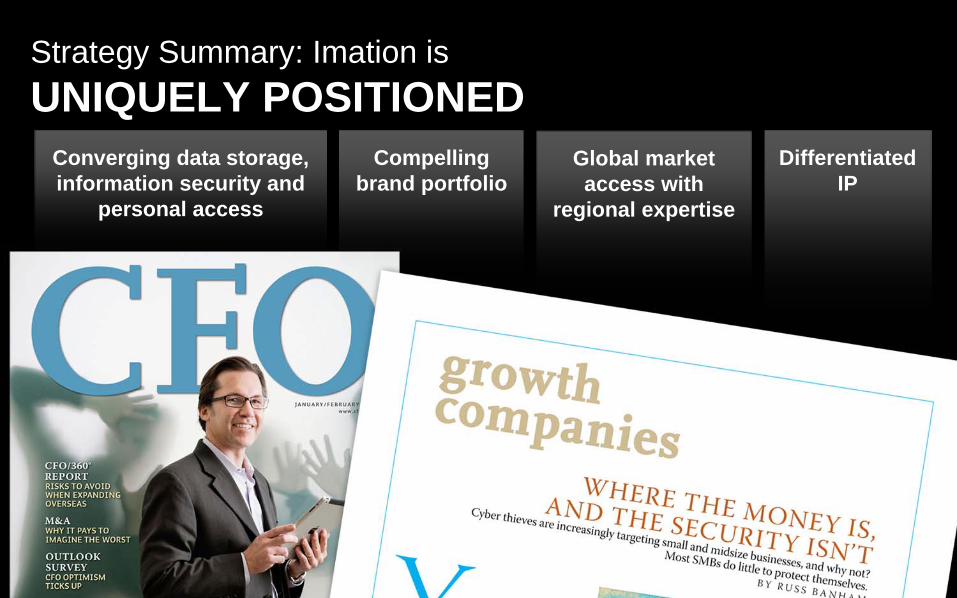
Strategy Summary: Imation isUNIQUELY POSITIONED
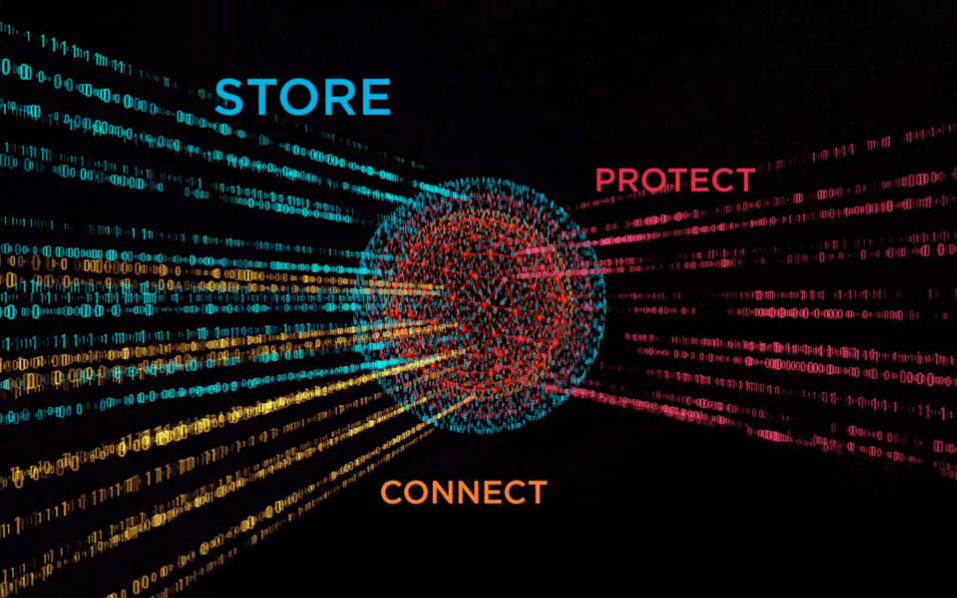
Converging data storage, information security and
personal access
Compelling brand portfolio
Global market access with
regional expertise
Differentiated IP

Transition AnimationSUBODH KULKARNI

Imation’s Strategic Transformation: Investing for Growth – 2.28.2012 45
Cloud
Infrastructure Virtualization
Server Access
Storage Technologies
TODAY FUTURE
Distributed Cloud
Application Virtualization
Mobile Access

Imation’s Strategic Transformation: Investing for Growth – 2.28.2012 46
Emerging Gap in Security & Storage Technologies
FUTURETODAY

Imation’s Strategic Transformation: Investing for Growth – 2.28.2012 47
STORAGE: Imation Technology Focus
2-stage global block deduplication
Removable HDD/SSD
Leverage external developments in HDD, SSD & Data Compression technologies
NETWORKED STORAGE DEVICES
Barium Ferrite pigment technology
MULTI-TERABYTE TAPE
Imation’s Strategic Transformation: Investing for Growth – 2.28.2012 48
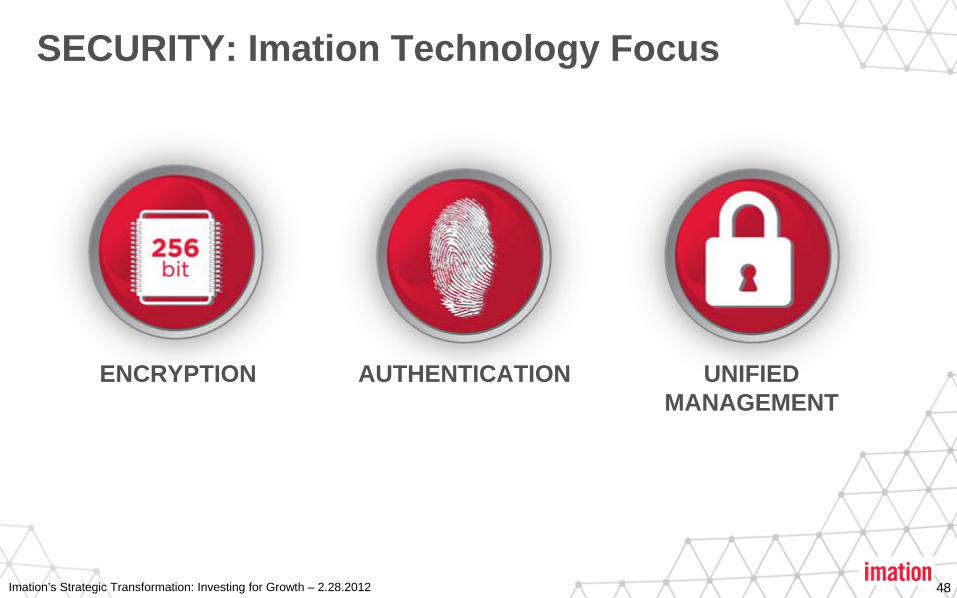
SECURITY: Imation Technology Focus
UNIFIED MANAGEMENT
ENCRYPTION AUTHENTICATION

Imation’s Strategic Transformation: Investing for Growth – 2.28.2012 49
Meeting the Future Needs of Security & Storage
Imation Technology Investments in Secure & Scalable Storage
FUTURETODAY

Imation’s Strategic Transformation: Investing for Growth – 2.28.2012 50
2012 CYBERSAFE PRODUCT EXAMPLES
Meeting the Future Needs of Security & Storage
Secure Digital Identity Token
in Q2Secure RDX
in Q3
Secure “PC on a Stick” for Windows 8
in Q4
Data Protection Appliances
in Q1 and Q3
Imation’s Strategic Transformation: Investing for Growth – 2.28.2012 51
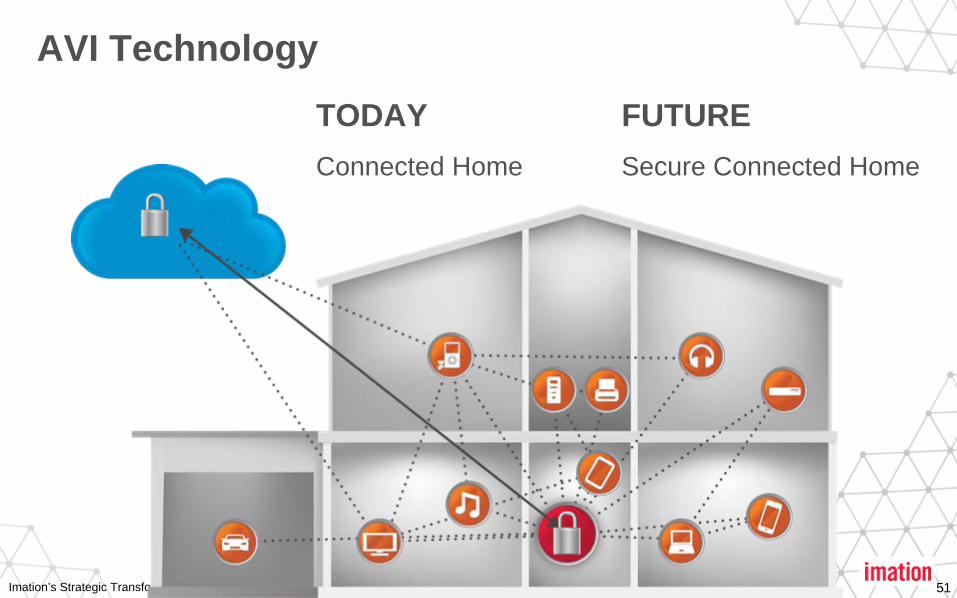
AVI Technology
TODAY Connected Home
FUTURESecure Connected Home

Imation’s Strategic Transformation: Investing for Growth – 2.28.2012 52
• Superior/Intelligent Audio• Wireless Audio (Bluetooth/AirPlay &
Cloud connectivity)• Wireless charging• Secure Unified Management
AVI: Imation Technology Focus 2012 PRODUCT EXAMPLES
Bluetooth High Quality Digital Audio in Q4
Smartphone Authenticated EHDD in Q4
iPad Frame Directional Speakers in Q4

Imation’s Strategic Transformation: Investing for Growth – 2.28.2012 53
Technology Summary
• We are investing and establishing a leading position in key technologies in Storage, Security & AVI, while leveraging external developments in HDD and SSD– Storage: Removable HDD/SSD, 2-stage block global deduplication
& Tape– Encryption, Authentication & Unified Management– AVI technologies: Superior/Intelligent Audio & Wireless
Audio/Charging
• We are launching several new products that are unique and have significant value added differentiation

Imation’s Strategic Transformation: Investing for Growth – 2.28.2012 55
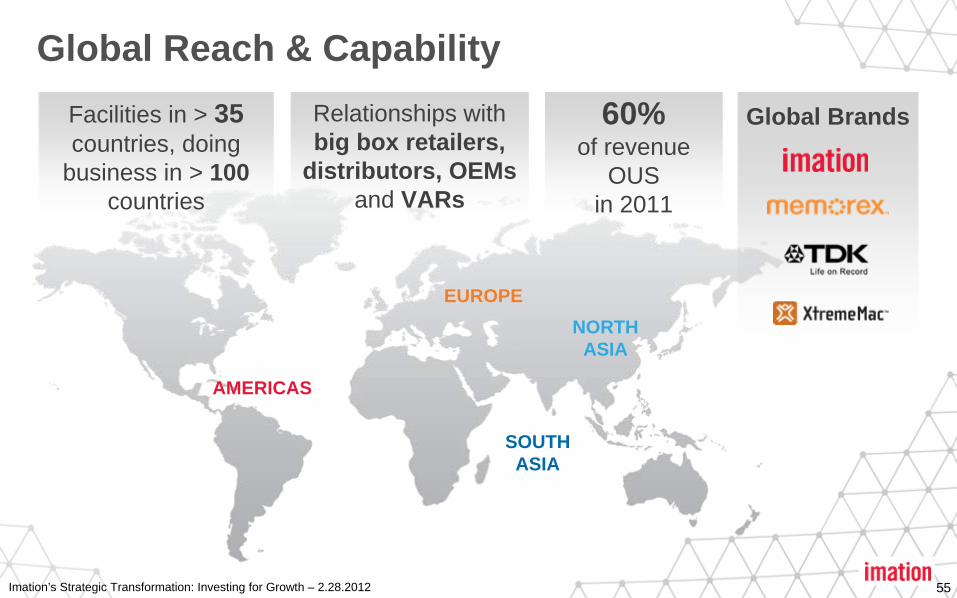
Relationships with big box retailers,
distributors, OEMs and VARs
Facilities in > 35 countries, doing
business in > 100 countries
Global Reach & Capability
AMERICAS
EUROPENORTH
ASIA
SOUTH ASIA
60% of revenue
OUS in 2011
Global Brands

Extensive VAR and Commercial Distributor Network
Strong OEM partnerships
Broad big box retail penetration
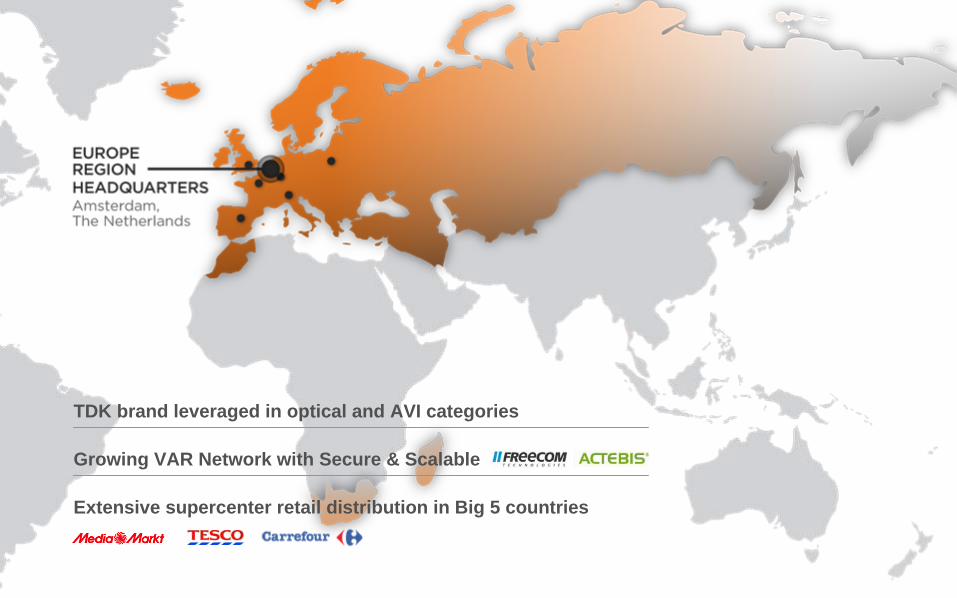
TDK brand leveraged in optical and AVI categories
Growing VAR Network with Secure & Scalable
Extensive supercenter retail distribution in Big 5 countries

Strong distribution presence in Middle East, Africa and Singapore
Broad retail network in Australia

Growing Commercial business with distribution, VAR and OEM partners
Growing China Commercial and Consumer business
Extensive retail presence in Japan with TDK brand

Imation’s Strategic Transformation: Investing for Growth – 2.28.2012 60
Working Capital ImprovementContinuous Operational Improvement
• Speed to market• Gross margin enhancement• Working capital optimization
PROJECTXCELL
Imation’s Strategic Transformation: Investing for Growth – 2.28.2012 61
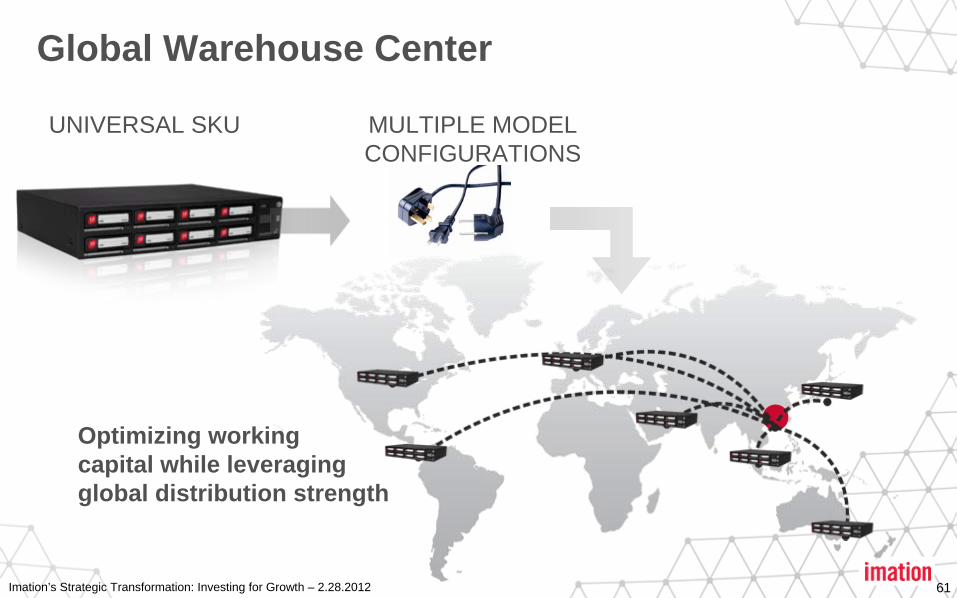
Global Warehouse Center
UNIVERSAL SKU MULTIPLE MODEL CONFIGURATIONS
Optimizing working capital while leveraging global distribution strength

Imation’s Strategic Transformation: Investing for Growth – 2.28.2012 62
Transforming our Global Workforce
• 26% Imation total workforce new in 2011• Dedicated Mobile Security Team of 91• 65% RD&E new in 2011• Solutions sales force
Imation’s Strategic Transformation: Investing for Growth – 2.28.2012 63
Global Summary
• Imation has broad global reach and capabilities:– Global footprint reaching more than 100 countries– Strong distribution network with big box retailers, distributors,
OEMs, and VARs– Operational excellence with a focus on working capital
optimization– A skilled workforce to help drive transformation


Imation’s Strategic Transformation: Investing for Growth – 2.28.2012 65
Overview
• A year ago, we set some longer term financial targets– Total company revenues targeted to return to growth as we exit 2012 and
enter 2013– Gross margins improve toward 20%– Targeting operating income profitability of 4% to 5% longer-term
• We remain firmly committed to these targets and have seen recent revenue and gross margin trends improving
• We see these trends continuing as we transform our business• Financially strong with solid underlying cash flow capacity to support
continued near term investments (organic & inorganic)– Focused primarily on Secure & Scalable storage
Imation’s Strategic Transformation: Investing for Growth – 2.28.2012 66
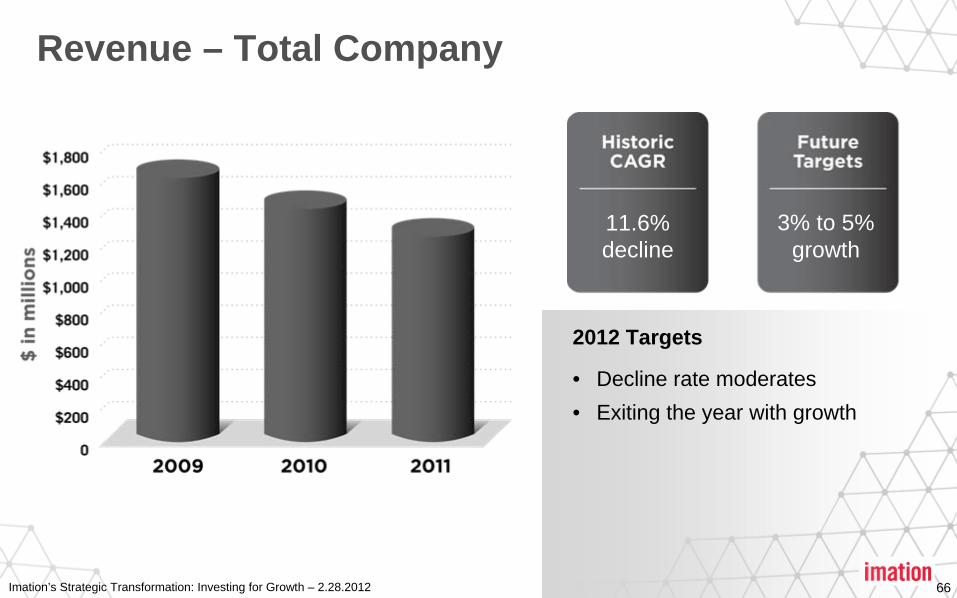
Revenue – Total Company
11.6% decline
3% to 5% growth
2012 Targets
• Decline rate moderates• Exiting the year with growth
Imation’s Strategic Transformation: Investing for Growth – 2.28.2012 67
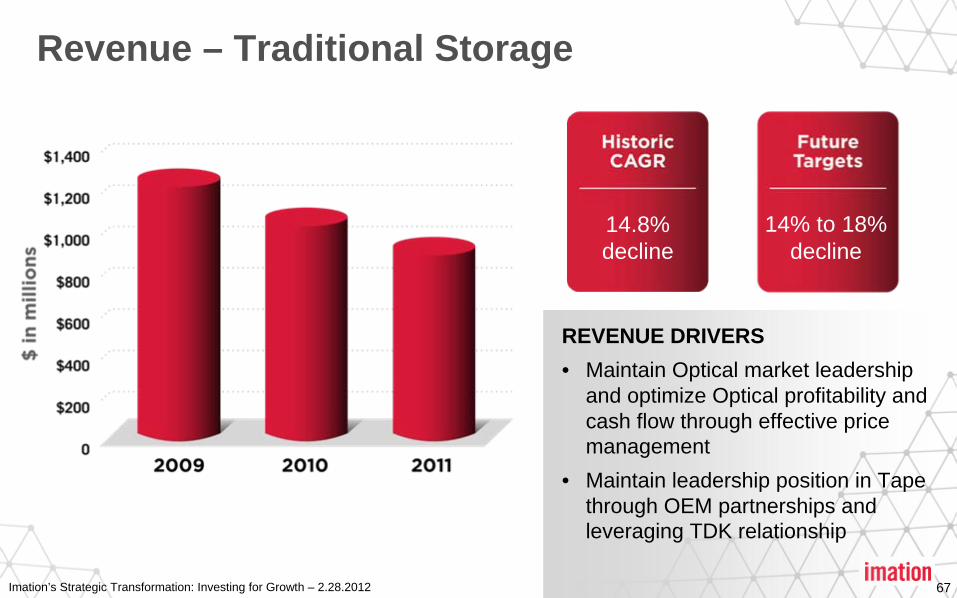
Revenue – Traditional Storage
REVENUE DRIVERS• Maintain Optical market leadership
and optimize Optical profitability and cash flow through effective price management
• Maintain leadership position in Tape through OEM partnerships and leveraging TDK relationship
14.8% decline
14% to 18% decline
Imation’s Strategic Transformation: Investing for Growth – 2.28.2012 68
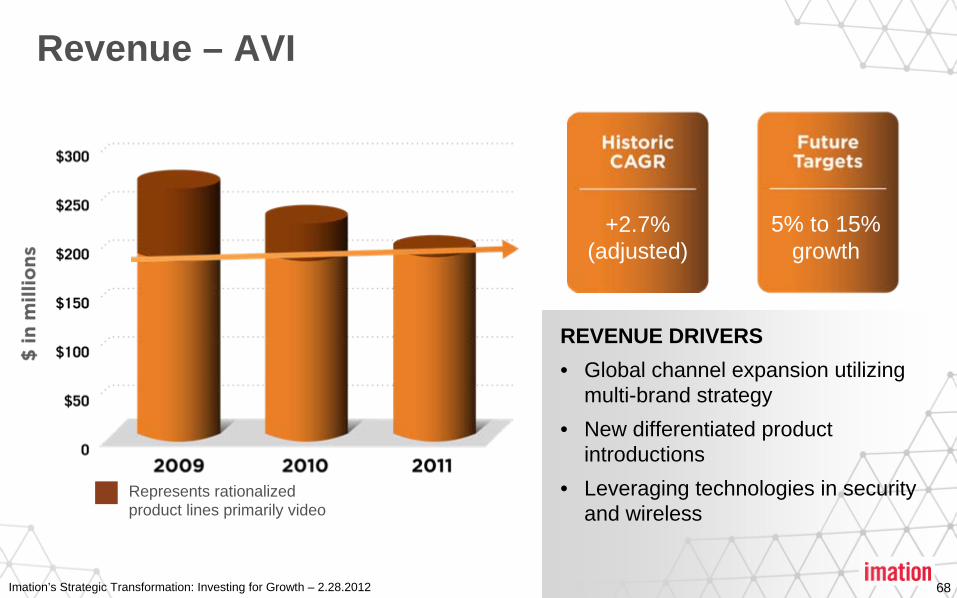
REVENUE DRIVERS• Global channel expansion utilizing
multi-brand strategy• New differentiated product
introductions • Leveraging technologies in security
and wireless
+2.7% (adjusted)
5% to 15% growth
Revenue – AVI
Represents rationalized product lines primarily video

Imation’s Strategic Transformation: Investing for Growth – 2.28.2012 69
+12.7%15% to 30%
growth
Revenue – Secure & Scalable Storage
REVENUE DRIVERS• Developing RDX market• Leveraging completed acquisitions
(Mobile Security and Scalable Storage)
• Investments in Scalable Storage platforms

Imation’s Strategic Transformation: Investing for Growth – 2.28.2012 70
Gross Margin
AVI
Traditional Storage
Secure & Scalable Storage
*Q4 11 AVI GM normalized for one-time excess inventory sellout
*
Total Company Stabilize
20%
20%+
20%+

Imation’s Strategic Transformation: Investing for Growth – 2.28.2012 71
Operating Expense Reflects Growth Investments2011 Organic Investment
2012 Organic Investment• Technology• Full year of acquisitions• Demand generation• Sales channel development• IT investment
Imation’s Strategic Transformation: Investing for Growth – 2.28.2012 72
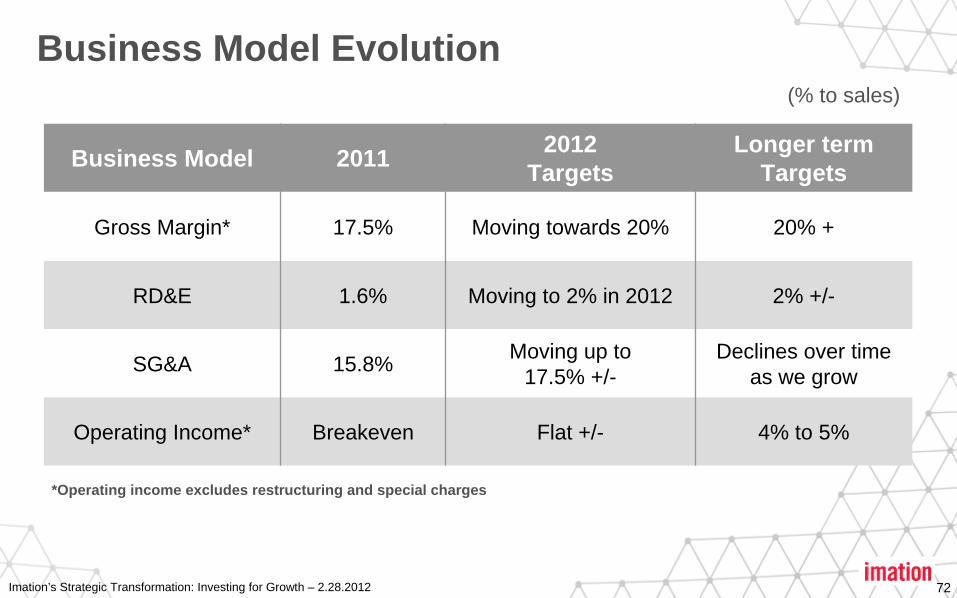
Business Model Evolution(% to sales)
Business Model 2011 2012 Targets
Longer term Targets
Gross Margin* 17.5% Moving towards 20% 20% +
RD&E 1.6% Moving to 2% in 2012 2% +/-
SG&A 15.8% Moving up to 17.5% +/-
Declines over time as we grow
Operating Income* Breakeven Flat +/- 4% to 5%
*Operating income excludes restructuring and special charges

Imation’s Strategic Transformation: Investing for Growth – 2.28.2012 73
2012 Cash Flow and Deployment
Underlying cash generation remains strongOperating• EBITDA*: Flat to up modestly vs. 2011 which was $37.8 million• Depreciation & amortization: $38 to $40 million (up due to acquisitions)• Working capital: Flat to down in near term• Litigation: Final $16 million Philips’ payment due in Q3• Restructuring: $5 to $10 millionInvesting• Capital spending: $10 million +/-• Acquisitions: Intend to be activeFinancing• Share buyback: 1.2 million authorization remains, focused on investing for
growth in the near term*EBITDA defined as operating income before restructuring and special charges and also before depreciation and amortization
Imation’s Strategic Transformation: Investing for Growth – 2.28.2012 74
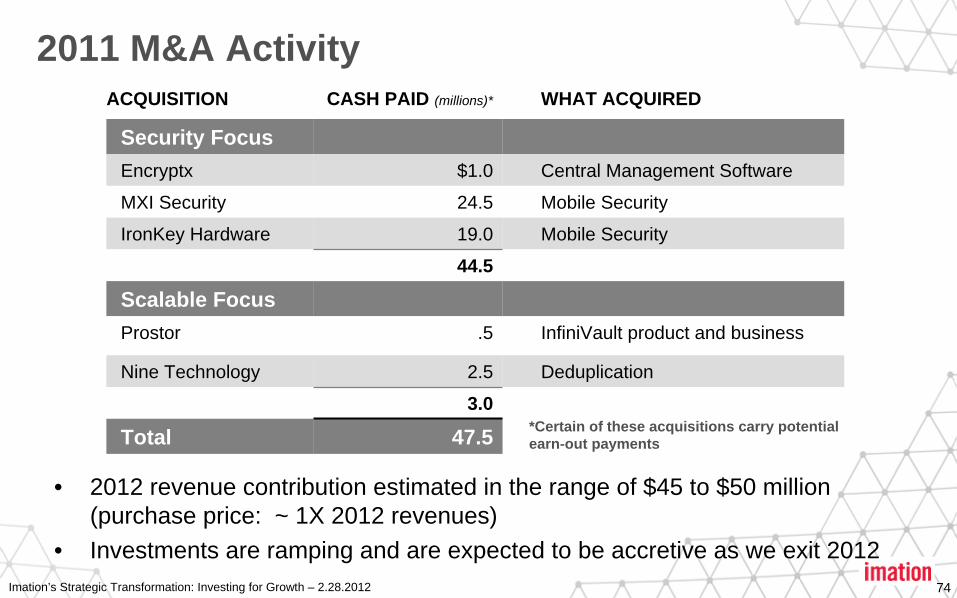
2011 M&A Activity
• 2012 revenue contribution estimated in the range of $45 to $50 million (purchase price: ~ 1X 2012 revenues)
• Investments are ramping and are expected to be accretive as we exit 2012
ACQUISITION CASH PAID (millions)* WHAT ACQUIRED
Security FocusEncryptx $1.0 Central Management Software
MXI Security 24.5 Mobile Security
IronKey Hardware 19.0 Mobile Security
44.5
Scalable FocusProstor .5 InfiniVault product and business
Nine Technology 2.5 Deduplication
3.0
Total 47.5 *Certain of these acquisitions carry potential earn-out payments

Imation’s Strategic Transformation: Investing for Growth – 2.28.2012 75
Go Forward M&A Activity
• Focus will be scalable storage• Expect we could do one to three acquisitions in 2012• Focused on growth categories with higher margin potential
where we bring unique leverage to opportunity• Total investment could be at or more than 2011 levels

Imation’s Strategic Transformation: Investing for Growth – 2.28.2012 76
Financial Summary
Imation is well positioned to execute on our strategy
• Cash of $223 million• No debt• Steadily improving margins• Global distribution channels already established• Significant prior brand investment• Majority of restructuring already completed• Strong cash flow generation


Imation’s Strategic Transformation: Investing for Growth – 2.28.2012 79
Financial Appendix

Imation’s Strategic Transformation: Investing for Growth – 2.28.2012 80
This presentation contains Non-GAAP financial measurements which are provided to assist in understanding the impact of certain items on Imation’s actual results of operations when compared with prior periods. Management believes this will assist investors in making an evaluation of Imation’s performance against prior periods on a comparable basis by adjusting for these items. Management understands that there are material limitations on the use of Non-GAAP measures. Non-GAAP measures are not substitutes for GAAP measures for the purpose of analyzing financial performance. These Non-GAAP measures are not in accordance with, or an alternative for measures prepared in accordance with, generally accepted accounting principles and may be different from Non-GAAP measures used by other companies. In addition, these Non-GAAP measures are not based on any comprehensive set of accounting rules or principles. This information should not be construed as an alternative to the reported results, which have been determined in accordance with accounting principles generally accepted in the United States of America.
Comparison of GAAP to Non-GAAP Financial Measures
Imation’s Strategic Transformation: Investing for Growth – 2.28.2012 81
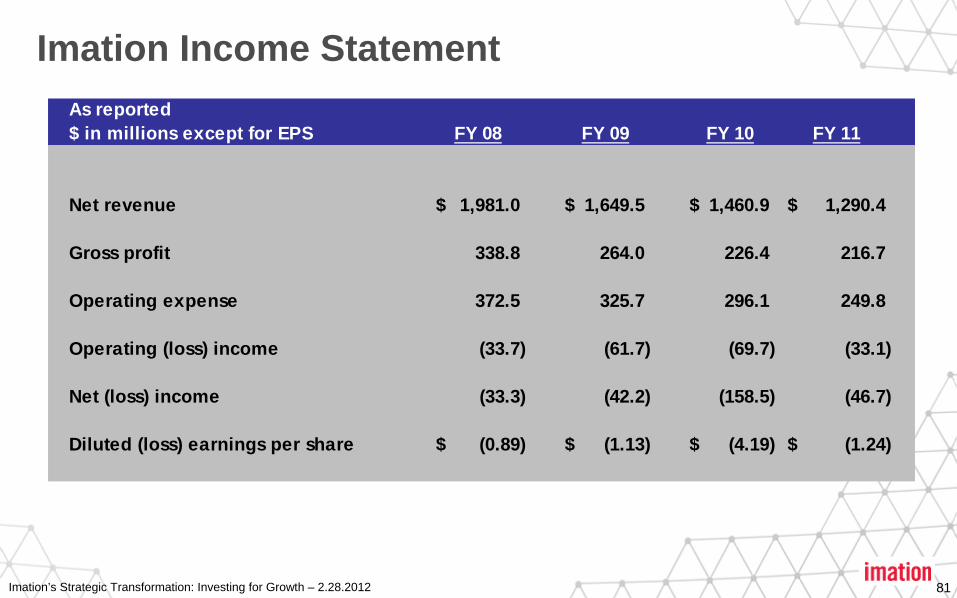
As reported$ in millions except for EPS FY 08 FY 09 FY 10 FY 11
Net revenue 1,981.0$ 1,649.5$ 1,460.9$ 1,290.4$
Gross profit 338.8 264.0 226.4 216.7
Operating expense 372.5 325.7 296.1 249.8
Operating (loss) income (33.7) (61.7) (69.7) (33.1)
Net (loss) income (33.3) (42.2) (158.5) (46.7)
Diluted (loss) earnings per share (0.89)$ (1.13)$ (4.19)$ (1.24)$
Imation Income Statement
Imation’s Strategic Transformation: Investing for Growth – 2.28.2012 82
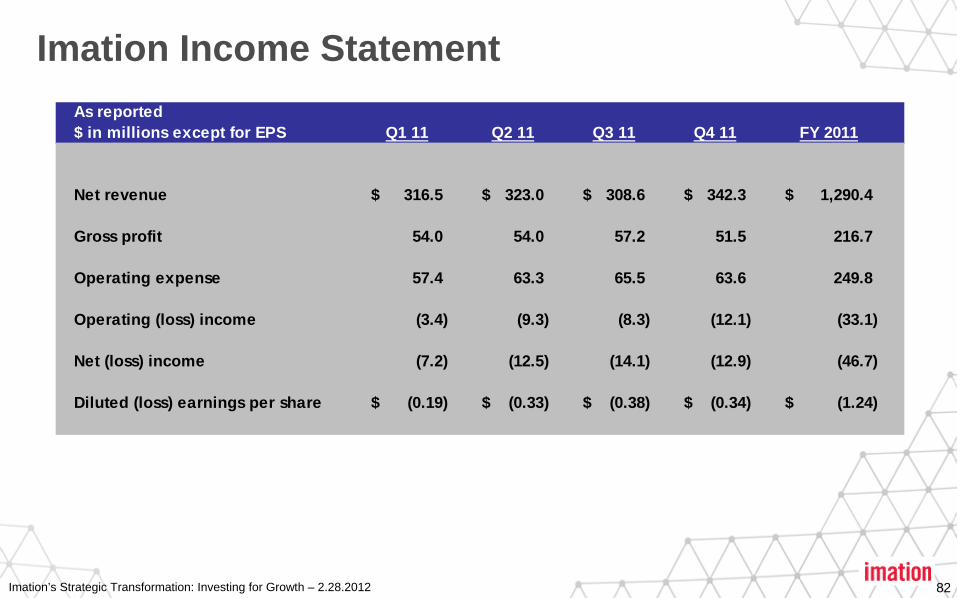
As reported$ in millions except for EPS Q1 11 Q2 11 Q3 11 Q4 11 FY 2011
Net revenue 316.5$ 323.0$ 308.6$ 342.3$ 1,290.4$
Gross profit 54.0 54.0 57.2 51.5 216.7
Operating expense 57.4 63.3 65.5 63.6 249.8
Operating (loss) income (3.4) (9.3) (8.3) (12.1) (33.1)
Net (loss) income (7.2) (12.5) (14.1) (12.9) (46.7)
Diluted (loss) earnings per share (0.19)$ (0.33)$ (0.38)$ (0.34)$ (1.24)$
Imation Income Statement
Imation’s Strategic Transformation: Investing for Growth – 2.28.2012 83
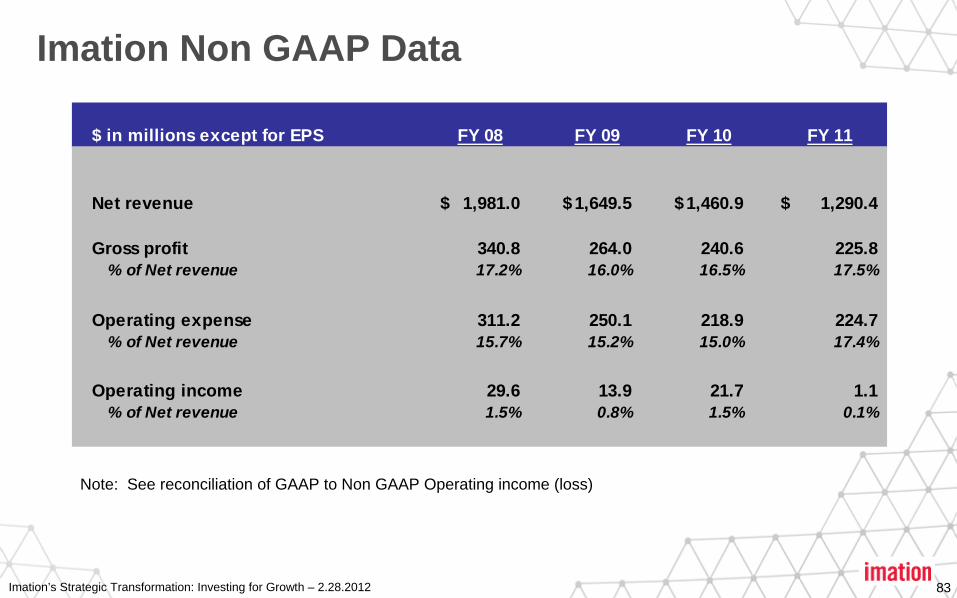
Note: See reconciliation of GAAP to Non GAAP Operating income (loss)
$ in millions except for EPS FY 08 FY 09 FY 10 FY 11
Net revenue 1,981.0$ 1,649.5$ 1,460.9$ 1,290.4$
Gross profit 340.8 264.0 240.6 225.8 % of Net revenue 17.2% 16.0% 16.5% 17.5%
Operating expense 311.2 250.1 218.9 224.7 % of Net revenue 15.7% 15.2% 15.0% 17.4%
Operating income 29.6 13.9 21.7 1.1 % of Net revenue 1.5% 0.8% 1.5% 0.1%
Imation Non GAAP Data

Imation’s Strategic Transformation: Investing for Growth – 2.28.2012 84
Note: See reconciliation of GAAP to Non GAAP Operating income (loss)
$ in thousands Q1 11 Q2 11 Q3 11 Q4 11 FY 2011
Net revenue 316.5$ 323.0$ 308.6$ 342.3$ 1,290.4$
Gross profit 55.2 54.3 57.2 59.1 225.8 % of Net revenue 17.4% 16.8% 18.5% 17.3% 17.5%
Operating expense 54.9 52.9 58.0 58.9 224.7 % of Net revenue 17.3% 16.4% 18.8% 17.2% 17.4%
Operating (loss) income 0.3 1.4 (0.8) 0.2 1.1 % of Net revenue 0.1% 0.4% -0.3% 0.1% 0.1%
Imation Non GAAP Data
Imation’s Strategic Transformation: Investing for Growth – 2.28.2012 85
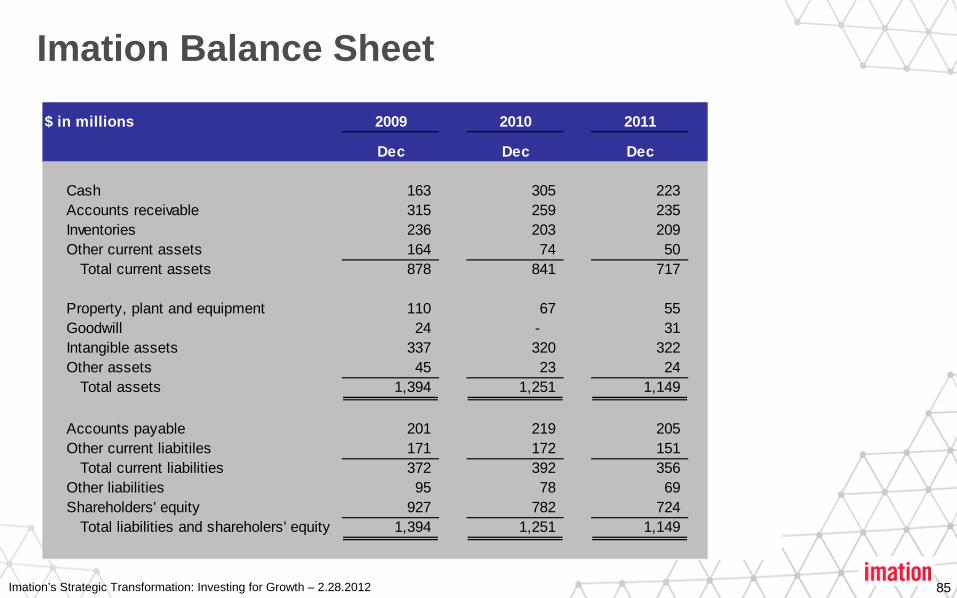
$ in millions 2009 2010 2011
Dec Dec Dec
Cash 163 305 223 Accounts receivable 315 259 235 Inventories 236 203 209 Other current assets 164 74 50
Total current assets 878 841 717
Property, plant and equipment 110 67 55 Goodwill 24 - 31 Intangible assets 337 320 322 Other assets 45 23 24
Total assets 1,394 1,251 1,149
Accounts payable 201 219 205 Other current liabitiles 171 172 151
Total current liabilities 372 392 356 Other liabilities 95 78 69 Shareholders' equity 927 782 724
Total liabilities and shareholers' equity 1,394 1,251 1,149
Imation Balance Sheet

Imation’s Strategic Transformation: Investing for Growth – 2.28.2012 86
Reconciliation of GAAP Operating Income (Loss) to Adjusted Non-GAAP Operating Income (Loss)
$ in millions FY 08 FY 09 FY 10 FY 11
As reported - GAAP (33.7)$ (61.7)$ (69.7)$ (33.1)$
Goodwill impairment 32.4 - 23.5 1.6
Inventory write-off included in COGS 2.0 - 14.2 9.1
Restructuring and other 28.9 26.6 51.1 21.5
Litigation settlement - 49.0 2.6 2.0
Adjusted - Non-GAAP 29.6$ 13.9$ 21.7$ 1.1$
Imation Operating Income
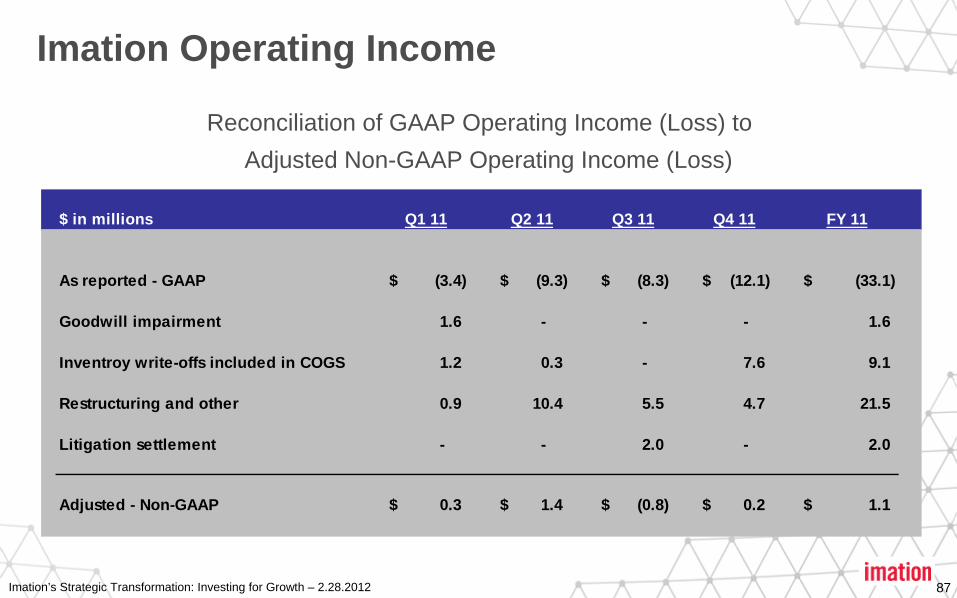
Imation’s Strategic Transformation: Investing for Growth – 2.28.2012 87
$ in millions Q1 11 Q2 11 Q3 11 Q4 11 FY 11
As reported - GAAP (3.4)$ (9.3)$ (8.3)$ (12.1)$ (33.1)$
Goodwill impairment 1.6 - - - 1.6
Inventroy write-offs included in COGS 1.2 0.3 - 7.6 9.1
Restructuring and other 0.9 10.4 5.5 4.7 21.5
Litigation settlement - - 2.0 - 2.0
Adjusted - Non-GAAP 0.3$ 1.4$ (0.8)$ 0.2$ 1.1$
Imation Operating Income
Reconciliation of GAAP Operating Income (Loss) to Adjusted Non-GAAP Operating Income (Loss)