Imaging translucent cell bodies in the living mouse retina ... · Imaging translucent cell bodies...
14
Imaging translucent cell bodies in the living mouse retina without contrast agents A. Guevara-Torres, 1,2,* D. R. Williams 1,2,3 and J. B. Schallek 1,3 1 Center for Visual Science, University of Rochester, Rochester, NY, 14627, USA 2 The Institute of Optics, University of Rochester, Rochester, NY, 14620, USA 3 Flaum Eye Institute, University of Rochester, Rochester, NY, 14642, USA *[email protected] Abstract: The transparency of most retinal cell classes typically precludes imaging them in the living eye; unless invasive methods are used that deploy extrinsic contrast agents. Using an adaptive optics scanning light ophthalmoscope (AOSLO) and capitalizing on the large numerical aperture of the mouse eye, we enhanced the contrast from otherwise transparent cells by subtracting the left from the right half of the light distribution in the detector plane. With this approach, it is possible to image the distal processes of photoreceptors, their more proximal cell bodies and the mosaic of horizontal cells in the living mouse retina. ©2015 Optical Society of America OCIS codes: (170.4460) Ophthalmic optics and devices; (330.4300) Vision system - noninvasive assessment; (110.1080) Active or adaptive optics; (330.7324) Visual optics, comparative animal models. References and links 1. D. R. Williams, “Imaging single cells in the living retina,” Vision Res. 51(13), 1379–1396 (2011). 2. D. C. Gray, W. Merigan, J. I. Wolfing, B. P. Gee, J. Porter, A. Dubra, T. H. Twietmeyer, K. Ahamd, R. Tumbar, F. Reinholz, and D. R. Williams, “In vivo fluorescence imaging of primate retinal ganglion cells and retinal pigment epithelial cells,” Opt. Express 14(16), 7144–7158 (2006). 3. H. R. Novotny and D. L. Alvis, “A method of photographing fluorescence in circulating blood in the human retina,” Circulation 24(1), 82–86 (1961). 4. M. Flocks, J. Miller, and P. Chao, “Retinal circulation time with the aid of fundus cinephotography,” Am. J. Ophthalmol. 48(1), 3–6 (1959). 5. L. Yin, Y. Geng, F. Osakada, R. Sharma, A. H. Cetin, E. M. Callaway, D. R. Williams, and W. H. Merigan, “Imaging light responses of retinal ganglion cells in the living mouse eye,” J. Neurophysiol. 109(9), 2415–2421 (2013). 6. L. Yin, K. Greenberg, J. J. Hunter, D. Dalkara, K. D. Kolstad, B. D. Masella, R. Wolfe, M. Visel, D. Stone, R. T. Libby, D. Diloreto, Jr., D. Schaffer, J. Flannery, D. R. Williams, and W. H. Merigan, “Intravitreal injection of AAV2 transduces macaque inner retina,” Invest. Ophthalmol. Vis. Sci. 52(5), 2775–2783 (2011). 7. J. Schallek, Y. Geng, H. Nguyen, and D. R. Williams, “Morphology and topography of retinal pericytes in the living mouse retina using in vivo adaptive optics imaging and ex vivo characterization,” Invest. Ophthalmol. Vis. Sci. 54(13), 8237–8250 (2013). 8. Y. Geng, A. Dubra, L. Yin, W. H. Merigan, R. Sharma, R. T. Libby, and D. R. Williams, “Adaptive optics retinal imaging in the living mouse eye,” Biomed. Opt. Express 3(4), 715–734 (2012). 9. A. Elsner, M. Miura, S. Burns, E. Beausencourt, C. Kunze, L. Kelley, J. Walker, G. Wing, P. Raskauskas, D. Fletcher, Q. Zhou, and A. Dreher, “Multiply scattered light tomography and confocal imaging: detecting neovascularization in age-related macular degeneration,” Opt. Express 7(2), 95–106 (2000). 10. T. Y. P. Chui, D. A. Vannasdale, and S. A. Burns, “The use of forward scatter to improve retinal vascular imaging with an adaptive optics scanning laser ophthalmoscope,” Biomed. Opt. Express 3(10), 2537–2549 (2012). 11. Y. N. Sulai, D. Scoles, Z. Harvey, and A. Dubra, “Visualization of retinal vascular structure and perfusion with a nonconfocal adaptive optics scanning light ophthalmoscope,” J. Opt. Soc. Am. A 31(3), 569–579 (2014). 12. D. H. Scoles, Y. N. Sulai, C. Langlo, G. A. Fishman, C. A. Curcio, J. Carroll, and A. Dubra, “In vivo imaging of human cone photoreceptor inner segments,” Invest. Ophthalmol. Vis. Sci. 55, 4244–4251 (2014). 13. Y. Geng, A. Dubra, L. Yin, W. H. Merigan, R. Sharma, R. T. Libby, and D. R. Williams, “Adaptive optics retinal imaging in the living mouse eye,” Biomed. Opt. Express 3(4), 715–734 (2012). 14. W. Smith, Modern Optical Engineering, 4th Ed., 4 edition (McGraw-Hill Professional, 2007). #235123 - $15.00 USD Received 25 Feb 2015; revised 5 May 2015; accepted 12 May 2015; published 18 May 2015 (C) 2015 OSA 1 Jun 2015 | Vol. 6, No. 6 | DOI:10.1364/BOE.6.002106 | BIOMEDICAL OPTICS EXPRESS 2106
Transcript of Imaging translucent cell bodies in the living mouse retina ... · Imaging translucent cell bodies...

Imaging translucent cell bodies in the living mouse retina without contrast agents
A. Guevara-Torres,1,2,* D. R. Williams1,2,3 and J. B. Schallek1,3 1Center for Visual Science, University of Rochester, Rochester, NY, 14627, USA
2The Institute of Optics, University of Rochester, Rochester, NY, 14620, USA 3Flaum Eye Institute, University of Rochester, Rochester, NY, 14642, USA
Abstract: The transparency of most retinal cell classes typically precludes imaging them in the living eye; unless invasive methods are used that deploy extrinsic contrast agents. Using an adaptive optics scanning light ophthalmoscope (AOSLO) and capitalizing on the large numerical aperture of the mouse eye, we enhanced the contrast from otherwise transparent cells by subtracting the left from the right half of the light distribution in the detector plane. With this approach, it is possible to image the distal processes of photoreceptors, their more proximal cell bodies and the mosaic of horizontal cells in the living mouse retina.
©2015 Optical Society of America
OCIS codes: (170.4460) Ophthalmic optics and devices; (330.4300) Vision system - noninvasive assessment; (110.1080) Active or adaptive optics; (330.7324) Visual optics, comparative animal models.
References and links
1. D. R. Williams, “Imaging single cells in the living retina,” Vision Res. 51(13), 1379–1396 (2011). 2. D. C. Gray, W. Merigan, J. I. Wolfing, B. P. Gee, J. Porter, A. Dubra, T. H. Twietmeyer, K. Ahamd, R. Tumbar,
F. Reinholz, and D. R. Williams, “In vivo fluorescence imaging of primate retinal ganglion cells and retinal pigment epithelial cells,” Opt. Express 14(16), 7144–7158 (2006).
3. H. R. Novotny and D. L. Alvis, “A method of photographing fluorescence in circulating blood in the human retina,” Circulation 24(1), 82–86 (1961).
4. M. Flocks, J. Miller, and P. Chao, “Retinal circulation time with the aid of fundus cinephotography,” Am. J. Ophthalmol. 48(1), 3–6 (1959).
5. L. Yin, Y. Geng, F. Osakada, R. Sharma, A. H. Cetin, E. M. Callaway, D. R. Williams, and W. H. Merigan, “Imaging light responses of retinal ganglion cells in the living mouse eye,” J. Neurophysiol. 109(9), 2415–2421 (2013).
6. L. Yin, K. Greenberg, J. J. Hunter, D. Dalkara, K. D. Kolstad, B. D. Masella, R. Wolfe, M. Visel, D. Stone, R. T. Libby, D. Diloreto, Jr., D. Schaffer, J. Flannery, D. R. Williams, and W. H. Merigan, “Intravitreal injection of AAV2 transduces macaque inner retina,” Invest. Ophthalmol. Vis. Sci. 52(5), 2775–2783 (2011).
7. J. Schallek, Y. Geng, H. Nguyen, and D. R. Williams, “Morphology and topography of retinal pericytes in the living mouse retina using in vivo adaptive optics imaging and ex vivo characterization,” Invest. Ophthalmol. Vis. Sci. 54(13), 8237–8250 (2013).
8. Y. Geng, A. Dubra, L. Yin, W. H. Merigan, R. Sharma, R. T. Libby, and D. R. Williams, “Adaptive optics retinal imaging in the living mouse eye,” Biomed. Opt. Express 3(4), 715–734 (2012).
9. A. Elsner, M. Miura, S. Burns, E. Beausencourt, C. Kunze, L. Kelley, J. Walker, G. Wing, P. Raskauskas, D. Fletcher, Q. Zhou, and A. Dreher, “Multiply scattered light tomography and confocal imaging: detecting neovascularization in age-related macular degeneration,” Opt. Express 7(2), 95–106 (2000).
10. T. Y. P. Chui, D. A. Vannasdale, and S. A. Burns, “The use of forward scatter to improve retinal vascular imaging with an adaptive optics scanning laser ophthalmoscope,” Biomed. Opt. Express 3(10), 2537–2549 (2012).
11. Y. N. Sulai, D. Scoles, Z. Harvey, and A. Dubra, “Visualization of retinal vascular structure and perfusion with a nonconfocal adaptive optics scanning light ophthalmoscope,” J. Opt. Soc. Am. A 31(3), 569–579 (2014).
12. D. H. Scoles, Y. N. Sulai, C. Langlo, G. A. Fishman, C. A. Curcio, J. Carroll, and A. Dubra, “In vivo imaging of human cone photoreceptor inner segments,” Invest. Ophthalmol. Vis. Sci. 55, 4244–4251 (2014).
13. Y. Geng, A. Dubra, L. Yin, W. H. Merigan, R. Sharma, R. T. Libby, and D. R. Williams, “Adaptive optics retinal imaging in the living mouse eye,” Biomed. Opt. Express 3(4), 715–734 (2012).
14. W. Smith, Modern Optical Engineering, 4th Ed., 4 edition (McGraw-Hill Professional, 2007).
#235123 - $15.00 USD Received 25 Feb 2015; revised 5 May 2015; accepted 12 May 2015; published 18 May 2015 (C) 2015 OSA 1 Jun 2015 | Vol. 6, No. 6 | DOI:10.1364/BOE.6.002106 | BIOMEDICAL OPTICS EXPRESS 2106

15. A. Roorda, F. Romero-Borja, W. Donnelly III, H. Queener, T. Hebert, and M. Campbell, “Adaptive optics scanning laser ophthalmoscopy,” Opt. Express 10(9), 405–412 (2002).
16. A. Dubra, Y. Sulai, J. L. Norris, R. F. Cooper, A. M. Dubis, D. R. Williams, and J. Carroll, “Noninvasive imaging of the human rod photoreceptor mosaic using a confocal adaptive optics scanning ophthalmoscope,” Biomed. Opt. Express 2(7), 1864–1876 (2011).
17. A. Dubra, Z. Harvey, B. Fischer, B. M. Dawant, and C. Lorenz, “Registration of 2D Images from Fast Scanning Ophthalmic Instruments,” in Biomedical Image Registration, Lecture Notes in Computer Science No. 6204 (Springer Berlin Heidelberg, 1), pp. 60–71.
18. C. Schmucker and F. Schaeffel, “A paraxial schematic eye model for the growing C57BL/6 mouse,” Vision Res. 44(16), 1857–1867 (2004).
19. Y. Geng, L. A. Schery, R. Sharma, A. Dubra, K. Ahmad, R. T. Libby, and D. R. Williams, “Optical properties of the mouse eye,” Biomed. Opt. Express 2(4), 717–738 (2011).
20. J. I. Yellott, Jr., “Spectral consequences of photoreceptor sampling in the rhesus retina,” Science 221(4608), 382–385 (1983).
21. D. R. Williams and N. J. Coletta, “Cone spacing and the visual resolution limit,” J. Opt. Soc. Am. A 4(8), 1514–1523 (1987).
22. R. F. Cooper, C. S. Langlo, A. Dubra, and J. Carroll, “Automatic detection of modal spacing (Yellott’s ring) in adaptive optics scanning light ophthalmoscope images,” Ophthalmic Physiol. Opt. 33(4), 540–549 (2013).
23. C.-J. Jeon, E. Strettoi, and R. H. Masland, “The major cell populations of the mouse retina,” J. Neurosci. 18(21), 8936–8946 (1998).
24. L. D. Carter-Dawson and M. M. LaVail, “Rods and cones in the mouse retina. I. Structural analysis using light and electron microscopy,” J. Comp. Neurol. 188(2), 245–262 (1979).
25. R. A. Cuthbertson and T. E. Mandel, “Anatomy of the mouse retina. Endothelial cell-pericyte ratio and capillary distribution,” Invest. Ophthalmol. Vis. Sci. 27(11), 1659–1664 (1986).
26. M. I. Dorrell, E. Aguilar, and M. Friedlander, “Retinal vascular development is mediated by endothelial filopodia, a preexisting astrocytic template and specific R-cadherin adhesion,” Invest. Ophthalmol. Vis. Sci. 43(11), 3500–3510 (2002).
27. M. Paques, R. Tadayoni, R. Sercombe, P. Laurent, O. Genevois, A. Gaudric, and E. Vicaut, “Structural and hemodynamic analysis of the mouse retinal microcirculation,” Invest. Ophthalmol. Vis. Sci. 44(11), 4960–4967 (2003).
28. S. Wang, M. P. Villegas-Pérez, M. Vidal-Sanz, and R. D. Lund, “Progressive Optic Axon Dystrophy and Vascular Changes in rd Mice,” Invest. Ophthalmol. Vis. Sci. 41, 537–545 (2000).
29. S. Haverkamp and H. Wässle, “Immunocytochemical analysis of the mouse retina,” J. Comp. Neurol. 424(1), 1–23 (2000).
30. M. A. Raven and B. E. Reese, “Horizontal cell density and mosaic regularity in pigmented and albino mouse retina,” J. Comp. Neurol. 454(2), 168–176 (2002).
31. W. Liu, J.-H. Wang, and M. Xiang, “Specific expression of the LIM/homeodomain protein Lim-1 in horizontal cells during retinogenesis,” Dev. Dyn. 217(3), 320–325 (2000).
32. R. W. Williams, R. C. Strom, G. Zhou, and Z. Yan, “Genetic dissection of retinal development,” Semin. Cell Dev. Biol. 9(3), 249–255 (1998).
33. J. Shelley, K. Dedek, T. Schubert, A. Feigenspan, K. Schultz, S. Hombach, K. Willecke, and R. Weiler, “Horizontal cell receptive fields are reduced in connexin57-deficient mice,” Eur. J. Neurosci. 23(12), 3176–3186 (2006).
34. J. Liang, D. R. Williams, and D. T. Miller, “Supernormal vision and high-resolution retinal imaging through adaptive optics,” J. Opt. Soc. Am. A 14(11), 2884–2892 (1997).
35. A. Roorda and D. R. Williams, “The arrangement of the three cone classes in the living human eye,” Nature 397(6719), 520–522 (1999).
36. R. S. Jonnal, J. R. Besecker, J. C. Derby, O. P. Kocaoglu, B. Cense, W. Gao, Q. Wang, and D. T. Miller, “Imaging outer segment renewal in living human cone photoreceptors,” Opt. Express 18(5), 5257–5270 (2010).
37. C. A. Curcio, K. R. Sloan, R. E. Kalina, and A. E. Hendrickson, “Human photoreceptor topography,” J. Comp. Neurol. 292(4), 497–523 (1990).
38. J. Liang, D. R. Williams, and D. T. Miller, “Supernormal vision and high-resolution retinal imaging through adaptive optics,” J. Opt. Soc. Am. A 14(11), 2884–2892 (1997).
39. Y. Lee, S. Kameya, G. A. Cox, J. Hsu, W. Hicks, T. P. Maddatu, R. S. Smith, J. K. Naggert, N. S. Peachey, and P. M. Nishina, “Ocular abnormalities in Large(myd) and Large(vls) mice, spontaneous models for muscle, eye, and brain diseases,” Mol. Cell. Neurosci. 30(2), 160–172 (2005).
40. J. J. Pang, X. Dai, S. E. Boye, I. Barone, S. L. Boye, S. Mao, D. Everhart, A. Dinculescu, L. Liu, Y. Umino, B. Lei, B. Chang, R. Barlow, E. Strettoi, and W. W. Hauswirth, “Long-term retinal function and structure rescue using capsid mutant AAV8 vector in the rd10 mouse, a model of recessive retinitis pigmentosa,” Mol. Ther. 19(2), 234–242 (2011).
41. A. I. Cohen, “Some cytological and initial biochemical observations on photoreceptors in retinas of rds mice,” Invest. Ophthalmol. Vis. Sci. 24(7), 832–843 (1983).
42. S. Rösch, S. Johnen, F. Müller, C. Pfarrer, and P. Walter, “Correlations between ERG, OCT, and Anatomical Findings in the rd10 Mouse,” J. Ophthalmol. 2014, 874751 (2014).
#235123 - $15.00 USD Received 25 Feb 2015; revised 5 May 2015; accepted 12 May 2015; published 18 May 2015 (C) 2015 OSA 1 Jun 2015 | Vol. 6, No. 6 | DOI:10.1364/BOE.6.002106 | BIOMEDICAL OPTICS EXPRESS 2107

43. J. Gao, K. Cheon, S. Nusinowitz, Q. Liu, D. Bei, K. Atkins, A. Azimi, S. P. Daiger, D. B. Farber, J. R. Heckenlively, E. A. Pierce, L. S. Sullivan, and J. Zuo, “Progressive photoreceptor degeneration, outer segment dysplasia, and rhodopsin mislocalization in mice with targeted disruption of the retinitis pigmentosa-1 (Rp1) gene,” Proc. Natl. Acad. Sci. U.S.A. 99(8), 5698–5703 (2002).
44. J. Lem, N. V. Krasnoperova, P. D. Calvert, B. Kosaras, D. A. Cameron, M. Nicolò, C. L. Makino, and R. L. Sidman, “Morphological, physiological, and biochemical changes in rhodopsin knockout mice,” Proc. Natl. Acad. Sci. U.S.A. 96(2), 736–741 (1999).
45. N. McNally, P. Kenna, M. M. Humphries, A. H. Hobson, N. W. Khan, R. A. Bush, P. A. Sieving, P. Humphries, and G. J. Farrar, “Structural and functional rescue of murine rod photoreceptors by human rhodopsin transgene,” Hum. Mol. Genet. 8(7), 1309–1312 (1999).
46. H. Wässle, L. Peichl, M. S. Airaksinen, and M. Meyer, “Calcium-binding proteins in the retina of a calbindin-null mutant mouse,” Cell Tissue Res. 292(2), 211–218 (1998).
47. L. Peichl and J. González-Soriano, “Morphological types of horizontal cell in rodent retinae: a comparison of rat, mouse, gerbil, and guinea pig,” Vis. Neurosci. 11(3), 501–517 (1994).
48. K. Grieve and A. Roorda, “Intrinsic signals from human cone photoreceptors,” Invest. Ophthalmol. Vis. Sci. 49(2), 713–719 (2008).
49. J. Schallek, R. Kardon, Y. Kwon, M. Abramoff, P. Soliz, and D. Ts’o, “Stimulus-evoked intrinsic optical signals in the retina: pharmacologic dissection reveals outer retinal origins,” Invest. Ophthalmol. Vis. Sci. 50(10), 4873–4880 (2009).
50. J. Schallek, H. Li, R. Kardon, Y. Kwon, M. Abramoff, P. Soliz, and D. Ts’o, “Stimulus-evoked intrinsic optical signals in the retina: spatial and temporal characteristics,” Invest. Ophthalmol. Vis. Sci. 50(10), 4865–4872 (2009).
51. D. Ts’o, J. Schallek, Y. Kwon, R. Kardon, M. Abramoff, and P. Soliz, “Noninvasive functional imaging of the retina reveals outer retinal and hemodynamic intrinsic optical signal origins,” Jpn. J. Ophthalmol. 53(4), 334–344 (2009).
52. C. Gargini, E. Terzibasi, F. Mazzoni, and E. Strettoi, “Retinal organization in the retinal degeneration 10 (rd10) mutant mouse: a morphological and ERG study,” J. Comp. Neurol. 500(2), 222–238 (2007).
53. S. B. Mehta and C. J. R. Sheppard, “Quantitative phase-gradient imaging at high resolution with asymmetric illumination-based differential phase contrast,” Opt. Lett. 34(13), 1924–1926 (2009).
54. W. C. Stewart, “On differential phase contrast with an extended illumination source,” J. Opt. Soc. Am. 66(8), 813–818 (1976).
55. A. B. Parthasarathy, K. K. Chu, T. N. Ford, and J. Mertz, “Quantitative phase imaging using a partitioned detection aperture,” Opt. Lett. 37(19), 4062–4064 (2012).
56. W. B. Amos, S. Reichelt, D. M. Cattermole, and J. Laufer, “Re-evaluation of differential phase contrast (DPC) in a scanning laser microscope using a split detector as an alternative to differential interference contrast (DIC) optics,” J. Microsc. 210(2), 166–175 (2003).
57. T. N. Ford, K. K. Chu, and J. Mertz, “Phase-gradient microscopy in thick tissue with oblique back-illumination,” Nat. Methods 9(12), 1195–1197 (2012).
58. T. Wilson and D. K. Hamilton, “Differential amplitude contrast imaging in the scanning optical microscope,” Appl. Phys. B 32(4), 187–191 (1983).
1. Introduction
In the mammalian retina, photons travel relatively unscathed through multiple transparent layers of retina before they are detected by photoreceptors. While this design is beneficial for vision, the transparency of the retina poses a major hurdle for microscopic imaging of retinal cells in the living eye. Despite the advances in resolution afforded by adaptive optics [1], the majority of cell classes in the retina remain invisible due to the lack of optical contrast. In some cases, the contrast provided by exogenous fluorophores can mitigate this problem. Such fluorophores can be delivered by injection of fluorescent tracers [2–4], retrograde labeling through injections in the brain, viral vector targeting [5,6] and use of transgenic animals with fluorescent proteins [7,8]. However, with the exception of vascular tracers such as sodium fluorescein and indocyanine green (ICG), the utility of this approach cannot be used in the human eye and is currently limited to animal models. Another option is to rely on intrinsic fluorophores. This approach has been successful in imaging retinal pigment epithelial cells in the human eye with single photon fluorescence of lipofuscin, but the scarcity of endogenous fluorophores and generally low quantum yield limits the value of this approach. As such, two-photon imaging can also harness cellular fluorescence in the living eye, but the light levels required are not yet safe for human use.
Here we demonstrate an approach to image transparent retinal cells without relying on fluorescence contrast. Our approach builds on earlier work from Elsner et al. [9] who showed
#235123 - $15.00 USD Received 25 Feb 2015; revised 5 May 2015; accepted 12 May 2015; published 18 May 2015 (C) 2015 OSA 1 Jun 2015 | Vol. 6, No. 6 | DOI:10.1364/BOE.6.002106 | BIOMEDICAL OPTICS EXPRESS 2108

that the contrast of features obtained with a scanning laser ophthalmoscope could be enhanced by offsetting the confocal detection aperture, Chui and colleagues [10] incorporated this principle in an adaptive optics scanning laser ophthalmoscope (AOSLO) observing increased contrast at the blood vessel wall, and flowing blood cells within the vascular network. Sulai and colleagues [11] improved this method by blocking the center of the light distribution in the detector plane and capturing the remaining light to the left of the center in one detector, and the light to the right of center in another. By differencing the images from the two detectors, they were able to digitally remove light common to the two images, further increasing contrast in the final image. This method, which they call split detector, provides a novel view of photoreceptors in which the light waveguided by the cell is largely rejected, allowing the boundary of the photoreceptor inner segments to be more clearly imaged [12]. In the current study, we used a variant of the split detector approach, capitalizing on the exceptional optical characteristics of the mouse eye to image highly-transparent cells. The mouse eye with a fully dilated pupil has a numerical aperture of 0.49, which is twice the numerical aperture of the human eye and therefore, if aberrations are corrected with adaptive optics, will have twice the lateral resolution [13]. The axial resolution in micrometers is inversely proportional to the square of the numerical aperture [14], so that the depth of focus in the mouse eye could be especially favorable for distinguishing layers of individual cells [8]. In this study, we demonstrate that a variety of otherwise transparent retinal cells and cell structures in the neural retina can be imaged without the use of exogenous contrast agents. This new approach extends the range of cells that may be characterized, counted and evaluated in conditions of health and over the course of retinal disease in the living eye.
2. Methods
2.1 Animal preparation
C57BL/6J mice were anesthetized with an intraperitoneal injection of ketamine/xylazine (100mg/kg ketamine, 10mg/kg xylazine). Anesthesia was maintained with 1-2% isoflurane throughout the experiment. Pupils were dilated using a topical drop of 1% tropicamide and 2% phenylephrine. To maintain hydration and mitigate tear-film breakdown, the cornea was covered with a polymethyl methacrylate (PMMA) 1.6mm base curve contact lens (Advanced Vision Technologies, Lakewood, Colorado). The mouse was positioned in a stereotactic stage with bite bar. Position of the animal was controlled with an XYZ translational stage that allowed alignment of the eye's pupil with the AOSLO imaging beam.
2.2 AOSLO instrumentation
The Rochester mouse AOSLO has been described previously [8]. It is composed of five, 4f telescope pairs that successively relay the eye’s pupil into the horizontal, vertical scanners and the deformable mirror (Fig. 1). 796 nm light from a superluminiscent diode (200 μW) (Superlum, Carrigtwohill, Ireland) is used as an imaging light source. The system uses an 843 nm laser from QPhotonics (2-10 μW) (Ann Arbor, Michigan) that is detected by a Hartmann-Shack wavefront sensor. Aberration correction and defocus control was performed by a deformable mirror (ALPAO, Montbonnot-Saint-Martin, France).
The detection arm of the confocal AOSLO [8] is composed of a collimating lens that focuses light into a pinhole, through which light is detected by a photomultiplier tube (PMT, Hamamtsu H7422-50). At the pinhole location, the theoretical Airy disc diameter is 23.3μm for this optical setup. In the current study, the detection arm was modified by removing the confocal pinhole and instead placing a silver coated knife edge prism (THORLABS, Newton, New Jersey) at the imaging plane of best focus. At this plane, the retinal point-spread function is diverted into two PMTs by positioning the knife-edge at the point of maximum intensity (Fig. 1(B), 1(C)). The edge was oriented vertically and thus diverted the right and left half of the light distribution at the image focal plane into two PMTs. The light in the two PMTs was
#235123 - $15.00 USD Received 25 Feb 2015; revised 5 May 2015; accepted 12 May 2015; published 18 May 2015 (C) 2015 OSA 1 Jun 2015 | Vol. 6, No. 6 | DOI:10.1364/BOE.6.002106 | BIOMEDICAL OPTICS EXPRESS 2109

balanced by equalizing light detected in each channel by micropositioning the knife-edge to the optimum lateral position. Assuming negligible light loss from the prism surface, this position corresponds to the center of the retinal point-spread function. The design is similar to that reported by Scoles and colleagues with the exception that light within the central portion of the retinal point spread function is not rejected [12]. It also does not require reimaging optics for the purpose of collecting the confocal light in a separate channel.
2.3 Video data collection and differential imaging
Image raster scanning was provided by a fast scanner operated in the horizontal direction at a rate of 15.4 kHz and a vertical scanner at a rate of 25 Hz. Data was collected at a 25 Hz frame rate in two PMT channels with phase-locked, simultaneous acquisition. Data was digitized with a Matrox Odyssey data acquisition board (Matrox International Corporation, Quebec, Canada). Raw 8-bit data was stored to a computer hard drive for offline analysis. Data from left and right PMT was digitally subtracted (PMT2-PMT1) to produce a difference image, which revealed the non-common information between the two channels.
Fig. 1. Diagram of the split-detector AOSLO. (A) AOSLO system was adapted from the original confocal design [8]. (B) The detection arm of the AOSLO shows the location of the knife edge prism at the retinal focus plane of the imaging system and the location of two photo multiplier tubes (PMTs). (C) The 2D retinal point-spread function at the imaging plane is diverted by the knife edge into two PMTs. Each channel is individually captured and the difference between the two channels is digitally calculated. WFS: wavefront sensor. DM: deformable mirror.
2.4 Image desinusoiding and registration
The sinusoidal distortion generated by the sinusoidal movement of the fast scanner was measured using a Ronchi ruling and then corrected by resampling the image over equally spaced points [15,16]. Though eye motion is greatly reduced by anesthetizing the mouse, the captured video sequence contains residual movement related to cardiac and respiratory cycle. The subtraction between the two simultaneously captured channels provided a stronger contrast signal to further estimate the motion using the maxima of cross correlations [17]. Only spatial frequencies within the diffraction limit were used to drive the cross correlations and further calculate the displacements. Once the data were corrected for eye movements, the frames from the raw differentiation were averaged together to increase the signal to noise ratio producing a final image. Through-focus sequences, where focus depth was changed with
#235123 - $15.00 USD Received 25 Feb 2015; revised 5 May 2015; accepted 12 May 2015; published 18 May 2015 (C) 2015 OSA 1 Jun 2015 | Vol. 6, No. 6 | DOI:10.1364/BOE.6.002106 | BIOMEDICAL OPTICS EXPRESS 2110

control of the deformable mirror, were also registered using the maxima of cross correlations to estimate and correct the motion between subsequent and optically overlapping frames.
The scaling factor of visual angle to microns was 31 microns/deg based on previous work by Schmucker and Schaffel that examined the paraxial model of the adult C57BL/6 mouse [18]. Work by Geng and colleagues confirmed this scaling ratio in the mouse by applying this model to image known structures in the living eye, the size of which were then confirmed by post-mortem histology [7,8,19].
2.5 Manual cell identification.
Sparse cells in resultant images were identified and counted using manual determination. Four expert analysts used custom MATLAB software to identify and count cell bodies and cell structures. The program recorded the x-y location of each object as users were instructed to point-and-click the center of each identified cell. Cell width was manually measured using custom MATLAB software that allowed the users to specify the length of a long and short axis in the en face planes. Final cell diameter was calculated as the mean of the long and short axis.
2.6 Packing density estimates of cell mosaics
Cell density was also calculated by measuring the frequency-power spectrum of the images using the two-dimensional Fast Fourier Transform (2D FFT). A tightly packed cellular mosaic is known to contain a peak spatial frequency component. This is represented as a ring in the 2D FFT relating to the spacing frequency of a tightly packed mosaic [20]. Taking the radial average of the 2D power spectrum about the origin increases signal-to-noise of the frequency components of the image. This ring is represented as a spatial-frequency peak in the radial average that can be directly related to the tight packing density of the cellular features [21,22].
3. Results
3.1 Photoreceptor mosaic imaging
When the split-detector AOSLO was focused at the distal processes of the photoreceptor layer (composed of outer and inner segments), we resolved a mosaic of small and densely packed cellular structures (Fig. 2(A)). This mosaic formed a monolayer of cell structures within the lateral Raleigh resolution limit of 1μm for the system at 796 nm. The radial average of the 2D-FFT of these images contained a peak at 23 cycles per degree of visual angle (cycles/deg). This corresponds to a packing density of 477,000 cells/mm2. This packing density is consistent with previous histological findings of rod density in the mouse retina [23] and differs by at least an order of magnitude to any other neural cell class in the retina, including that of cone photoreceptors, which are also expected in this layer, yet comprise only 3% of the total photoreceptor population in the C57BL/6 mouse [24].
#235123 - $15.00 USD Received 25 Feb 2015; revised 5 May 2015; accepted 12 May 2015; published 18 May 2015 (C) 2015 OSA 1 Jun 2015 | Vol. 6, No. 6 | DOI:10.1364/BOE.6.002106 | BIOMEDICAL OPTICS EXPRESS 2111

Fig. 2. Images and power spectra of photoreceptor distal processes and outer nuclear layer somata. (A) Deep retinal focus shows a mosaic of tightly packed distal processes of the photoreceptor inner and outer segments. (B) Larger cell bodies of the photoreceptors are seen when the focal plane lies in the ONL. The visible differences in packing density are confirmed with the spatial frequency power spectrum, which shows packing density peaks at 7 and 23 cycles/deg.
3.2 Photoreceptor cell bodies
When we focused slightly more vitread from the photoreceptor layer we observed a pattern of tightly packed cell bodies (somata), with greater size than that of the photoreceptor outer segments (Fig. 2(B)). The average diameter of these structures was found to be 3.7 ± 0.5 μm. This result is in agreement with previous histological measurements of photoreceptor soma diameter measuring 4.1 μm [24]. The arrangement of cells changed with 0.05D defocus steps as measured with the Shack-Hartmann wavefront sensor indicating presence of a multilayered tissue (Fig. 3).
The multilayer arrangement of cellular structures (Fig. 3(B)-3(D)) was bounded by the monolayer of putative photoreceptor distal processes (Fig. 2(A)) and the deepest layer of retinal circulation known to border the outer plexiform layer (OPL) (Fig. 3(A)) in the mouse [25,26]. The structures were consistent with the known packing density of photoreceptor somata in the mouse that form a multilayered organization in the outer nuclear layer (ONL, consisting of rod and cone photoreceptor somata). Analysis of packing density using the 2D FFT revealed a strong frequency component corresponding to 7 cycles per degree. This approximates a packing density of 44,000 cells/mm2 in a single plane assuming a thin axial section.
#235123 - $15.00 USD Received 25 Feb 2015; revised 5 May 2015; accepted 12 May 2015; published 18 May 2015 (C) 2015 OSA 1 Jun 2015 | Vol. 6, No. 6 | DOI:10.1364/BOE.6.002106 | BIOMEDICAL OPTICS EXPRESS 2112
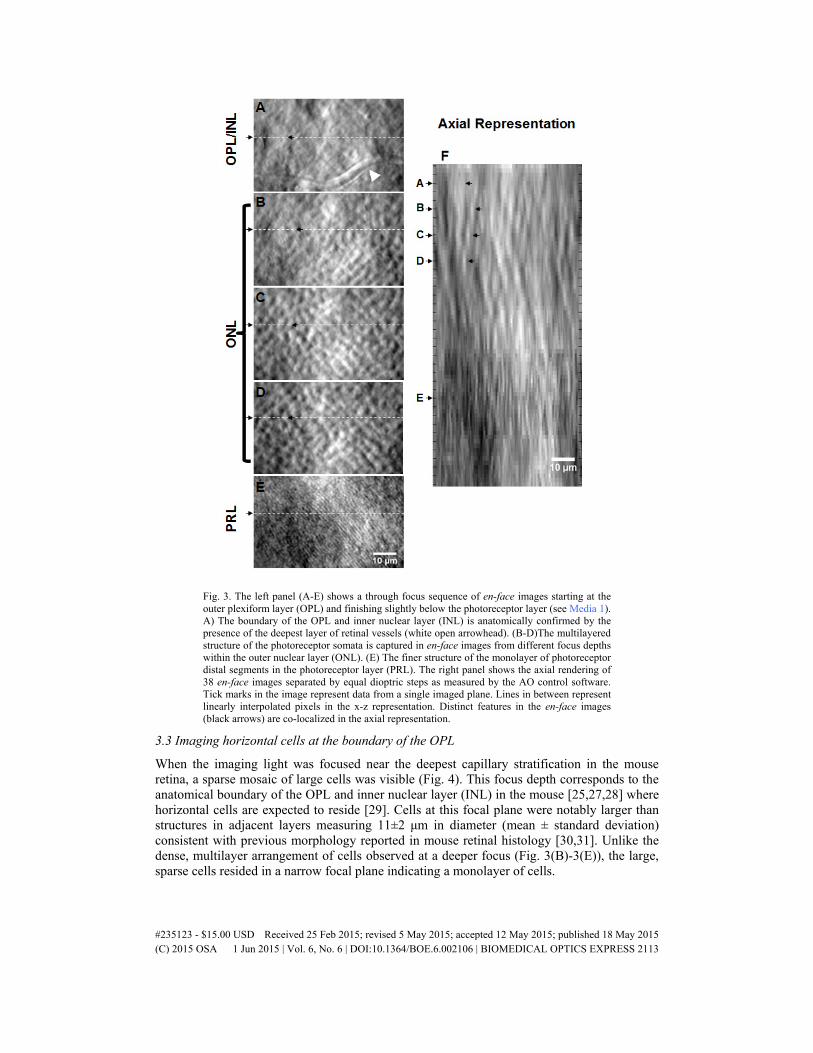
Fig. 3. The left panel (A-E) shows a through focus sequence of en-face images starting at the outer plexiform layer (OPL) and finishing slightly below the photoreceptor layer (see Media 1). A) The boundary of the OPL and inner nuclear layer (INL) is anatomically confirmed by the presence of the deepest layer of retinal vessels (white open arrowhead). (B-D)The multilayered structure of the photoreceptor somata is captured in en-face images from different focus depths within the outer nuclear layer (ONL). (E) The finer structure of the monolayer of photoreceptor distal segments in the photoreceptor layer (PRL). The right panel shows the axial rendering of 38 en-face images separated by equal dioptric steps as measured by the AO control software. Tick marks in the image represent data from a single imaged plane. Lines in between represent linearly interpolated pixels in the x-z representation. Distinct features in the en-face images (black arrows) are co-localized in the axial representation.
3.3 Imaging horizontal cells at the boundary of the OPL
When the imaging light was focused near the deepest capillary stratification in the mouse retina, a sparse mosaic of large cells was visible (Fig. 4). This focus depth corresponds to the anatomical boundary of the OPL and inner nuclear layer (INL) in the mouse [25,27,28] where horizontal cells are expected to reside [29]. Cells at this focal plane were notably larger than structures in adjacent layers measuring 11±2 μm in diameter (mean ± standard deviation) consistent with previous morphology reported in mouse retinal histology [30,31]. Unlike the dense, multilayer arrangement of cells observed at a deeper focus (Fig. 3(B)-3(E)), the large, sparse cells resided in a narrow focal plane indicating a monolayer of cells.
#235123 - $15.00 USD Received 25 Feb 2015; revised 5 May 2015; accepted 12 May 2015; published 18 May 2015 (C) 2015 OSA 1 Jun 2015 | Vol. 6, No. 6 | DOI:10.1364/BOE.6.002106 | BIOMEDICAL OPTICS EXPRESS 2113

Fig. 4. Sparse cellular mosaic captured in the outer plexiform layer. The density and size of these cells is consistent with previous findings of horizontal cells in the living retina.
The average density was 1250 ± 270 cells/mm2 when analyzed between 10-25 degrees from the optic disc (mean ± one standard deviation, over 0.25 mm2 of retinal area measured from four separate users). The sparse arrangement and low packing density is consistent with previous reports using histology to characterize horizontal cells in C57BL/6 retinae (Table 1, Fig. 5 open symbols). Like many neurons in the mouse retina, the putative horizontal cells showed a gradual increase in density with eccentricity between 10-25 degrees from the optic disc (Fig. 6). This trend is consistent with previous histological findings that show an initial increase in horizontal cell density with eccentricity reaching a peak at ~30 degrees [23]. Taken together, cell size, density and axial location are consistent with the morphology, distribution and monolayer laminar location of horizontal cells in the mouse retina [30].
Table 1 Comparison to different studies that measured horizontal cell density in the mouse retina
Study Horizontal Cell Density for C57BL/6J (cells/mm2)
Notes
Current Study 1250 ± 270 R.W. Williams et al., 1998 [32]
1151 ± 17.5
Liu et al., 2000 [31] 1100
Shelley et al., 2006 [33] 1120 ± 80 Wild type mice with Cx57lacZ/lacZ littermates
Jeon et al., 1998 [23] 3% of the inner retinal cells (3,016 cells/mm2)
Small sample size using electron microscopy section
#235123 - $15.00 USD Received 25 Feb 2015; revised 5 May 2015; accepted 12 May 2015; published 18 May 2015 (C) 2015 OSA 1 Jun 2015 | Vol. 6, No. 6 | DOI:10.1364/BOE.6.002106 | BIOMEDICAL OPTICS EXPRESS 2114

Fig. 5. Comparison between cells densities found in the current study and histological reports. Density estimates in the photoreceptor monolayer and horizontal cells show good agreement with previously reported density of this cell class. ONL somata show agreement with total number of rods when the density in a single plane of focus is scaled by a factor of 10, corresponding to the average number of axially stacked ONL somata. The horizontal cell densities also are consistent with four previous histological studies.
Fig. 6. The distribution of horizontal cells in the mouse retina. Mean cell density increased as a function of ecentricity between 10-25 degrees from the optic disc. Data represents mean and standard deviation of counts from 4 analysts when analyzing 0.25 mm2 of retinal tissue shown in Fig. 4.
4. Discussion
Previously, photoreceptors and the nerve fiber bundles of ganglion cells composed the only neural cell classes imaged without contrast agents in the living eye. In this study, split-detection imaging has expanded the cell structures that can be imaged in the retina to enable study of single cell somata that contain the nucleus, organelles and cell machinery that regulate cell health. To our knowledge this is the first time that photoreceptor somata and horizontal cells have been observed in the living eye without contrast agents.
4.1 Photoreceptor imaging
While there are many reports describing photoreceptor imaging in the primate [16,34–36], we are aware of only one other study that imaged photoreceptors in the mouse [8]. Geng et al. reported one exceptional example of photoreceptors imaged in confocal AOSLO, however
#235123 - $15.00 USD Received 25 Feb 2015; revised 5 May 2015; accepted 12 May 2015; published 18 May 2015 (C) 2015 OSA 1 Jun 2015 | Vol. 6, No. 6 | DOI:10.1364/BOE.6.002106 | BIOMEDICAL OPTICS EXPRESS 2115

images of this quality could not be obtained routinely. The challenges owe in part to the small structure of the rod-dominated murine retina in whose outer segments are only ~1.4 micrometers in diameter and are far more densely packed than photoreceptors in the primate [24,37]. Because the diffraction limit in the mouse is ~1 micron at 796 nm, exceptional high-and-low order aberration correction is essential. In our study, we were able to resolve the distal processes of photoreceptors in 4 animals and in multiple imaging experiments. While our apparatus does not provide classic confocality, the high numerical aperture of 0.49 in the mouse provides a narrow axial illumination point-spread function that may optimize the contrast of the monolayer of photoreceptor distal processes. At this time, we do not have the axial resolution to determine whether this structure represents photoreceptor inner segments [12] or outer segments [15,16]. We do find however, that this packing density is consistent with that of rods, which comprise 97% of the photoreceptors and represent the most abundant cell class in the mouse [23,24]. Study of this monolayer mosaic will be of great utility in the mouse model, which is becoming increasingly popular.
4.2 Photoreceptor cell bodies
While the wave guiding properties of photoreceptor outer segments have provided exceptional contrast when imaged in flood illuminated [38] and confocal AOSLO [15,16], the other more proximal parts of the photoreceptor have been challenging to image. Recently, Scoles and colleagues developed the split-detector configuration to image the photoreceptor inner segments, which sometimes endure despite outer segment degeneration [12]. Building on this, our study images the multi-laminar photoreceptor somata imaged in the living eye. To our knowledge, this is the first report of these cellular features in the living eye without the use of contrast agents. Previously, this structure was challenging to image not only because of cellular transparency, but also because unlike the monolayer arrangement of photoreceptor outer and inner segments, the photoreceptor cell bodies represent a complex, 3-dimensional interdigitation of 7-12 axially stacked cells in the ONL [39–41]. Consistent with this known anatomy, we found a plurality of cell layers when we changed the focal plane within the ONL. 2D-FFT analysis of these layers showed a corresponding packing density of 44,000 cells/mm2. Presuming tight volumetric packing density and thin optical plane of imaging we expect the 44,000 cells to be scaled by a factor of 7-12 corresponding to the axial arrangement of photoreceptor somata in the mouse retina. This estimate predicts 308,000-528,000 cells per mm2 of retinal tissue which corroborates ex vivo histology (Fig. 5, solid squares).
The diameter of rod somata found previously using electron microscopy is 4.1 ± 0.04μm. This is within the range of diameters found in this study (3.7 ± 0.5 μm, n=58 somata) [24]. Although our mean values are slightly smaller, the difference may reside in the excellent ability of electron microscopy to resolve the true boundary of cells within a thin histological plane. We also consider that our measurement of 3.7 μm may be slightly underestimated due to the thin optical sectioning of our instrument and therefore may under represent the maximum width of the photoreceptor cell bodies as the focal plane is not expected to bisect the equator of every cell.
Current state-of-the-art OCT has tracked outer retinal pathology based on OPL and general outer retinal thickness [40,42], yet to date, lateral resolution and contrast of OCT does not provide the ability to image or count single cells in these layers. Therefore cell loss is inferred from retinal thinning without taking into account plausible cases where laminar cell loss is confounded by local inflammation. Imaging photoreceptor somata has great practical importance in clinical evaluation of retinal pathology. A variety of retinal degenerative diseases impact the light-sensitive outer segments while cell bodies initially remain intact [12,43,44]. And while many of these changes have been documented in histology, our work takes the first steps toward providing a means to study the progression of incipient photoreceptor pathology in the same individual. Recent work has even promoted the idea of
#235123 - $15.00 USD Received 25 Feb 2015; revised 5 May 2015; accepted 12 May 2015; published 18 May 2015 (C) 2015 OSA 1 Jun 2015 | Vol. 6, No. 6 | DOI:10.1364/BOE.6.002106 | BIOMEDICAL OPTICS EXPRESS 2116

photoreceptor rescue in conditions of outer segment degeneration [45], which would necessitate the ability to detect viable ONL somata to regenerate unhealthy outer segments.
4.3 Horizontal cell imaging
Several lines of evidence in our study suggest the large, sparse somata observed at the boundary of the outer plexiform layer (OPL) represent horizontal cells. First, the current study axially locates the horizontal cells proximal to the deepest capillary stratification. In the mouse, this vascular stratum corresponds to the boundary of the INL and OPL [25,27], the same depth where horizontal cell somata are expected. While horizontal cells are located within the INL, they are known to reside at the boundary of the OPL in close proximity to their lateral dendritic projections [29,46]. Consistent with this anatomy, we found that the mosaic of cells in Fig. 4 was best imaged at the same focus position, even as retinal field location was changed.
We also found that cell somata were 11±2 microns wide and were generally circular with weak elliptical bias corroborating previous histological observations using immunofluorescent labeling of horizontal cells [29,30]. Cells were also sparsely organized consistent with the reported topography of horizontal cells in the mouse [23,29,30]. Our counts of 1250 cells/mm2 are within the range of horizontal cell measurements from four previous studies that examined the post-mortem retina (Table 1, Fig. 5.). Unlike some mammals, it is reported that the murine retina contains only one type of horizontal cell [29,47] making it unlikely that only a subset of horizontal cells were observed.
Cells identified as horizontal cells are also unlikely to be that of a mosaic of cones, bipolar or amacrine cells as their density as measured in histology differs by at least an order of magnitude (Table 1) [23]. Moreover, cone somata are expected at the opposite margin of the ONL adjacent to the external limiting membrane [24]. It is implausible that these cells represent ganglion or amacrine as the plane of focus is at the deepest retinal vascular stratification. The high numerical aperture of the mouse provides a small depth of field that reduces optical contrast from out of focus planes. This is evidenced by the ability to image each of the vascular stratifications independently, without contribution from adjacent layers in the mouse AOSLO [7,8]. Therefore, at the focal plane of deepest vessel stratification, we do not expect to detect any contrast from the ganglion cells layer, as the middle capillary stratification, located in the inner plexiform layer [27] is not visible at this axial focus. We do observe circular structures at the spatial scale of single cells at the ganglion cell layer, however, forthcoming experiments are needed to unambiguously identify these as ganglion cells or displaced amacrine cells using exogenous fluorescent validation.
It is intriguing that horizontal cells stand out compared to other transparent cell somata within the INL including those of bipolar cells, amacrine cells and Müller cells. What makes horizontal cells optically unique? It is possible that the unique monolayer arrangement that abuts a more homogenous background of the OPL makes the horizontal cells particularly visible. Additionally, horizontal cells are sparsely organized perhaps making them easier to detect unlike the dense arrangement of amacrine and bipolar cells, which are tightly packed throughout the INL [23]. Alternatively, it is also possible that the refractive index, surface properties or scattering in the near infrared make horizontal cells optically unique in this imaging mode when compared to their INL counterparts. Regardless, future studies will examine these optical properties of the major cell populations in the living retina, including for example the ganglion cells, with the prospect of optimizing contrast of each cell class.
The capability to optically distinguish this cell class in the living retina also provides a new and exciting way to optically interrogate horizontal cell function in the retina using near infrared intrinsic signals [48–51]. Previous studies have analyzed signals from the full thickness of the retina or that of photoreceptors [48], now that we can spatially localize these cells, new studies may investigate endogenous optical changes within this cell class to a variety of visual stimulation patterns. In conditions of photoreceptor loss, horizontal cells are
#235123 - $15.00 USD Received 25 Feb 2015; revised 5 May 2015; accepted 12 May 2015; published 18 May 2015 (C) 2015 OSA 1 Jun 2015 | Vol. 6, No. 6 | DOI:10.1364/BOE.6.002106 | BIOMEDICAL OPTICS EXPRESS 2117

also expected to be compromised [52] and may now be studied to examine the disruption of parallel convergence of visual information.
4.4 Optical contrast and similar imaging techniques
Retinal structures imaged with split-detector images show a bi-modality. Cells appear to have a dark left edge and a bright right edge. This arises from the digital subtraction of the two simultaneously detected channels. Mutual information that is identical between the two channels subtracts to zero. Any non-symmetrical left-right intensities captured by the two channels will provide a non-zero subtraction and the sign of the subtraction provides information on whether the bias is to the left or to the right. As such, the images show a bi-modality in the left-right axis, orthogonal to the orientation of the knife-edge that splits the retinal point-spread function.
A similar asymmetry in the images can be obtained in different phase imaging techniques. Oblique illumination microscopy is one example that uses an asymmetric illumination pattern yielding and angular offset between the axis of the illumination and the optical axis of the microscope [53,54]. This allows the collection of rays that would otherwise be discarded. A variant of oblique illumination is oblique detection, which by using a partitioned detector in the pupil plane allows the detection of phase gradients [55,56]. These techniques are usually implemented in transmission mode, an approach that is prohibitive when studying the retina in the living eye. Oblique back-illumination does not operate in transmission configuration and has provided the capabilities of imaging thick tissues in biological samples [57]. But this technique also requires a separate illumination path making non-obvious its application in ophthalmic imaging as the eye’s pupil sets the boundaries for the illumination and imaging rays. A technique that also creates asymmetries in subtracted images and has a similar optical setup as the one used in this study is differential amplitude contrast imaging, where the differentiation is performed in a plane conjugate to the retina [58].
While split detection in the living eye is in its infancy, it is already yielding promising applications. Developing this approach in the mouse eye has several foreseeable benefits. The first of course is the anesthetized preparation largely mitigates retinal eye motion that still complicates human retinal imaging approaches. Additionally, the axial resolution of the mouse eye is four times better than the human eye due to the larger numerical aperture [19]. The digital subtraction may play an important role enhancing the axial resolution, as out of focus information that overlaps in the two channels is canceled when the subtraction is calculated. Therefore, in the mouse imaging paradigm, we expect that contrast is provided by optical focus and small depth of field rather than confocal rejection of out of plane light.
Split detector provides a reliable way of imaging of imaging horizontal cells, photoreceptor somas and photoreceptor distal processes. Although each imaging session had a specific target structure, we obtained positive results 96% of the time. We found that the success rate was affected by the mouse preparation including the alignment of the contact lens and the presence of cataracts in the cornea or the lens rather than AOSLO system performance.
4.5 Summary and applications
We expect that split detector and differential contrast imaging will open a new era of imaging transparent cells in the living eye. This technique could take an important role towards assessing retinal health and recent efforts toward vision restoration as imaging photoreceptor and horizontal cell bodies may assess the viability to rescue those cells while they are immersed in a diseased environment. And while the contrast from ONL somata or horizontal cells in the human eye has not yet been it demonstrated, we predict that further refinements using a similar approach may provide new ways image and study human horizontal cells and photoreceptor somata and study their structure and function in a variety of retinal degenerative diseases without requiring use of contrast agents.
#235123 - $15.00 USD Received 25 Feb 2015; revised 5 May 2015; accepted 12 May 2015; published 18 May 2015 (C) 2015 OSA 1 Jun 2015 | Vol. 6, No. 6 | DOI:10.1364/BOE.6.002106 | BIOMEDICAL OPTICS EXPRESS 2118

Acknowledgments
We appreciate the support from the following sources: NIH Grants EY023496-01, EY014375, EY001319, The Schmitt Program on Integrative Brain Research, and Canon Inc. We would like to thank Jennifer Strazzeri, Keith Parkins, Kenny Cheong, Jie Zhang and Robin Sharma for their assistance and feedback on this work.
#235123 - $15.00 USD Received 25 Feb 2015; revised 5 May 2015; accepted 12 May 2015; published 18 May 2015 (C) 2015 OSA 1 Jun 2015 | Vol. 6, No. 6 | DOI:10.1364/BOE.6.002106 | BIOMEDICAL OPTICS EXPRESS 2119