
Electrical Resistance Tomography (ERT) Subsurface Imaging for Non
Journal of Earth Sciences and Geotechnical Engineering, vol. 3, no. 4, 2013, 107-123
ISSN: 1792-9040 (print), 1792-9660 (online)
Scienpress Ltd, 2013
Imaging the Subsurface in the Cameroon Centre Region
using the Audio-magnetotellurics (AMT) Soundings for
the Monitoring of the Monatele-sa’a Earthquake Area
T. Ndougsa-Mbarga1, D.H. Gouet2, D. Bisso3, A. Meying4,
and E. Manguele-Dicoum5
Abstract
In monitoring the Monatélé-Sa’a earthquake area, audiomagnetotelluric investigation was
carried out using a scalar instrument with a frequency range from 4.1 Hz to 2300 Hz. Data
have been collected in the Ntui-Sa’a area near Monatélé, along a profile containing seven
(07) stations directed N-S, covering approximately a distance of 16.5 km. This profile
crosses the Sanaga River which seems to be parallel to a buried big fault which shows no
indication on the surface. The validation of the measured resistivity and calculated phase
data set is done by the application of dimensionality. The interpretation of data using 2D
inversion imaging of the subsurface has lead to the confirmation of two major
discontinuities:
The Sanaga fault oriented SSW-NNE, covered by a thick layer of alluvial deposit in
the Elang III area. This fault is bisected to a lateral fracture between Nkolessono and
Elang III.
The fault network in Biakoa-Goura intersected the Sanaga fault is characterised by
secondary faults in Biakoa and Talba.
The presence of a fault network traversing the Sanaga fault shows that the study area
belongs to the major tectonic accident area known as the Cameroon Central shear zone
(CCSZ). The tectonic node relaxation of the Biakoa-Goura seems to be the origin of the
February 2005 earthquake in Monatélé and Yaoundé northern areas.
1Department of Physics, Advanced Teacher’s Training College, University of Yaoundé I, P.O. Box
47, Yaoundé Cameroon 2Department of Physics, Faculty of Science, University of Yaoundé I, P.O. Box 812, Yaoundé
Cameroon. 3Department of Earth Sciences, Faculty of Science, University of Yaoundé I, P.O. Box 812,
Yaoundé Cameroon. 4 Geology and Mining Exploitation School, University of Ngaounderé, P.O. Box 454, Ngaounderé,
Cameroon. 5 Department of Physics, Faculty of Science, University of Yaoundé I, P.O. Box 812, Yaoundé
Cameroon.
108 T. Ndougsa-Mbarga et al.
The interpretation revealed that quartzite, gneiss and migmatite are in discordance on a
basement composed of granite.
Keywords: AMT soundings, dimensionality, resistivity, phase, 2D inversion, fault,
tectonic node, Monatélé-Sa’a, Cameroon.
1 Introduction
The Sanaga fault had been put in evidence by Dumont (1986) and confirmed by Bisso et
al (2004) respectively based on remote sensing and audiomagnetotellurics (AMT)
analyses. These studies showed that the Sanaga fault seems to follow the course of
Sanaga River by Ebebda and bisects to a fault network which in fact heads towards Ntui-
Sa’a (Bisso et al, 2004; Dumont, 1986). To know the impact of this fault, it is important
to highlight that the region has been subjected to a low magnitude earthquake recently in
February 2005. This study has as objective, the collection of data along a profile which
would have to permit after interpretations, to tell if this fault network which is bisected
to the Sanaga fault belongs to the Cameroon Central shear zone of the Pan African belt or
probably to a local tectonic accident network (Cornachia and Dars, 1983).
An audiomagnetotelluric (AMT) prospecting and the exploitation of data collected along
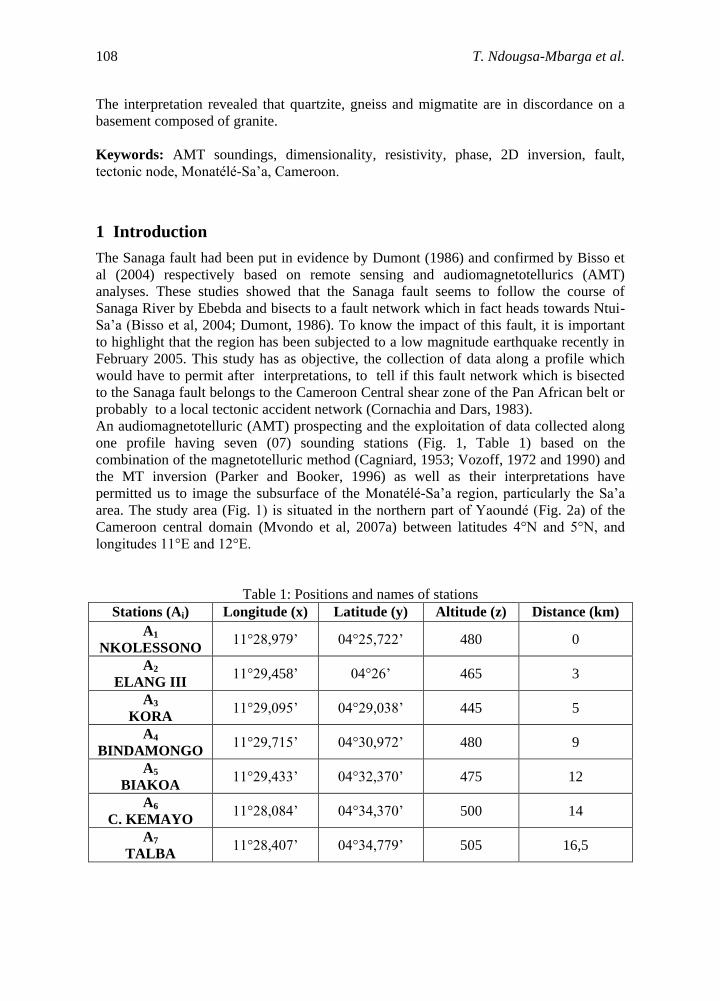
one profile having seven (07) sounding stations (Fig. 1, Table 1) based on the
combination of the magnetotelluric method (Cagniard, 1953; Vozoff, 1972 and 1990) and
the MT inversion (Parker and Booker, 1996) as well as their interpretations have
permitted us to image the subsurface of the Monatélé-Sa’a region, particularly the Sa’a
area. The study area (Fig. 1) is situated in the northern part of Yaoundé (Fig. 2a) of the
Cameroon central domain (Mvondo et al, 2007a) between latitudes 4°N and 5°N, and
longitudes 11°E and 12°E.
Table 1: Positions and names of stations
Stations (Ai) Longitude (x) Latitude (y) Altitude (z) Distance (km)
A1
NKOLESSONO 11°28,979’ 04°25,722’ 480 0
A2
ELANG III 11°29,458’ 04°26’ 465 3
A3
KORA 11°29,095’ 04°29,038’ 445 5
A4
BINDAMONGO 11°29,715’ 04°30,972’ 480 9
A5
BIAKOA 11°29,433’ 04°32,370’ 475 12
A6
C. KEMAYO 11°28,084’ 04°34,370’ 500 14
A7
TALBA 11°28,407’ 04°34,779’ 505 16,5
Imaging the Subsurface in the Cameroon Centre Region 109
Figure 1: Localization map of sounding stations

110 T. Ndougsa-Mbarga et al.
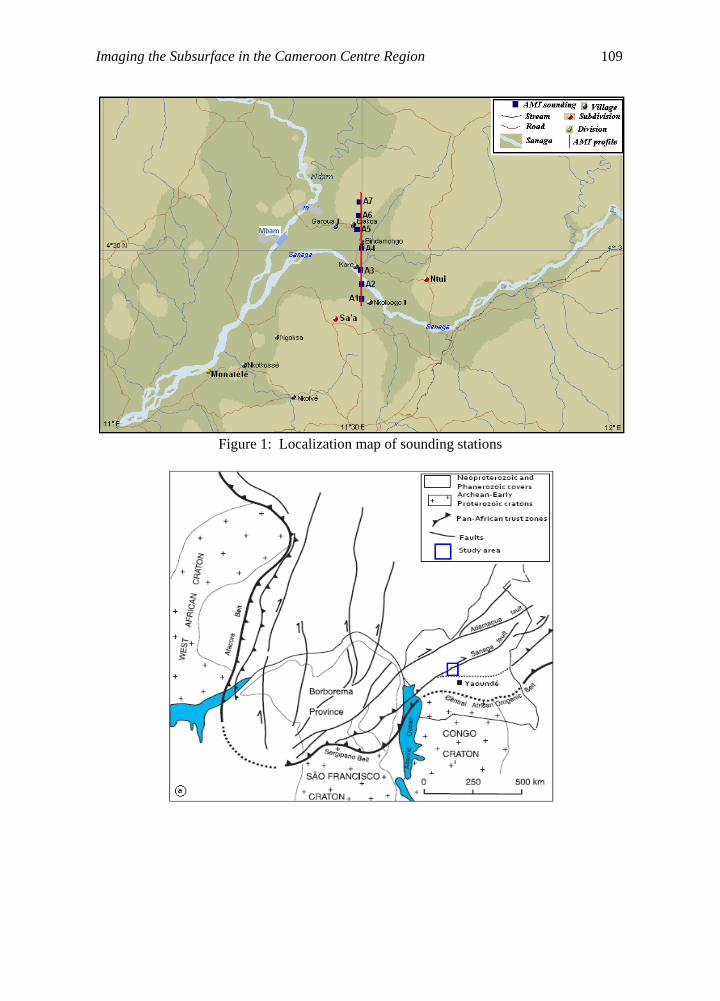
Figure 2: (a) Tectonic map of the study area location (modified from Mvondo et al
2007a). (b) Structural map of the Central African Fault Zone (modified from Mvondo et
al 2007a). (c)Geological map of the study area (after Gazel and Hourcq, 1964)
2 Tectonic and Geological Setting
The Monatélé-Sa’a area belongs to the central Cameroon domain and is located between
latitudes 4°N and 5° N and longitudes 11°E and 12°E .The study area (Fig. 1) presents an
equatorial climate type. The humidity and temperature vary less. The Sanaga river is the
principal hydrographical collector of the region. The topography is relatively the same,
with an average altitude which ranges between 400 m to 600 m. The vegetation is that of
the dense forest.
A greater part of Cameroon is made up of a Precambrian basement including magmatic
and metamorphic rocks belonging to different geological periods. These rocks are
11° 12°
4°30’

Imaging the Subsurface in the Cameroon Centre Region 111
constituted of granite, gneiss and migmatite, renovated during the Pan African episode
(Meying et al, 2009). The Monatélé-Sa’a area, found in the middle part of the north
Equatorial Pan African belt, is an integral part of the Yaoundé series which is constituted
essentially of granulites, migmatites and medium grade schists (Bisso et al, 2004). The
protolithes correspond to a platform of marly sedimentary series with basic volcanic
interstratified levels (Bisso et al, 2004). This neoproterozoic series was subject to a
triphase tectonic associated to migmatization (Bisso et al, 2004; Mvondo et al, 2007a):
- a D1 phase represented by isoclinally folded and second axial planar foliation.
- a D2 tangential phase characterised by differential displacement and folds linked to a
continental collision metamorphic micaschites, gneiss, migmatites and granites of the
Mobile zone (Bisso et al, 2004; Nzenti et al, 1999).
- a D3 brittle phase which corresponds to mylonitic shears and faulting.
The conditions of paroxysmal metamorphism were estimated at 800°C and 10-12Kb
(Bisso et al, 2004). The granulitic metamorphism is dated at 620 10 Ma (Penaye et al,
1993)
The geological observations based on rock lithology on one hand and tectonic facts on the
other hand, show that the Monatélé-Sa’a area belongs to the Pan-African cycle.
3 Audiomagnetotelluric Data
The data acquisition was based on the principle of the magnetotelluric (MT) method
(Cagniard, 195; Vozoff 1972 and 1990) using the resistivity-meter ECA 540-0 which
measured simultaneously the electric and magnetic field components Ex and Hy
respectively of the natural wave (Manguelle-Dicoum et al, 1992 and 1993; Bisso et al,
2004; Meying et al, 2009). The AMT data are collected following the telluric lines E-W
& S-N. The sounding curves following the telluric lines E-W & S-N (Fig. 3a-b) using the
MT Inversion (Parker and Booker, 1996) show that the line SN is the longitudinal
direction to the structure and the line EW is the transversal direction to the structure
(Swift, 1967). The resistivity meter measures the apparent resistivity a
following the E-
W telluric line and the apparent resistivity ρα following the S-N telluric line (Manguelle-
Dicoum et al, 1992). At each frequency and following a direction, five (05) resistivity
values are collected. The obtained data of each frequency and direction permitted the
calculation of the weighted arithmetic mean a
and ρα . Then the apparent phases (Phi)
of telluric lines E-W ( a ) and SN (Φα) following the Bostick transformation defined by
the relation 14
aa
a
F
F
where F , a , F , a and a are respectively
the frequency, the apparent resistivity, the variation of the frequency, the variation of the
apparent resistivity and the apparent phase or Phi (Bostick, 1977). The phase calculated
following the Bostick transformation must be in the range 0-90° required by any one
dimensional response (Parker and Booker, 1996).

112 T. Ndougsa-Mbarga et al.
a)-Sounding curves of the MT inversion with Rhoplus of Rho measured and Phi calculed
(Bostick, 1977) of the station A7 following telluric line EW
b)-Sounding curves of the MT inversion with Rhoplus of Rho measured and Phi calculed
(Bostick, 1977) of the station A7 following telluric line SN

Imaging the Subsurface in the Cameroon Centre Region 113
Figure 3: (a-b) AMT sounding curves of the MT Inversion with Rhoplus of measured and
calculed data (Parker and Booker 1996).
(c-d) AMT sounding curves of the MT Inversion with Rhoplus of smoothed data
following Rhoplus (Parker and Booker 1996).
4 Methodology
4.1 Validation of Resistivity and Phase Data
The collected AMT data were generally influenced by the disruptive sources (Fig. 3a-b)
(Jones, 1988). Indeed, regional currents induced by natural sources can be problematic in
certain situations, and the appropriate interpretational dimensionality must be known
(Jones and Garcia, 2003). Our study being regional on one wide AMT profile, the 3D
interpretation is not valid (Jones and Garcia, 2003). The dimensionality of data measured
using the MT inversion (Parker and Booker, 1996) permits on the one hand to determine
if the appropriate interpretational dimension must be in 1D or 2D, or in 1D and 2D, and
the other hand to validate the analytical AMT data (analytical a and analytical a ) across
a robust smoothing AMT data measured ( a measured) and calculated (Bostick phase a )
following the MT inversion (Parker and Booker, 1996; Bostick, 1977).
The sounding curves (fig. 3(a)-(b)) of measured resistivity (a
&a ) and calculated phase
following Bostick transformation ( a & a ) of telluric EW & SN lines show that most
c) - Sounding curves of the MT inversion with Rhoplus of Rho and Phi smoothed (following Dplus)
of the station A7, telluric line EW
d)-Sounding curves of the MT inversion with Rhoplus of Rho and Phi smoothed (following Rhoplus)
of the station A7, telluric line SN
114 T. Ndougsa-Mbarga et al.
data exceeds the 95% confidence limit of computed values (Parker and Booker, 1996).
This dispersion of the resistivity and phase data set shows that the regional effect is not
negligible and the 1D interpretation is not appropriate. Thus, the appropriate
interpretational dimension is 2D. However, the appropriate data for a 1D, 2D or 3D
interpretation must be included in the 95% confidence limit in relation data with
computed values (Parker and Booker, 1996). In this effect, a robust smoothing using MT
inversion with Rhoplus permits to bring back the measured resistivity AMT data and
calculated phase following the telluric lines EW & SN in the 95% confidence limit (Jones
and Garcia, 2003; Parker and Booker, 1996). The smoothed data set following the telluric
line EW & SN (Figure 3(c)-(d)) permits to have analytical resistivity a and phase a
following the relations ( )a a a and ( )a a a respectively
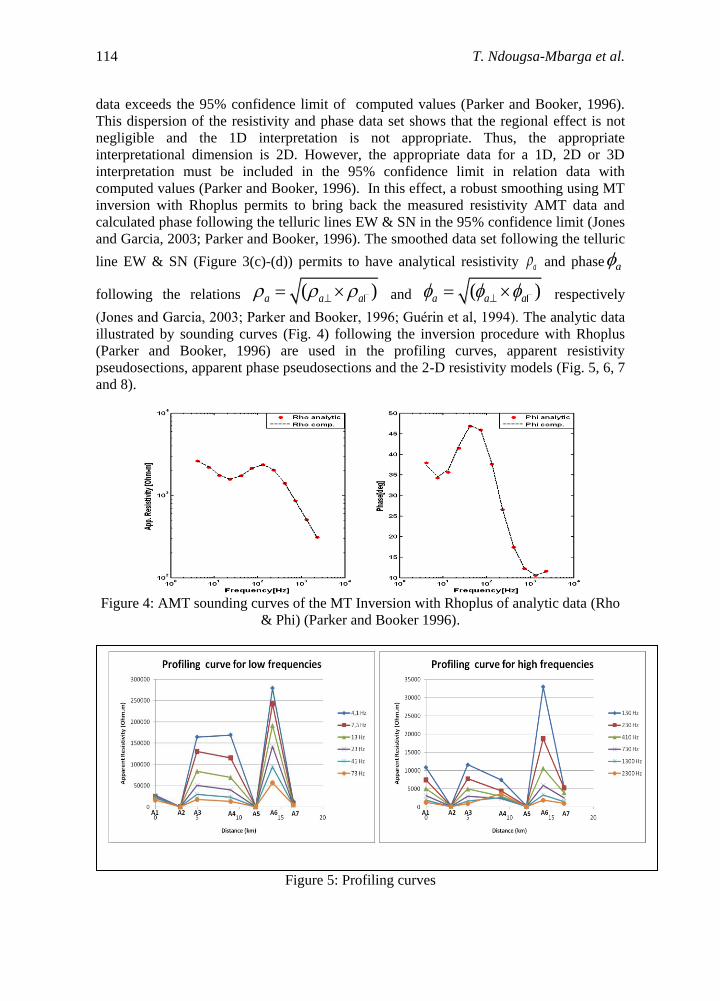
(Jones and Garcia, 2003; Parker and Booker, 1996; Guérin et al, 1994). The analytic data
illustrated by sounding curves (Fig. 4) following the inversion procedure with Rhoplus
(Parker and Booker, 1996) are used in the profiling curves, apparent resistivity
pseudosections, apparent phase pseudosections and the 2-D resistivity models (Fig. 5, 6, 7
and 8).
Figure 4: AMT sounding curves of the MT Inversion with Rhoplus of analytic data (Rho
& Phi) (Parker and Booker 1996).
Figure 5: Profiling curves
Imaging the Subsurface in the Cameroon Centre Region 115
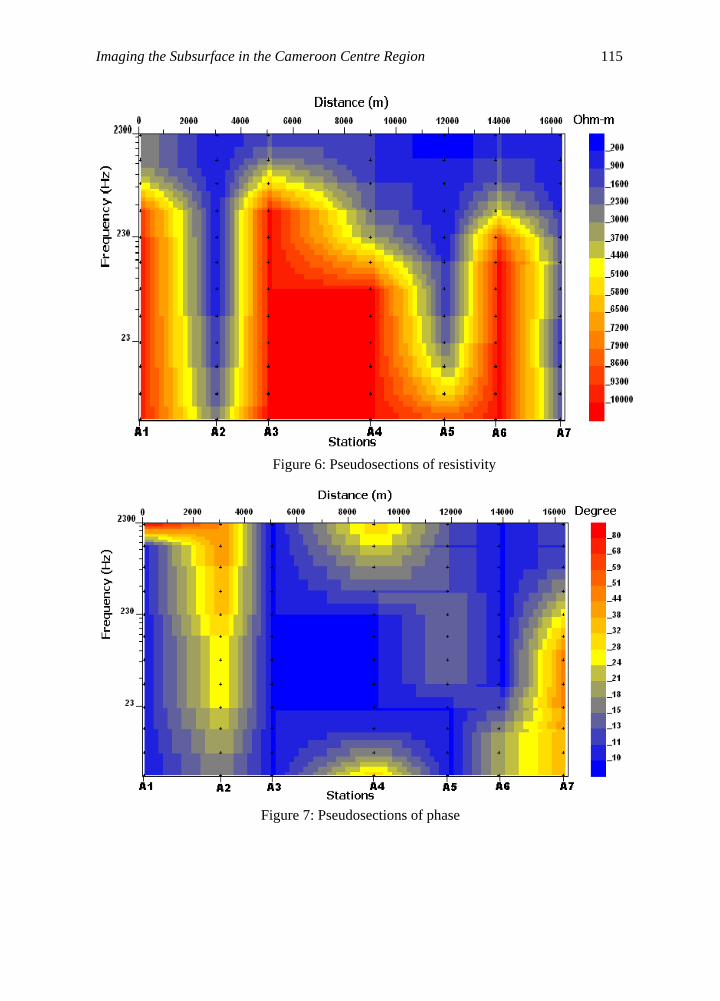
Figure 6: Pseudosections of resistivity
Figure 7: Pseudosections of phase
116 T. Ndougsa-Mbarga et al.
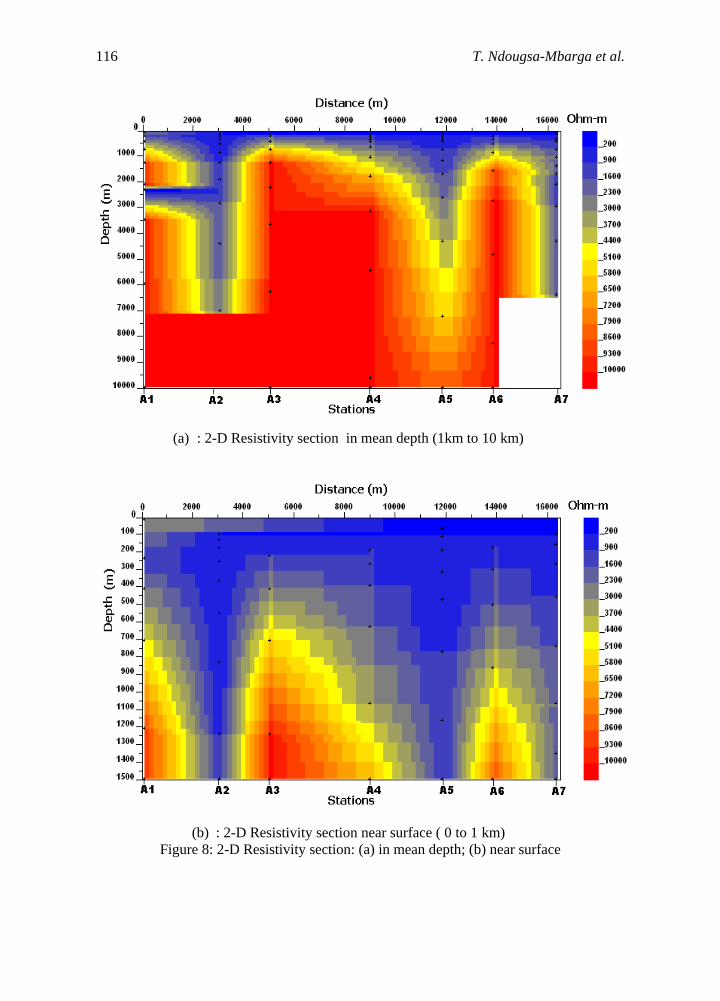
(a) : 2-D Resistivity section in mean depth (1km to 10 km)
(b) : 2-D Resistivity section near surface ( 0 to 1 km)
Figure 8: 2-D Resistivity section: (a) in mean depth; (b) near surface
Imaging the Subsurface in the Cameroon Centre Region 117
4.2 The Depth Investigation
The resistive-meter ECA 540-0, used in the data collection, do not permit us to have the
depth of investigation directly. The skin effect is determined by the relation 1/ 2
503 a
F
where a
and F are the apparent resistivity and the frequency
respectively (Manguelle-Dicoum et al, 1993). The skin effect is in meters. The depth of
investigation P is half of the skin effect (Fauchard et al, 2004). The depth of investigation
enables us to have 2-D Resistivity or geoelectrical section.
5 Results
5.1 Description of Profile
The profile (Fig. 1) cuts across the parallel 4°30’N and comprises seven (07) stations of
measurement (Table 1). This profile oriented SN, is situated in the region crossing over
the neoproterozoic series which comprised essentially the gneisses and migmatites of the
mobile zone and strips of quartzites of specified Precambrian (Mvondo et al, 2007a) (Fig.
2b) or the younger metasediments and the Calco-Alkaline orthogneisses (Bisso et al,
2004). The area of investigation is consequently located on the line of Sanaga fault
oriented SSW-NNE which is composed of recurrent faulting (Ngnotue et al, 2000). In this
region, the metamorphism reaches a maximum in the Yaoundé region (granulites and
migmatites), which then decrease to the north (Ngnotue et al, 2000).
5.2 Profiling Curves
The profiling curves (Fig. 5) show that the subsurface around A1, between A3 and A4 and
around A6 is very resistive. It is characterized by the high gradient of resistivity relative to
all frequencies. Around stations A2 and A5 one notes a sudden change of the profile lines
for all frequencies. This behaviour around stations A2 or A5 characterize the presence of
discontinuities about these stations (Bisso et al, 2004). These discontinuities are the
conductive anomalies because the profile traverses a resistive region (Ballestreci et al,
1983; Manguelle-Dicoum et al, 1993). While, between A6 and A7 or around A7, the
profiling curves change suddenly. Indeed the gradient of resistivity falls abruptly between
A6 and A7. These observations suggest the presence of conductive anomaly between these
stations or around A7 (Manguelle-Dicoum et al, 1993). The anomalies of A2, A5 and
between A6 and A7 or around A7 could be faults, fracture or the contact between two
blocks of different lithology (Ballestreci et al, 1983; Bisso et al, 2004).
5.3 Pseudosections of Resistivity
The resistivity pseudosection (Fig. 6) below 410 Hz shows three high resistive zones
(Rho>9000 Ω.m); which are the regions between A3 and A4, then around stations A1 and
A6. Above 410 Hz, the resistivity falls (Rho<3000 Ω.m) for all stations. This resistivity
decreases when the frequency increases. Around the stations A2, A5 and A7, the
pseudosections are sub-vertical and the resistivity is very small (Rho≤900 Ω.m) for all

118 T. Ndougsa-Mbarga et al.
frequencies. These observations suggest the presence of discontinuities around these
stations. These discontinuities are the conductive anomalies because the profile crosses
over a resistive subsoil (Rho>9000 Ω.m) (Ballestreci et al, 1983; Manguelle-Dicoum et
al, 1993; Bisso et al, 2004). Below 410 Hz and above 410 Hz, the constrast is very small
in regions situated between A3 and A4, A1 and around A6. Thus, the properties of
geological structures in these are nearly similar on the one hand below 410 Hz, on the
other hand above 410 Hz. These results are in accordance with those from profiling
curves and particularly put in evidence that in depth (below 410 Hz), the subsoil is very
resistive and near the surface (above 410 Hz), the subsoil is covered by the nearly
conductive structures. It also specifies that the discontinuity localised between A6 and A7
is situated close to A7 and extends further in depth.
5.4 Pseudosections of Phase
Following the AMT profile (Fig. 7) and around of the station A2, pseudosections of phase
are nearly vertical. At 2300 Hz, the phase is around 51°. These values decrease slightly
when the frequency increases. Around stations A1 and A3, situated near A2, the phase is
very small (Phi<13°). These observations characterize on the one hand the presence of the
discontinuity around the station A2 covered by conductive structures, on the other hand a
transition from conductive to more resistive structures (A1 & A3) (Ranganayaki, 1984;
Jones et al, 1988). Around A4, the phase (Phi≥21°) increases with the frequency above
410 Hz and below this frequency, the phase decrease until 23 Hz (Phi≤10°). From 23 Hz
the phase increases again. Around A5, the pseudosections are nearly vertical and the phase
stays below 18° until 23 Hz, and then stays below 11° for small frequencies (F≤13 Hz).
At the station A6, the phase is very small (Phi≤10°) but from 23 Hz, the phase increases
sligthly with small frequencies. At the station A7 the phase is around 44° and the
pseudosections are nearly vertical below 710 Hz. Above this frequency, the phase is small
(Phi≤11°). These obsevations show on the one hand the presence of resistive structures
around stations A3, A4 and A6 limited by conductive structures around stations A5 (above
23 Hz) and A4 (above 410 Hz and below 23 Hz), on the other hand the presence of the
discontinuity around A5 (Ranganayaki, 1984; Jones et al, 1988). These observations also
show the presence of conductive structures around A7 and a discontinuity around this
station limited in the hight frequencies by 710 Hz. These observations suggest a
conductive anomaly in this area (Ranganayaki, 1984; Jones et al, 1988). These
observations along the AMT profile confirm results of the profiling curve and the pseudo-
section of resistivity.
5.5 2-D Resistivity Section
The Fig. 8a represents the geoelectrical section model or 2-D resistivity model. This
figure shows that discontinuities around A2, A5 and A7 extend to about 7000 m, 5500 and
6500 m in depth respectively. These discontinuities are characterized by nearly vertical
pseudosections and small resistivities (Rho≤900 Ω.m) for all frequencies (Ranganayaki
1984; Manguelle-Dicoum et al, 1993, Bisso et al, 2004). But discontinuities around A5
and A7 seem to continue in depth because the investigation depths of the last frequency
(4.1 Hz) limit the progression of waves in depth. This remark is justified by the very clear
horizontal separation line between 7000 m and 8000 m around A2 and absence of colours
after 7000 m in depth around A7 (Ranganayaki, 1984; Manguelle-Dicoum et al 1993;
Imaging the Subsurface in the Cameroon Centre Region 119
Bisso et al 2004). The colour constrast of 2D-Resistivity model (Fig. 8b) assumes that the
subsurface structure around stations A1, A3, A4 and A6 are models of four layers and A2,
A5 and A7 are models of three layers (Manguelle-Dicoum et al, 1993; Bisso et al, 2004).
For the first three stations, the resistivity decreases between the first and the second layers
but the thickness is small (Depth<100m) for the first layer. After the second layer, the
resistivity increases with the depth. For the rest of the stations, the resistivity increases in
depth from the first layer and this thickness is considerable (Depth>400 m). The last layer
is very resistive (Rho>8000 Ω.m. Between A1 and A2, the 2-D Resistivy model (Fig. 8a)
shows a lateral discontinuity characterized by the presence of a conductive structure
((Rho<900 Ω.m) between resistive structures (Rho>9000 Ω.m) (2300 m<Depth<3000 m)
(Ranganayaki, 1984; Manguelle-Dicoum et al, 1993; Bisso et al, 2004). These
observations along the AMT profile confirm on the one hand results of the profiling
curve, pseudosections of resistivity and pseudosections of phase, and on the other hand
bring to view the presence of lateral discontinuity or lateral conductive anomaly between
A1 and A2.
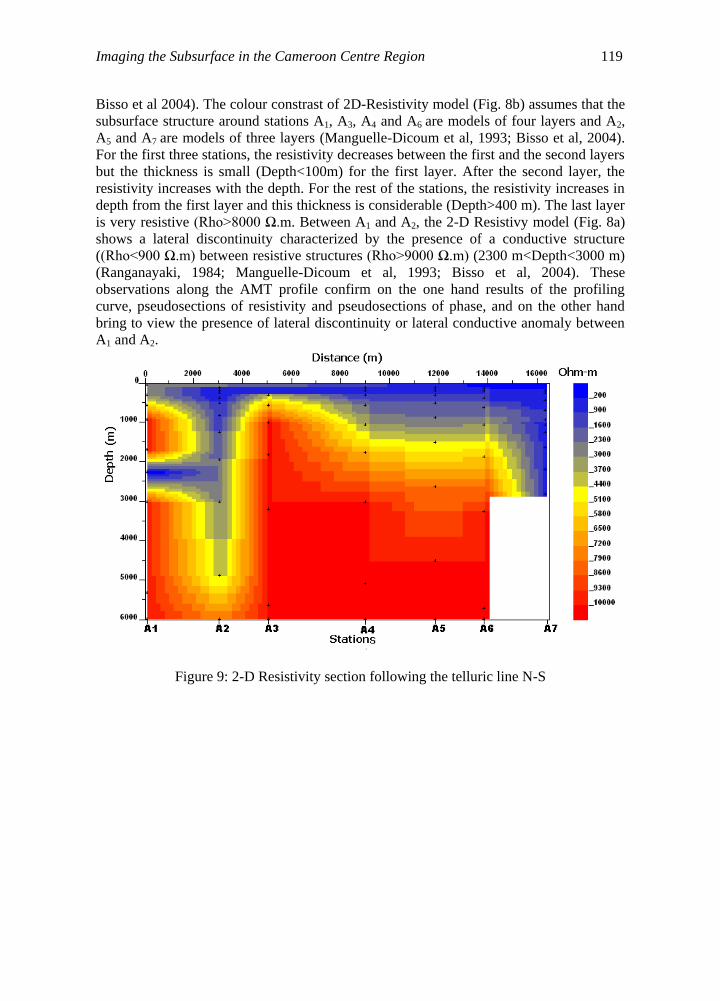
Figure 9: 2-D Resistivity section following the telluric line N-S

120 T. Ndougsa-Mbarga et al.
Figure 10 : 2-D Resistivity section following the telluric line E-W
6 Discussion
The Analysis of profiling curves, the pseudosections (resistivity and phase) and the 2D-
Resistivity (geoelectrical section) reveal three discontinuity zones around the stations A2,
A5 and A7 (Figures 5, 6, 7 and 8a). These analyses show that the discontinuity about A2
extends to below 6000 m while that about A7 extends to above 6000 m (Fig. 8a). These
analyses suggest that the discontinuities about A2 and A7 are major while that of A5 is
minor. It also suggests that these discontinuities or conductive anomalies are the faults,
fractures or the contact between two blocks of different lithology (Ballestreci et al, 1983;
Ranganayaki, 1984; Manguelle-Dicoum et al, 1993; Bisso et al, 2004). However, the
particular analysis of 2-D Resistivity (Fig. 8a) shows except for discontinuities at A2, A5
and A7, the presence of lateral discontinuity between A1 and A2 and situated below 3000
m from the surface (Manguelle-Dicoum et al, 1993). So to say, the 2-D Resistivity gives
more information than apparent resistivity pseudosections or apparent phase
pseudosections. Indeed it permits the localization of anomalies and the cartography of
structures of the subsurface in depth (Ranganayaki, 1984). At the end of these analyses,
one suggests that discontinuities or conductive anomalies around A2 and A7 are the faults
while those around A5 and between A1 and A2 are fractures (Ballestreci et al, 1983;
Manguelle-Dicoum et al 1993; Bisso et al, 2004). The observation of 2-D Resistivity
models following EW and SN telluric lines (Fig. 9 and 10), shows that only the
discontinuity around A2 is observable in the two directions. This major discontinuity
(Manguelle-Dicoum et al, 1993; Bisso et al, 2004), occupy an intermediary position
between the directions E-W and N-S. The course of Sanaga at the proximity of the
Monatélé division which is the epicentre of the February 2005 earthquake in Monatélé
and Northern areas of Yaoundé, follow an intermediary position between the directions E-
W and N-S. This course of Sanaga seems to follow the Sanaga fault oriented SSW-NNE

Imaging the Subsurface in the Cameroon Centre Region 121
(Dumont, 1986; Bisso et al, 2004). However the study area is consequently located on the
line of Sanaga fault oriented SSW-NNE which is composed of recurrent faulting
(Ngnotue et al, 200; Dumont, 1986). The position of the station A2 at the right side of the
Atlantic and near the Sanaga river let to suggestion that the discontinuity around A2
would be the Sanaga fault which seems to follow the course of Sanaga (Bisso et al, 2004).
This major fault, secant to a lateral fracture, is marked by a Biakoa-Goura fault network
secant to the Sanaga fault characterized by discontinuities around A5 and A7. These results
confirm the anterior geophysical studies and show that the fault network, secant to the
Sanaga fault, belongs to the tectonic accident network (Dumont, 1986; Bisso et al, 2004).
These results also correspond to the Pan African tectonic movement (Ngnotue et al,
2000).
The combination of the 2-D Resistivity and the pseudosections (resistivity and phase)
with the standard table of resistivity range for rocks (Telford et al 1990; Parasnis, 1997)
permits to suggest that the surface of the study area is covered by an alluvial deposits
layer near the Sanaga river (stations A1, A2 and A3) (Fig. 8b) and a conductive
sedimentary layer essentially lateritic (Fig. 8a) on the northern part of the profile. But this
combination also permits to suggest on the one hand that the second layer lies on
structures constituted essentially of metamorphic quartzite, and on the other hand, on the
basement constituted essentially of gneisses and migmatites. These results correlated with
the geological observations, confirm the presence of the quartzite, gneisses and
migmatites in the study area (Ngnotue et al, 2000; Bisso et al, 2004; Mvondo et al,
2007a).
The combination of the audiomagnetotellurics method (Cagniard 1953; Vozoff 1972 and
1990) and the MT inversion with Rhoplus (Parker and Booker, 1996) has led to put in
evidence three discontinuities following the depth and a lateral discontinuity: the Sanaga
fault communicating with the lateral discontinuity and oriented following the course of
the Sanaga, and the Biakoa-Goura fault network characterised by the faults across Biakoa
and Talba. These results permit us to say that the Monatele-Sa’a area is a seismic zone
and the tectonic node relaxation of the Biakoa-Goura seems to be the origin of the
February 2005 earthquake in Monatélé and Northern areas of Yaoundé. This combination
has also permit to characterize the subsurface of the study area where the composition is
mainly quartzite, migmatite and gneissic.
7 Conclusion
The combination of a geophysical investigation by audiomagnetotellurics method
(Cagniard 1953; Vozoff 1972 and 1990), the MT inversion with Rhoplus (Parker and
Booker, 1996) and the 2-D inversion has enabled us to contribute significantly to the
understanding of the underground structure of the Monatélé-Sa’a zone. Indeed this zone is
characterized by a major fault or Sanaga fault oriented SSW-NNE following the course of
the Sanaga Elang III area, and the Biakoa-Goura II fault network characterised by the
fault series traversing Biakoa and Talba. These faults make the Monatélé-Sa’a area a
seismic zone that the tectonic node relaxation was the origin of the February 2005
earthquake in Monatélé and Northern areas of Yaoundé. This combination has also
permitted to show that the characterised subsurface of the study area firstly, is covered in
surface by alluvial deposits and the conductive sedimentary layers and secondly, it lies on
quartzite, gneissic and migmatite structures. Furthermore, these results which correspond
122 T. Ndougsa-Mbarga et al.
to the tectonic movement of the area permit us to show on the one hand that the
audiomagnetotellurics method is a reliable method in the imaging of subsurfaces, and on
the other hand the 2D inversion (Parker and Booker, 1996) combined with a good
knowledge of geology has given a good understanding of the Monatele earthquake.
References
[1] Ballestreci, R., Nougier, J. and Benderitter, Y. (1983). Existence and Interpreting of
Electrically Conducting Zone within the Plateau Basalts Kerguelen Islands
(T.A.A.F.). C. R. Acad. Sc. Paris II, 296, 833-838.
[2] Bisso, D., Manguelle-Dicoum, E., Ndougsa-Mbarga, T., Tabod, C. T., Njandjock, N.
P., Njingti, N., Tadjou, J. M. and Essono, J. (2004). Geophysical Determination of
the Sanaga Fault using Audio-magnetotelluric soundings in the Ebedda region,
Cameroon. SEGMITE International, 1(1), 31-34.
[3] Cagniard, L. (1953). Basic theory of the magneto telluric method of geophysical
prospecting. Geophysics, 18, 605-635.
[4] Cornacchia, M. and Dars, R. (1983). Un trait structural majeur du continent africain.
Les linéaments centrafricains du Cameroun au golfe d’Aden. Bull. Soc. Geol. Fr.,
25, 101-109
[5] Dumont, J. F. (1986). Identification par télédétection de l'accident de la Sanaga
(Cameroun). Sa position dans le contexte des grands accidents d'Afrique Centrale et
de la limite nord du craton congolais. Géodynamique, 2(1), 55-68.
[6] Guérin, R., Tabbach, A., Benderitter, Y., Andrieux, A. (1994). Invariant for
correcting field polarization effect in MTVLF resistivity mapping. Journal of
Applied Geophysics, 32, 375-383.
[7] Jones, A. G., Kurtz, R. D., Oldenburg, D. W., Boerner, D. E. and Ellis, R. (1988).
Magneto-telluric observations along the Lithoprobe southeastern Canadian
Cordilleran transect. Geophysical Research Letters, 15(7), 677-680.
[8] Jones, A. G. (1988). Static shift of magnetotelluric data and its removal in a
sedimentary basin environment. Geophysics, 53(7), 967-978.
[9] Jones, A. G. and Garcia, X. (2003). Case History Okak Bay AMT data-set case
study: Lessons in dimensionality and scale. Geophysics, 68(1), 70-91.
[10] Manguelle-Dicoum, E., Bokossah, A. S. and Kwende-Mbanwi, T. E. (1992).
Geophysical evidence for a major Precambrian schist-granite boundary in Southern
Cameroon. Tectonophysics, 205, 43-446.
[11] Manguelle-Dicoum, E., Nouayou, A. S., Bokossah, A. S. and Kwende-Mbanwi, T.
E. (1993). Audiomagnetotelluric soundings on the basement-sedimentary transition
zone around the Eastern margin of the Douala Basin in Cameroun. J. Afr. Earth Sci.,
17(4), 487-496.
[12] Meying, A., Ndougsa-Mbarga, T. and Manguelle-Dicoum, E. (2009). Evidence of
fractures from the image of the subsurface in the Akonolinga-Ayos area (Cameroon)
by combining the Classical and the Bostick approaches in the interpretation of
audio-magnetotelluric data. Journal of Geology and Mining Research, 1(8), 159-
171.
[13] Mvondo, H., Owona, S., Mvondo-Ondoa, J. and Essono, J. (2007). The tectonic
evolution of the Yaoundé segment of the Neoproterozoic Central African Orogenic
Belt in southern Cameroun. Can. J. Earth Sci., 44, 433-444.

Imaging the Subsurface in the Cameroon Centre Region 123
[14] Ngnotue, T., Nzenti, J.P., Barbey, P. and Tchoua, F.M. (2000). The Ntui-Betamba
high grade gneisses: a northwest extension of the Pan-African Yaoundé gneisses in
Cameroon J. Afr. Earth Sci., 31, 369-381.
[15] Nzenti, J. P., Barbey, P., Macaudière, J. and Soba, D. (1988). Origin and Evolution
of the Precambrian high grade Yaoundé gneiss (Cameroon). Precambrian Res., 38,
91-109.
[16] Parasnis, D. S. (1997). Principles of Applied Geophysics. 5th edition Chapman and
Hall, London, England, 400 p.
[17] Parker, R. L. and Booker, J. R. (1996). Optimal one-dimensional inversion and
bounding of magnetotellurics apparent resistitvity and phase measurements. Physics
of the Earth and Planetary Interiors, 269-282
[18] Penaye, J., Toteu, S. F., Van Schmus, W. R. and Nzenti, J. P. (1993). U-Pb and Sm-
Nd preliminary geochronologic data on the Yaoundé Series, Cameroun: re-
interpretation of the granulitic rocks as the suture of collision in the Central African
Belt. C. R. Acd. Sci. Paris II, 317, 789-794.
[19] Pham, V. N., Boyer, D. and Chouteau, M. (1978). Mapping of apparent
pseudoresistivity by combination of Telluric-Telluric and magnetotelluric profiling.
Geophysical prospecting, 26, 218-246.
[20] Raganayaki, R .P. (1984). An interpretive analysis of magnetotelluric data.
Geophysics, 49, 1730-1748.
[21] Telford, W. M., Geldart, L. P., Sheriff, R. E., Keys, D. A. (1990). Applied
geophysics. 2th edition Cambridge University press, Cambridge, GB, 770p.
[22] Vozoff, K. (1972). The Magnetotellurics method in the exploration of sedimentary
basins. Geophysics, 37(1), 98-141.
[23] Vozoff, K. (1990). Magnetotelluric principles and practice. Proc. Indian Acad. Sci.,
99(4), 441-471.


