Imaging techniques in diabetic retinopathy - …€¦ · Web viewDiabetes mellitus is a source of...
32
An Update: Imaging techniques in diabetic retinopathy Introduction Diabetes mellitus is a source of major morbidity and mortality around the world and is rapidly increasing in prevalence. The International Diabetes Federation (IDF) estimates that 387 million people worldwide suffer from diabetes, a figure expected to increase by over 200 million in the next 20 years [1]. The increase in incidence of type 2 diabetes is particularly dramatic, with an increasing life expectancy combined with sedentary lifestyles and an obesity epidemic driving this growth [2]. The increasing number of diabetics has led to a corresponding increase in the number of patients affected by complications secondary to diabetes which include diabetic retinopathy. The increasing prevalence of diabetes will place increasing strain on an already stretched health service, both in the United Kingdom (UK) and worldwide. This highlights the need to use new and more efficient ways to both investigate and manage diabetic patients as outlined in this review. Diabetic retinopathy (DR) is a chronic and progressive disease affecting the microvasculature of the retina, and the most common microvascular complication of diabetes. Several studies have demonstrated that nearly all type 1 diabetics, and a large proportion (more than 60%) of type 2 diabetics, will have some degree of retinopathy twenty years following diagnosis [3,4]. Although not all of these patients will suffer significant visual disturbance, diabetic retinopathy remains the leading cause of blindness in the working population of developed countries [3].
-
Upload
truongcong -
Category
Documents
-
view
212 -
download
0
Transcript of Imaging techniques in diabetic retinopathy - …€¦ · Web viewDiabetes mellitus is a source of...

An Update: Imaging techniques in diabetic retinopathy
Introduction
Diabetes mellitus is a source of major morbidity and mortality around the world and is rapidly
increasing in prevalence. The International Diabetes Federation (IDF) estimates that 387 million
people worldwide suffer from diabetes, a figure expected to increase by over 200 million in the next
20 years [1]. The increase in incidence of type 2 diabetes is particularly dramatic, with an increasing
life expectancy combined with sedentary lifestyles and an obesity epidemic driving this growth [2].
The increasing number of diabetics has led to a corresponding increase in the number of patients
affected by complications secondary to diabetes which include diabetic retinopathy. The increasing
prevalence of diabetes will place increasing strain on an already stretched health service, both in the
United Kingdom (UK) and worldwide. This highlights the need to use new and more efficient ways to
both investigate and manage diabetic patients as outlined in this review.
Diabetic retinopathy (DR) is a chronic and progressive disease affecting the microvasculature of the
retina, and the most common microvascular complication of diabetes. Several studies have
demonstrated that nearly all type 1 diabetics, and a large proportion (more than 60%) of type 2
diabetics, will have some degree of retinopathy twenty years following diagnosis [3,4]. Although not
all of these patients will suffer significant visual disturbance, diabetic retinopathy remains the
leading cause of blindness in the working population of developed countries [3].
Diabetic retinopathy is asymptomatic in its early stages. By the time visual disturbance is detected,
substantial and irreversible pathology may have already developed. Many classification systems
exist, but broadly speaking DR can be classified using two main features – the presence or absence
of new vessel formation (proliferative or non-proliferative diabetic retinopathy respectively), and
the presence or absence of sub foveal macular oedema (diabetic macular oedema). The presence of
these clinical features allows the ophthalmologist to ascertain the risk of imminent visual
impairment, as well as that of future visual loss [5].
There are a growing number of imaging modalities which can be used in the screening, evaluation,
diagnosis and treatment of diabetic retinopathy. This review article aims to provide a brief overview
of the current standard in care for DR and diabetic macular oedema (DMO), before providing an up
to date overview of newer imaging techniques and how they can best be used in the management of
this important condition.

Fundus Photography and Diabetic Retinopathy Screening
With the rapidly increasing prevalence of diabetes and the potential sight threatening consequences
of untreated diabetic retinopathy, health boards across the United Kingdom recommend a thorough
screening programme in order to detect asymptomatic individuals with retinopathy at an early stage
of the disease.
The UK National Screening committee recommends that everybody with diabetes, aged 12 or over,
should be invited to diabetic eye screening once a year [5,6]. There are some regional differences in
the screening programme, however they are all based upon digital fundus photography. Digital
photography allows a clear and accurate image of the interior surface of the eye, and is relatively
easy and cost effective to perform with little discomfort to the patient. With the advent of digital
fundus photography, high quality digital colour images of the retina, retinal vessels, optic disc and
macula can be obtained quickly, even without dilatation of the pupils [7]. The images are graded for
severity of disease by qualified trained graders. Based on the grading of the retinal images, patients
are either asked to return annually or are referred on to the local ophthalmology service for further
management [8].
Fundus photography is an important imaging technique in the hospital or optometric setting to help
monitor disease progression. Digital images also enable immediate review of the images, and give
the user the ability to easily adjust or enhance the images to aid diagnosis and ongoing
management.
There have been continuing developments in the technology behind fundus photography, and there
are now several types which exist.
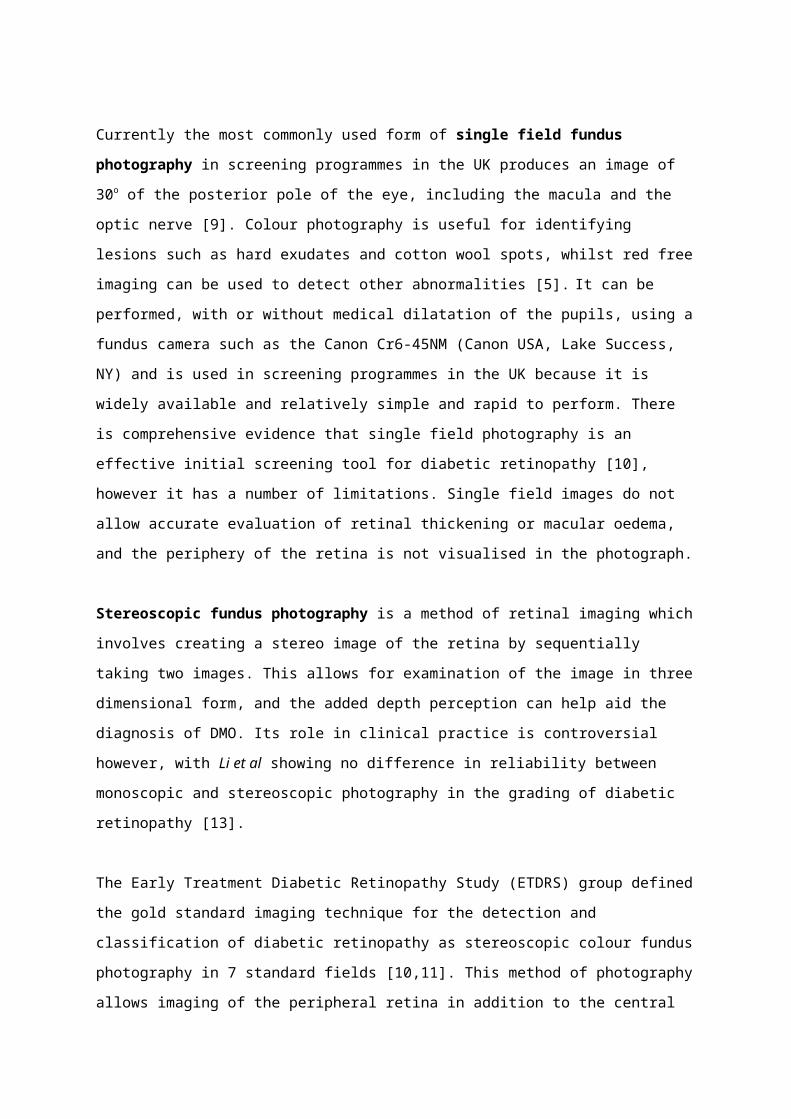
Currently the most commonly used form of single field fundus photography in screening
programmes in the UK produces an image of 30o of the posterior pole of the eye, including the
macula and the optic nerve [9]. Colour photography is useful for identifying lesions such as hard
exudates and cotton wool spots, whilst red free imaging can be used to detect other abnormalities
[5]. It can be performed, with or without medical dilatation of the pupils, using a fundus camera such
as the Canon Cr6-45NM (Canon USA, Lake Success, NY) and is used in screening programmes in the
UK because it is widely available and relatively simple and rapid to perform. There is comprehensive
evidence that single field photography is an effective initial screening tool for diabetic retinopathy

[10], however it has a number of limitations. Single field images do not allow accurate evaluation of
retinal thickening or macular oedema, and the periphery of the retina is not visualised in the
photograph.
Stereoscopic fundus photography is a method of retinal imaging which involves creating a stereo
image of the retina by sequentially taking two images. This allows for examination of the image in
three dimensional form, and the added depth perception can help aid the diagnosis of DMO. Its role
in clinical practice is controversial however, with Li et al showing no difference in reliability between
monoscopic and stereoscopic photography in the grading of diabetic retinopathy [13].
The Early Treatment Diabetic Retinopathy Study (ETDRS) group defined the gold standard imaging
technique for the detection and classification of diabetic retinopathy as stereoscopic colour fundus
photography in 7 standard fields [10,11]. This method of photography allows imaging of the
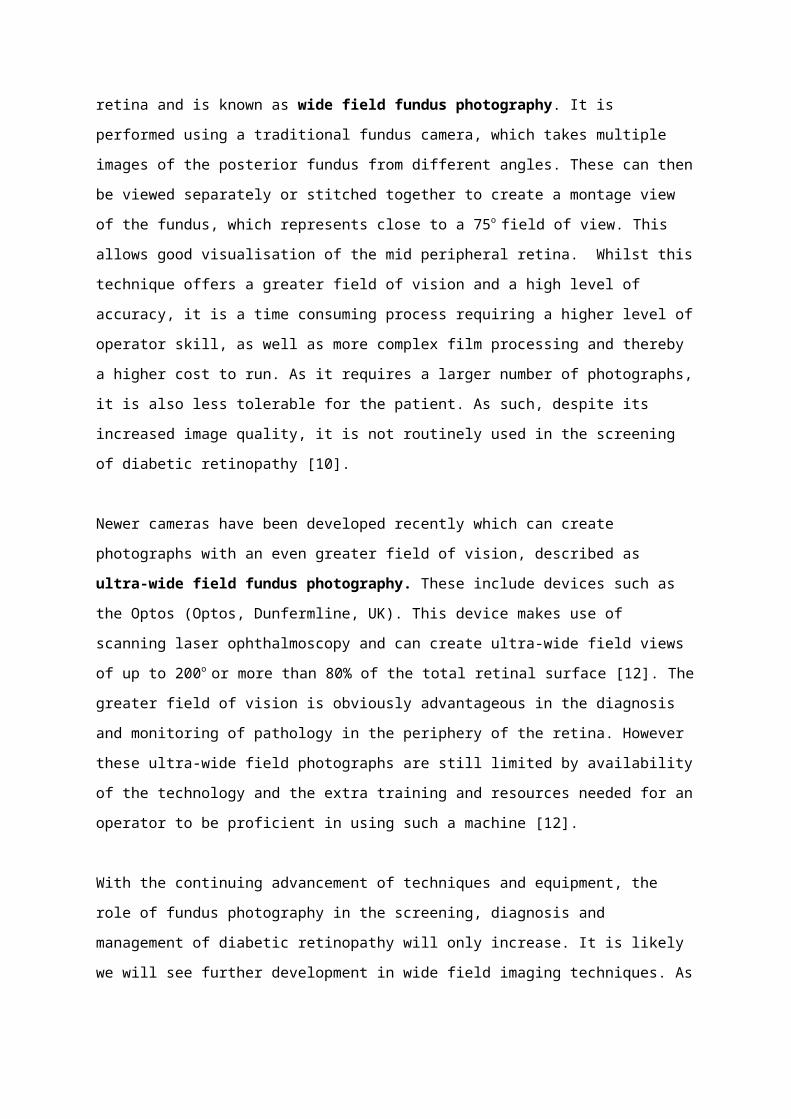
peripheral retina in addition to the central retina and is known as wide field fundus photography. It
is performed using a traditional fundus camera, which takes multiple images of the posterior fundus
from different angles. These can then be viewed separately or stitched together to create a montage
view of the fundus, which represents close to a 75o field of view. This allows good visualisation of the
mid peripheral retina. Whilst this technique offers a greater field of vision and a high level of
accuracy, it is a time consuming process requiring a higher level of operator skill, as well as more
complex film processing and thereby a higher cost to run. As it requires a larger number of
photographs, it is also less tolerable for the patient. As such, despite its increased image quality, it is
not routinely used in the screening of diabetic retinopathy [10].
Newer cameras have been developed recently which can create photographs with an even greater
field of vision, described as ultra-wide field fundus photography. These include devices such as the
Optos (Optos, Dunfermline, UK). This device makes use of scanning laser ophthalmoscopy and can
create ultra-wide field views of up to 200o or more than 80% of the total retinal surface [12]. The
greater field of vision is obviously advantageous in the diagnosis and monitoring of pathology in the
periphery of the retina. However these ultra-wide field photographs are still limited by availability of
the technology and the extra training and resources needed for an operator to be proficient in using
such a machine [12].
With the continuing advancement of techniques and equipment, the role of fundus photography in
the screening, diagnosis and management of diabetic retinopathy will only increase. It is likely we
will see further development in wide field imaging techniques. As costs for devices fall it is also likely
that adoption of the technology will become more mainstream.
Fundus Fluorescein Angiography
Fundus fluorescein angiography (FFA) is an important imaging technique used in the diagnosis and
staging of diabetic retinopathy. It remains the gold standard imaging technique for assessing the
retinal vasculature and circulation, despite first being introduced by Novotny and Alvis as long ago as
1961 [14,15]. Its use is declining, however, with the development of newer imaging modalities which
will be described later.
FFA involves the injection of sodium fluorescein into the systemic circulation as a bolus through a
peripheral vein. This is a water soluble dye which fluoresces when excited by blue light of
wavelength 465 to 490nm [16]. The fluorescein travels quickly in the body’s circulation and reaches
the arteries of the retina approximately 12 seconds after injection. Over a further short period, the
dye passes through the retinal arteries, capillaries and then veins. 10 to 15 minutes following
injection, the dye has mostly evacuated from the eye. A series of rapid sequence photographs taken
using a fundus camera with appropriate barrier and excitation filters allows the retinal and choroidal
circulations to be visualised both as moving images and as stills [17].
The normal progression of the dye is interrupted by diseases affecting the retina, choroid and retinal
vasculature. The two main abnormalities in a fluorescein angiogram are hypofluorescence, a
reduction from the expected level of fluorescence, and hyperfluorescence, an increase in the
expected level of fluorescence. Hence the fluorescein angiogram of a patient with diabetic
retinopathy reveals many irregularities which can be useful in the diagnosis, grading and
management of the disease.
Microaneurysms are the most characteristic, although not pathognomic, lesion of diabetic
retinopathy. They are easily detectable on fluorescein angiography, appearing as distinct and intense
areas of hyperfluorescence [18]. Areas of ischaemia, seen in diabetic retinopathy due to decreased
perfusion to retinal capillaries, are identified by patchy areas of hypofluorescence, as these areas
cannot fill with fluorescein containing blood [9,18]. FFA is also useful for the identification of
neovascularisation, a hallmark of proliferative diabetic retinopathy. The FFA can reveal leakage of
new vessels at the optic disc (NVD) or of new vessels elsewhere in the retina (NVE). Additionally in
DMO the FFA can highlight areas where there has been a breakdown in the blood retinal barrier, an
important identifying feature in DMO.

The identification of such features using FFA is vital in assessing the indications for, and outcomes of,
treatment methods such as laser photocoagulation, surgical intervention, and intraocular
pharmacological methods (e.g. anti VEGF therapy). Various studies have shown that laser
photocoagulation can reduce severe visual loss in patients with neovascularisation or severe non-
proliferative retinopathy [6, 19], and FFA plays a crucial role in identifying these patients and
monitoring their response to treatment.
With the advent of ultra-wide field fundus cameras as described earlier, ultra-wide field fluorescein
angiography is recently increasing in its use, providing greater imaging of the peripheral retina. This
allows easier identification of peripheral neovascularisation and peripheral retinal ischaemia which
would have otherwise been hard to visualise on standard field fundus imaging [20]. This technology
allows greater targeting of treatment, using a method known as targeted pattern retinal
photocoagulation, rather than the traditional pan retinal photocoagulation. The benefit of this is that
it targets areas of ischaemia whilst sparing better perfused areas from laser scarring [21], thereby
reducing some of the complications of pan retinal photocoagulation such as visual field loss.
A pilot study has demonstrated that this technology is effective and has a positive safety profile [21],
but full scale clinical trials are awaited.
As such, despite the advent of newer imaging modalities, fluorescein angiography remains an
important tool in the imaging of diabetic retinopathy, and ultra-wide fluorescein angiography will
likely have an increasing role in the treatment of the disease in the coming years.
FFA is usually well tolerated, however a wide range of complications are possible and should be
mentioned. The commonest adverse reactions include nausea and vomiting which occur in less than
three percent of patients [22]. More serious adverse events are very rare (<1%), but include skin
necrosis if there is extravasation of dye into local tissue, anaphylaxis, and myocardial infarction.

Optical Coherence Tomography
The development of Optical Coherence Tomography (OCT) has been the most significant advance in
DR imaging to have been developed in the last few decades. It was first introduced by Huang et al in
1991 [23]. Successive improvements in image acquisition and resolution have revolutionised
ophthalmic clinical practice. OCT is a non-invasive imaging modality which can produce a high
resolution, cross sectional image of the retina with a fast acquisition time. OCT is particularly useful
in identifying and quantifying macular oedema, and is an important tool in guiding the treatment of
patients with DMO.
OCT generates a cross sectional image by measuring the time delay and magnitude change of a
beam of light entering the eye and being reflected back from the retina, in a way analogous to
ultrasonography, using light rather than sound waves to create the image. It is based on a technique
known as low-coherence interferometry. Light is emitted from a light source and split into a
reference and a sample beam, to obtain a reflectivity versus depth profile of the retina [24]. The light
waves which are backscattered from the retina interfere with the reference beam and it is this
interference pattern which is used to create an image [24]. By combining a series of these axial scans
(A-scans) a cross-sectional reconstruction of the retina (B-Scan) can be produced. These scans can be
analysed in a variety of methods and using various software tools to allow empirical measurements
to be made (e.g. retinal thickness) and qualitative morphological information to be obtained [25].
The technology behind OCT has developed rapidly since its introduction in 1991. The first generation
of OCT was known as Time Domain Optical Coherence Tomography (TD-OCT), and was conducted
using commercially available OCT systems such as the Stratus OCT (Carl Zeiss Meditec, Inc, Dublin,
CA). In this method of OCT, a moving reference mirror is used to generate axial scans. These
machines are limited by the speed of the reference mirror, and therefore were limited to scan rates
of around 400 axial scans per second, with an axial resolution of around 10 µm [26].
There have been several advances in OCT technology since the first TD-OCT systems became
available. The use of broadband light sources in newer OCT systems has increased the axial
resolution to 2-3 µm [27], allowing far higher resolution images to be obtained and decreasing the
risk of missing pathology. The introduction of a newer generation of OCT, known as Spectral Domain
Optical Coherence Tomography (SD-OCT), has allowed a dramatic increase in the possible scanning
rates. SD-OCT does not require a movable reference mirror, but instead uses a specially designed

high speed spectrometer to simultaneously collect all the frequency signals. A mathematical
relationship known as the Fournier transform is then used to create an image [26]. SD-OCT can be
conducted using a commercially available machine including the Bioptigen SD-OCT (Bioptigen,
Research Triangle Park, NC) or the Cirrus HD-OCT (Carl Zeiss Meditec, Dublin, CA) which can achieve
scan rates of over 20,000 axial scans per second, or the Spectralis SD-OCT (Heidelberg Engineering,
Heidelberg, Germany) which can achieve 40,000 axial scans per second, with increased resolution,
resulting in a significant advancement from TD-OCT. This allows high quality images to be obtained
in a relatively short amount of time.
The images produced by OCT can show a wide variety of pathology in diabetic retinopathy. Areas of
reduced reflectivity are most often due to intra-retinal or subretinal fluid accumulation. This could
be secondary to macular oedema or retinal detachment. Other lesions seen in diabetic retinopathy
such as hard exudates, intraretinal haemorrhages and neovascular membranes, all appear as areas
of hyper reflectivity [28].
Using OCT images, it is possible to accurately and reliably measure retinal thickness [29], which
enables the detection of macular oedema, the main feature of diabetic maculopathy. OCT is
particularly useful in determining whether the oedema is centre involving or not, which is vital in
assessing which patients may benefit from anti-VEGF therapy (those with centre involoving
oedema), and which patients would benefit from laser treatment (extrafoveal oedema) [5]. Other
findings on OCT in a patient with diabetic maculopathy include intraretinal cystic changes, subretinal
fluid, flattening of the foveal depression, and tractional changes [30].
As such, OCT is playing an ever increasing role in the diagnosis of diabetic maculopathy, and in the
assessment of treatment outcomes. The technological advances in scanning speeds and image
resolutions have made OCT one of the most important imaging techniques in ophthalmology, and it
is expected that, with further innovations, the field will continue to grow in the coming years. Some
of these innovations will are described below.

Enhanced Depth Imaging OCT
Current methods of OCT are limited by the difficulty in imaging the choroid, the vascular layer
beneath the retina. Several histopathological studies have demonstrated choroidal abnormalities in
diabetic eyes [32,33], and choroidal thickness may have future potential as a marker of the severity
of the disease [24].
Enhanced Depth Imaging OCT (EDI-OCT) is a relatively recently developed adaptation of spectral
domain OCT which allows improved imaging of the choroid. This technique was first described in
2008 by Spaide et al [34], and since then numerous studies have demonstrated the utilisation of this
imaging technique in various clinical conditions, including diabetic retinopathy [35].
EDI-OCT can be performed with conventional SD-OCT equipment, and many of these devices, such
as the Spectralis OCT system (Heidelberg Engineering, Germany), now come with an EDI mode
option. Images of the choroid are obtained by positioning the device closer to the eye than in normal
practice. This results in an inverted image with the most tightly focused illumination at the level of
the choroid [36]. To improve the image and improve the signal to noise ratio, an average of multiple
images is taken. This is best accomplished using a device which has eye tracking, to allow the same
location to be imaged in multiple scans. An area of 5o by 30o is commonly used, with seven sections
each composed from one hundred averaged scans [37].
The resulting image can then be re-inverted to match the orientation of traditional OCT images. EDI-
OCT performed in this manner allows good visualisation of the choroid, and using software available
with the OCT devices it is possible to accurately and reproducibly measure choroidal thickness [36].
As described earlier with regards to swept source OCT, this ability to image the choroid is set to
become increasingly important in the management of diabetic retinopathy. EDI-OCT offers a
relatively easy way to visualise the choroid and can be performed using existing devices. Using this
technique, images of the choroid are now readily available in clinical practice, and if future studies
can demonstrate an association between diabetic retinopathy and certain choroidal abnormalities or
characteristics, EDI –OCT will play a significant role in the management of these patients.

Swept Source Optical Coherence Tomography
Swept source optical coherence tomography (SS-OCT) is one of the most recent developments in
OCT technology, and offers several advantages over the more widely available spectral domain OCT.
SS-OCT uses a narrow bandwidth laser light source which sweeps through a broad optical spectrum,
and uses a photodetector to detect backscattered light [26]. This is in contrast to SD-OCT which, as
described above, uses a broad bandwidth light source, together with a spectrometer and charge
coupled device camera to create an image.
Swept source OCT devices, such as the Triton DRI-OCT (Topcon, Japan), offer speed and sensitivity
advantages over SD-OCT devices. The scan speed in such an instrument can be well over 100,000
axial scans / second, enabling significantly faster acquisition of images and allowing wide-field
imaging, making it possible to view both the optic nerve and the macula on the same single scan
[31].
A disadvantage of spectral domain OCT is the difficulty in visualising structures deep to the retinal
pigment epithelium due to signal drop off and the scattering of light. Swept source OCT overcomes
this by using a photodetector instead of the charge coupled device camera, as well as using a longer
wavelength of light (1050 nm vs 840 nm). This allows a greater resolution of images (around 1µm) as
well as excellent visualisation of the choroidal layers which is difficult with SD-OCT.
The longer wavelength used in SS-OCT also has the advantage of overcoming media opacities, such
as cataract, when imaging the retina. This is another downfall of older OCT techniques.
Swept Source OCT is not commonly available at present; however, with the increasing understanding
of the role of the choroid in retinal disease, it is likely that it will become an important imaging
modality in the management of diabetic retinopathy in the coming years. The high resolution wide
field images and the fast acquisition rates, make this an exciting prospect for the future.

OCT Angiography
It is clear that optical coherence tomography is a vital tool in the imaging of various retinal
pathologies, and as such it has become one of the most commonly used imaging modalities in the
ophthalmology clinic. Whilst the latest devices are useful in providing high resolution 3-D images of
the structure of the retina, they are limited by the inability to visualise the vascular changes
associated with diabetic retinopathy, such as capillary drop out and new vessel formation.
Fluorescein angiography is still required to visualise such vascular abnormalities. Whilst fluorescein
angiography has played an important role in the imaging of diabetic retinopathy for many years, it is
limited by its side effect profile together with it being relatively expensive and time consuming to
perform. The images from FA are also only two-dimensional, adding difficulty to interpretation.
OCT angiography is a novel, non-invasive technique which allows the high-resolution, three
dimensional visualisation of retinal and choroidal vasculature. Several methods of using OCT to
detect retinal blood flow have been described, but the most effective method of OCT angiography
utilises a technique known as split spectrum amplitude decorrelation angiography (SSADA) [38]. This
method detects the movement of erythrocytes through retinal blood vessels by measuring the
variation in reflected OCT signal amplitude between consecutive cross-sectional scans [39]. SSADA
works to eliminate axial bulk motion from patient movement to improve the signal to noise ratio, so
that sites of movement seen between repeated cross sectional scans represent erythrocyte flow
through the vessel lumen [40]. By comparing these signal differences an accurate map of blood flow
can be produced.
OCT angiography can be performed in this manner using a device such as the recently commercially
available AngioVue OCTA system (Optovue, Inc., Fremont, CA). The software can also be installed on
some current SD-OCT or SS-OCT devices without any particular hardware modification [39].
It is currently approved for clinical use in Europe and Asia, but awaits full approval in the USA.
Fluorescein angiography is the current gold standard imaging technique for detecting retinal vascular
abnormalities, and Matsunga et al demonstrated that OCT angiograms were at least equivalent in
showing vascular detail as fluorescein angiograms [40,44].
Fluorescein angiography has known limitations in imaging the vasculature of all the retinal layers. A
study by Spaide et al, showed that while fluorescein angiography could not image radial peripapillary

or the deep capillary networks well, OCT angiography was able to image all layers of the vasculature
non-invasively [41]. At present, OCT angiography is able to capture up to an 8mm by 8mm view of
the retina with adequate resolution to detect retinal and choroidal vascular abnormalities [39]. Each
scan takes only approximately six seconds to take.
A recent prospective pilot study by Ishibazawa et al, investigated the use of OCT angiography in
diabetic retinopathy [42]. Their results demonstrated that OCT angiography was effective at
detecting microaneurysms and retinal non perfused areas, as well as providing quantitative
information about neovascularisation. Other studies have also shown OCT angiography to be useful
in identifying neovascularisation [43].
Some limitations of OCT angiography are important to note. These include the inability to
adequately visualise leakage from vessels, its current limited field of view (although this is likely to
increase in the future), and the difficulty in imaging in the presence of lens opacity such as cataract,
which is a common finding in diabetic patients.
OCT angiography remains an emerging imaging technique with a huge potential for use in both a
clinical and research setting. It offers many advantages over fluorescein angiography as have been
described, but further studies are required to prove its clinical utility in the context of diabetic
retinopathy. It is likely that OCT angiography will become one of the most important imaging
techniques in the management of diabetic retinopathy in the years to come. The fact that it is non-
invasive and quick to perform, means that it could also serve as a useful monitoring method in
future clinical trials into new treatments for diabetic retinopathy.

Fundus Autofluorescence
Fundus autofluorescence (FAF) is a non-invasive retinal imaging modality which has been developed
over the last ten years. It uses the autofluorescent properties of pigments in the retina to generate
images which can be used in the diagnosis and management of various retinal disorders.
The predominant source of autofluorescence in the ocular fundus is lipofuscin, a pigment which
accumulates in the retinal pigment epithelium as a by-product of metabolism and cell function [45].
When excited by short to medium wavelength light, lipofuscin granules autoflouresce, emitting
borad spectrum of light with a peak wavelength of 630nm which can be imaged in several ways.
There are two main methods of creating images using FAF; using a confocal scanning laser
ophthalmoscope (cSLO) such as the Heidelberg Retinal Angiograph (HRA2, Heidelberg Engineering,
Germany), or by modifying a fundus camera such as the Topcon fundus camera (Topcon, Japan), as
described by Spaide et al in 2003 [48]. Both of these techniques are frequently used in practice,
however they use different wavelengths to obtain the images. The cSLO uses a 488 nm laser for
excitation and a barrier filter at 500nm or 520nm [49], the same wavelengths used in fluorescein
angiography. The modified fundus cameras use an excitation filter at 580 and a barrier filter at
695nm [48]. Despite the differences in wavelength used, both methods of FAF imaging produce
similar images demonstrating fundus autofluorescence, although there are some small differences
[49]. The longer wavelengths used in the fundus camera for example, mean the images produced
show a much lesser extent of macular pigment absorption, and the signal is less decreased over
blood vessels and the optic nerve head [54].
FAF images appear similar in appearance to fluorescein angiograms in their grey scale
representation. Retinal vessels appear dark on the images due to blood flow blocking the
autofluorescence signal from the RPE. The optic nerve and foveal area also both appear dark, or
hypofluorescent, on a normal FAF image. Areas of hyperfluorescence are caused by an increase in
autofluorescence signal and can be caused by reduced clearance by the RPE, increased turnover of
photoreceptors, increase in other cells such as macrophages which contain lipofuscin, and window
defects [16]. Areas of hypofluorescence are conversely caused by a decrease in AF signal and are
caused by RPE loss or inactivity amongst others [16].

Lipofuscin deposits increase with age [46], but excessive accumulation is associated with various
retinal diseases, most notably age related macular degeneration [47]. Its role and potential in
diabetic retinopathy is being increasingly studied.
DMO is a common complication of diabetic retinopathy and a leading cause of visual disturbance.
Studies have shown that fundus autofluorescence imaging is effective at detecting cystoid macular
oedema with high sensitivity and specificity [50,51], offering a useful non-invasive method of
studying the disease. Macular oedema is visualised by areas of hyperfluorescence at the macula,
thought to be due to the disruption of macular pigment by the intraretinal fluid resulting in
reduction in the masking effect of macular pigment and increased penetration of the natural
autofluorescence of the lipofuscin in that area. The amount of hyperfluorescence would appear to
correlate with the severity of the macular oedema [52].
The detection of macular oedema by fundus autofluorescence has been shown to correlate well with
the findings of optical coherence tomography [51] and fluorescein angiography [50]. As such, fundus
autofluorescence is a useful imaging modality in both clinical care and in research in diabetic
maculopathy. It can plays a role in understanding the pathophysiological disease, aiding in diagnosis,
monitoring the efficacy of therapeutic interventions and identifying markers for of disease
progression [53]. New developments such as widefield imaging, and quantitive measurement of
autofluorescence which has been shown possible in mice studies so far [54], will serve to increase
the clinical utility of fundus autofluorescence imaging in the years to come.
Fundus autofluorescence is already commonly used in the management of retinal disorders such as
age related macular degeneration, and it is likely that, with further research, it will become an
increasingly useful imaging modality in diabetic retinopathy in the next decade.

Retinal Oximetry
Diabetic retinopathy has been shown in preliminary studies to be associated with changes in the
oxygen saturations of retinal vessels [56,57,58]. Hardarson et al demonstrated that retinal vessel
oxygen saturation is higher in patients with DR than normal controls. Possible explanations for this
include the shunting of blood to bypass non-perfused capillaries, resulting in some areas of the
retina becoming hypoxic whilst blood in larger vessels has higher oxygen saturations [56]. Another
possible explanation is the decreased oxygen consumption by retinal tissue damaged by diabetic
retinopathy [59]. A separate study by Hammer et al showed a trend of increasing arterial and venous
oxygen saturations correlating to the severity of retinopathy in diabetic patients [57], a trend also
supported by Khoobehi et al [58].
Hypoxia is a key factor in the pathogenesis of DR, and is particularly important in the development of
retinal neovascularisation, the hallmark of proliferative diabetic retinopathy [60]. By monitoring
retinal vessel saturations in patients with early or no retinopathy, there is the potential to recognise
early signs of vascular compromise before the clinical signs of retinopathy are visible on examination
[61]. Measuring saturations in patients with known retinopathy may play an increasing role in the
monitoring of the disease and measuring the outcomes following treatment.
Retinal oximetry is an imaging technique which allows the non-invasive measurement of the relative
oxygen saturations of retinal blood vessels. It was first described by Hickam et al in 1959, and has
advanced significantly since then [62]. Currently, the most popular device for measuring retinal
oxygen saturations is the Oxymap Retinal Oximeter (Oxymap, Reykjavik, Iceland). This device is
attached to a conventional fundus camera (Topcon, Japan) which is operated in the same manner as
for digital fundus photography. The device simultaneously captures to images of the same are of the
retina at two different wavelengths of light, 570nm, which is insensitive to oxygen saturation, and
600nm, which is sensitive to oxygen saturation [63]. The two images are then processed using
specialised software (Oxymap Analyser Software, Oxymap, Reykjavik, Iceland). The software
automatically detects blood vessels and calculates the light absorbance (optical density) along the
vessels at the two different wavelengths. The ratio of the two optical densities has been shown to
have an inverse and approximately linear relationship to the oxygen saturation of the vessels [64]. In
this way the oxygen saturation of the blood flowing through retinal vessels can be calculated.

As research continues to improve the reliability and sensitivity of retinal oximetry, it will play an
increasing role in the management of various retinal vascular disorders. Further studies are needed
to confirm the findings of preliminary studies in diabetic retinopathy. Once these have been
validated, retinal oximetry will become a useful imaging technique in the early diagnosis, and
continued management of this condition.

Conclusion
In summary, diabetic retinopathy is a potentially blinding condition which is increasing rapidly in its
prevalence around the world. The effective imaging of the condition is vital to the screening,
diagnosis, treatment and management of the disease, as well as in the research of future
therapeutic interventions. Imaging in ophthalmology is a rapidly evolving field, and this review
article aims to summarise some of the most important current imaging modalities, as well as looking
at some of the latest imaging techniques with great future potential.

References
1. International Diabetes Foundation (IDF): The Diabetes Atlas 6th edition. Available at: http://www.idf.org/diabetesatlas (last accessed May 20th 2015)
2. King H, Aubert RE, Herman WH. Global burden of diabetes, 1995–2025: prevalence, numerical estimates, and projections. Diabetes Care 1998; 21: 1414–1431
3. Klein R, Klein BE, Moss SE, Davis MD, DeMets DL. The Wisconsin Epidemiologic Study of Diabetic Retinopathy. II. Prevalence and risk of diabetic retinopathy when age at diagnosis is less than 30 years. Arch Ophthalmol 1984; 102: 520–526
4. Aiello LP, Gardner TW, King GL, Blankenship G, Cavallerano JD, Ferris III FLet al. Diabetic retinopathy. Diabetes Care 1998; 21: 143–156
5. The Royal College of Ophthalmologists: Diabetic Retinopathy Guidelines, December 2012. Available at: https://www.rcophth.ac.uk/wp-content/uploads/2014/12/2013-SCI-301-FINAL-DR-GUIDELINES-DEC-2012-updated-July-2013.pdf (last accessed May 2015)
6. Scottish Intercollegiate Guidelines Network. SIGN Guideline 116: Management of diabetes. Available at: http://www.sign.ac.uk/pdf/sign116.pdf (last accessed May 2015)
7. De Boever, P., Louwies, T., Provost, E., et al. Fundus Photography as a Convenient Tool to Study Microvascular Responses to Cardiovascular Disease Risk Factors in Epidemiological Studies. J. Vis. Exp. (92), e51904, doi:10.3791/51904 (2014).
8. Peto T, Tadros C. Screening for Diabetic Retinopathy and Diabetic Macular Edema in the United Kingdom. Curr Diab Rep (2012) 12:338–345
9. Salz DA, Witkin AJ. Imaging in Diabetic Retinopathy. Middle East African Journal of Ophthalmology. 2015;22(2):145-150. doi:10.4103/0974-9233.151887.
10. Williams GA, Scott IU, Haller JA, et al. Single-field fundus photography for diabetic retinopathy screening: A report by the American Academy of Ophthalmology. Ophthalmology, Volume 111, Issue 5, May 2004, Pages 1055–1062
11. Early Treatment Diabetic Retinopathy Study Research Group. Grading diabetic retinopathy from stereoscopic color fundus photographs—an extension of the modified Airlie House classification. ETDRS report no. 10. Ophthalmology, 98 (1991), pp. 786–806
12. Witmer MT, Kiss S. The clinical utility of ultra-wide-field imaging. Rev Ophthalmol. 2012. [Last accessed May 2015]. Available at: http://www.reviewofophthalmology.com/content/d/retinal_insider/c/32799
13. Li H, Hubbard L, Danis RP, et al. Monoscopic versus Stereoscopic Retinal Photography for Grading Diabetic Retinopathy Severity. Investigative Ophthalmology & Visual Science June 2010, Vol.51, 3184-3192.
14. Spaide RF, Klancnik JM, Jr, Cooney MJ. Retinal Vascular Layers Imaged by Fluorescein Angiography and Optical Coherence Tomography Angiography. JAMA Ophthalmol. 2015;133(1):45-50.

15. Novotny HR, Alvis DL. A method of photographing fluorescence in circulating blood in the human retina. Circulation. 1961;24:82-86.
16. Chopdar A, Aung T. Multimodal Retinal Imaging. Published by JP Medical Limited. 2014.
17. Ilginis T, Clarke J, Patel PJ. Ophthalmic imaging. Br Med Bull (2014) 111 (1): 77-88
18. Vink R. Fluorescein Angiography in Diabetic Retinopathy. Leiden: [publisher not identified], 1969.
19. Davis MD, Fisher MR, Gangnon RE, et al. Risk factors for high-risk proliferative diabetic retinopathy and severe visual loss: Early Treatment Diabetic Retinopathy Study Report #18. Invest Ophthalmol Vis Sci 1998;39(2):233-52
20. Wessel M, Aaker G, Parlitsis G et al. Ultra-wide field angiography improves the detection and classification of diabetic retinopathy. Retina. 32(4):785-791, April 2012.
21. Muqit, M. M. K., Marcellino, G. R., Henson, D. B., et al(2013), Optos-guided pattern scan laser (Pascal)-targeted retinal photocoagulation in proliferative diabetic retinopathy. Acta Ophthalmologica, 91: 251–258.
22. Kwiterovich KA, Maguire MG, Murphy RP, et al. Frequency of adverse systemic reactions after fluorescein angiography. Results of a prospective study. Ophthalmology. 1991;98:1139–42
23. Huang D, Swanson E, Lin C, et al. Optical Coherence Tomography. Science. 1991;254:1178–81
24. Adhi M, Duker JS. Optical coherence tomography – current and future applications. Current opinion in ophthalmology. 2013;24(3):213-221.
25. Strong J. Retinal OCT Imaging. Penn State Hershey Eye Center. Ophthalmic Photographers Society. Available at: http://www.opsweb.org/?page=RetinalOCT (last accessed June 2015)
26. Gabriele M, Wollstein G, Ishikawa H, et al. Optical Coherence Topography: History, current status, and laboratory work. Invest Ophthalmol Vis Sci. 2011 Apr 14;52(5):2425-36
27. Drexler W, Morgner U, Ghanta R. Ultrahigh-resolution ophthalmic optical coherence tomography. Nat Med. 2001 Apr; 7(4): 502–507
28. Sikorski, Bartosz L. et al. “The Diagnostic Function of OCT in Diabetic Maculopathy.” Mediators of Inflammation 2013 (2013): 434560.
29. Ge J, Luo R, Guo Y. Corrective change of retinal thickness measured by optical coherence tomography and histologic studies. Yan Ke Xue Bao 1999; 15(3): 153-5, 78
30. BuAbbud J, Al-latayfeh M, Sun J. Optical Coherence Tomography Imaging for Diabetic Retinopathy and Macular Edema. Current Diabetes Reports. 2010. 10:129
31. Michalewska Z, Michalewski J, Nawrocki J. Swept Source OCT: Wide-field simultaneous choroid, retina, and vitreous visualization. Retina Today. September 2013
32. Cao J, McLeod DS, Merges CA, Lutty GA. Choriocapillaris degeneration and related pathologic changes in human diabetic eyes. Arch Ophthalmol 116:589–597

33. Shiragami C, Shiraga F, Matsuo T, et al. Risk factors for diabetic choroidopathy in patients with diabetic retinopathy. Graefe’s Arch Clin Exp Ophthalmol (2002) 240:436–442
34. Spaide RF, Koizumi H, Pozzoni MC. Enhanced depth imaging spectral-domain optical coherence tomography. Am J Ophthalmol. 2008;146(4):496-500.
35. Querques G, Lattanzio R, Querques L, et al. Enhanced depth imaging optical coherence tomography in type 2 diabetes. Invest Ophthalmol Vis Sci 53:6017–6024
36. Spaide RF. Aplications for OCT Enhanced Depth Imaging. Retina Today. September 2011
37. Spaide RF, Holz FG. Medical Retina: Focus on Retinal Imaging. Chapter 15: Choroidal Imaging with Optical Coherence Tomography. Springer (Heidelberg) 2010.
38. Jia Y, Tan O, Tokayer J, et al. Split-spectrum amplitude-decorrelation angiography with optical coherence tomography. Optics Express. 2012;20(4):4710-4725.
39. Jia Y, Bailey S, Hwang T, et al. Quantitative optical coherence tomography angiography of vascular abnormalities in the living human eye. PNAS 2015 112 (18) E2395-E2402
40. DeCarlo T, Romano A, Waheed N, et al. A review of optical coherence tomography angiography (OCTA). International Journal of Retina and Vitreous (2015) 1:5
41. Spaide RF, Klancnik JM, Cooney M. Retinal Vascular Layers Imaged by Fluorescein Angiography and Optical Coherence Tomography Angiography. JAMA Ophthalmol. 2015;133(1):45-50
42. Ishibazawa A, Nagaoka T, Takahashi A, et al. Optical Coherence Tomography Angiography in Diabetic Retinopathy: A Prospective Pilot Study. American Journal of Ophthalmology. Volume 160, Issue 1. July 2015
43. Jia Y, Bailey ST, Wilson DJ, et al. Quantitative optical coherence tomography angiography of choroidal neovascularization in age-related macular degeneration. Ophthalmology 2014;121(7):1435–1444.
44. Matsunaga D, Puliafito CA, Kashani AH. OCT Angiography in Healthy Human Subjects. Ophthalmic Surg Lasers Imaging Retina. 2014;45(6):510–5
45. Sepah YJ, Akhtar A, Sadiq MA, et al. Fundus autofluorescence imaging: Fundamentals and clinical relevance. Saudi Journal of Ophthalmology (2014) 28, 111–116
46. Wing GL, Blanchard GC, Weiter JJ. The topography and age relationship of lipofuscin concentration in the retinal pigment epithelium. Invest. Ophthalmol. Vis. Sci. 1978; 17(7):601-607
47. Dorey CK, Wu G, Ebenstein D, et al. Cell loss in the aging retina. Relationship to lipofuscin accumulation and macular degeneration. Invest. Ophthalmol. Vis. Sci. 1989;30(8):1691-1699
48. Spaide RF. Fundus autofluorescence and age-related macular degeneration. Ophthalmology. 2003 Feb;110(2):392-9.
49. Deli A, Moetteli L, Ambresin A, et al. Comparison of fundus autofluorescence images acquired by the confocal scanning laser ophthalmoscope (488 nm excitation) and the modified Topcon fundus camera (580 nm excitation). Int Ophthalmol (2013) 33:635–643

50. McBain VA Forrester JV Lois N . Fundus autofluorescence in the diagnosis of cystoid macular oedema. Br J Ophthalmol. 2008;92 946–949
51. Pece A, Isola V, Holz F, et al. Autofluorescence Imaging of Cystoid Macular Edema in Diabetic Retinopathy. Ophthalmologica 2010;224:230–235
52. Ebrahimiadib N, Riazi-Esfahani M. Autofluorescence Imaging for Diagnosis and Follow-up of Cystoid Macular Edema. Journal of Ophthalmic & Vision Research. 2012;7(3):261-267.
53. Murphy R. Fundus Autofluorescence: An Emerging Window on the Retina. Retinal Physician, Volume: 10 , Issue: April 2013, page(s): 26 27 28
54. Sparrow JR, Blonska A, Flynn E, et al. Quantitative Fundus Autofluorescence in Mice: Correlation With HPLC Quantitation of RPE Lipofuscin and Measurement of Retina Outer Nuclear Layer Thickness. Investigative Ophthalmology & Visual Science. 2013;54(4):2812-2820. doi:10.1167/iovs.12-11490.
55. Schmitz-Valckenberg S, Holz FG, Bird AC, Spaide RF. Fundus autofluorescence imaging: Review and perspectives. Retina. 2008;28:385-409.
56. Hardarson SH, Stefánsson E. Retinal oxygen saturation is altered in diabetic retinopathy. Br J Ophthalmol 2012;96:560-3
57. Hammer M Vilser W Riemer T Diabetic patients with retinopathy show increased retinal venous oxygen saturation. Graefes Arch Clin Exp Ophthalmol . 2009; 247: 1025–1030
58. Khoobehi B, Firn K, Thompson H, et al. Retinal Arterial and Venous Oxygen Saturation Is Altered in Diabetic Patients. Invest. Ophthalmol. Vis. Sci. 2013;54(10):7103-7106.
59. Hardarson SH. Retinal Oximetry. Acta Ophthalmologica (2013), 91: 1–47
60. Engerman RL. Pathogenesis of diabetic retinopathy. Diabetes 1989;38:1203-6.
61. Ibrahim MA, Annam RE, Sepah YJ, et al. Assessment of oxygen saturation in retinal vessels of normal subjects and diabetic patients with and without retinopathy using Flow Oximetry System. Quantitative Imaging in Medicine and Surgery. 2015;5(1):86-96.
62. Hickam JB, Sieker HO, Frayser R. Studies of retinal circulation and A-V oxygen difference in man. Trans Am Clin Climatol Assoc 1959;71:34–4
63. Olafsdottir OB, Eliasdottir TS, Kristjansdottir JV, et al. (2015) Retinal Vessel Oxygen Saturation during 100% Oxygen Breathing in Healthy Individuals. PLoS ONE 10(6) DOI:10.1371/journal.pone.0128780
64. Beach JM, Schwenzer K, Srinivas S, Kim D, Tiedeman JS. Oximetry of retinal vessels by dual-wavelength fundus imaging: calibration and influence of pigmentation. J Appl Physiol. 1999 Feb;86(2):748-58


![The Guide - Diabetic Retinopathy - Vision Lossvisionloss.org.au/wp-content/uploads/2016/05/The... · the guide [diabetic retinopathy] What is Diabetic Retinopathy? Diabetic Retinopathy](https://static.fdocuments.in/doc/165x107/5e3ed00bf9c32e41ea6578a8/the-guide-diabetic-retinopathy-vision-the-guide-diabetic-retinopathy-what.jpg)