Imaging Acute Stroke and Cerebral Ischemiaspinwarp.ucsd.edu/NeuroWeb/PPT/stroke-acute-45.pdf ·...
77
Imaging Acute Stroke and Cerebral Ischemia John R. Hesselink, M.D. Department of Radiology University of California San Diego
-
Upload
truongquynh -
Category
Documents
-
view
223 -
download
0
Transcript of Imaging Acute Stroke and Cerebral Ischemiaspinwarp.ucsd.edu/NeuroWeb/PPT/stroke-acute-45.pdf ·...

Imaging Acute Stroke
and Cerebral Ischemia
John R. Hesselink, M.D.
Department of Radiology
University of California
San Diego
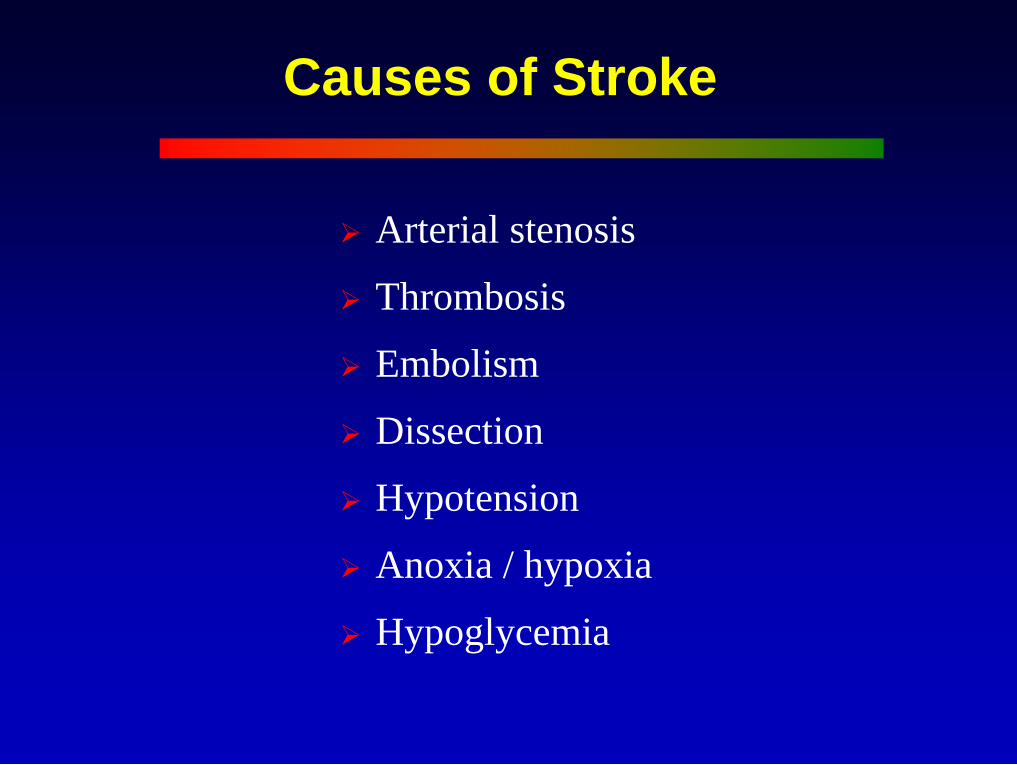
Causes of Stroke
Arterial stenosis
Thrombosis
Embolism
Dissection
Hypotension
Anoxia / hypoxia
Hypoglycemia

Imaging Acute Stroke
Abnormal vascular density / signal
Vascular enhancement
Loss of gray / white contrast
Cortical swelling
Sulcal effacement
Ventricular compression
MRA \ CTA
Conventional Imaging

History: 85 y/o man with a right hemiparesis
291
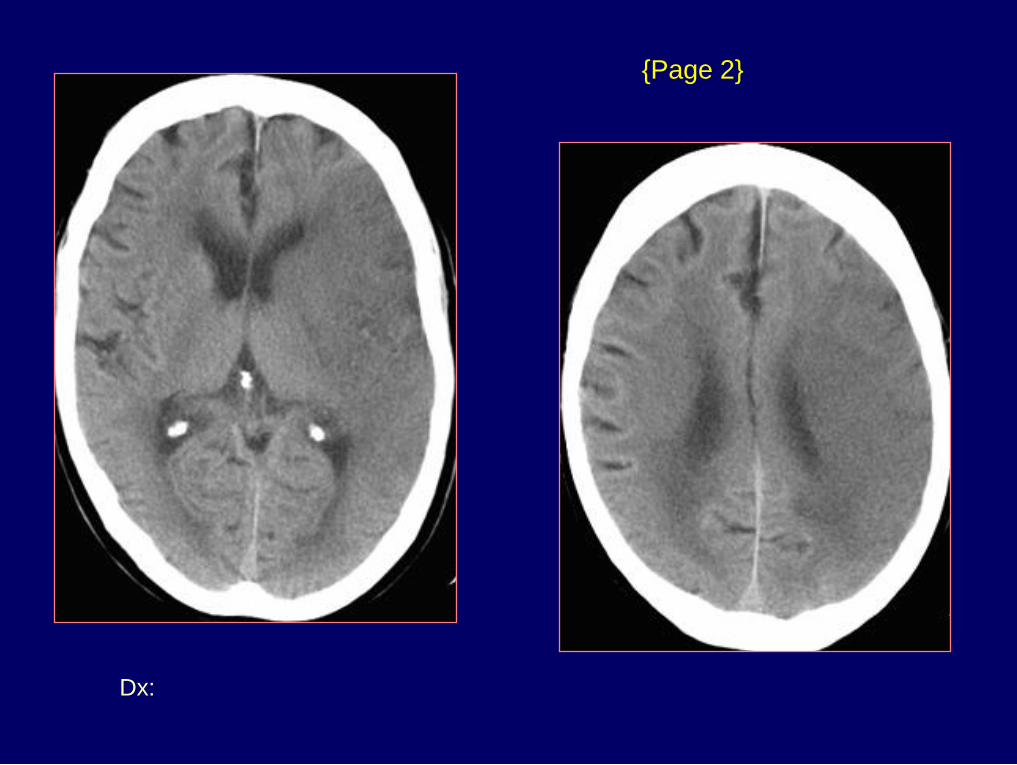
Dx: MCA embolus with
cerebral infarction
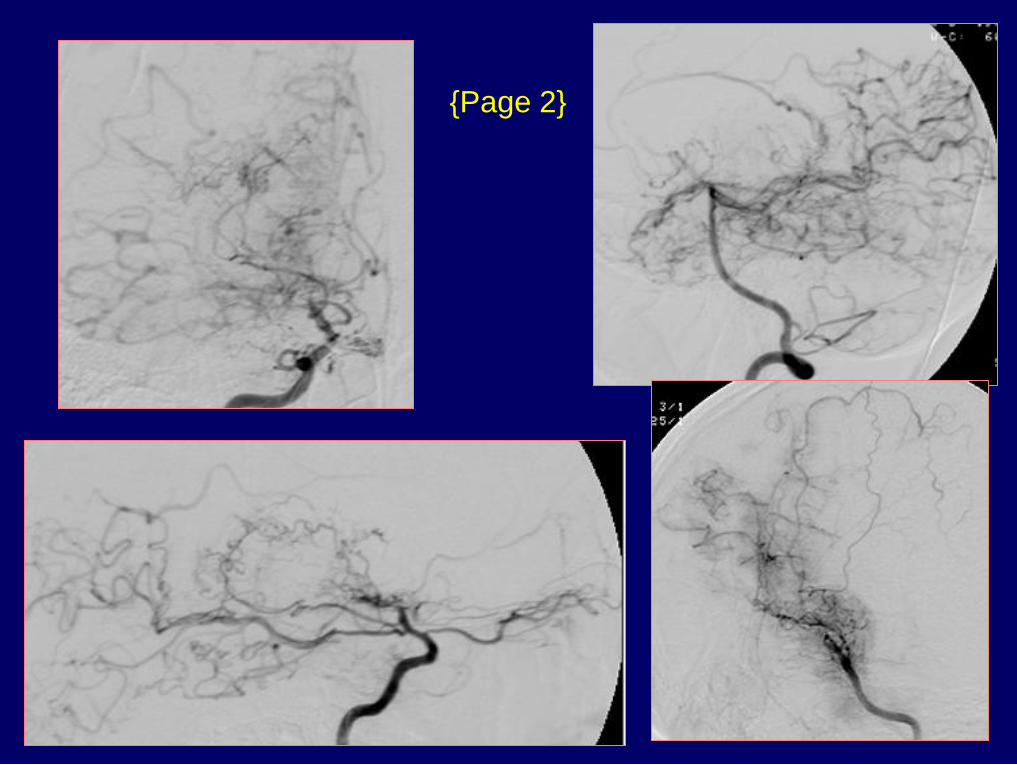
{Page 2}
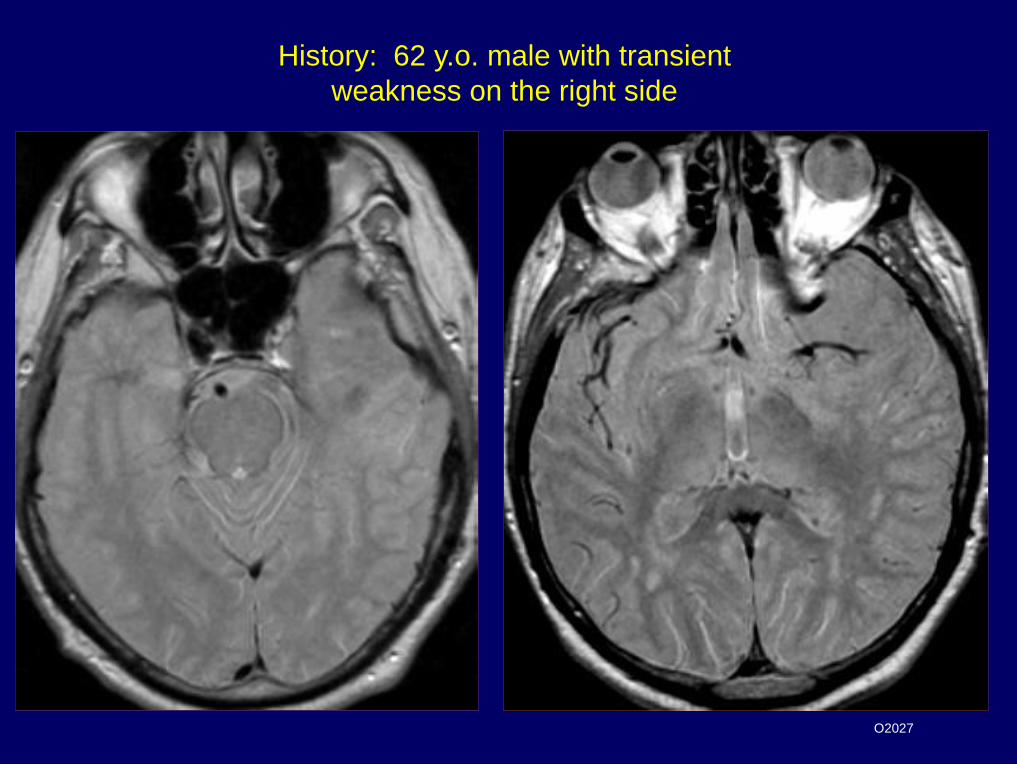
History: 62 y.o. male with transient
weakness on the right side
O2027

Dx: Left carotid occlusion
{Page 2}

History: 58 y.o. man
with altered mental status

History: 59 y/o woman with headache
and left-sided weakness
187
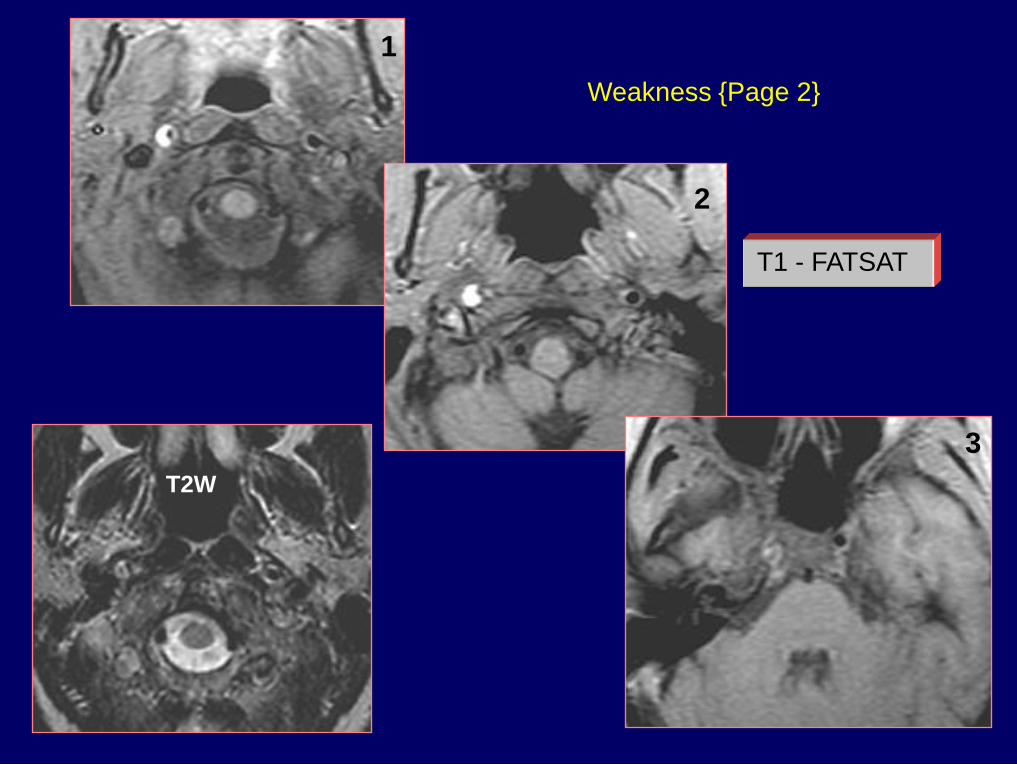
Weakness {Page 2}
T1 - FATSAT
1
2
3
T2W

Dx: Right ICA dissection
{Page 3}

History: 37 y/o HIV+ female with acute
right sided weakness
172
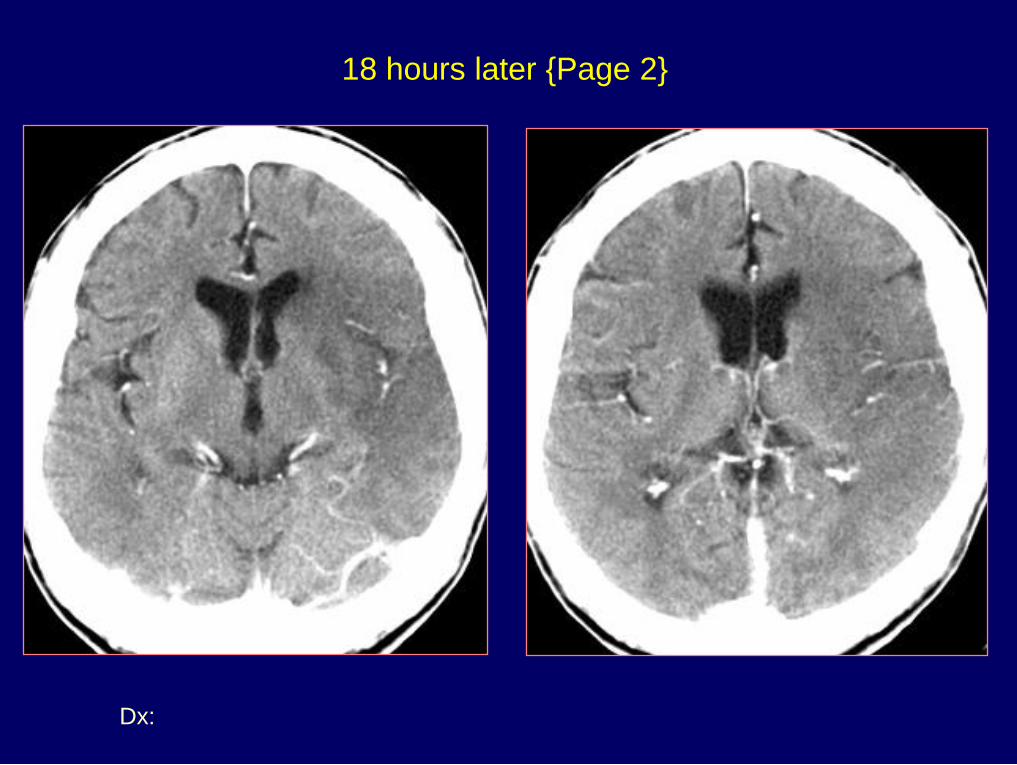
Dx: Acute MCA infarct
18 hours later {Page 2}

History: 50 y/o male with acute right hemianopsia
following coronary artery angioplasty & stenting
666

{Page 2}
Treated with intra-arterial TPA
1 day later

{Page 3}

Dx: Hemorrhagic occipital infarct
{Page 4}
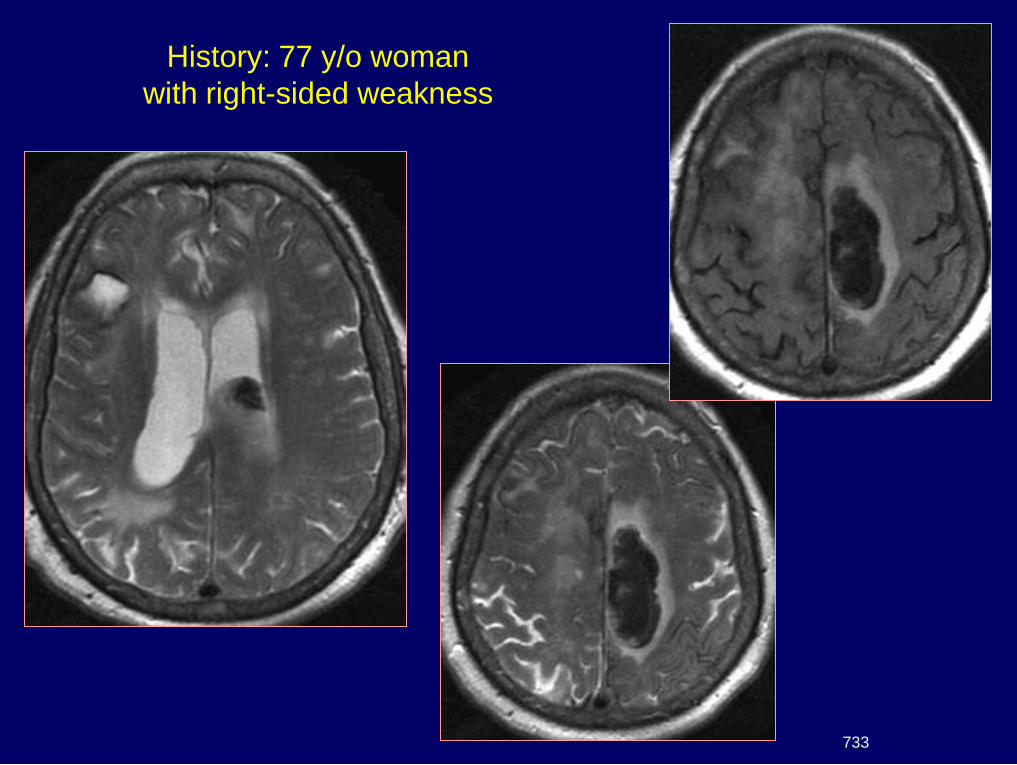
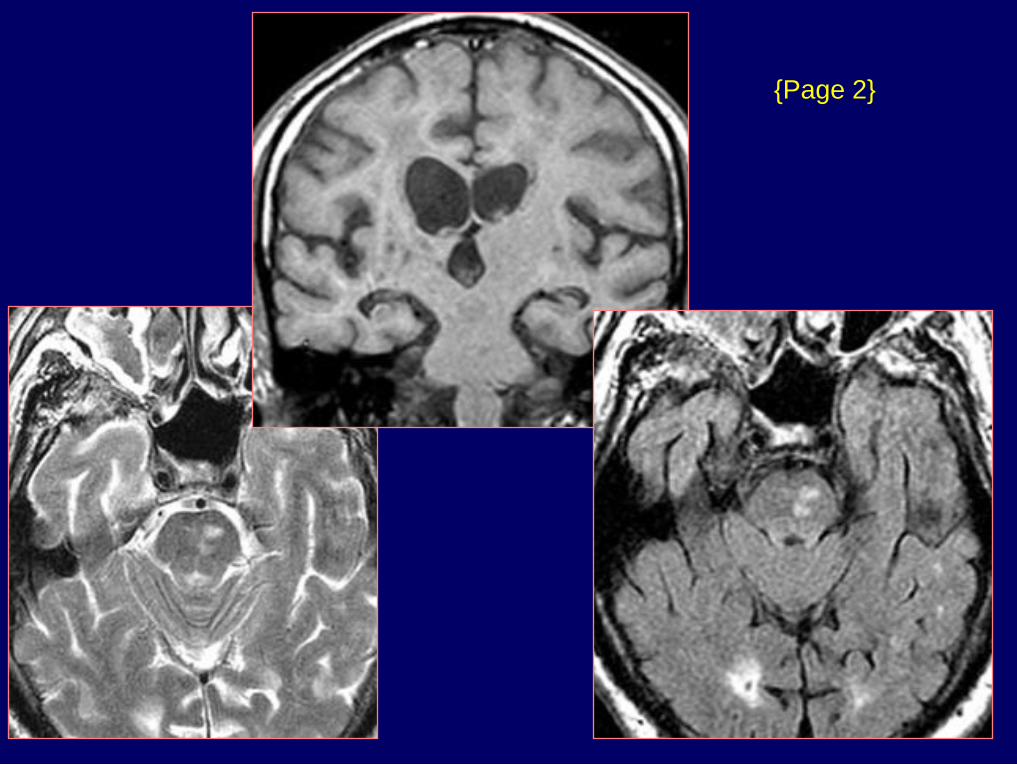
History: 77 y/o woman
with right-sided weakness
733

{Page 2}

Dx: Amyloid angiopathy
{Page 3}

Diffusion and
Perfusion Imaging
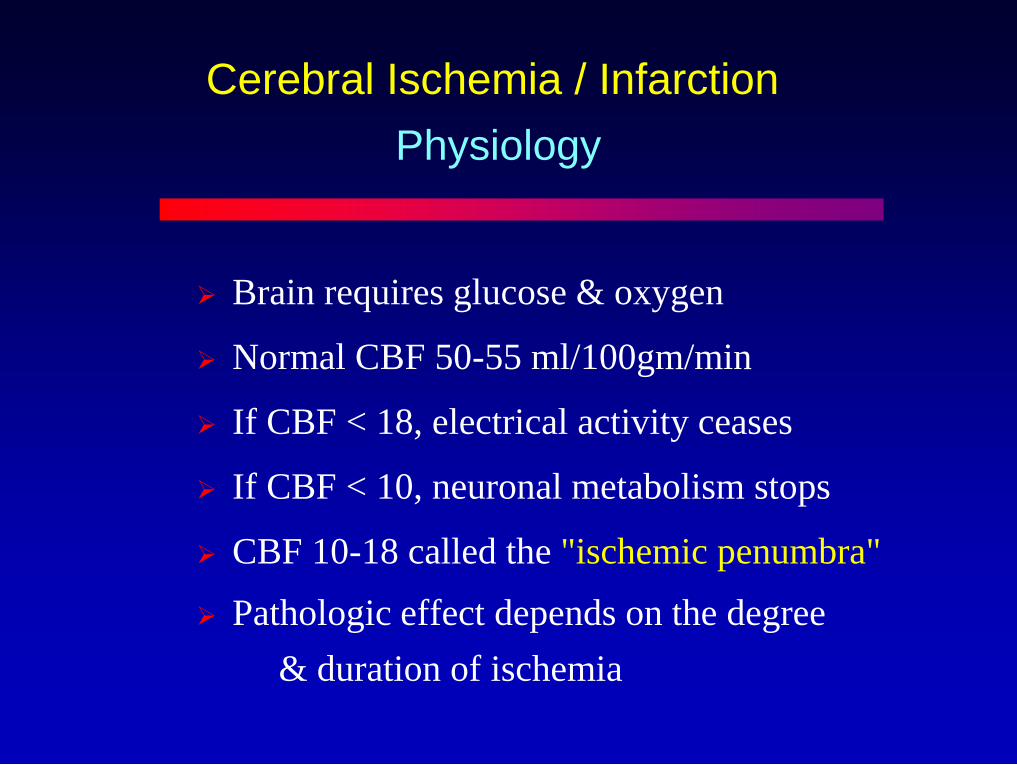
Cerebral Ischemia / Infarction
Brain requires glucose & oxygen
Normal CBF 50-55 ml/100gm/min
If CBF < 18, electrical activity ceases
If CBF < 10, neuronal metabolism stops
CBF 10-18 called the "ischemic penumbra"
Pathologic effect depends on the degree
& duration of ischemia
Physiology

Diffusion Weighted Imaging
Random molecular movement
or "Brownian motion"
Addition of a pair of strong gradient pulses
1st pulse - dephases the spins
2nd pulse - rephases spins if no net movement
If net movement of spins occurs between gradient
pulses, signal attenuation occurs
Physical Principles
Warach S: Diffusion & Perfusion MRI, in Clinical MRI, Edelman et al, Saunders, Chap. 26, pp 828-850

Acute Cerebral Ischemia
Diffusion-Weighted Imaging
CBF lowered to < 10 ml/100gm/min
Cell membrane Na – K pump fails
Net movement of water from extracellular
to intracellular compartment
Diffusion restricted by cell membranes
ADC & signal intensity on DWI

History: 47 y/o man with von-Hippel-Lindau
disease & new left arm weakness
486

Dx: Infarct & MCA stenosis
{Page 2}
ADC
DWI
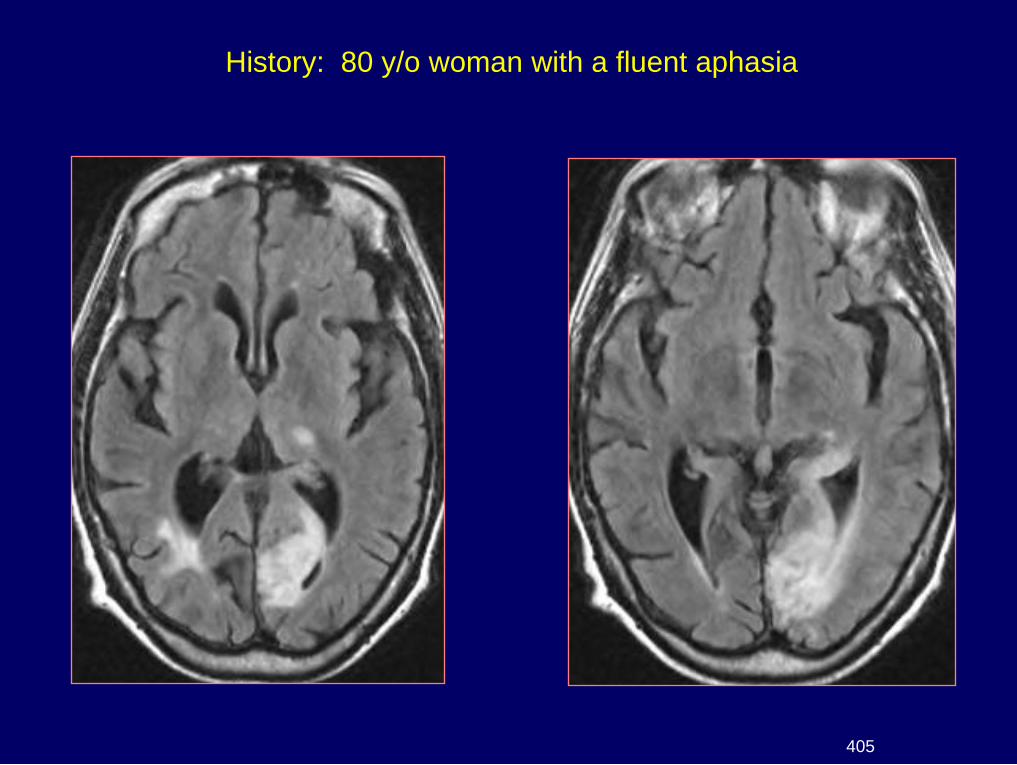
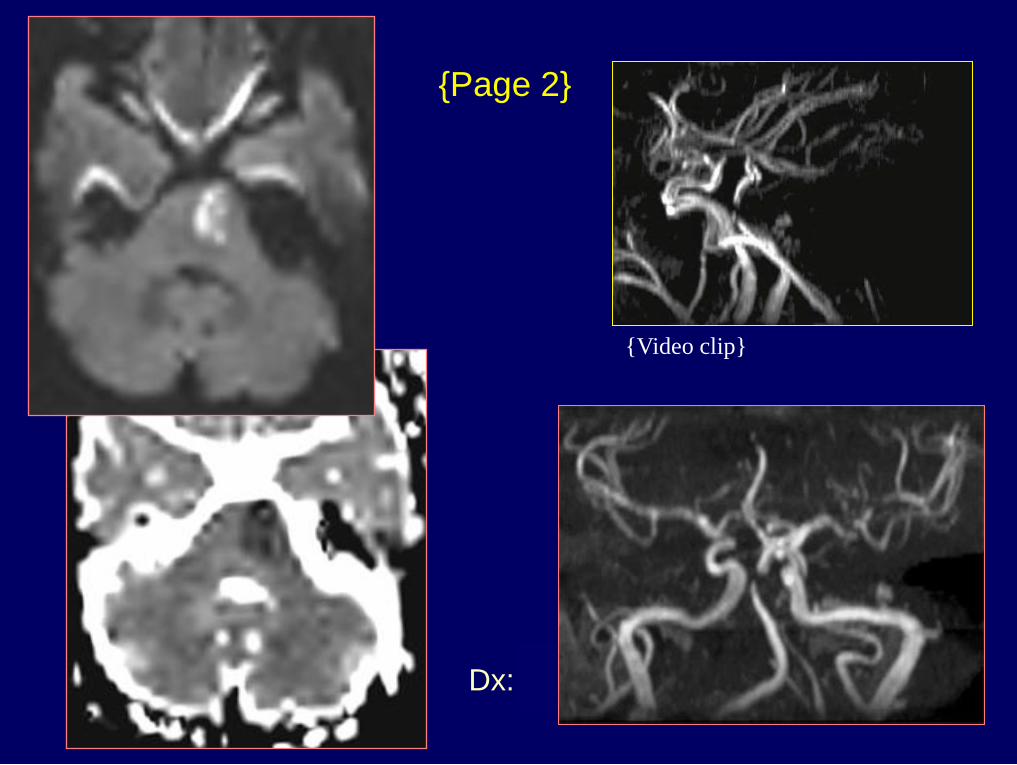
History: 80 y/o woman with a fluent aphasia
405
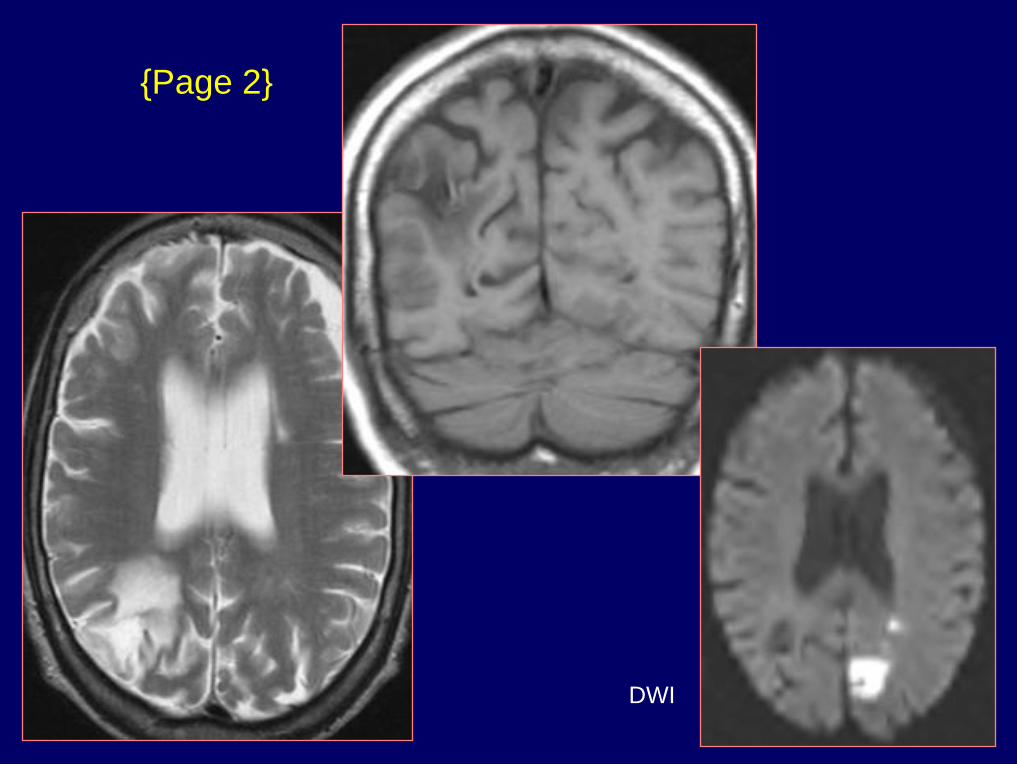
{Page 2}
DWI

Dx: Acute & chronic strokes
{Page 3}
DWI

History: 73 y/o woman with weakness
427
Dx: Acute pontine infarct
{Page 2}
{Video clip}

History: 76 y.o. male with vertebral-basilar TIA's
119

Dx: FLAIR & Diffusion - DWMI
TIA's {Page 2}

History: 64 y/o man with bilateral
leg weakness & ataxia
347
{Page 2}
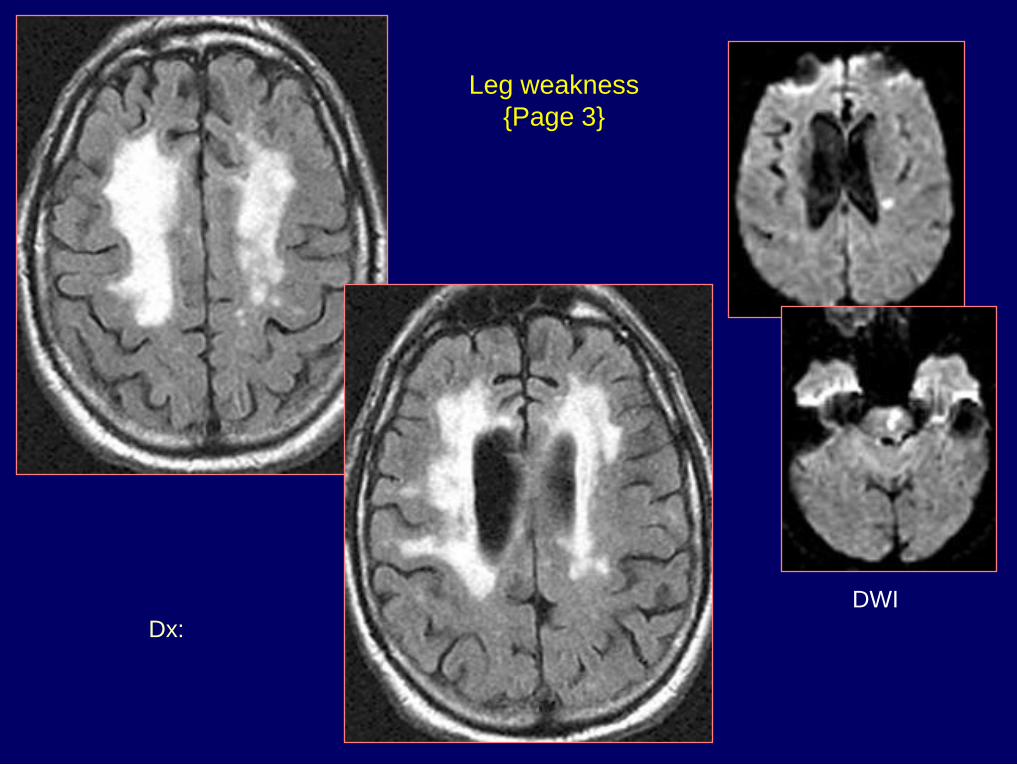
Dx: Acute infarcts in pons
& left corona radiata
Leg weakness
{Page 3}
DWI

History: 16 y/o male
with new onset of seizures
350

{Page 2}
Diffusion
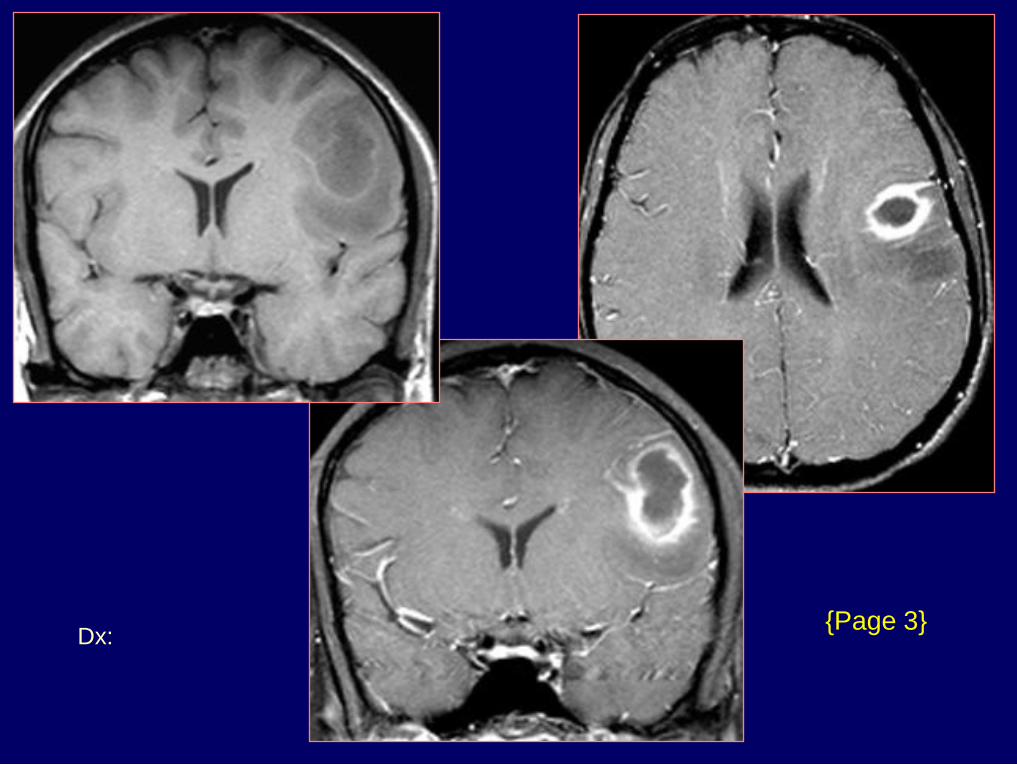
Dx: Brain abscess -
Streptococcus milleri
{Page 3}

History: 63 y/o man with seizures for 8 years
365
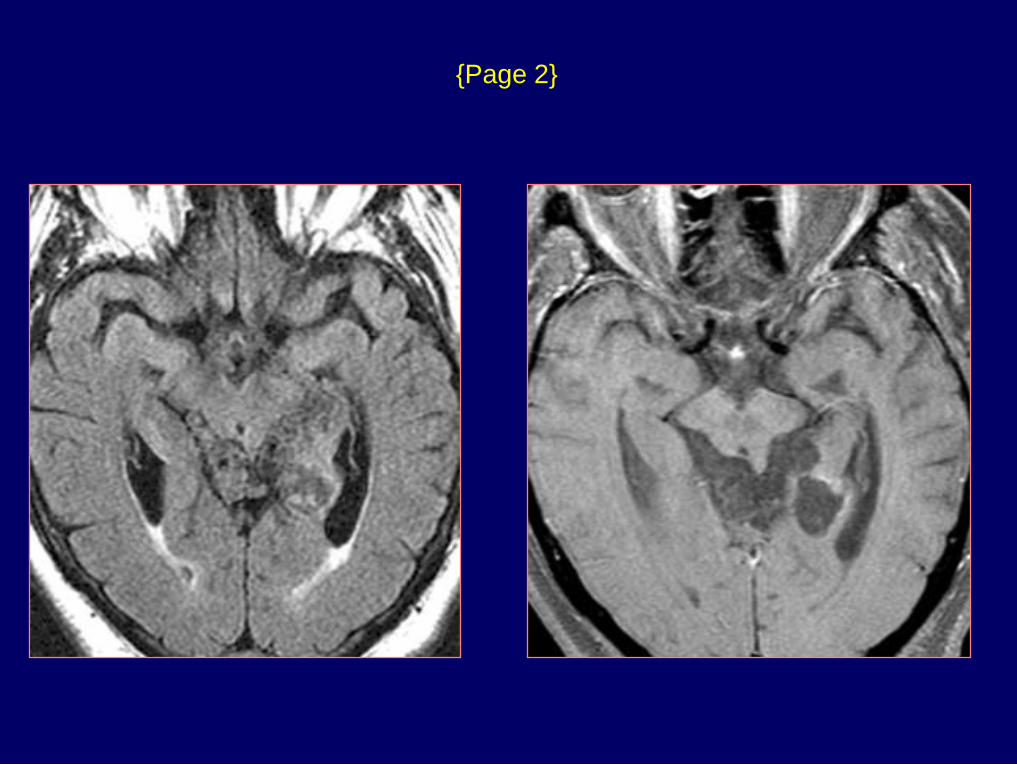
{Page 2}

Dx: Epidermoid
{Page 3}
Diffusion
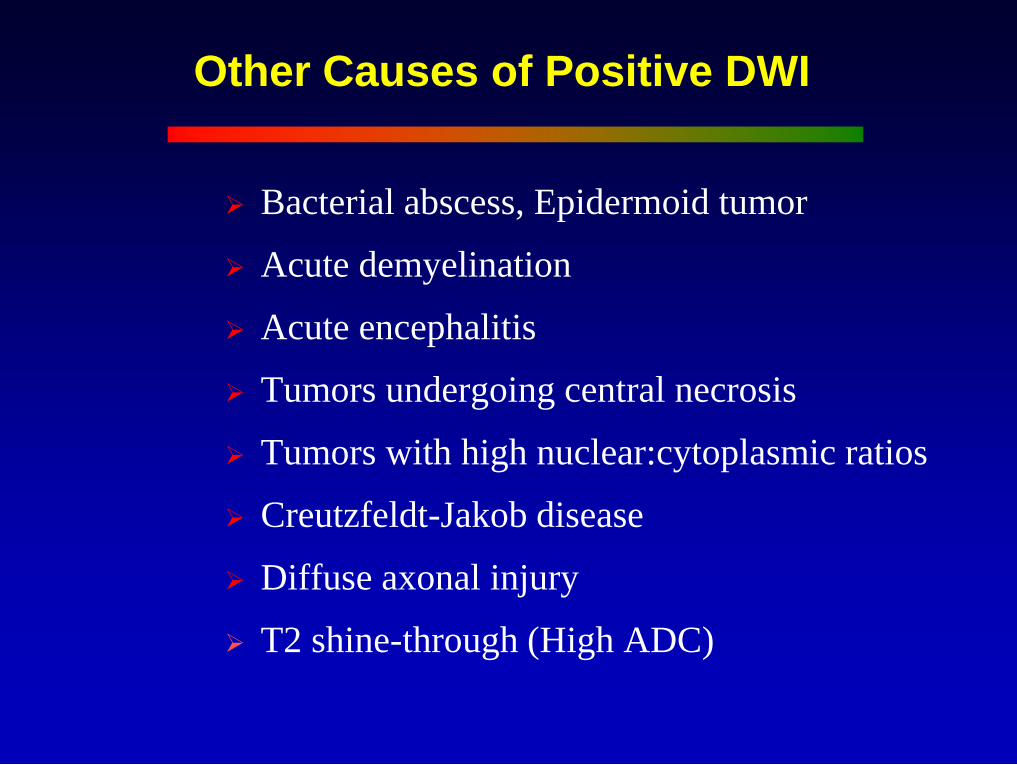
Other Causes of Positive DWI
Bacterial abscess, Epidermoid tumor
Acute demyelination
Acute encephalitis
Tumors undergoing central necrosis
Tumors with high nuclear:cytoplasmic ratios
Creutzfeldt-Jakob disease
Diffuse axonal injury
T2 shine-through (High ADC)

Perfusion Techniques
Cerebral blood flow PET
Xenon CT
CT and MRI Vascular transit time
Cerebral blood volume

CT Perfusion
80-120 kVp, 180-250 mAs
2 – 8 sections / 5 – 10 mm thick
Acquire 1 image set per second
40 second acquisition
40 ml of contrast (300-370 mg I/ml)
Inject 5-8 ml / sec
Technique

CT Perfusion
Time – Density Curve
5 10 15 20 25 30 35
Injection Time (sec)
rCBF = rCBV / MTT
HU
Baseline
TTP
Normal
Area = rCBV MTT
TTP CVA

History: 38 y/o male with a left hemiparesis
752
DWI
ADC
{Page 2}

Dx: MCA embolus & stroke
{Page 3}
MTT CBV CBF
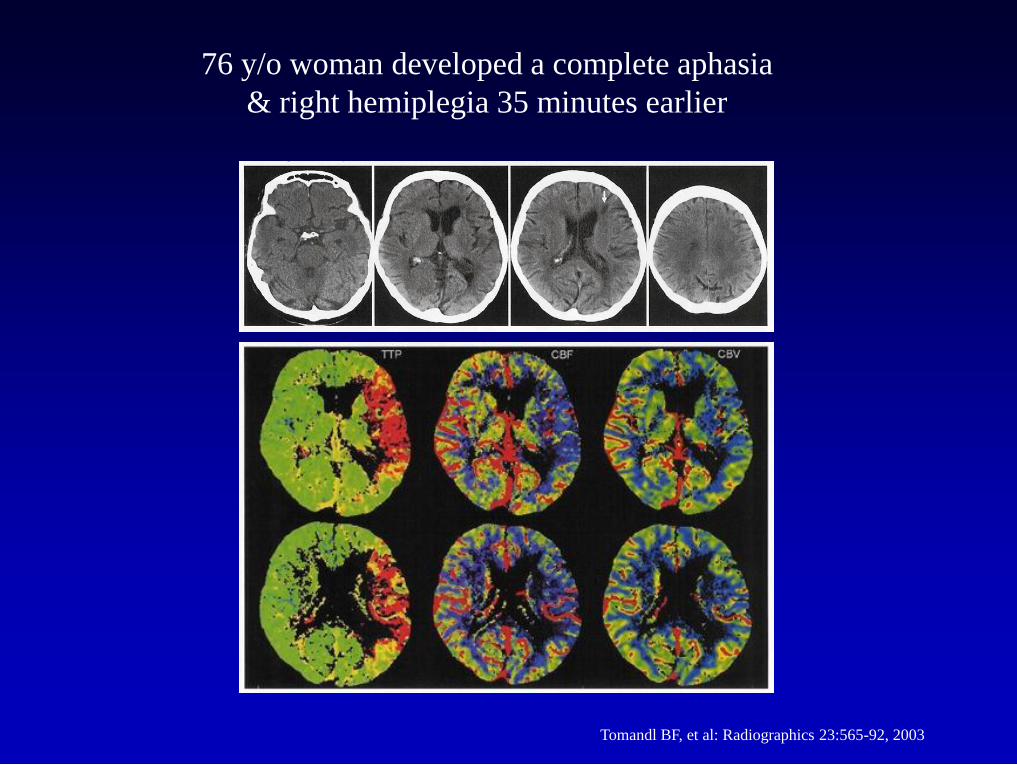
Tomandl BF, et al: Radiographics 23:565-92, 2003
76 y/o woman developed a complete aphasia
& right hemiplegia 35 minutes earlier

Symptoms resolved completely within 2 hours
24 hours later
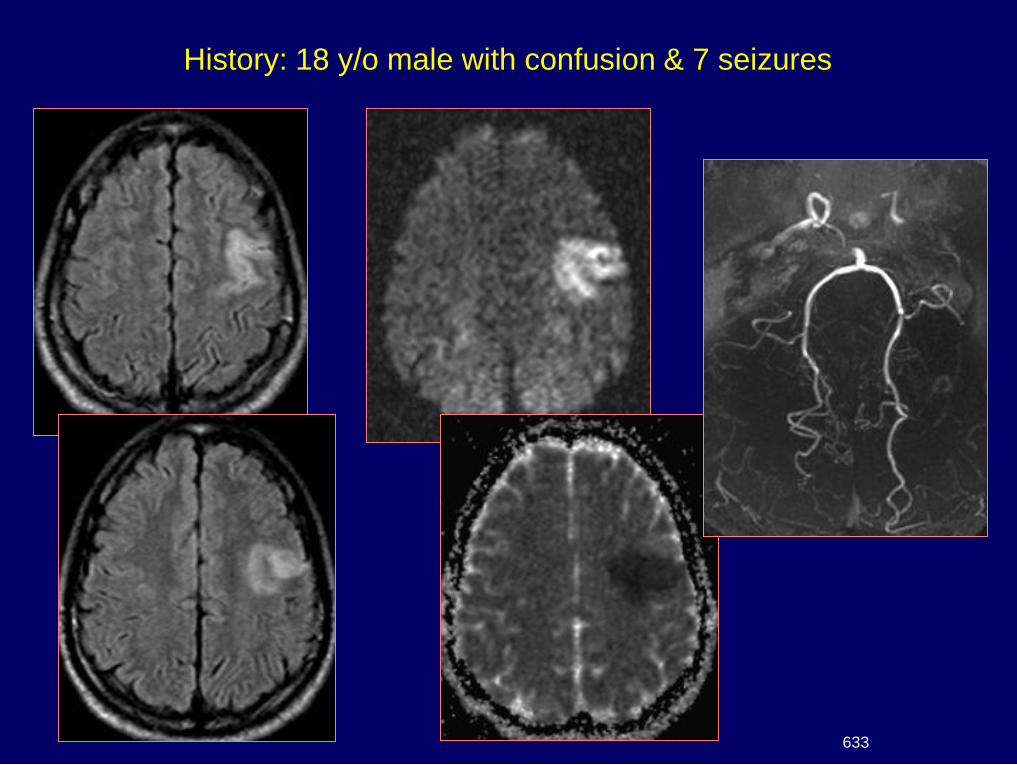
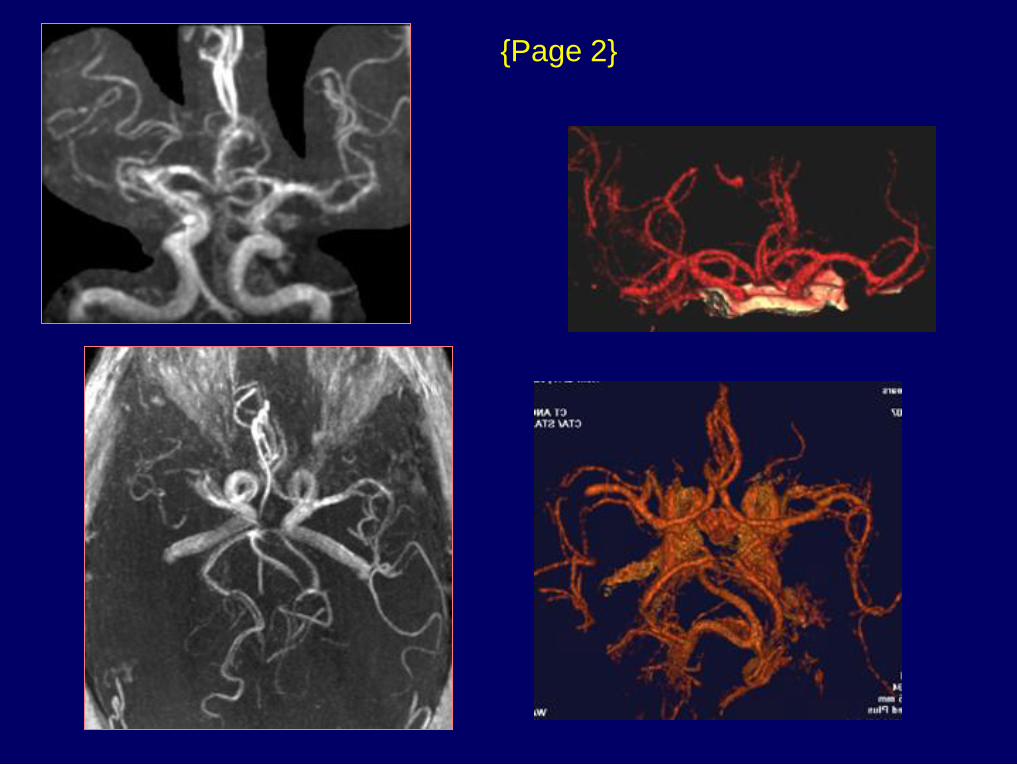
History: 18 y/o male with confusion & 7 seizures
633
{Page 2}
Dx: Moya Moya
{Page 3}

MR Perfusion Methods
Intravascular magnetic susceptibility
- Inject bolus of gadolinium
- Obtain time-intensity curve
- Measure area under curve
EPISTAR (QUIPSS)
- Tag in-flowing blood with 180o inversion pulse
- Presaturate slice of interest
- 90o readout pulse to slice
- Repeat sequence without tag
- Subtract 4 from 3
- Signal difference proportional to perfusion

EPI Perfusion Sequence
Gadolinium injection
TR = 1000 msec; 90o flip angle
TE = 60 msec
Fat saturation
Matrix = 128 x 128
Acquisition time = 40 sec
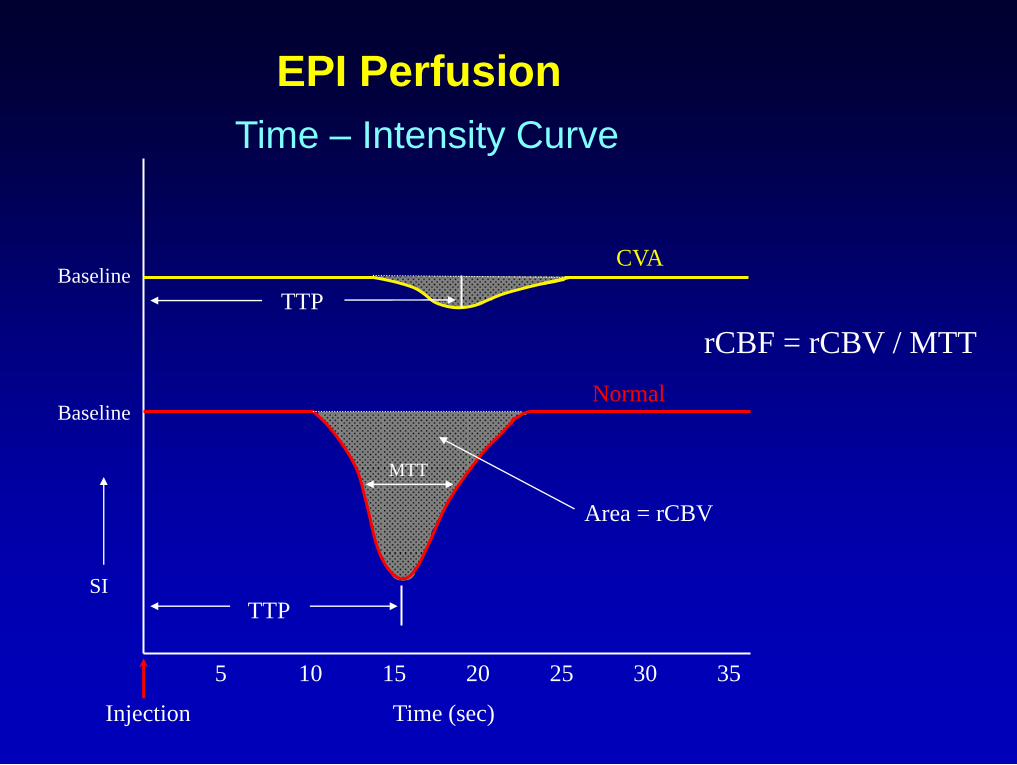
EPI Perfusion
Time – Intensity Curve
5 10 15 20 25 30 35
rCBF = rCBV / MTT
SI
Baseline Normal
Area = rCBV
TTP
MTT
Injection Time (sec)
Baseline
TTP
CVA

History: 38 y/o man with altered mental
status & a right hemiparesis
631
DWI
ADC

Dx: Embolic MCA infarct – right
ventricular cardiac thrombus
{Page 2}
Perfusion TTP rMTT
rCBV CBV/MTT= rCBF
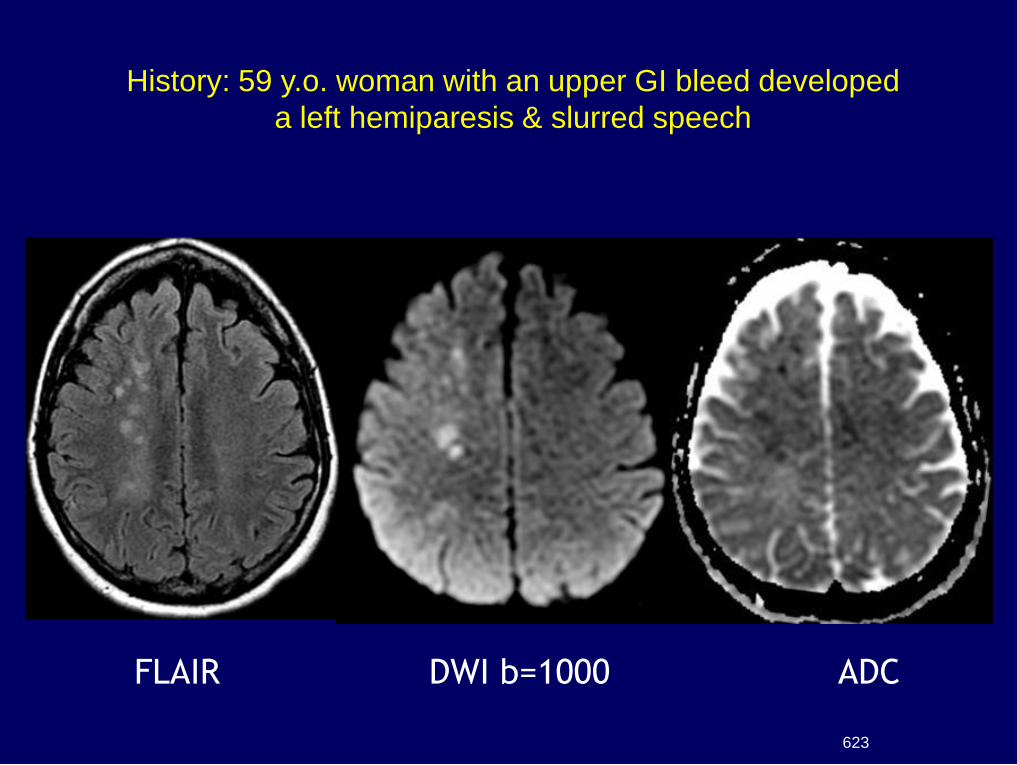
FLAIR DWI b=1000 ADC
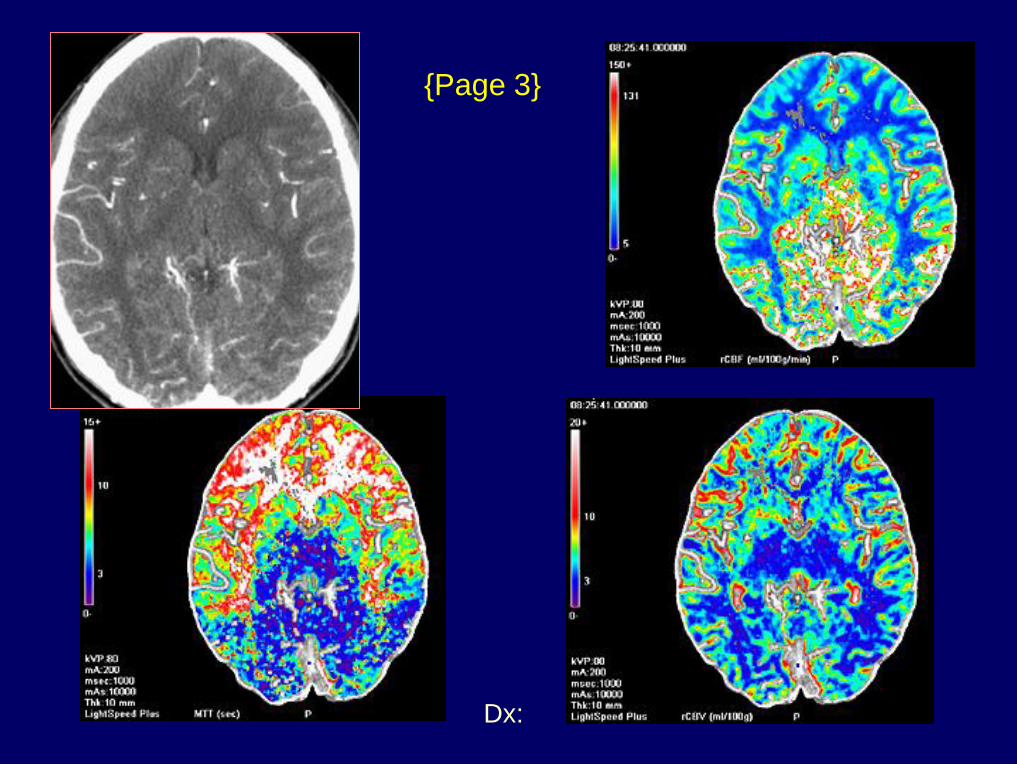
History: 59 y.o. woman with an upper GI bleed developed
a left hemiparesis & slurred speech
623

3D-TOF
CE-MRA CTA
{Page 2}

Perfusion TTP rMTT
DWI rCBV CBV/MTT=rCBF

CT perfusion
{Page 4}
rCBV rCBF
rMTT

Dx: DWI/PWI mismatch
{Page 5}
CT perfusion
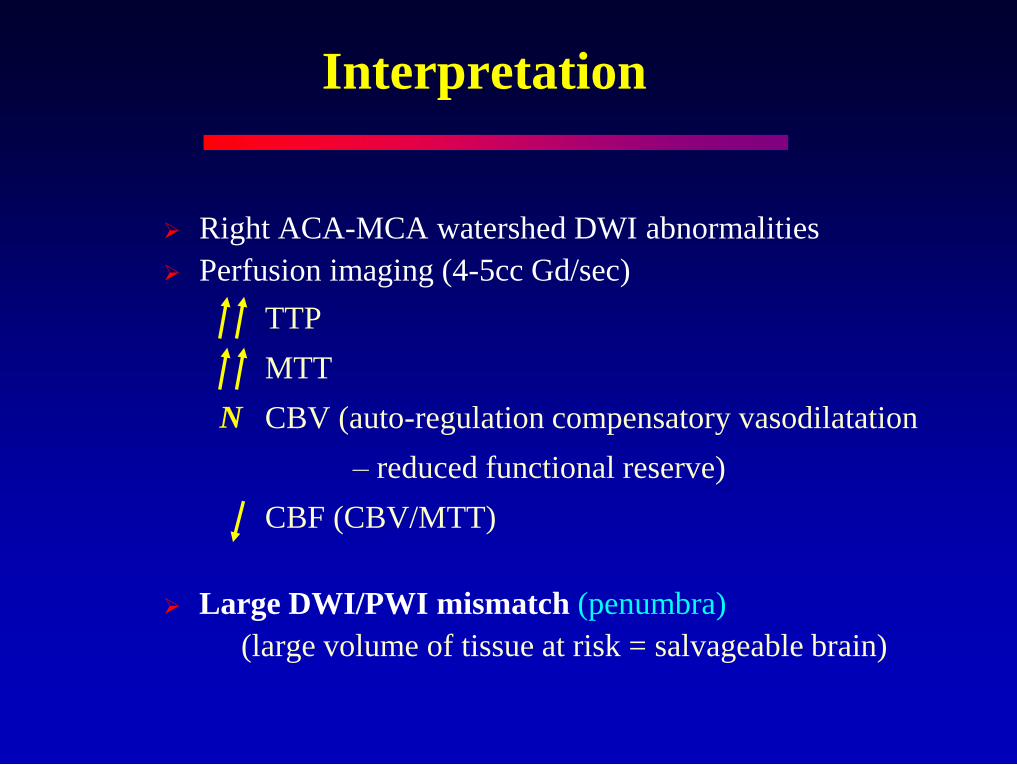
Interpretation
Right ACA-MCA watershed DWI abnormalities
Perfusion imaging (4-5cc Gd/sec)
TTP
MTT
CBV (auto-regulation compensatory vasodilatation
– reduced functional reserve)
CBF (CBV/MTT)
Large DWI/PWI mismatch (penumbra)
(large volume of tissue at risk = salvageable brain)
N

Ischemic Penumbra
DWI / PWI Mismatch
Diffusion Abnormality
CBF < 10 ml/100g/min
Cytotoxic edema
Irreversible ischemia
Perfusion Abnormality
CBF = 10-18 ml/100g/min
Neuronal paralysis
Reversible ischemia Penumbra

History: 56 y/o woman with hypertension
& hyperlipidemia developed
dysarthria & left facial droop
635

Dx: Acute infarct with matched
DWI and perfusion
{Page 2} MTT
rCBV
rCBF TTP

History: 40 y/o male metamphetamine
abuser developed acute bilateral arm
numbness, leg weakness & dysarthria
627

{Page 2}
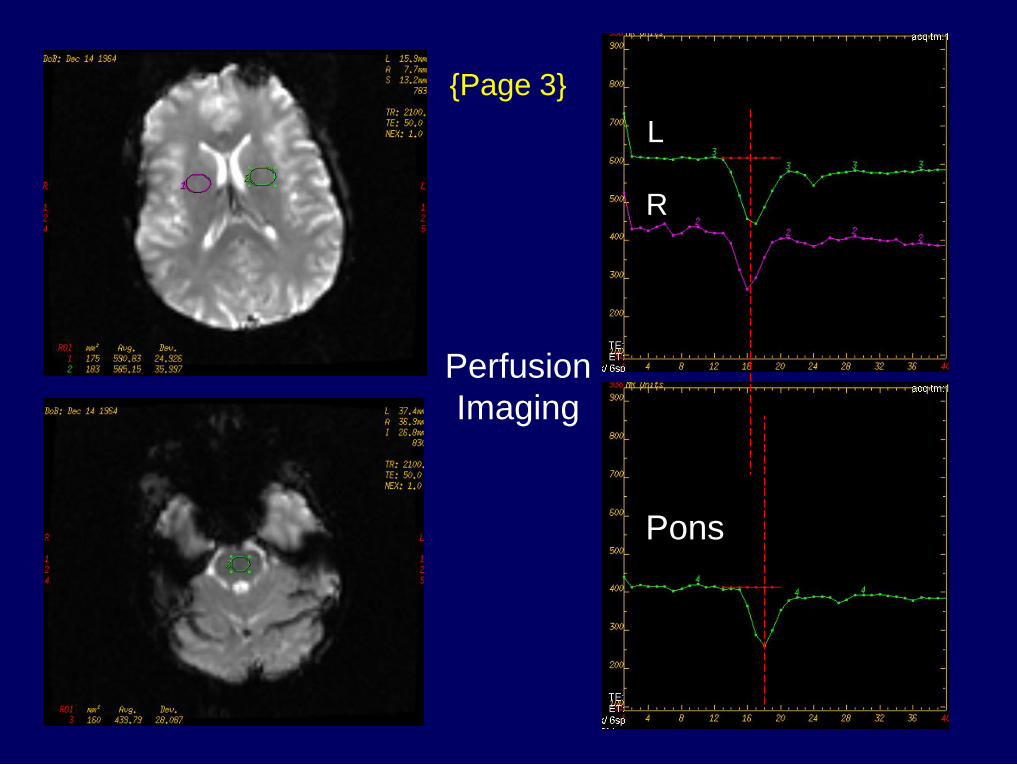
R
L
Pons
{Page 3}
Perfusion
Imaging

rCBV rMTT CBV/MTT=rCBF
{Page 4}

Dx: Basilar thrombosis &
posterior fossa ischemia
{Page 5}
Post tPA Day 3
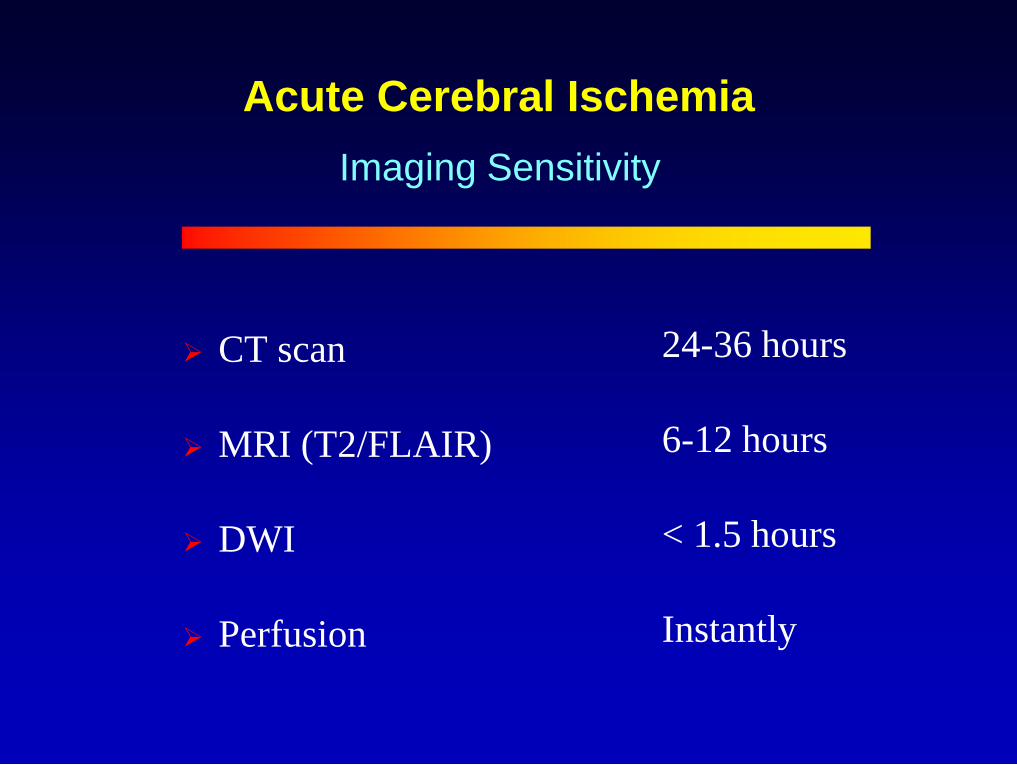
Acute Cerebral Ischemia
CT scan
MRI (T2/FLAIR)
DWI
Perfusion
Imaging Sensitivity
24-36 hours
6-12 hours
< 1.5 hours
Instantly

Acute Cerebral Ischemia
T2 / FLAIR sequences
Diffusion imaging (Diagnostic)
Perfusion imaging (Prognostic)
MR Angiography (Site for therapy)
The Integrated MR Exam

UCSD Neuroradiology Teaching File Website
URL - http://spinwarp.ucsd.edu/NeuroWeb/