Imagem - Estudo Geral · Imagem Joana Pedroso de Lima Cabral de Oliveira ... João Monjardino,...
133
Joana Pedroso de Lima Cabral de Oliveira Rocky shore macroinvertebrate assemblages as indicators of sewage pollution 2013
-
Upload
phamkhuong -
Category
Documents
-
view
215 -
download
0
Transcript of Imagem - Estudo Geral · Imagem Joana Pedroso de Lima Cabral de Oliveira ... João Monjardino,...
Imagem
Joana Pedroso de Lima Cabral de Oliveira
Rocky shore macroinvertebrate
assemblages as indicators of sewage
pollution
2013
II
Rocky shore macroinvertebrate assemblages
as indicators of sewage pollution
Joana Pedroso de Lima Cabral de Oliveira
Doctoral dissertation in Biology (Scientific area of Ecology) supervised by
Professor Miguel Ângelo Pardal presented to the Departament of Life Sciences of
the Faculty of Sciences and Technology of the University of Coimbra
Tese de Doutoramento em Biologia (especialidade Ecologia) orientada por Professor
Doutor Miguel Ângelo Pardal e apresentada ao Departamento de Ciências da Vida da
Faculdade de Ciências e Tecnologia da Universidade de Coimbra
_______________________ DEPARTAMENTO DE CIÊNCIAS DA VIDA
FACULDADE DE CIÊNCIAS E TECNOLOGIA
UNIVERSIDADE DE COIMBRA
2013
III
Financiamento pela FCT (Fundação para a Ciência e a Tecnologia) sob a forma de bolsa de
doutoramento (SFRH/BD/48874/2008), co-financiada pelo Fundo Social Europeu no âmbito do
Programa Operacional Potencial Humano do Referência Estratégica Nacional.
IV
This thesis is based on the following manuscripts:
Cabral-Oliveira J, Mendes S, Maranhão P, Pardal MA (2013) Effects of sewage
pollution on the structure of rocky shore macroinvertebrate assemblages. Hydrobiologia
(accepted with moderate revisions).
Cabral-Oliveira J, Dolbeth M, Pardal MA (2013) Is sewage pollution affecting the
secondary production of rocky shore macroinvertebrates? Marine and Freshwater
Research (accepted with moderate revisions).
Cabral-Oliveira J, Pratas J, Mendes S, Pardal MA (2013) Trace elements in edible rocky
shore species: effect of sewage discharges. Submitted to Human and Ecological Risk
Assessment.
Cabral-Oliveira J, Coelho H, Pratas J, Mendes S, Pardal MA (2013) Macroalgae as
bioindicators of arsenic contamination on coastal areas. Submitted to Scientia Marina.
Cabral-Oliveira J, Bevilacqua S, Terlizzi A, Pardal MA (2013) Comparing Atlantic and
Mediterranean shores: testing the ability of eulittoral invertebrate assemblages to detect
the effects of sewage discharges in coastal areas. To be submitted.
Cabral-Oliveira J, Pardal MA (2013) Sewage discharges in oceanic islands: effects and
recovery of eulittoral macrofauna assemblages. Submitted to Environmental
Management.

V
VI
CONTENTS
AGRADECIMENTOS | ACKNOWLEDGEMENTS 1
ABSTRACT 3
RESUMO 5
CHAPTER 1 7
General Introduction
1.1 The rocky shore environment 9
1.1.1 Tides 9
1.1.2 Zonation: patterns of species distribution 11
1.2 Human impacts on rocky shores 13
1.3 General objectives 17
CHAPTER 2 19
Understanding the effects of sewage pollution on
intertidal macroinvertebrate assemblages
2.1 Introduction 21
2.2 Materials and Methods 22
2.3 Results 26
2.4 Discussion 41
CHAPTER 3 49
Sewage pollution as a source of trace element
contamination and the example of arsenic accumulation
3.1 Introduction 51
3.2 Materials and Methods 53
3.3 Results 55
3.4 Discussion 60
VII
CHAPTER 4 67
Can eulittoral rocky shore macroinvertebrate
assemblages be used as an indicator of sewage pollution?
4.1 Introduction 69
4.2 Materials and Methods 70
4.3 Results 76
4.4 Discussion 87
CHAPTER 5 93
General discussion
5.1 Sewage disturbance on rocky coastal areas 95
5.1.1 Sewage effects on the abiotic environment 95
5.1.2 Effects on the intertidal macroinvertebrate
assemblages
97
5.1.2.1 What to measure 97
5.1.2.2 How to measure: destructive versus non-
destructive sampling
99
5.1.2.3 Where to look: searching for a suitable indicator 101
5.2 Final remarks 104
REFERENCES 107
Appendix 123
Appendix A 125
1
AGRADECIMENTOS | ACKNOWLEDGMENTS
Esta tese deve muito a muita gente,
a todos o meu sincero Obrigada!
Ao meu orientador, Professor Doutor Miguel Pardal, por me permitir dedicar a uma área que
tanto me entusiasma. Por todas as críticas e sugestões, que muito me fizeram progredir
cientificamente, indispensáveis para o terminar desta tese. Bem como por toda a exigência,
confiança e amizade sempre demonstradas.
Ringrazio i Professor Tony Terlizzi e Stanislao Bevilacqua per avermi recevuto all’Università
di Lecce. Grazie per tutto l’aiuto che ho avuto durante il lavoro pratico, per tutti i sugerimenti
ed i consigli che tanto mi hanno fatto evolvere scientificamente. Per me, è stato veramente
importante lavorare con voi e con il vostro gruppo. E grazie anche a tutti i colleghi del
DiSTeBa, sopratutto a Luis, Lucia e Noyan per la compagnia in terra salentina!
Ao Professor Doutor Félix Rodrigues por tão bem me ter recebido na Universidade dos
Açores. E um agradecimento especial à Joana Barcelos e Ramos e à Francesca Gallo pelo
apoio indispensável em terras açorianas! Muito obrigada pela ajuda nas saídas de campo, e
pelo acolhimento no vosso Azorean Biodiversity Group! Não quero também esquecer o Arq.
João Monjardino, pelas sugestões e disponibilidade para a execução deste trabalho.
Ao Professor Doutor João Pratas pelo imenso apoio e disponibilidade nos trabalhos dedicados
ao trace metals. E, também, ao Igor e à Joana, pela companhia e ajuda nas horas passadas no
laboratório!
Ao Professor Doutor Paulo Maranhão, sem o qual nunca teria descoberto a minha querida
costa rochosa. Muito obrigada pela constante disponibilidade e ajuda em todas as saídas e idas
a Peniche!
À Susana Mendes, pela infinita paciência para as minhas dúvidas estatísticas. E, sobretudo,
pelo apoio e amizade durante estes 4 anos.
À Professora Doutora Diana Boaventura pela disponibilidade e ajuda indispensáveis.
2
A todos os meus colegas da L4 do CFE pelo ambiente de equipa e amizade que sempre
conseguimos manter! Obrigada a todos: Daniel Nitray, Elsa, Filipe (obrigada pelos mapas
espetaculares!), Ivan, Joana Batista (companhia dos congressos italianos!), João Rito, João
Rosa, Patrícia (obrigada pela ajuda com as poliquetas!), Margarida, Mariaelena (obrigada por
me receberes tão bem em Lecce!), Sara, Sónia Cotrim, e aos “novinhos” Tito, Thony e João
Neves. Um bem-haja especial à Marina, pela ajuda nas produções secundárias e nas dúvidas
em todo o processo de submissão de artigos! E, igualmente, à Cláudia, pela indispensável
ajuda nas minhas incursões pelo mundo dos trace metals! Sem esquecer, todos os que me
ajudaram nas saídas de campo e, em especial, à Lígia e ao Rito, pelos dias começados às 5h
da manhã… uma verdadeira prova de amizade! À Tânia Cecílio, por comigo partilhar o gosto
pela costa rochosa!
Um obrigado particular à Lígia, Masha, Sílvia, Mafalda, Joana Falcão, Daniel e Tiago Grilo!
Pelos almoços na cantina, horas passadas no laboratório, desabafos e conversas, matrecos e
amizade! Sem vocês estes anos não teriam tido metade da piada!
A todos os meus Amigos, pelos imprescindíveis momentos de não-trabalho! Às biólogas Ana,
Denisa, Inês, Lena (ajuda indispensável nas macroalgas!), Rita e Vera. À Dri, Joana e Rita.
Ao Miguel. À Ana Marta. Ao pessoal do mestrado: Patrick, Inês, Nuno, Estefânia e Mara.
Obrigada por estarem sempre presentes!
À minha família. À Tuxa pelas excelentes estadias em Peniche! Aos Tios e primos açorianos
por toda a ajuda e companhia! E, em especial, aos meus Pais e mano Luís, por sempre
acompanharem com paciência as minhas escolhas, e por serem o equilíbrio perfeito entre a
exigência e o apoio constante! Obrigada por não me deixarem desperdiçar nenhum dos meus
talentos! E, claro, à minha afilhada Isabel!
À minha Avó T, a quem dedico esta tese, que me ensinou a querer ser sempre mais.

3
ABSTRACT
Rocky shores are under high human pressure, being daily exposed to several anthropogenic
impacts such as nutrient enrichment or chemical pollution due to sewage discharges. In order
to prevent further deterioration of coastal areas the search for efficient indices and indicators
has become one of the hot topics in today’s scientific publication. However, a detailed
knowledge of community responses to anthropogenic impacts is essential to sustain those
indices. Therefore, the main goal of the present thesis was to to understand how sewage
pollution may affect intertidal macroinvertebrate assemblages from rocky shores, and it can
be divided into two key points. First, to examine patterns such as abundance, species richness,
structure and secondary production of the macrofauna assemblages exposed to sewage
discharges. Second, compare the response of macrofauna assemblages to sewage discharges
in Atlantic and Mediterranean shores, in order to search for similar patterns.
The first key point was explored in the chapter 2 of this thesis. This chapter aims to provide a
comprehensive assessment of sewage effects on macroinvertebrate intertidal assemblages at
three heights on the shore (littoral fringe, sublittoral fringe, and eulittoral) using an
asymmetrical design. Sewage pollution changed the environmental variables and the
abundance of macroinvertebrates, being Mytilus galloprovincialis, Melarhaphe neritoides and
Chthamalus montagui the species most responsible for the dissimilarities observed. Effects
were different on the three intertidal levels: community structure changed at the sublittoral
fringe; suspension-feeders abundances and species richness increased at the eulittoral; no
differences were detected at the littoral fringe. Furthermore, the results confirm that the
presence of sewage discharges tended to benefit suspension feeders, and that the sensitive
species were replaced by opportunistic ones. Regarding secondary production, it was higher
in the impacted area, but mostly due to the production of tolerant species and suspension
feeders.
Sewage pollution can also result in increasing levels of trace elements in the environment
which can pose serious risks both to wildlife and human health. This highlights the
importance of study the role of sewage discharges in the contamination of aquatic systems,
especially in rocky shores, since part of our food resources is directly collected on coastal
waters. Chapter 3 aims to understand if sewage pollution is contributing to the accumulation
of trace elements on edible species (M. galloprovincialis, Patella ulyssiponensis and Phorcus
4
lineatus). It was found evidence of arsenic contamination due to the sewage discharges. With
this in mind, the concentrations of arsenic on intertidal rocky shore macroalgae exposed to
contaminated sewage discharges were measured. The results showed significantly higher
concentrations of arsenic near the sewage discharges in all the species (Asparagopsis armata,
Codium sp., Plocamium cartilagineum and Ulva sp.) except Saccorhiza polyschides. At the
same time, it was assessed the potential of the studied species as bioindicators. At species
level, the limpets (P. ulyssiponensis) seemed the best bioindicator for trace elements, while A.
armata seemed to be the best choice to detect arsenic contamination.
Finally, the second key point was explored in the chapter 4. This chapter assesses the potential
of eulittoral assemblages in representing an effective indicator of environmental perturbations
related to sewage discharges across different environmental and geographical contexts
(Atlantic shores, Mediterranean shores and Atlantic island shores). Multivariate analyses
showed that, in all shores, the structure of eulittoral invertebrate assemblages did not differ
significantly between reference and impacted areas. However, limpet populations of the genus
Patella were significantly affected by sewage discharges. The responses differed across
Atlantic and Mediterranean shores, probably due to within-species heterogeneities of
ecological traits. Additionally, in the Atlantic island shore, an outfall has been
decommissioned from the original beach (due to civil movements to save a surf spot), which
has provided an ecological opportunity to assess also the recovery dynamics of the
community. After the remove of the outfall, the dominant species of the eulittoral assemblage
appeared to recover. However, in more detail it was possible to observe that littorinids
populations had still not fully recovered.
This thesis contributes with important information to understand the response of intertidal
macroinvertebrate assemblages to sewage pollution. The identification of all species to the
lowest taxonomic level possible, and the sampling along all vertical levels, allowed a
comprehensive knowledge of the effects of sewage discharges on macrofauna assemblages
from rocky shores. Furthermore, a first attempt to evaluate and compare the responses of
rocky shore macrofauna assemblages to sewage pollution in different geographical areas was
carried out. Eulittoral assemblages from Atlantic and Mediterranean shores were studied, and
the results seem to suggest that limpets of the genus Patella may be effective in evaluating the
environmental status of coastal systems in relation to human impacts, such as sewage
discharges.
5
RESUMO
As zonas costeiras estão sujeitas a intensa pressão humana, sendo o enriquecimento orgânico
e de nutrientes, com origem em descargas de águas residuais, um dos principais problemas.
Atualmente, procurando prevenir a contínua deterioração das zonas costeiras, a comunidade
científica tem concentrado esforços na procura de índices e indicadores eficazes. Contudo, de
forma a alcançarmos sustentadas ferramentas de gestão, é indispensável, antes do mais,
adquirir um conhecimento detalhado das respostas das comunidades biológicas aos diferentes
impactos antropogénicos, como o são, por exemplo, as descargas de águas residuais.
Nesse sentido, a presente tese como objetivo principal compreender os efeitos daquelas
descargas nas comunidades de macroinvertebrados da zona intertidal da costa rochosa,
podendo ser dividida em dois pontos principais: no inicial, quisemos estudar os padrões de
abundância, riqueza específica, estrutura da comunidade e produção secundária das
comunidades de macroinvertebrados expostos a descargas de águas residuais; no segundo,
procurou-se comparar as respostas das comunidades intertidais expostas a este foco de
perturbação em diferentes bioregiões (Atlântico e Mediterrâneo), por forma a encontrar
padrões de resposta semelhantes.
O primeiro objetivo desta tese foi explorado no capítulo 2, que pretende contribuir para um
melhor conhecimento dos efeitos da presença de descargas de águas residuais nas
comunidades de macroinvertebrados, ao longo dos diferentes andares da zona intertidal. A
presença das descargas de águas residuais alterou os parâmetros ambientais, bem como a
abundância de macroinvertebrados, sendo Mytilus galloprovincialis, Melarhaphe neritoides e
Chthamalus montagui as principais espécies responsáveis pelas diferenças observadas.
Diferentes efeitos foram, entretanto, observados nos três andares: na franja sublitoral a
estrutura da comunidade foi alterada; no eulitoral aumentou a riqueza específica bem como a
densidade de espécies filtradoras; na franja litoral não foram observadas diferenças. Ademais,
os resultados demonstraram que a presença de descargas de águas residuais beneficia as
espécies filtradoras e, ainda, que espécies sensíveis foram substituídas por espécies tolerantes.
A produção secundária da comunidade foi também superior junto ao foco de poluição, mas
este incremento deveu-se, essencialmente, aos níveis de produção de espécies tolerantes e
filtradoras.
6
Paralelamente, as descargas de águas residuais podem também contribuir para a contaminação
dos sistemas aquáticos por metais e metalóides, com sérios riscos tanto para a vida selvagem
como para a saúde humana. O capítulo 3 visa, assim, compreender se as descargas de águas
residuais contribuem para a acumulação destes contaminantes em espécies comestíveis (M.
galloprovincialis, Patella ulyssiponensis e Phorcus lineatus). Os resultados demonstraram
que há contaminação por arsénio na área perturbada, tendo sido medidas as suas
concentrações em algas intertidais também expostas às descargas de águas residuais
contaminadas. Foram encontradas concentrações superiores perto das descargas em todas as
espécies, exceto Saccorhiza polyschides. Ao mesmo tempo, foi avaliado o potencial das
espécies estudadas como bioindicadores: as lapas (P. ulyssiponensis) parecem ser o melhor
bioindicador para metais e metalóides, enquanto Asparagopsis armata se evidencia como a
melhor opção para detetar a contaminação por arsénio.
O segundo objetivo foi analisado no capítulo 4, onde se avaliou o potencial das comunidades
do andar eulitoral como indicador da presença de descargas de águas residuais em diferentes
contextos ambientais e geográficos (Atlântico, Mediterrâneo e Insular Atlântico). A análise
multivariada mostrou que, em todas as costas estudadas, a estrutura das comunidades não
variou de forma significativa entre locais perturbados e não perturbados. Contudo, as
populações de lapa (do género Patella) foram marcadamente afetadas pela presença do foco
de poluição. As respostas diferiram entre as comunidades do Atlântico e do Mediterrâneo,
presumivelmente devido às características ecológicas das diferentes espécies encontradas.
Entretanto, na costa Insular Atlântica, a remoção de um emissário proporcionou a
oportunidade ecológica para se avaliar a recuperação da comunidade: as espécies dominantes
parece terem-no alcançado, mas observou-se o contrário para as populações de litorinideos.
Nesta tese, a identificação de todos os organismos ao nível da espécie, bem como a
amostragem ao longo de todos os andares intertidais, permitiu um conhecimento abrangente
dos efeitos das descargas de águas residuais sobre as comunidades da costa rochosa. Além
disso, foi realizada uma primeira tentativa para avaliar e comparar as respostas das
comunidades de macrofauna em diferentes áreas geográficas. Comunidades do eulitoral foram
estudadas em costas do Atlântico e do Mediterrâneo, e os resultados sugerem que as lapas do
género Patella podem ser eficazes na avaliação do estado ecológico dos sistemas costeiros
expostos a descargas de águas residuais.
7
CHAPTER 1
General Introduction
Keywords
Rocky shore Intertidal Macrofauna assemblage Sewage
Trace elements Ecological indicators

8
9
General Introduction
1.1 The rocky shore environment
1.1.1 Tides
Rocky shores have fascinated marine biologists and ecologists for many years. Between the
sea and the land, within a few meters, can be found one of the most rich and dynamic areas in
the world. Nevertheless, the sharp environmental gradient that characterized the intertidal area
creates a challenging habitat for marine species. There are mainly two environmental
gradients: a vertical gradient defined by tides, and a horizontal gradient caused by wave action
(Hawkins and Jones, 1992; Nybakken and Bertness, 2005; Little et al., 2010).
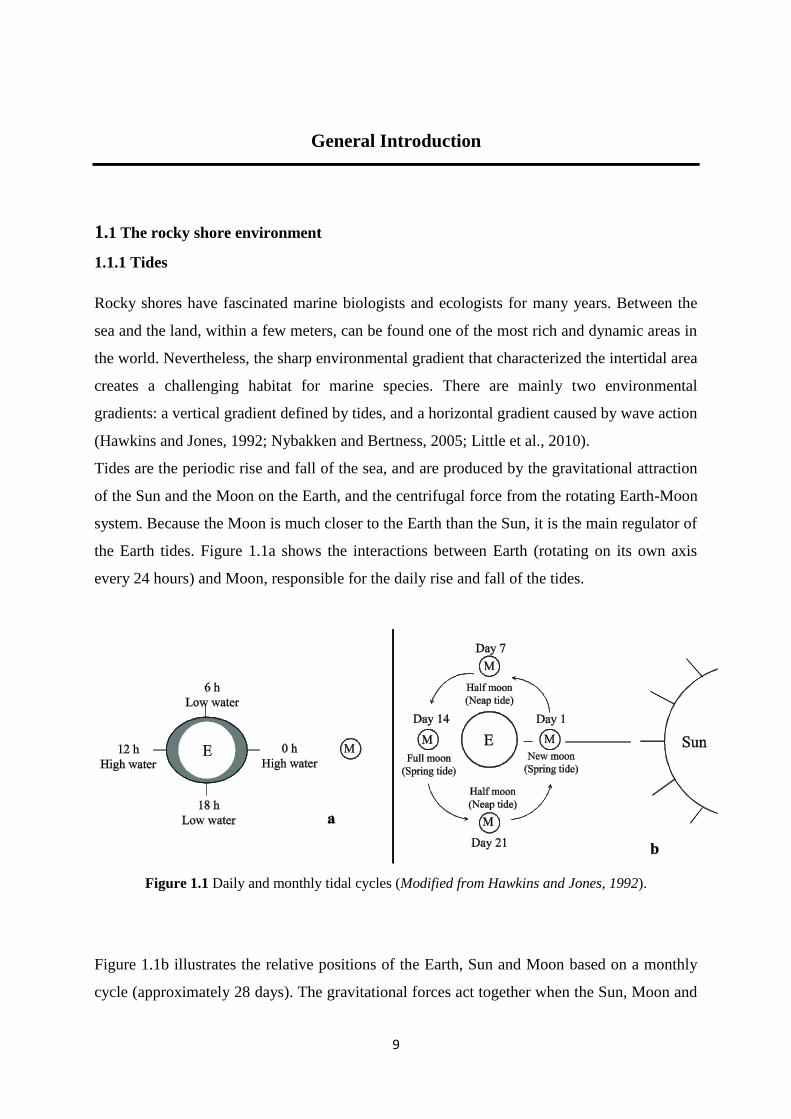
Tides are the periodic rise and fall of the sea, and are produced by the gravitational attraction
of the Sun and the Moon on the Earth, and the centrifugal force from the rotating Earth-Moon
system. Because the Moon is much closer to the Earth than the Sun, it is the main regulator of
the Earth tides. Figure 1.1a shows the interactions between Earth (rotating on its own axis
every 24 hours) and Moon, responsible for the daily rise and fall of the tides.
Figure 1.1 Daily and monthly tidal cycles (Modified from Hawkins and Jones, 1992).
Figure 1.1b illustrates the relative positions of the Earth, Sun and Moon based on a monthly
cycle (approximately 28 days). The gravitational forces act together when the Sun, Moon and
General Introduction
10
Earth are aligned. This occurs at times of new and full Moon and results in tides with a large
range, the spring tides. At times of half Moon, the Sun and Moon are at right angles to one
another, and their forces are in opposition. Thus, the gravitational pull on the surface of the
Earth is lower, and tides have a smaller range, the neap tides. Seasonal changes in the tidal
amplitude are produced by differences in the declination of the Sun. The elliptic orbit of the
Earth around the Sun, during the course of one year, also affects the range of the tides. In
March and September, when the Sun is closest to the Earth its gravitational pull is greatest.
This results in very large spring tides, the spring and autumn equinoctial tides. The opposite is
observed in June and December, in the solstices, with lower spring tidal amplitudes (Hawkins
and Jones, 1992; Nybakken and Bertness, 2003; Fish and Fish, 2011; Crothers, 2012).
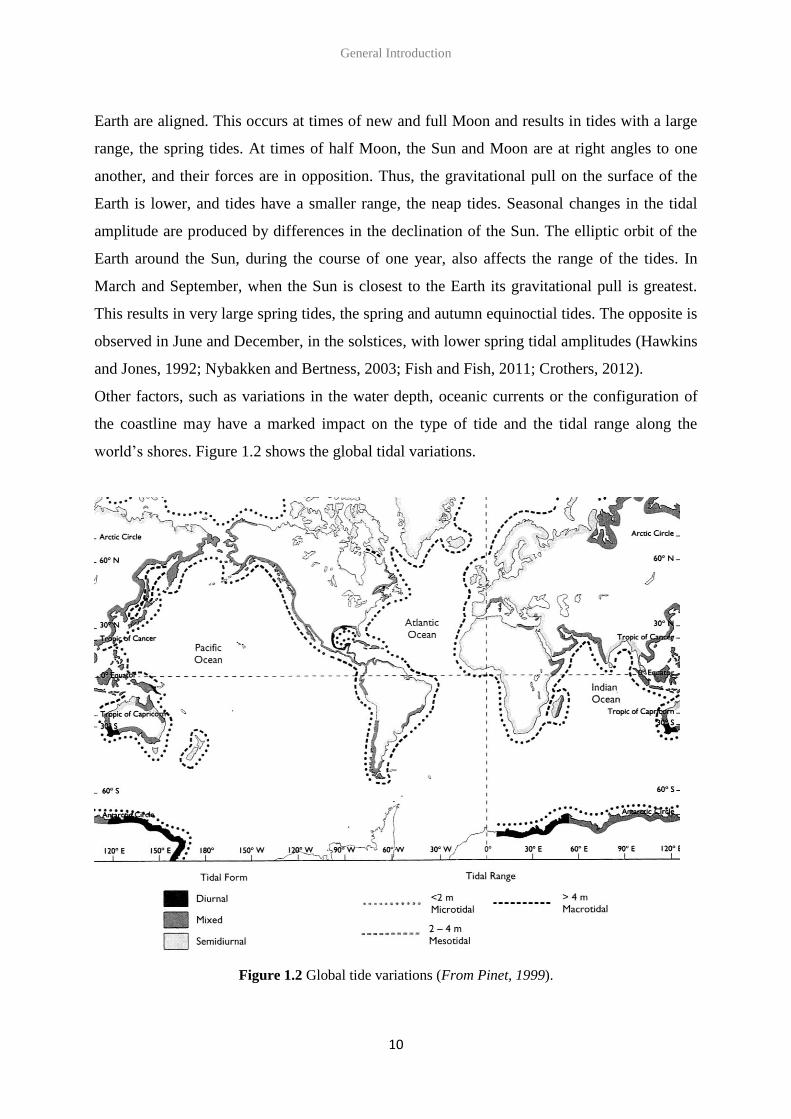
Other factors, such as variations in the water depth, oceanic currents or the configuration of
the coastline may have a marked impact on the type of tide and the tidal range along the
world’s shores. Figure 1.2 shows the global tidal variations.
Figure 1.2 Global tide variations (From Pinet, 1999).
General Introduction
11
The most common tides in Europe are semidiurnal, with two high tides and two low tides
each day. However, there are three tidal patterns: semidiurnal, diurnal (one high tide and one
low tide daily) and mixed tides (vary irregularly twice a day).
It is also important to consider the differences in tidal range, the vertical distance between
high and low tide. The tidal ranges vary from region to region (Fig. 1.2) and are normally
divided into microtidal with less than 2m, mesotidal between 2 and 4m and macrotidal with
more than 4m (Pinet, 1999; Fish and Fish, 2011).
All models are simplifications of the real world. However, given this simplification it is
possible to predict tidal variations, which is essential to work in rocky shores. Tidal heights
are measured in relation to a conventional level (chart datum), which corresponds to the
lowest astronomic tide. Specific tidal levels above this chart datum may be useful reference
points for shore ecologists (Fig. 1.3). There are the mean values for high and low water of
spring and neap tides (MHWS, MLWS, MHWN, MLWN), and the average of these four
heights, the mean tidal level (MTL). Also, the extreme spring tide levels are referenced, as the
highest (EHWS) and the lowest (ELWS) tides of the year (Little et al., 2010; Fish and Fish,
2011).
1.1.2 Zonation: patterns of species distribution
Species that live in the rocky shores have to adapt to the sharp environmental gradient existent
in this habitat. The vertical gradient, defined by the tides, produces periods of submersion and
emersion, leading to contrasting conditions of temperature, salinity or desiccation. The
horizontal gradient, caused by wave action, may have direct effects on species dislodgement
or indirectly affect feeding or reproduction (Hawkins and Jones, 1992; Little et al., 2010).
One of the most striking characteristics of rocky shores around the world is the horizontal
banding, or zonation, of organisms that live there. Although the easy recognition of this
pattern, it is more difficult to explain its causes. Both physical and biological factors are
responsible for this phenomenon. The upper limits are typically set by two abiotic factors:
desiccation and temperature. The lower limits are explained by biotic factors, such as
competition, predation or grazing (Lewis, 1964; Nybakken and Bertness, 2005; Fish and Fish,
2011).
General Introduction
12
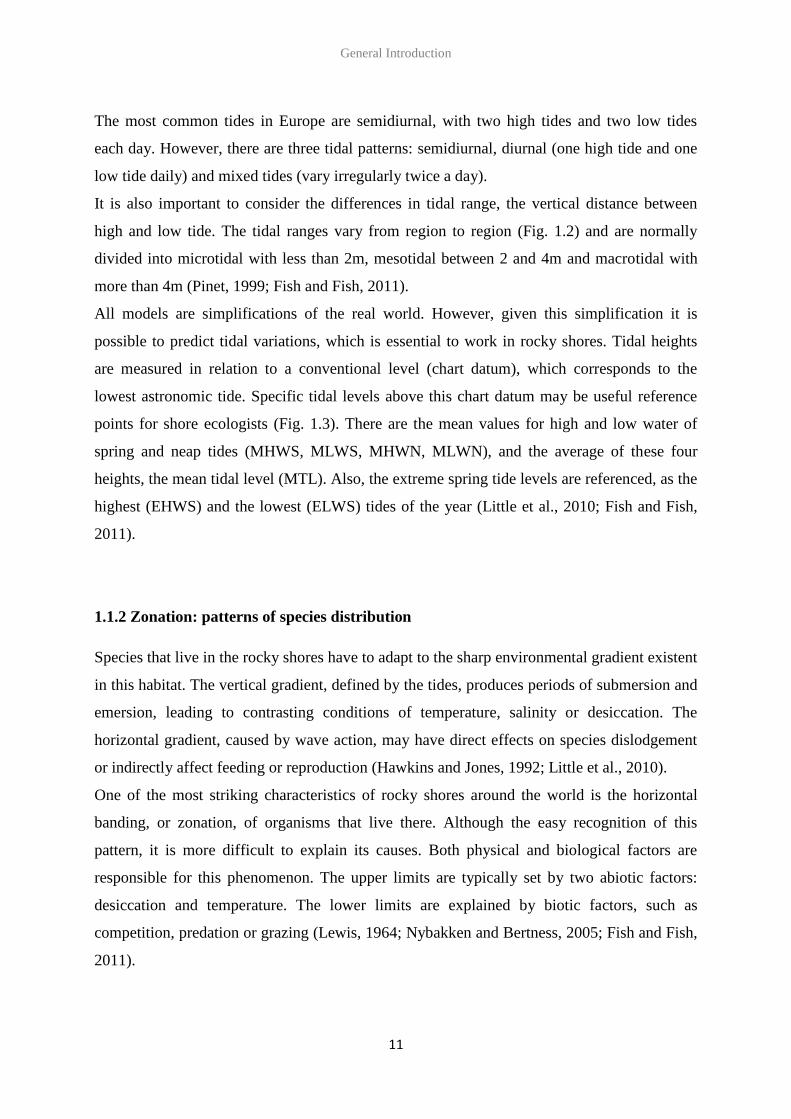
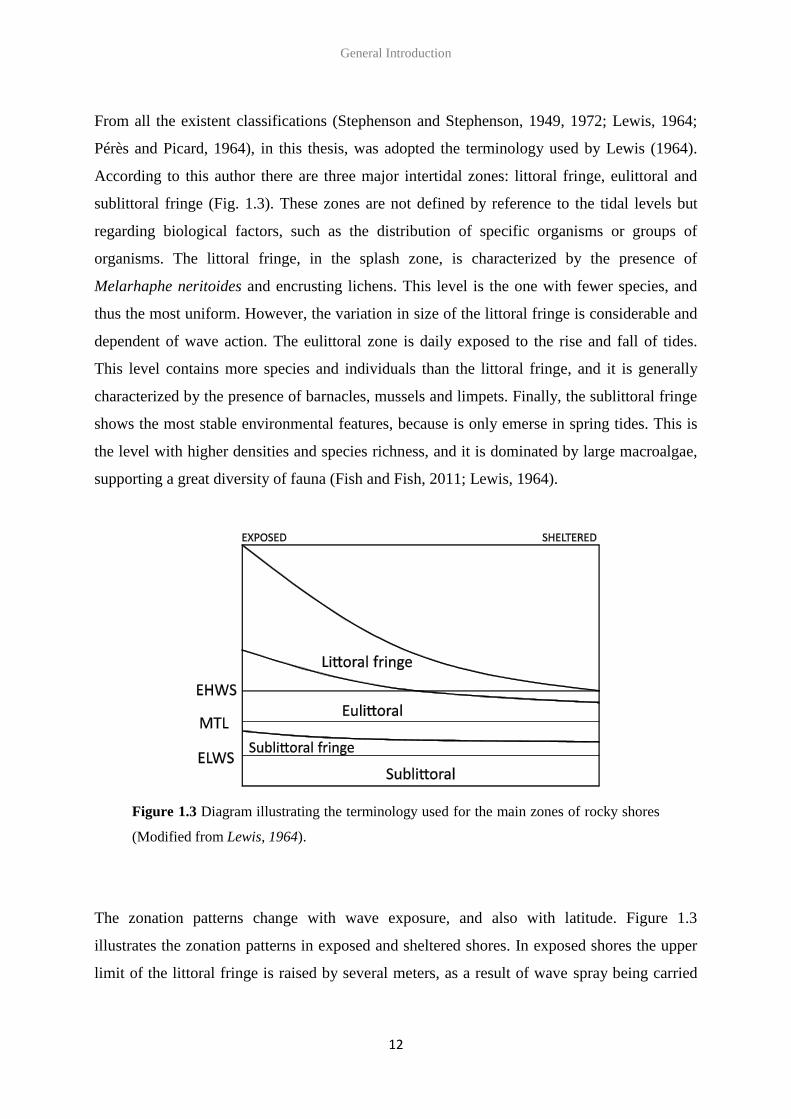
From all the existent classifications (Stephenson and Stephenson, 1949, 1972; Lewis, 1964;
Pérès and Picard, 1964), in this thesis, was adopted the terminology used by Lewis (1964).
According to this author there are three major intertidal zones: littoral fringe, eulittoral and
sublittoral fringe (Fig. 1.3). These zones are not defined by reference to the tidal levels but
regarding biological factors, such as the distribution of specific organisms or groups of
organisms. The littoral fringe, in the splash zone, is characterized by the presence of
Melarhaphe neritoides and encrusting lichens. This level is the one with fewer species, and
thus the most uniform. However, the variation in size of the littoral fringe is considerable and
dependent of wave action. The eulittoral zone is daily exposed to the rise and fall of tides.
This level contains more species and individuals than the littoral fringe, and it is generally
characterized by the presence of barnacles, mussels and limpets. Finally, the sublittoral fringe
shows the most stable environmental features, because is only emerse in spring tides. This is
the level with higher densities and species richness, and it is dominated by large macroalgae,
supporting a great diversity of fauna (Fish and Fish, 2011; Lewis, 1964).
Figure 1.3 Diagram illustrating the terminology used for the main zones of rocky shores
(Modified from Lewis, 1964).
The zonation patterns change with wave exposure, and also with latitude. Figure 1.3
illustrates the zonation patterns in exposed and sheltered shores. In exposed shores the upper
limit of the littoral fringe is raised by several meters, as a result of wave spray being carried
General Introduction
13
far up the beach. Moreover, the exposure can also affect the type of species present in the
shore, due to different tolerances to wave action. In sheltered shores the eulittoral is
dominated by large macroalgae, while barnacles and limpets are present in low numbers. The
littoral fringe is narrow and Littorina saxatilis may be present. In exposed shores the eulittoral
is covered by barnacles and mussels, and limpets are also found in large numbers. The littoral
fringe is very broad and Melarhaphe neritoides is extremely abundant. Additionally,
differences between exposed and sheltered shores are observed in the sublittoral fringe too,
with the composition of algal assemblages changing accordingly to the species tolerance to
wave action.
There are, also, geographical differences in the species distribution that will influence the
patterns of zonation. For instance, diversity tend to increase towards the tropics and decrease
towards the poles. Factors like temperature and the amount of radiant energy can change the
productivity which associated with interactions at the community level (e.g., algae-grazer)
may produce this latitudinal gradient (Hawkins and Jones, 1992).
1.2 Human impacts on rocky shores
Coastal areas are exposed to a wide range of anthropogenic impacts. Sewage discharges are
among the most common anthropogenic impacts on rocky shores, resulting in organic and
nutrient enrichment (Crowe et al., 2000; Arévalo et al., 2007; Halpern et al., 2008). The
sewage can be treated in the wastewater treatment plants, where it receives primary (gross
solids removed), secondary (organic matter removed) or tertiary (nutrients and bacteria
removed) treatments. After the treatments, the effluents are usually discharged directly into
the shore, or at some distance from the shore through pipeline systems. In Europe, the
majority of sewage treatment plants have only primary and secondary treatment
(http://epp.eurostat.ec.europa.eu), so nutrient enrichment and bacteria concentrations can
become a major environmental problem leading to the deterioration of marine ecosystems.
Moreover, sewage discharges from industrialized or urbanized areas usually contain trace
elements. Although trace elements on aquatic systems may have natural sources, it is
important to distinguish those from man-induced inputs. Therefore, the analysis of trace
elements is an essential task to assess the potential environmental and human health risk
General Introduction
14
associated with sewage discharges (Pinet, 1999; Alvarez et al., 2002; Maceda-Veiga et al.,
2013).
Several legislative forces at European scale, such as the Water Framework Directive (WFD,
2000/60/EC) and the Marine Strategy Framework Directive (MSFD, 2008/56/EC) have been
developed aiming the protection and management of the European aquatic ecosystems. Both
directives are based on the same ecological concept: assessing the health of the aquatic
ecosystems by determining the deviation from the expected reference conditions and, in case
of degradation, intervene to recover a good ecological status. The assessment should be based
in physico-chemical parameters and biological indicators, such as fish, phytoplankton,
macroalgae or benthic invertebrates.
Benthic invertebrates are used worldwide to assess the status of marine ecosystems. They
have been proved to respond to several types of anthropogenic impacts, from physical
disturbance to chemical contamination or nutrient enrichment (Teixeira et al., 2010 and
references therein). Moreover, their role as ecological indicators is widely accepted due to
their sedentarism, long lives, easy sampling, and to the existence of extensive literature on
their distribution in specific environments and on their response to different environmental
stresses (Borja and Dauer, 2008; Dauvin et al., 2010; Fano et al., 2003; Simboura and
Zenetos, 2002).
Previous studies have already approached the effects of sewage discharges on rocky shore
communities. Littler and Murray (1975) studied the effect of sewage pollution on Californian
intertidal rocky shores. There was a decrease in species richness and total cover. These
authors also observed changes in the community structure, with sewage favouring suspension
feeders and omnivores, and also a replacement of sensitive species by tolerant ones.
In the Australian coasts the effects of sewage pollution, as well as the recovery of subtidal and
intertidal assemblages after decommission of the outfalls was extensively studied
(Fairweather, 1990; Chapman et al., 1995; Roberts, 1996; Underwood and Chapman, 1996;
Roberts et al., 1998; Roberts and Scanes, 1999; Archambault et al., 2001; Bishop et al., 2002).
In general it was observed a decrease in fauna diversity and a dominance of ephemeral green
algae at the intertidal (Fairweather, 1990). The closure of that inshore outfall, replaced by a
deep-water ocean outfall, lead to recovery studies in the area. Studies on the recovery of the
intertidal assemblages found no evident effects of sewage on eulittoral, but an increase in the
number of species and decrease of green algae at the sublittoral fringe (Archambault et al.,
General Introduction
15
2001). Similarly, in the same area, studies after the closure of the inshore outfall did not found
any evidence of sewage effects at the subtidal (Chapman et al., 1995; Underwood and
Chapman, 1996). In other Australian shore, the opening of the nearshore ocean outfall (20m),
provided the opportunity to carry out a before/after sampling design. Although there were no
differences in total cover or number of species, a marked shift in the structure of the
assemblage was observed, with the replacement of algae and sponges by silt and ascidians
(Roberts et al., 1998). Finally, evidence for the importance of sampling at different spatial
scales was revealed with the dissimilar effects of sewage on the intertidal limpet Patelloida
latistrigata at different spatial scales (Bishop et al., 2002). These authors also observed an
increase of ephemeral green algae and opportunistic species in the intertidal assemblages near
the sewage discharges.
In the Argentinean coasts, sewage effects were studied on a rocky intertidal community
dominated by the bivalve Brachidontes rodriguezi. The sensibility of B. rodriguezi to sewage
pollution led to the absence of this species in the polluted areas. As a consequence, other
species increase in abundance due to the lack of competition for food and space. Therefore,
the diversity was higher in the polluted areas (López-Gappa et al., 1990, 1993). Moreover,
these authors also suggested that sewage discharges increase the cover of ephemeral green
algae and the abundance of tolerant species, such as Mytilus spp. and Balanus spp.. Although
these studies had some sampling design problems, due to the existence of only one impacted
area and one reference area, the results obtained were confirmed by further studies (Vallarino
et al., 2002). It was observed a change in the community structure, with a decrease of
sensitive species (B. rodriguezi and Syllis prolixa) and an increase of opportunistic
polychaetes (Capitella capitata and Boccardia polybranchia) near the sewage discharges
(Vallarino et al., 2002; Elías et al., 2006).
In the Italian Mediterranean coasts the effects of sewage were studied in subtidal rocky shores
communities. There was no effect on total cover or species richness, but it was observed an
increase of species typical of organically polluted waters (Terlizzi et al., 2002). Concerning
meiofauna, there was a decrease in the number of species but not in total abundances. Also,
community structure changed and was observed a decrease of nematods and syllids and an
increase of hydrozoans (Fraschetti et al., 2006). Regarding mollusc assemblages, there was an
increase in the abundances near the sewage discharges, due to greater number of juveniles.
General Introduction
16
Although no effect was evident in the number of species, there were significant differences in
molluscan species composition (Terlizzi et al., 2005a).
More recently, the effect of sewage treatment upgrade was studied in Cantabrian shores. The
improvement from primary to secondary treatment of sewage seemed to have no effect at the
eulittoral. However, a significant effect was observed at the sublittoral, being the main
changes a decrease of the suspensivore polychaete Spirorbis pagenstecheri and an increase of
Patella ulyssiponensis (Bustamante et al., 2012). Recent studies have attempt to find similar
patterns on intertidal assemblages from several shores affected by sewage discharges (Atalah
and Crowe, 2012; O’Connor, 2013). Atalah and Crowe (2012) suggested that molluscan
assemblages seem to be good indicators of sewage pollution. Near the outfalls the number of
species and total abundances decrease, and the assemblages were different. Species like
Rissoa parva, Gibbula umbilicalis, Nucella lapillus or Tricolia pullus appeared to be sensitive
to sewage pollution, while species such as Mytilus galloprovincialis, Odostomia sp. or
Littorina littorea were favoured by the organic enrichment (Atalah and Crowe, 2012).
However, O’Connor (2013) found no consistent responses of intertidal assemblages to the
presence of sewage discharges. Although the effects of sewage were evident, and mussels,
limpets and green algae appeared to be always more abundant near the outfalls, these
conclusions were not statistically robust. Moreover, it was clear that there was a greater effect
of spatial and temporal variations in the structure of the assemblages, when compared with the
sewage effect (O’Connor, 2013).
As explained above, different patterns have been observed when assessing the effects of
sewage discharges. Consequently, it is necessary to study in detail these communities in order
to find common responses, which are essential to establish adequate environmental risk
management.
General Introduction
17
1.3 General objectives
The main purpose of this thesis is to understand how sewage pollution may affect intertidal
macroinvertebrate assemblages from rocky shores, and it can be divided into two key points.
First, to examine patterns such as abundance, species richness, structure and secondary
production of the macrofauna assemblages exposed to sewage discharges. Second, compare
the response of macrofauna assemblages to sewage discharges in Atlantic and Mediterranean
shores.
Three specific objectives were defined in order to achieve the goals outlined above:
(i) To examine the effects of sewage pollution on intertidal macroinvertebrate
assemblages, across all vertical zonation levels, to assess the consistency of
patterns;
(ii) To evaluate if sewage discharges are a source of trace element contamination and
to assess the risk for human health;
(iii) To assess the potential of eulittoral macroinvertebrate assemblages as indicators of
sewage pollution, comparing the response of macrofauna assemblages in Atlantic
and Mediterranean shores.

18
19
CHAPTER 2
Understanding the effects of sewage pollution on intertidal
macroinvertebrate assemblages
Chapter 2 is published in the form of a manuscript as:
Cabral-Oliveira J, Mendes S, Maranhão P, Pardal MA (2013) Effects of sewage pollution on
the structure of rocky shore macroinvertebrate assemblages. Hydrobiologia (accepted with
moderate revisions).
Cabral-Oliveira J, Dolbeth M, Pardal MA (2013) Is sewage pollution affecting the secondary
production of rocky shore macroinvertebrates? Marine and Freshwater Research (accepted
with moderate revisions).

20
21
Understanding the effects of sewage pollution on intertidal
macroinvertebrate assemblages
2.1 Introduction
Half the world’s population lives along the coastline and consequently the habitats located in
those areas are under great human pressure. This includes the entry of a great variety of toxic
contaminants from agricultural, industrial and urban activities (Little et al., 2010). One of the
main sources of the organic and nutrient enrichment in coastal areas is sewage discharges
(e.g. Arévalo et al., 2007). In Europe, sewage can receive primary (gross solids removed),
secondary (organic matter eliminated) or tertiary (nutrients and bacteria removed) treatment,
prior to being discharged directly into the shore, or at some distance from shore, through
pipeline systems (http://epp.eurostat.ec.europa.eu). Sewage outfalls discharging near rocky
shores may have effects on the subtidal and intertidal hard bottom communities located
nearby.
The responses of rocky shore intertidal benthic invertebrate assemblages to sewage pollution
are poorly understood (Johnston and Roberts, 2009; Dauvin et al., 2010; Bustamante et al.,
2012). Nevertheless there are several papers focusing on intertidal populations of polychaetes
(Dauer and Conner, 1980; Elías et al., 2006; Jaubet et al., 2011), molluscs (Bishop et al.,
2002; Terlizzi et al., 2005a; Vallarino et al., 2006; Atalah and Crowe, 2012) or crustaceans
(Calgano et al., 1998; De-la-Ossa-Carretero et al., 2010). But studies dealing with the effect
on the entire intertidal benthic community are very scarce (Littler and Murray, 1975; López-
Gappa et al., 1990, 1993; Archambault et al., 2001; Klein and Zhai, 2002). Moreover, several
of those studies do not have the most appropriate sampling design to detect human
disturbances (e.g. using only one reference site). Furthermore, in rocky shores the species are
distributed in bands, creating a vertical zonation, where physical and biotic factors diverge,
and communities differ in terms of species richness and composition (Hawkins and Jones,
1992; Little et al., 2010). The previous studies have only focused on one of the tidal level
(López-Gappa et al., 1990, 1993; Klein and Zhai, 2002). Finally, previous research was
mainly based on visual census, which has the disadvantage of underestimating species with
smaller dimensions (Littler and Murray, 1975; Archambault et al., 2001). Nevertheless,
Understanding the effects of sewage pollution on intertidal macroinvertebrate assemblages
22
previous studies have already pointed out important results, such as the structural and
functional changes of the community, and the replacement of sensitive species by
opportunistic ones.
In view of the current concern to include functional approaches in the environmental impact
assessment, the effects of sewage pollution can also be studied by assessing ecosystem
function (Elliott and Quintino, 2007). Secondary production is a measure of ecosystem
functioning, as it combines both static and dynamic components of a population’s ecological
performance (Dolbeth et al., 2012). Secondary production (production by heterotrophic
organisms) is the amount of organic matter or energy incorporated in a given area per time
unit (Dolbeth et al., 2012). The patterns of secondary production are affected by life history
characteristics such as body mass, recruitment, age, life span, taxonomy and trophic status,
and population biomass and density (Cusson and Bourget, 2005). As such, measures of
secondary production are representative of population fitness in the system and can add more
information to diversity and density parameters about ecosystem changes and, ultimately, on
the food provision delivered by an ecosystem (Benke and Huryn, 2010; Dolbeth et al., 2012).
The importance of incorporating secondary production to assess the impacts of sewage
pollution has been recognized for freshwater (Whiles and Wallace, 1995; Woodcock and
Huryn, 2007; Faupel et al., 2012) and estuarine ecosystems (Dolbeth et al., 2011, 2012).
However, little is known for the rocky shores habitats.
With all this in mind, the aim of this chapter is to study the effects of sewage pollution on the
diversity, abundance, structure and secondary production of macrofaunal assemblages
compared with reference areas not exposed to this human induced disturbance. This study was
carried out across all vertical zonation levels (littoral fringe, eulittoral and sublittoral fringe)
to assess the consistency of patterns.
2.2 Materials and methods
2.2.1 Study site and sampling procedures
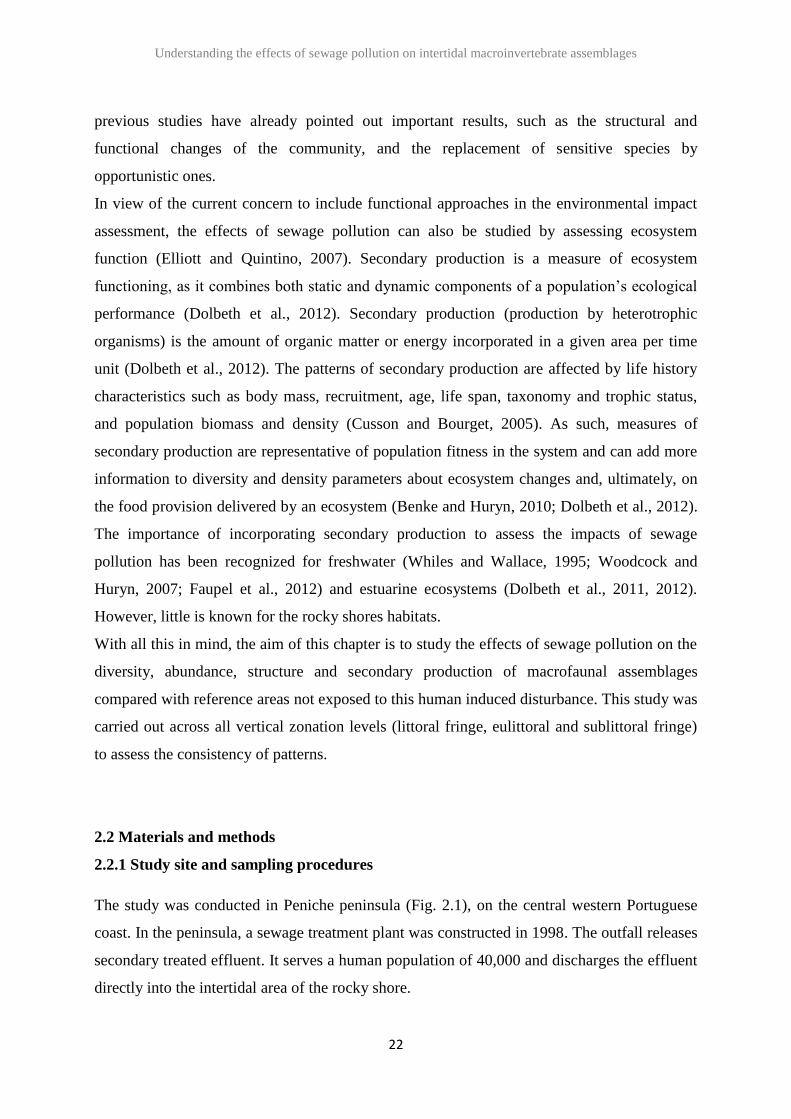
The study was conducted in Peniche peninsula (Fig. 2.1), on the central western Portuguese
coast. In the peninsula, a sewage treatment plant was constructed in 1998. The outfall releases
secondary treated effluent. It serves a human population of 40,000 and discharges the effluent
directly into the intertidal area of the rocky shore.
Understanding the effects of sewage pollution on intertidal macroinvertebrate assemblages
23
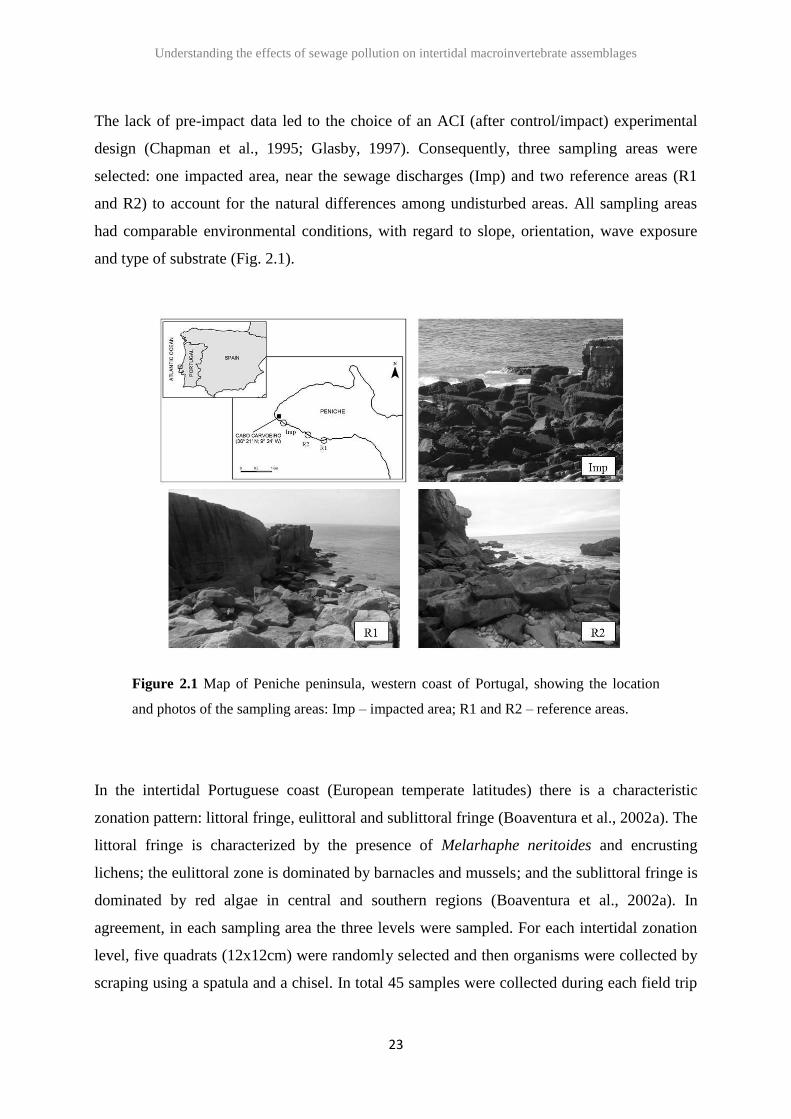
The lack of pre-impact data led to the choice of an ACI (after control/impact) experimental
design (Chapman et al., 1995; Glasby, 1997). Consequently, three sampling areas were
selected: one impacted area, near the sewage discharges (Imp) and two reference areas (R1
and R2) to account for the natural differences among undisturbed areas. All sampling areas
had comparable environmental conditions, with regard to slope, orientation, wave exposure
and type of substrate (Fig. 2.1).
Figure 2.1 Map of Peniche peninsula, western coast of Portugal, showing the location
and photos of the sampling areas: Imp – impacted area; R1 and R2 – reference areas.
In the intertidal Portuguese coast (European temperate latitudes) there is a characteristic
zonation pattern: littoral fringe, eulittoral and sublittoral fringe (Boaventura et al., 2002a). The
littoral fringe is characterized by the presence of Melarhaphe neritoides and encrusting
lichens; the eulittoral zone is dominated by barnacles and mussels; and the sublittoral fringe is
dominated by red algae in central and southern regions (Boaventura et al., 2002a). In
agreement, in each sampling area the three levels were sampled. For each intertidal zonation
level, five quadrats (12x12cm) were randomly selected and then organisms were collected by
scraping using a spatula and a chisel. In total 45 samples were collected during each field trip
Understanding the effects of sewage pollution on intertidal macroinvertebrate assemblages
24
in February, April, July and November 2010. Since the studied area presents a temperate
climate four sampling dates were chosen in order to account for the temporal variation. It was
not our goal to study the differences between seasons but to capture the natural yearly
variation of the community’s response. During the sampling programme in all areas,
environmental variables (dissolved oxygen, temperature, salinity and pH) were measured in
the seawater and water samples were collected for laboratory determination of nutrients
concentrations, total suspended solids (TSS) and bacteria (total coliforms).
2.2.2 Laboratory procedures
All material collected from scrapings were sieved through a 500m mesh and all individuals
were identified to the lowest taxonomic level possible. All individuals were counted and
weighted to determine density and biomass (estimated as ash free dry weight, AFDW). To
estimate AFDW individuals were dried at 60 ºC for four days, weighted, ignited in a muffle
furnace at 450 ºC for eight hours, and reweighed to determine the ash content. These
determinations were made using the entire animals including the shells. Water samples were
filtered (Whatman GF/F glass-fibre filter) and stored frozen at -18 ºC until analysis. Analyses
followed the standard methods described in Limnologisk Metodik (1985) (for ammonia and
phosphate), in Strickland & Parsons (1968) (for nitrate and nitrite), and ESS Method 340.2
(for total suspended solids). Water samples (250 mL) for the quantification of total coliforms
bacteria were collected in parallel to those obtained for physical and chemical analyses.
Samples were collected in sterile polycarbonate flasks filled to capacity, sealed with gas-tight
rubber stoppers and immediately placed on ice until processing in the laboratory (3h later).
Total coliforms in the water samples were determined using the membrane filtration
technique. A twenty-fold dilution was used for the water samples from the impacted area. The
samples were cultivated onto CHROMOCULT® coliform agar (Merck), with an incubation
period of 24h at 37 ºC. At the end of this period CFU were counted.
Understanding the effects of sewage pollution on intertidal macroinvertebrate assemblages
25
2.2.3 Data analysis and secondary production estimates
A distance-based permutational multivariate analysis of variance (PERMANOVA; Anderson,
2001) was carried out separately for each intertidal level (littoral fringe, eulittoral and
sublittoral fringe) to test for differences in density and biomass of the invertebrate assemblage
structure between impacted and reference areas. The model consisted of two factors: Time (4
levels, random, orthogonal) and Location (1 impacted and 2 reference areas, fixed,
orthogonal). In both cases, the design was asymmetrical (Underwood, 1994) due to the
presence of a single impacted area. Therefore, the Location term, and all terms involving
Location, was partitioned into two portions: the 1-degree-of-freedom contrast of Imp-v-Rs
and the variability between reference areas (Rs). The same partitioning was performed for the
residual variability for observations within Imp (Res Imp) within Rs (Res Rs). Appropriate
denominators for F ratios were identified from expected mean squares and tests were
constructed following the logic of asymmetrical design (see Terlizzi et al., 2005b). All
analyses were based on Bray–Curtis similarity on squared-root transformed data, and each
term in the analysis was tested by 4999 random permutations of appropriate units. To
visualize multivariate patterns, differences in community structure among treatment levels
were visualized by principal coordinate (PCO) analyses on the basis of Bray-Curtis
similarities. Species classes found at each intertidal level are displayed as vectors in the PCO
plots.
The total number of species (S) was calculated for each observation unit, using the DIVERSE
routine contained in the PRIMER statistical package. Univariate permutational analyses of
variance (Anderson, 2001) were carried out on several variables using the same experimental
design as described above for the multivariate analyses. The variables were: number of
species, total faunal density, density of taxonomic classes (Gastropoda, Bivalvia, Crustacea,
Polychaeta and Polyplacophora) and abundance of Corallina spp. Univariate analyses were
performed using PERMANOVA, with Euclidean distances as the measure of similarity. For
all statistical tests, the significance level was set at p≤0.05. All calculations were performed
using the PRIMER v 6 software package (Clarke and Gorley, 2006).
Understanding the effects of sewage pollution on intertidal macroinvertebrate assemblages
26
For the present assessment secondary production was estimated with Cusson and Bourget
(2005) empirical model:
where P is the annual production (kJ.m-2
.year-1
), is the annual mean biomass (kJ.m-2
), is
the annual mean individual mass (kJ.individual-1
), and L is the life span (years). Data on
and were obtained by averaging the biomass obtained in the four sampling occasions, as
representative of annual mean biomass. For the application of the model, information on the
species life span was collected from the literature (http://www.marlin.ac.uk, www.nhm.ac.uk,
http://www.genustraithandbook.org.uk), and all species were also assigned to a functional
feeding group (Appendix A) for a discrimination of production per feeding guild. For rare
species or the ones with no information on life span, an average life span value inferred from
similar species traits was considered (after recommendation from Cusson and Bourget (2005).
Biomass was converted into energy (kJ) using weight- to-energy provided in Brey (2001). A
single value of annual production is obtained for each sampling area and level.
The secondary production distribution within the macroinvertebrate assemblage in the three
sampling areas (Imp, R1 and R2) and zonation levels (littoral fringe, eulittoral and sublittoral
fringe) was explored using a two-way crossed ANOSIM with no replicates. Similarities in the
production data were calculated as the Bray-Curtis coefficient after square-root-
transformation of the raw data to scale down the scores of the very productive species (Clarke
and Warwick, 2001). Non-metric Multidimensional Scaling (nm-MDS) was performed
subsequently to clarify the patterns and similarity percentages obtained from CLUSTER
analysis were overlaid in the plot. All the analyses were done using PRIMERv6 and
PERMANOVA+ routines (Anderson et al., 2008).
2.3 Results
2.3.1 Environmental variables
In general the environmental parameters were markedly different when comparing the
sampling areas (Table 2.1). The impacted area presented higher seawater temperature and
Understanding the effects of sewage pollution on intertidal macroinvertebrate assemblages
27
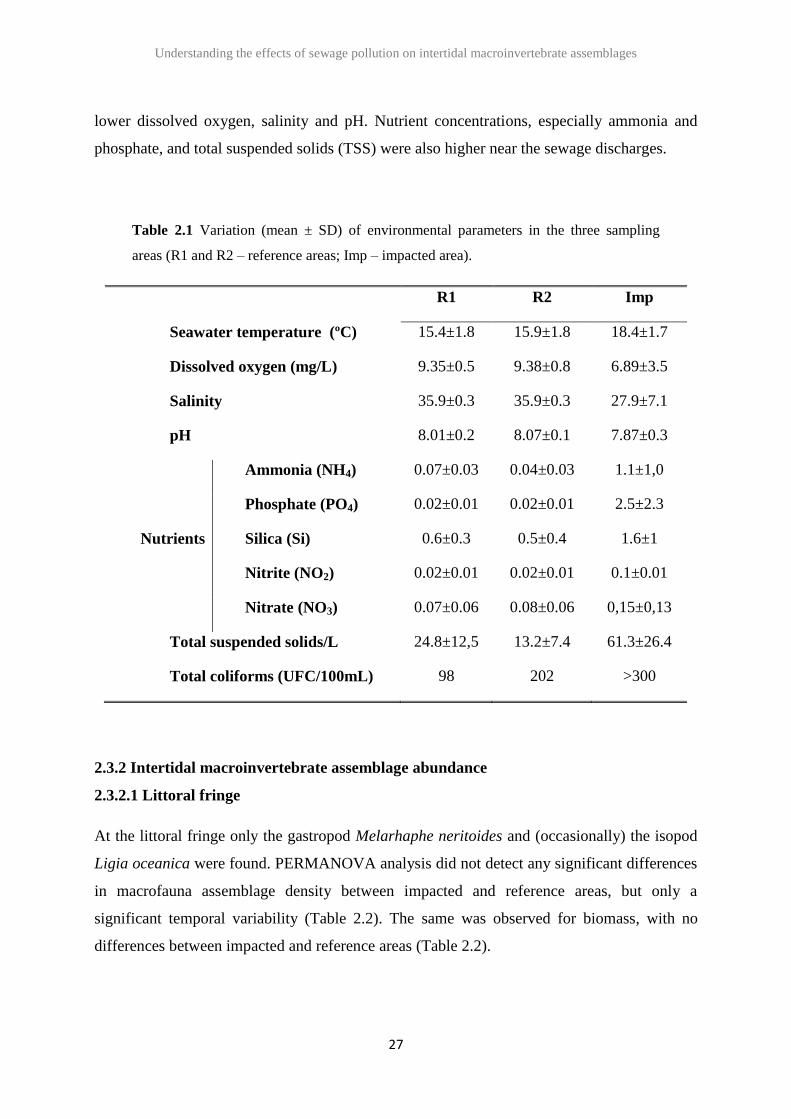
lower dissolved oxygen, salinity and pH. Nutrient concentrations, especially ammonia and
phosphate, and total suspended solids (TSS) were also higher near the sewage discharges.
Table 2.1 Variation (mean ± SD) of environmental parameters in the three sampling
areas (R1 and R2 – reference areas; Imp – impacted area).
R1 R2 Imp
Seawater temperature (ºC) 15.4±1.8 15.9±1.8 18.4±1.7
Dissolved oxygen (mg/L) 9.35±0.5 9.38±0.8 6.89±3.5
Salinity 35.9±0.3 35.9±0.3 27.9±7.1
pH 8.01±0.2 8.07±0.1 7.87±0.3
Nutrients
Ammonia (NH4) 0.07±0.03 0.04±0.03 1.1±1,0
Phosphate (PO4) 0.02±0.01 0.02±0.01 2.5±2.3
Silica (Si) 0.6±0.3 0.5±0.4 1.6±1
Nitrite (NO2) 0.02±0.01 0.02±0.01 0.1±0.01
Nitrate (NO3) 0.07±0.06 0.08±0.06 0,15±0,13
Total suspended solids/L 24.8±12,5 13.2±7.4 61.3±26.4
Total coliforms (UFC/100mL) 98 202 >300
2.3.2 Intertidal macroinvertebrate assemblage abundance
2.3.2.1 Littoral fringe
At the littoral fringe only the gastropod Melarhaphe neritoides and (occasionally) the isopod
Ligia oceanica were found. PERMANOVA analysis did not detect any significant differences
in macrofauna assemblage density between impacted and reference areas, but only a
significant temporal variability (Table 2.2). The same was observed for biomass, with no
differences between impacted and reference areas (Table 2.2).
Understanding the effects of sewage pollution on intertidal macroinvertebrate assemblages
28
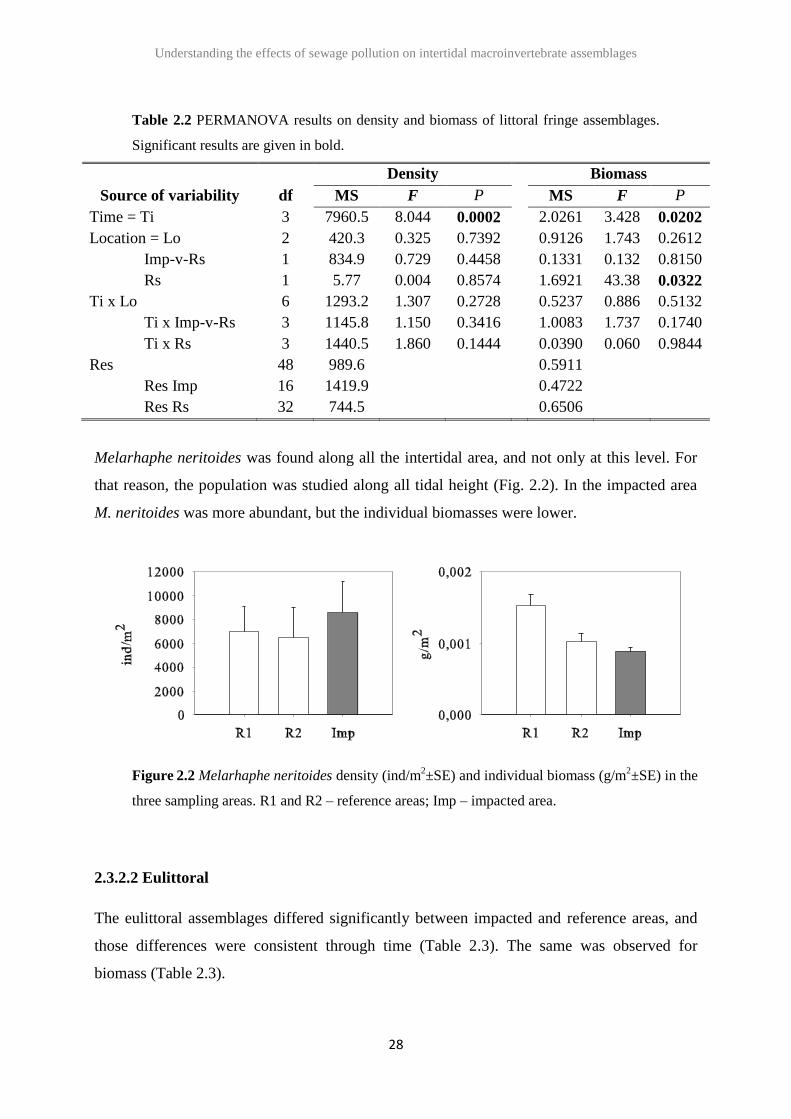
Table 2.2 PERMANOVA results on density and biomass of littoral fringe assemblages.
Significant results are given in bold.
Density Biomass
Source of variability df MS F P MS F P
Time = Ti 3 7960.5 8.044 0.0002 2.0261 3.428 0.0202
Location = Lo 2 420.3 0.325 0.7392 0.9126 1.743 0.2612
Imp-v-Rs 1 834.9 0.729 0.4458 0.1331 0.132 0.8150
Rs 1 5.77 0.004 0.8574 1.6921 43.38 0.0322
Ti x Lo 6 1293.2 1.307 0.2728 0.5237 0.886 0.5132
Ti x Imp-v-Rs 3 1145.8 1.150 0.3416 1.0083 1.737 0.1740
Ti x Rs 3 1440.5 1.860 0.1444 0.0390 0.060 0.9844
Res 48 989.6 0.5911
Res Imp 16 1419.9 0.4722
Res Rs 32 744.5 0.6506
Melarhaphe neritoides was found along all the intertidal area, and not only at this level. For
that reason, the population was studied along all tidal height (Fig. 2.2). In the impacted area
M. neritoides was more abundant, but the individual biomasses were lower.
Figure 2.2 Melarhaphe neritoides density (ind/m2±SE) and individual biomass (g/m
2±SE) in the
three sampling areas. R1 and R2 – reference areas; Imp – impacted area.
2.3.2.2 Eulittoral
The eulittoral assemblages differed significantly between impacted and reference areas, and
those differences were consistent through time (Table 2.3). The same was observed for
biomass (Table 2.3).
Understanding the effects of sewage pollution on intertidal macroinvertebrate assemblages
29
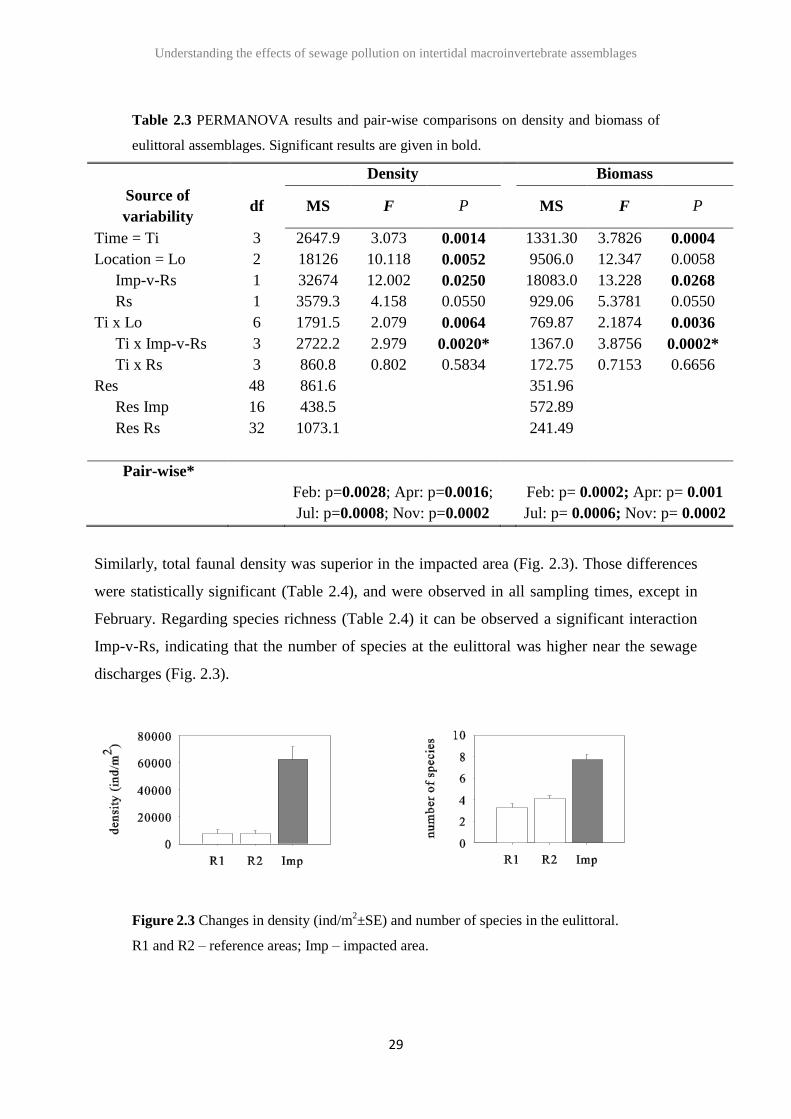
Table 2.3 PERMANOVA results and pair-wise comparisons on density and biomass of
eulittoral assemblages. Significant results are given in bold.
Density Biomass
Source of
variability df MS F P MS F P
Time = Ti 3 2647.9 3.073 0.0014 1331.30 3.7826 0.0004
Location = Lo 2 18126 10.118 0.0052 9506.0 12.347 0.0058
Imp-v-Rs 1 32674 12.002 0.0250 18083.0 13.228 0.0268
Rs 1 3579.3 4.158 0.0550 929.06 5.3781 0.0550
Ti x Lo 6 1791.5 2.079 0.0064 769.87 2.1874 0.0036
Ti x Imp-v-Rs 3 2722.2 2.979 0.0020* 1367.0 3.8756 0.0002*
Ti x Rs 3 860.8 0.802 0.5834 172.75 0.7153 0.6656
Res 48 861.6 351.96
Res Imp 16 438.5 572.89
Res Rs 32 1073.1 241.49
Pair-wise*
Feb: p=0.0028; Apr: p=0.0016;
Jul: p=0.0008; Nov: p=0.0002
Feb: p= 0.0002; Apr: p= 0.001
Jul: p= 0.0006; Nov: p= 0.0002
Similarly, total faunal density was superior in the impacted area (Fig. 2.3). Those differences
were statistically significant (Table 2.4), and were observed in all sampling times, except in
February. Regarding species richness (Table 2.4) it can be observed a significant interaction
Imp-v-Rs, indicating that the number of species at the eulittoral was higher near the sewage
discharges (Fig. 2.3).
Figure 2.3 Changes in density (ind/m2±SE) and number of species in the eulittoral.
R1 and R2 – reference areas; Imp – impacted area.
Understanding the effects of sewage pollution on intertidal macroinvertebrate assemblages
30
Table 2.4 PERMANOVA results and pair-wise comparisons on total faunal density and
number of species for the eulittoral. Significant results are given in bold.
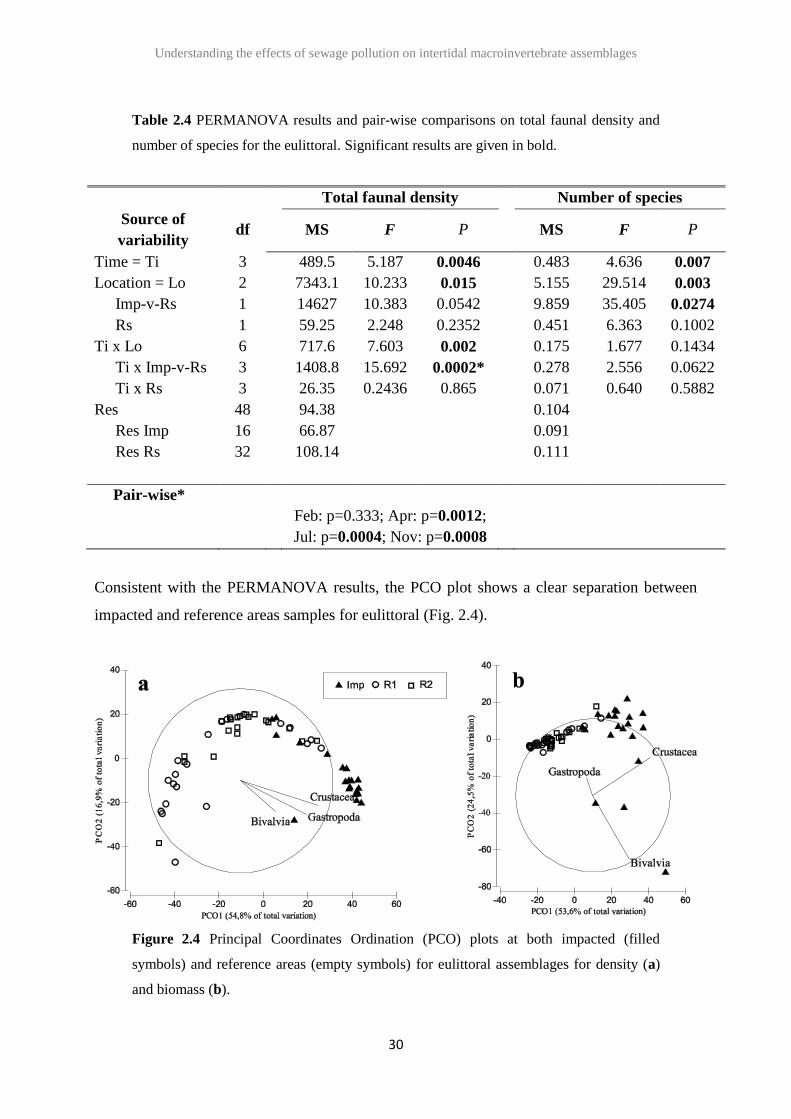
Consistent with the PERMANOVA results, the PCO plot shows a clear separation between
impacted and reference areas samples for eulittoral (Fig. 2.4).
Figure 2.4 Principal Coordinates Ordination (PCO) plots at both impacted (filled
symbols) and reference areas (empty symbols) for eulittoral assemblages for density (a)
and biomass (b).
Total faunal density Number of species
Source of
variability df MS F P MS F P
Time = Ti 3 489.5 5.187 0.0046 0.483 4.636 0.007
Location = Lo 2 7343.1 10.233 0.015 5.155 29.514 0.003
Imp-v-Rs 1 14627 10.383 0.0542 9.859 35.405 0.0274
Rs 1 59.25 2.248 0.2352 0.451 6.363 0.1002
Ti x Lo 6 717.6 7.603 0.002 0.175 1.677 0.1434
Ti x Imp-v-Rs 3 1408.8 15.692 0.0002* 0.278 2.556 0.0622
Ti x Rs 3 26.35 0.2436 0.865 0.071 0.640 0.5882
Res 48 94.38 0.104
Res Imp 16 66.87 0.091
Res Rs 32 108.14 0.111
Pair-wise*
Feb: p=0.333; Apr: p=0.0012;
Jul: p=0.0004; Nov: p=0.0008
Understanding the effects of sewage pollution on intertidal macroinvertebrate assemblages
31
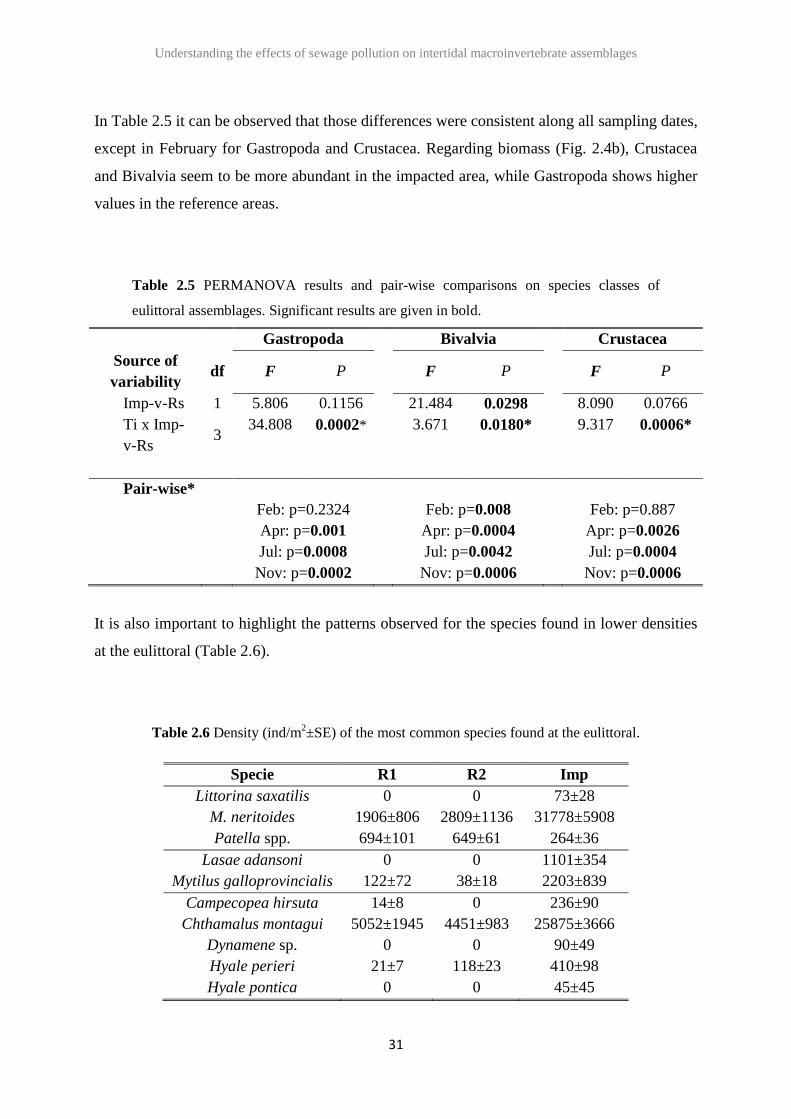
In Table 2.5 it can be observed that those differences were consistent along all sampling dates,
except in February for Gastropoda and Crustacea. Regarding biomass (Fig. 2.4b), Crustacea
and Bivalvia seem to be more abundant in the impacted area, while Gastropoda shows higher
values in the reference areas.
Table 2.5 PERMANOVA results and pair-wise comparisons on species classes of
eulittoral assemblages. Significant results are given in bold.
Gastropoda Bivalvia Crustacea
Source of
variability df F P F P F P
Imp-v-Rs 1 5.806 0.1156 21.484 0.0298 8.090 0.0766
Ti x Imp-
v-Rs 3
34.808 0.0002*
3.671 0.0180*
9.317 0.0006*
Pair-wise*
Feb: p=0.2324
Apr: p=0.001
Jul: p=0.0008
Nov: p=0.0002
Feb: p=0.008
Apr: p=0.0004
Jul: p=0.0042
Nov: p=0.0006
Feb: p=0.887
Apr: p=0.0026
Jul: p=0.0004
Nov: p=0.0006
It is also important to highlight the patterns observed for the species found in lower densities
at the eulittoral (Table 2.6).
Table 2.6 Density (ind/m2±SE) of the most common species found at the eulittoral.
Specie R1 R2 Imp
Littorina saxatilis 0 0 73±28
M. neritoides 1906±806 2809±1136 31778±5908
Patella spp. 694±101 649±61 264±36
Lasae adansoni 0 0 1101±354
Mytilus galloprovincialis 122±72 38±18 2203±839
Campecopea hirsuta 14±8 0 236±90
Chthamalus montagui 5052±1945 4451±983 25875±3666
Dynamene sp. 0 0 90±49
Hyale perieri 21±7 118±23 410±98
Hyale pontica 0 0 45±45
Understanding the effects of sewage pollution on intertidal macroinvertebrate assemblages
32
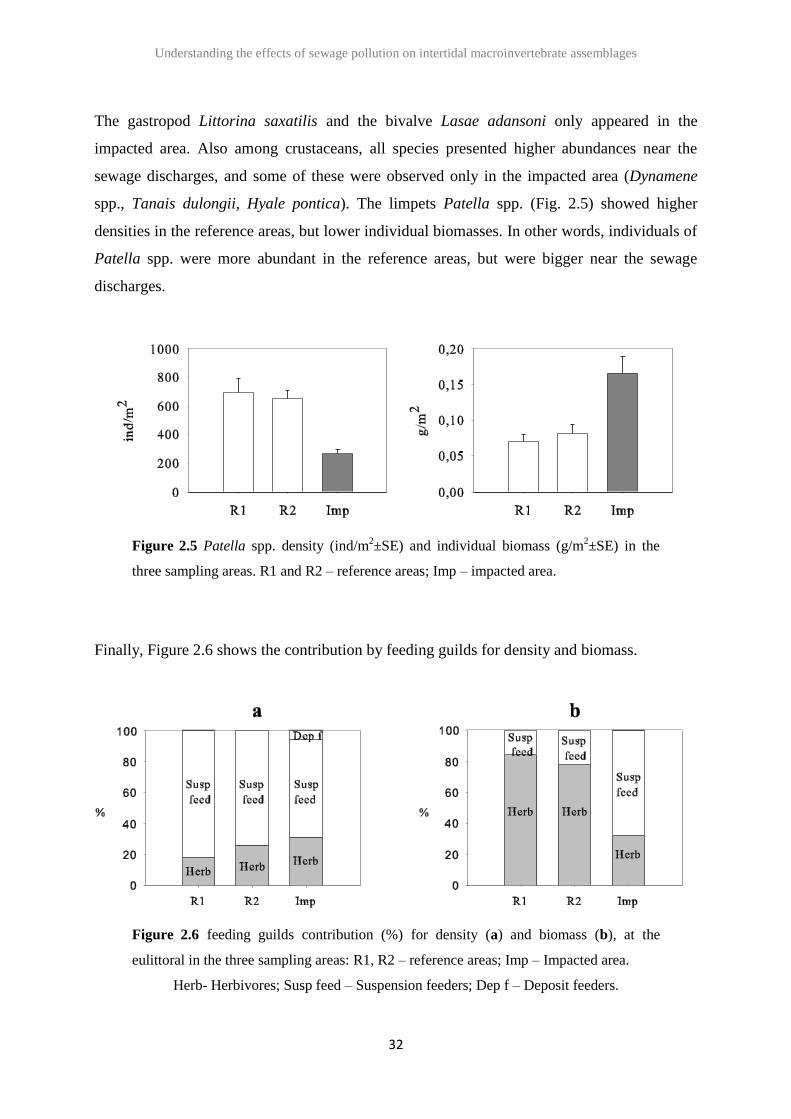
The gastropod Littorina saxatilis and the bivalve Lasae adansoni only appeared in the
impacted area. Also among crustaceans, all species presented higher abundances near the
sewage discharges, and some of these were observed only in the impacted area (Dynamene
spp., Tanais dulongii, Hyale pontica). The limpets Patella spp. (Fig. 2.5) showed higher
densities in the reference areas, but lower individual biomasses. In other words, individuals of
Patella spp. were more abundant in the reference areas, but were bigger near the sewage
discharges.
Figure 2.5 Patella spp. density (ind/m2±SE) and individual biomass (g/m
2±SE) in the
three sampling areas. R1 and R2 – reference areas; Imp – impacted area.
Finally, Figure 2.6 shows the contribution by feeding guilds for density and biomass.
Figure 2.6 feeding guilds contribution (%) for density (a) and biomass (b), at the
eulittoral in the three sampling areas: R1, R2 – reference areas; Imp – Impacted area.
Herb- Herbivores; Susp feed – Suspension feeders; Dep f – Deposit feeders.
Understanding the effects of sewage pollution on intertidal macroinvertebrate assemblages
33
As can be seen, at the eulittoral, the feeding guild composition for density (Fig. 2.6a) is
similar in the three areas, with a dominance of suspension feeders. On the contrary,
considering biomass (Fig. 2.6b), the feeding guild composition changed. There was a
dominance of herbivores in the reference areas, replaced by a higher percentage of suspension
feeders in the impacted area (Fig. 2.6).
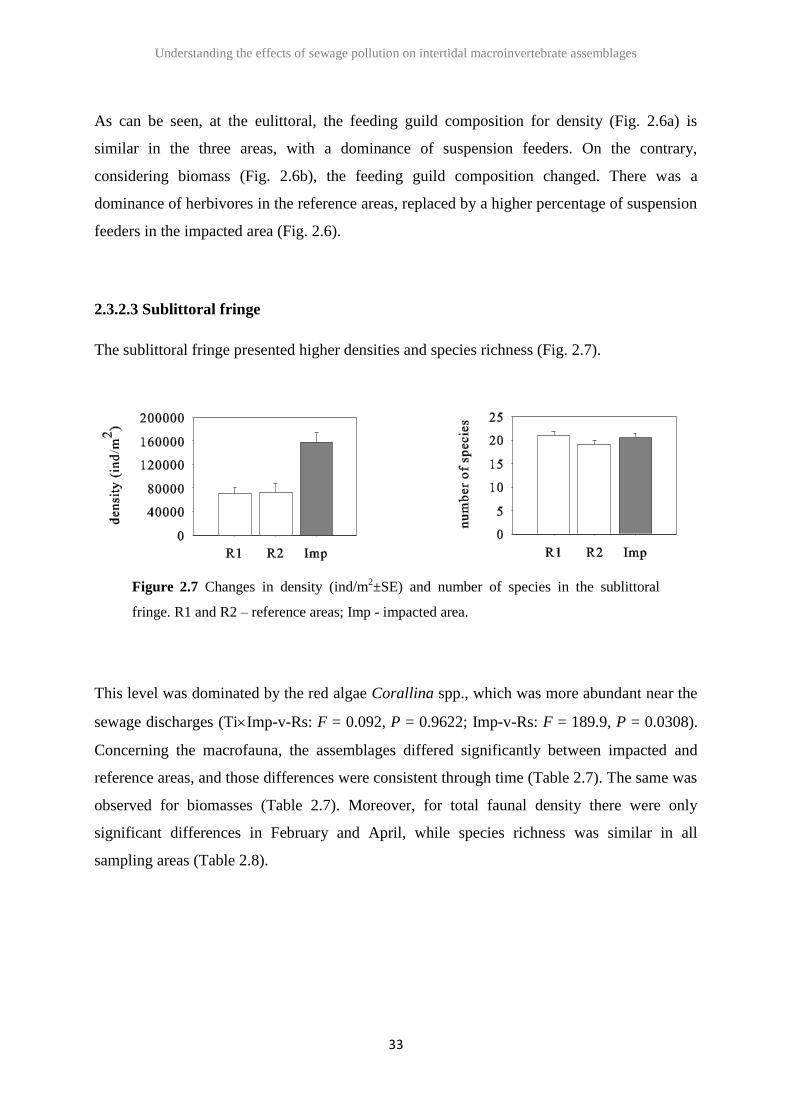
2.3.2.3 Sublittoral fringe
The sublittoral fringe presented higher densities and species richness (Fig. 2.7).
Figure 2.7 Changes in density (ind/m2±SE) and number of species in the sublittoral
fringe. R1 and R2 – reference areas; Imp - impacted area.
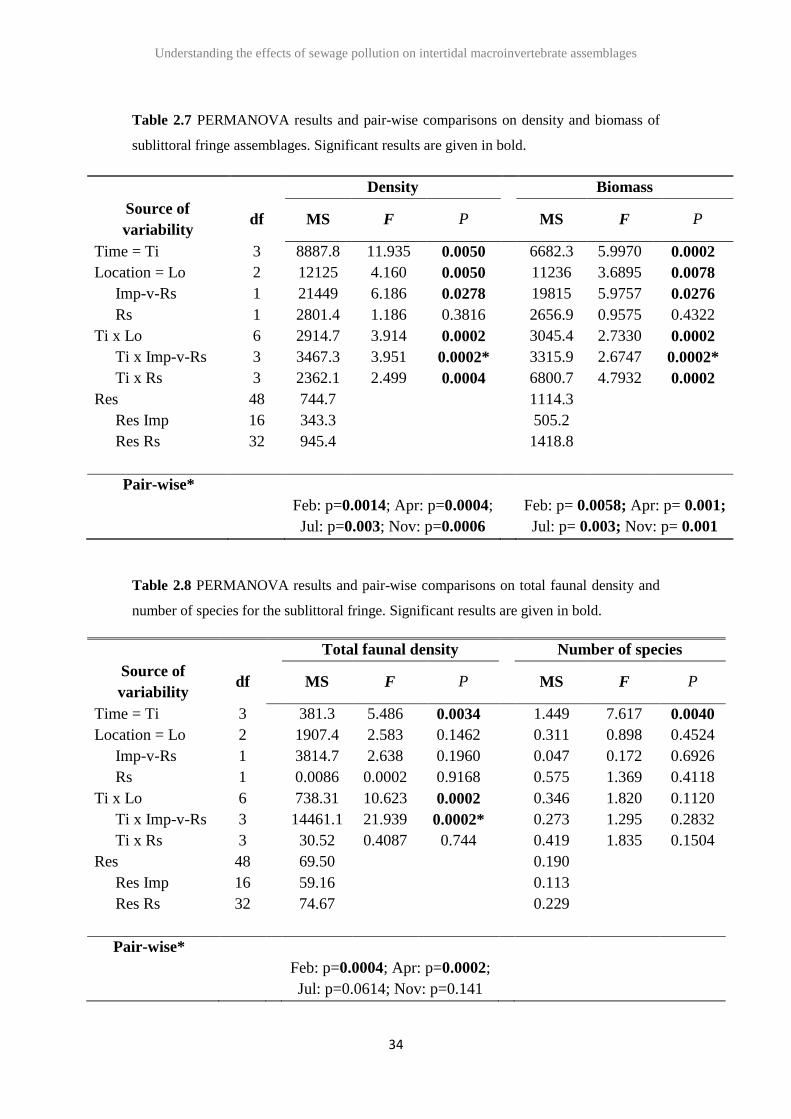
This level was dominated by the red algae Corallina spp., which was more abundant near the
sewage discharges (TiImp-v-Rs: F = 0.092, P = 0.9622; Imp-v-Rs: F = 189.9, P = 0.0308).
Concerning the macrofauna, the assemblages differed significantly between impacted and
reference areas, and those differences were consistent through time (Table 2.7). The same was
observed for biomasses (Table 2.7). Moreover, for total faunal density there were only
significant differences in February and April, while species richness was similar in all
sampling areas (Table 2.8).
Understanding the effects of sewage pollution on intertidal macroinvertebrate assemblages
34
Table 2.7 PERMANOVA results and pair-wise comparisons on density and biomass of
sublittoral fringe assemblages. Significant results are given in bold.
Density Biomass
Source of
variability df MS F P MS F P
Time = Ti 3 8887.8 11.935 0.0050 6682.3 5.9970 0.0002
Location = Lo 2 12125 4.160 0.0050 11236 3.6895 0.0078
Imp-v-Rs 1 21449 6.186 0.0278 19815 5.9757 0.0276
Rs 1 2801.4 1.186 0.3816 2656.9 0.9575 0.4322
Ti x Lo 6 2914.7 3.914 0.0002 3045.4 2.7330 0.0002
Ti x Imp-v-Rs 3 3467.3 3.951 0.0002* 3315.9 2.6747 0.0002*
Ti x Rs 3 2362.1 2.499 0.0004 6800.7 4.7932 0.0002
Res 48 744.7 1114.3
Res Imp 16 343.3 505.2
Res Rs 32 945.4 1418.8
Pair-wise*
Feb: p=0.0014; Apr: p=0.0004;
Jul: p=0.003; Nov: p=0.0006
Feb: p= 0.0058; Apr: p= 0.001;
Jul: p= 0.003; Nov: p= 0.001
Table 2.8 PERMANOVA results and pair-wise comparisons on total faunal density and
number of species for the sublittoral fringe. Significant results are given in bold.
Total faunal density Number of species
Source of
variability df MS F P MS F P
Time = Ti 3 381.3 5.486 0.0034 1.449 7.617 0.0040
Location = Lo 2 1907.4 2.583 0.1462 0.311 0.898 0.4524
Imp-v-Rs 1 3814.7 2.638 0.1960 0.047 0.172 0.6926
Rs 1 0.0086 0.0002 0.9168 0.575 1.369 0.4118
Ti x Lo 6 738.31 10.623 0.0002 0.346 1.820 0.1120
Ti x Imp-v-Rs 3 14461.1 21.939 0.0002* 0.273 1.295 0.2832
Ti x Rs 3 30.52 0.4087 0.744 0.419 1.835 0.1504
Res 48 69.50 0.190
Res Imp 16 59.16 0.113
Res Rs 32 74.67 0.229
Pair-wise*
Feb: p=0.0004; Apr: p=0.0002;
Jul: p=0.0614; Nov: p=0.141
Understanding the effects of sewage pollution on intertidal macroinvertebrate assemblages
35
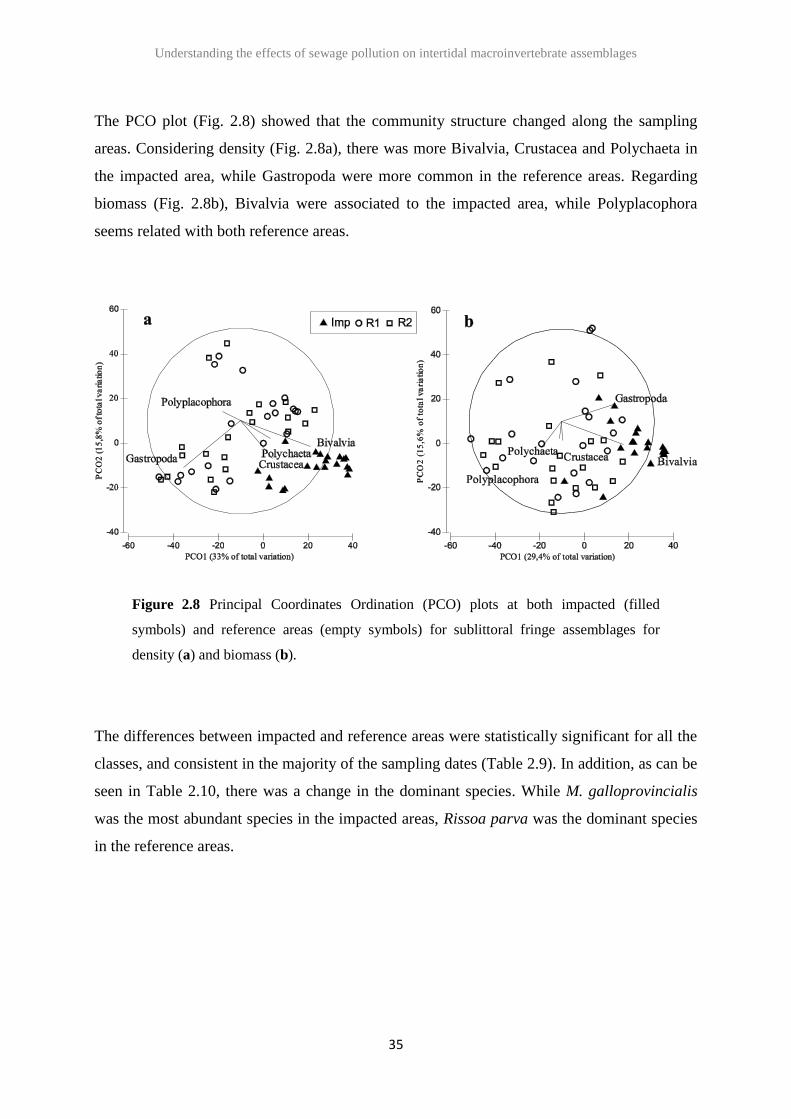
The PCO plot (Fig. 2.8) showed that the community structure changed along the sampling
areas. Considering density (Fig. 2.8a), there was more Bivalvia, Crustacea and Polychaeta in
the impacted area, while Gastropoda were more common in the reference areas. Regarding
biomass (Fig. 2.8b), Bivalvia were associated to the impacted area, while Polyplacophora
seems related with both reference areas.
Figure 2.8 Principal Coordinates Ordination (PCO) plots at both impacted (filled
symbols) and reference areas (empty symbols) for sublittoral fringe assemblages for
density (a) and biomass (b).
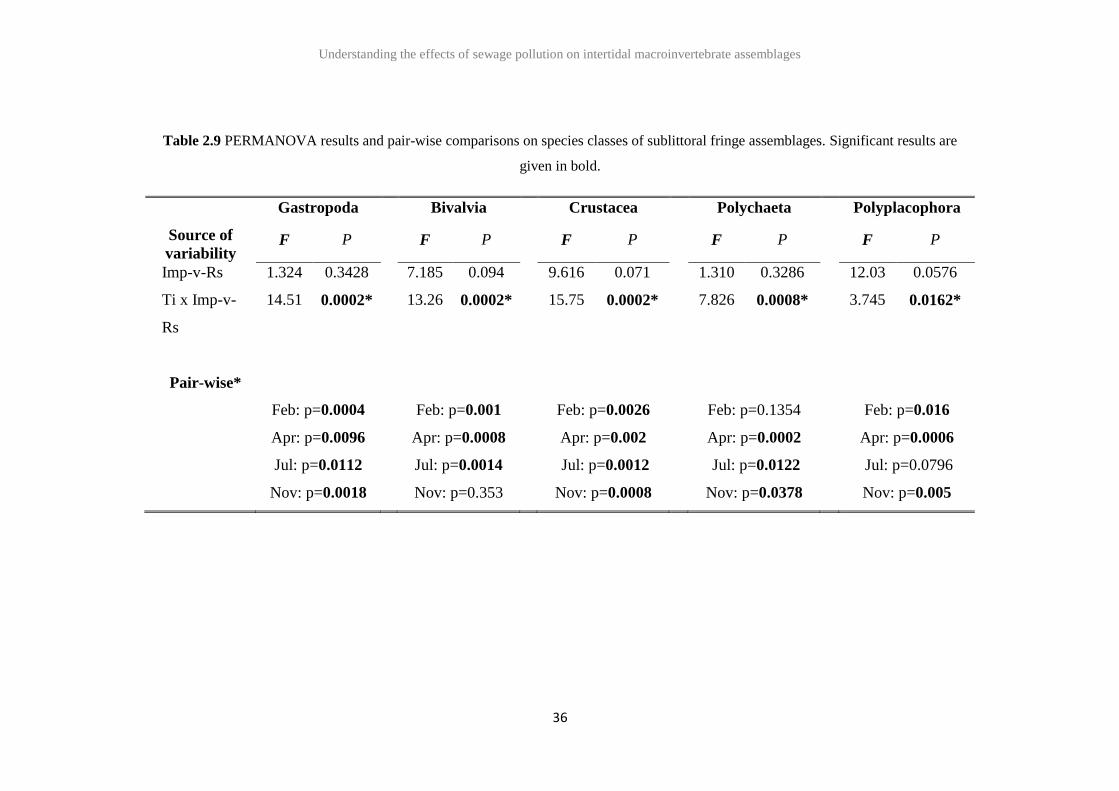
The differences between impacted and reference areas were statistically significant for all the
classes, and consistent in the majority of the sampling dates (Table 2.9). In addition, as can be
seen in Table 2.10, there was a change in the dominant species. While M. galloprovincialis
was the most abundant species in the impacted areas, Rissoa parva was the dominant species
in the reference areas.
Understanding the effects of sewage pollution on intertidal macroinvertebrate assemblages
36
Table 2.9 PERMANOVA results and pair-wise comparisons on species classes of sublittoral fringe assemblages. Significant results are
given in bold.
Gastropoda Bivalvia Crustacea Polychaeta Polyplacophora
Source of
variability F P F P F P F P F P
Imp-v-Rs 1.324 0.3428 7.185 0.094 9.616 0.071 1.310 0.3286 12.03 0.0576
Ti x Imp-v-
Rs
14.51 0.0002*
13.26 0.0002*
15.75 0.0002* 7.826 0.0008* 3.745 0.0162*
Pair-wise*
Feb: p=0.0004
Apr: p=0.0096
Jul: p=0.0112
Nov: p=0.0018
Feb: p=0.001
Apr: p=0.0008
Jul: p=0.0014
Nov: p=0.353
Feb: p=0.0026
Apr: p=0.002
Jul: p=0.0012
Nov: p=0.0008
Feb: p=0.1354
Apr: p=0.0002
Jul: p=0.0122
Nov: p=0.0378
Feb: p=0.016
Apr: p=0.0006
Jul: p=0.0796
Nov: p=0.005
Understanding the effects of sewage pollution on intertidal macroinvertebrate assemblages
37
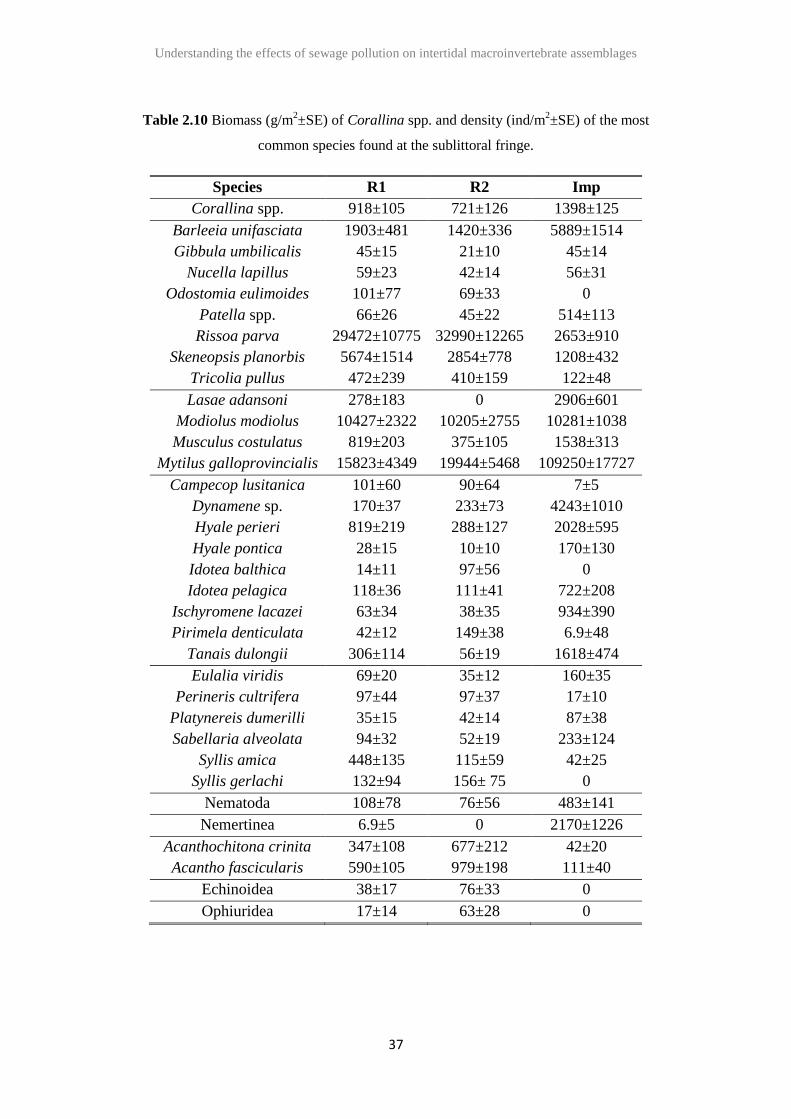
Table 2.10 Biomass (g/m2±SE) of Corallina spp. and density (ind/m
2±SE) of the most
common species found at the sublittoral fringe.
Species R1 R2 Imp
Corallina spp. 918±105 721±126 1398±125
Barleeia unifasciata 1903±481 1420±336 5889±1514
Gibbula umbilicalis 45±15 21±10 45±14
Nucella lapillus 59±23 42±14 56±31
Odostomia eulimoides 101±77 69±33 0
Patella spp. 66±26 45±22 514±113
Rissoa parva 29472±10775 32990±12265 2653±910
Skeneopsis planorbis 5674±1514 2854±778 1208±432
Tricolia pullus 472±239 410±159 122±48
Lasae adansoni 278±183 0 2906±601
Modiolus modiolus 10427±2322 10205±2755 10281±1038
Musculus costulatus 819±203 375±105 1538±313
Mytilus galloprovincialis 15823±4349 19944±5468 109250±17727
Campecop lusitanica 101±60 90±64 7±5
Dynamene sp. 170±37 233±73 4243±1010
Hyale perieri 819±219 288±127 2028±595
Hyale pontica 28±15 10±10 170±130
Idotea balthica 14±11 97±56 0
Idotea pelagica 118±36 111±41 722±208
Ischyromene lacazei 63±34 38±35 934±390
Pirimela denticulata 42±12 149±38 6.9±48
Tanais dulongii 306±114 56±19 1618±474
Eulalia viridis 69±20 35±12 160±35
Perineris cultrifera 97±44 97±37 17±10
Platynereis dumerilli 35±15 42±14 87±38
Sabellaria alveolata 94±32 52±19 233±124
Syllis amica 448±135 115±59 42±25
Syllis gerlachi 132±94 156± 75 0
Nematoda 108±78 76±56 483±141
Nemertinea 6.9±5 0 2170±1226
Acanthochitona crinita 347±108 677±212 42±20
Acantho fascicularis 590±105 979±198 111±40
Echinoidea 38±17 76±33 0
Ophiuridea 17±14 63±28 0
Understanding the effects of sewage pollution on intertidal macroinvertebrate assemblages
38
Several species of gastropods were present at the sublittoral fringe (Table 2.10). Some species
were equally abundant along all sampling areas (as Nucella lapillus or Gibbula umbilicalis).
However, the majority were mainly present at the reference areas, namely Rissoa parva,
Skeneopsis planorbis or Tricolia pullus. On the contrary, bivalves (as Mytilus
galloprovincialis, Musculus costulatus or Lasae adansoni) were more abundant near the
sewage discharges, with the exception of Modiolus modiolus (Table 2.10). Regarding
crustaceans, Hyale perieri, Idotea pelagica, Dynamene spp. and Tanais dulongii showed
higher abundances near the sewage discharges (Table 2.10). Nevertheless, other species
seemed to prefer the reference areas (Pirimela denticulata, Campecopea lusitanica). The
same pattern was also observed for the polychaetes (Table 2.10): Eulalia viridis or Sabellaria
alveolata were more abundant in the impacted area and Perinereis spp. or Syllis gerlachi were
more abundant in the reference areas. Finally, nematoda and nemertinea seemed to prefer the
impacted area, while Polyplacophora were more abundant in the reference areas (Table 2.10).
Other classes, although with lower numbers, like echinoidea and ophiuridea were only
observed in the reference areas.
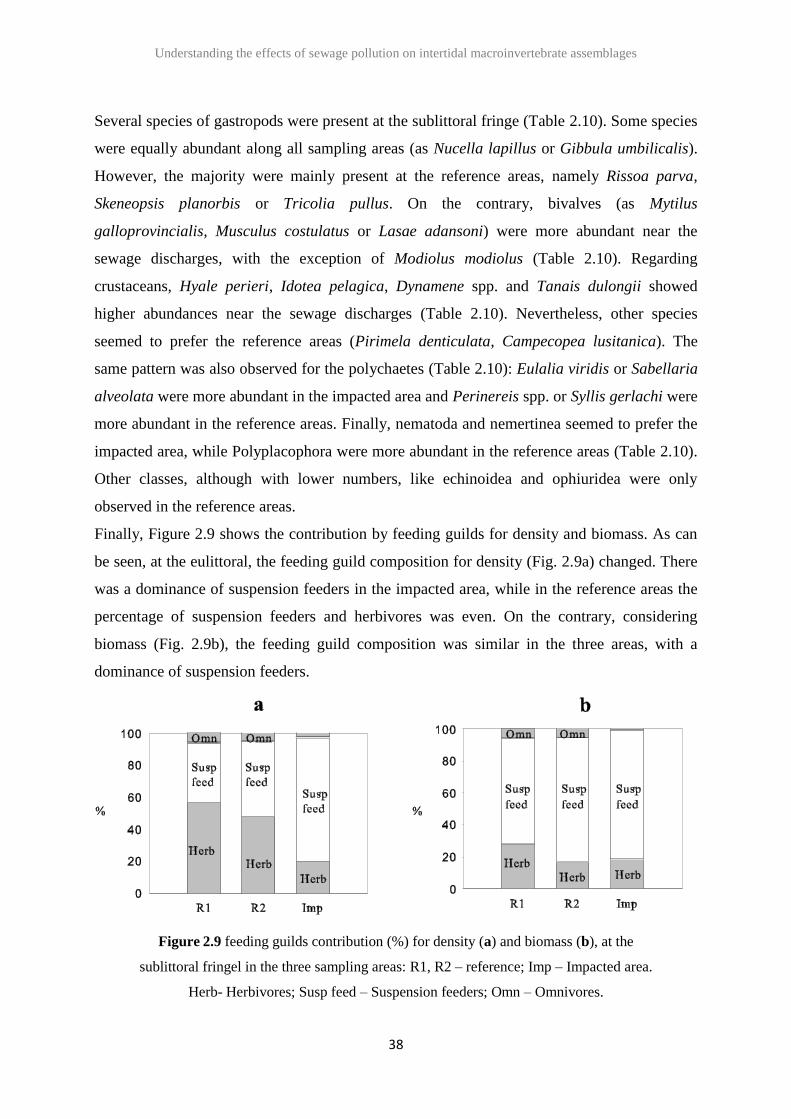
Finally, Figure 2.9 shows the contribution by feeding guilds for density and biomass. As can
be seen, at the eulittoral, the feeding guild composition for density (Fig. 2.9a) changed. There
was a dominance of suspension feeders in the impacted area, while in the reference areas the
percentage of suspension feeders and herbivores was even. On the contrary, considering
biomass (Fig. 2.9b), the feeding guild composition was similar in the three areas, with a
dominance of suspension feeders.
Figure 2.9 feeding guilds contribution (%) for density (a) and biomass (b), at the
sublittoral fringel in the three sampling areas: R1, R2 – reference; Imp – Impacted area.
Herb- Herbivores; Susp feed – Suspension feeders; Omn – Omnivores.
Understanding the effects of sewage pollution on intertidal macroinvertebrate assemblages
39
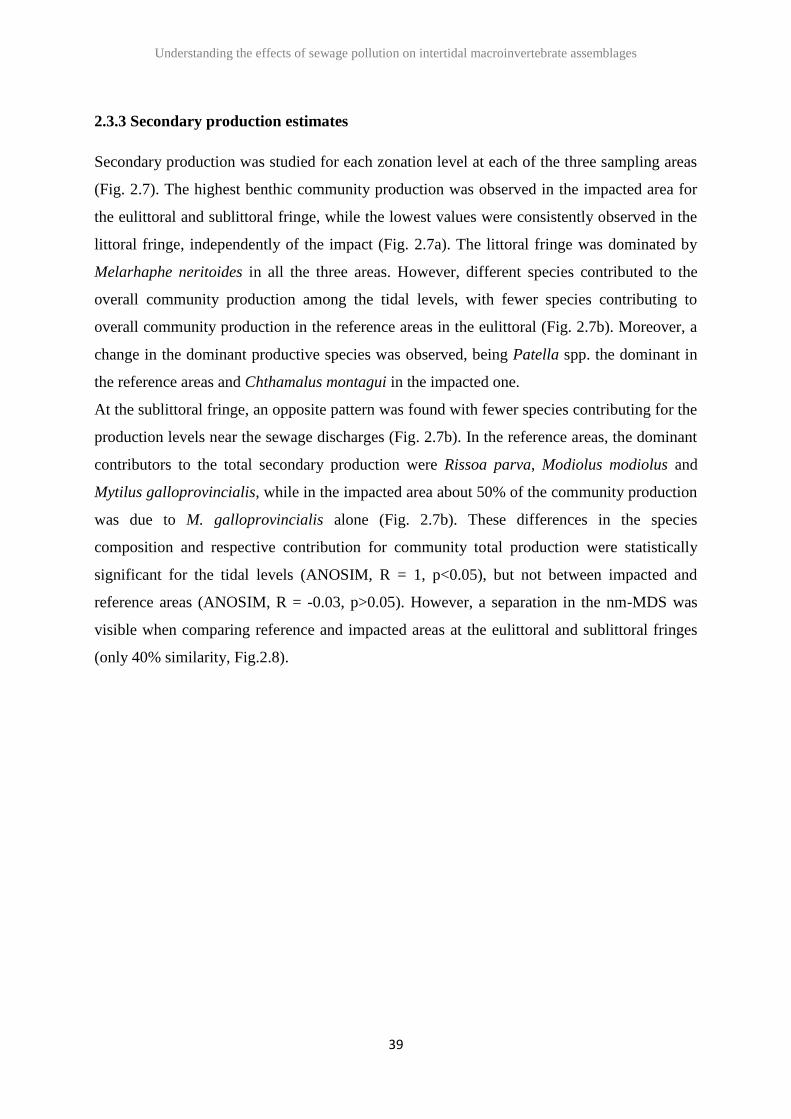
2.3.3 Secondary production estimates
Secondary production was studied for each zonation level at each of the three sampling areas
(Fig. 2.7). The highest benthic community production was observed in the impacted area for
the eulittoral and sublittoral fringe, while the lowest values were consistently observed in the
littoral fringe, independently of the impact (Fig. 2.7a). The littoral fringe was dominated by
Melarhaphe neritoides in all the three areas. However, different species contributed to the
overall community production among the tidal levels, with fewer species contributing to
overall community production in the reference areas in the eulittoral (Fig. 2.7b). Moreover, a
change in the dominant productive species was observed, being Patella spp. the dominant in
the reference areas and Chthamalus montagui in the impacted one.
At the sublittoral fringe, an opposite pattern was found with fewer species contributing for the
production levels near the sewage discharges (Fig. 2.7b). In the reference areas, the dominant
contributors to the total secondary production were Rissoa parva, Modiolus modiolus and
Mytilus galloprovincialis, while in the impacted area about 50% of the community production
was due to M. galloprovincialis alone (Fig. 2.7b). These differences in the species
composition and respective contribution for community total production were statistically
significant for the tidal levels (ANOSIM, R = 1, p<0.05), but not between impacted and
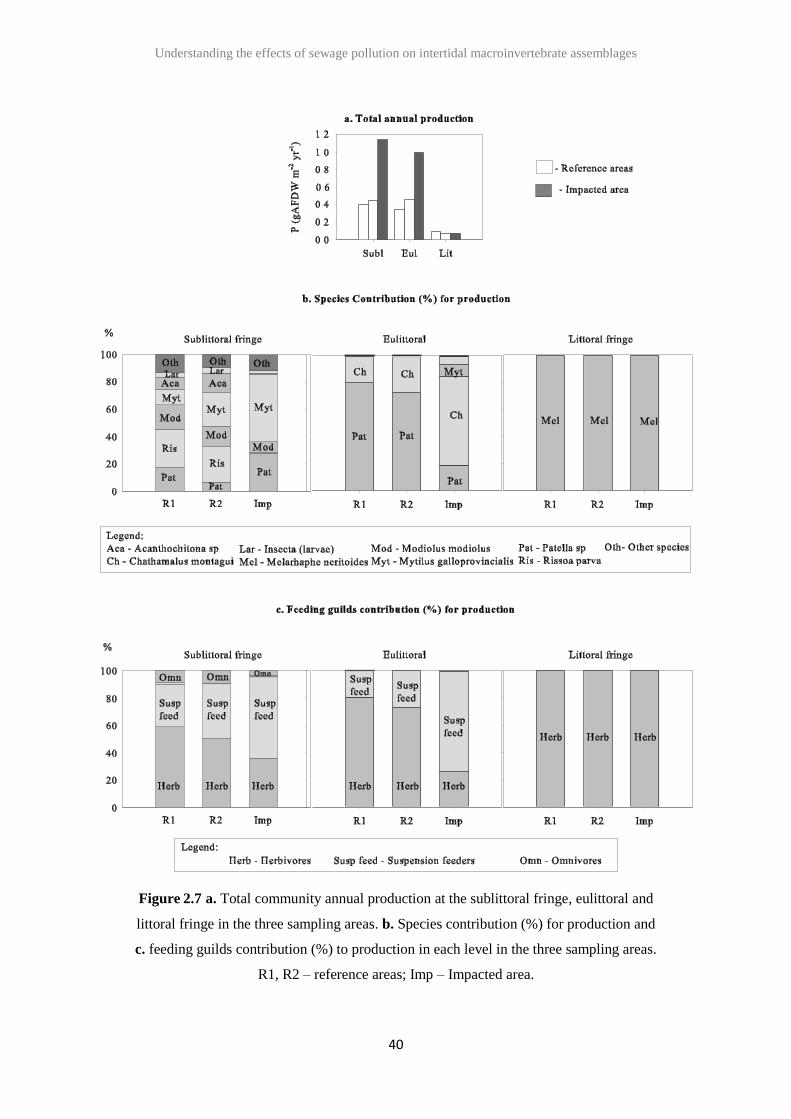
reference areas (ANOSIM, R = -0.03, p>0.05). However, a separation in the nm-MDS was
visible when comparing reference and impacted areas at the eulittoral and sublittoral fringes
(only 40% similarity, Fig.2.8).
Understanding the effects of sewage pollution on intertidal macroinvertebrate assemblages
40
Figure 2.7 a. Total community annual production at the sublittoral fringe, eulittoral and
littoral fringe in the three sampling areas. b. Species contribution (%) for production and
c. feeding guilds contribution (%) to production in each level in the three sampling areas.
R1, R2 – reference areas; Imp – Impacted area.
Understanding the effects of sewage pollution on intertidal macroinvertebrate assemblages
41
Figure 2.8 Two dimensional nm-MDS ordination plot of macroinvertebrate assemblage
production for the reference (R1 and R2) and impacted (Imp) areas at the sublittoral
fringe, eulittoral and littoral fringe, with indication of the 40% and 60% similarity groups.
Regarding the feeding guilds, differences were also observed between impacted and reference
areas. Near the sewage discharges the feeding guild that most contributed for total production
was the suspension feeders, while in the reference areas were the herbivores the group that
most contributed for production levels (Fig. 2.7c). When comparing tidal levels, feeding
guilds composition for the sublittoral and eulittoral was similar, dominated by herbivores and
suspension feeders and a smaller percentage of omnivores, especially at the sublittoral. A
single feeding guild was found at the littoral fringe, the herbivore Melarhaphe neritoides.
2.4 Discussion
2.4.1 Environmental variables
The effects of the sewage discharges in the environmental variables have already been noticed
in previous studies. Roberts et al. (1998) and Elías et al. (2009) detected an increase in the
nutrient concentration and suspended solids. López-Gappa et al. (1990, 1993) observed an
increase in the seawater temperature and total coliforms and a decrease in pH, salinity and
dissolved oxygen values in Argentina shores. As a rule, during the sewage treatment gross
Understanding the effects of sewage pollution on intertidal macroinvertebrate assemblages
42
solids are eliminated from the effluents (primary treatment). Afterwards organic matter is
removed (secondary treatment) and finally bacteria and nutrients are taken out of the effluents
(tertiary treatment). However, the sewage treatment plant near our sampling area is only
prepared to secondary treatment, and consequently the observed increase in the sea water
temperature and the decrease in dissolved oxygen, salinity and pH become expectable.
Likewise, the lack of tertiary treatment also explains the higher concentrations of total
suspended solids, total coliforms and nutrients near the sewage discharges. Concerning
nutrients, the higher concentrations were found for ammonia and phosphate, which is also
expectable, since domestic and industrial effluents are the main contributors for the
eutrophication of marine waters.
2.4.2 Macroinvertebrate assemblage density
2.4.2.1 Littoral fringe
The littoral fringe is the level more distant from the sewage discharges, which can explain the
lower effects observed in abundance and species richness. Two species were found at this
level: the gastropod Melarhaphe neritoides and the isopod Ligia oceanica. L. oceanica was
only found in the impacted area. This isopod is a mobile omnivore that feeds on particulate
organic matter and detritus (Fish and Fish, 2011; Littler and Murray, 1975) which might
explains its higher abundance near the sewage discharges. On the contrary, no differences
were found for M. neritoides between sampling areas. However, to assess the effect of sewage
discharges on M. neritoides population it is necessary to study the population along all tidal
height, and not only at the littoral fringe. Planktonic larvae settle on the lower levels of rocky
shores and then start moving upshore, resulting in a shell size gradient (Cabral-Oliveira et al.,
2009). The results obtained in this work confirmed previous findings (Cabral-Oliveira et al.,
2009) where M. neritoides density was higher in the impacted area as a result of massive
settlement. Also in this work was found a higher number of juveniles at eulittoral near the
outfall. The higher concentration of nutrients near sewage discharges will lead to a larger
quantity of microalgae on the rocky surfaces, on which M. neritoides feed. This could be
attractive to the settling of M. neritoides larvae. However, during its life span a significant
mortality leads to similar density values at the littoral fringe and to bigger individuals in the
Understanding the effects of sewage pollution on intertidal macroinvertebrate assemblages
43
reference areas. This reduced size of M. neritoides in the impacted area is most probably
related to the greater densities found, in turn leading to greater competition for food.
2.4.2.2 Eulittoral
Previous studies (Archambault et al., 2001) suggested that sewage discharges have little
impact in organisms that live at the eulittoral. However, different conclusions can be drawn
with the present work.
At the eulittoral the higher abundances found in the impacted area were explained by the
larger number of gastropods (Melarhaphe neritoides), bivalves (Mytilus galloprovincialis)
and crustaceans (Chthamalus montagui). M. galloprovincialis and C. montagui had higher
densities near the sewage discharges, at all levels. Both species are filter-feeders and space
occupiers (Hawkins and Jones, 1992). Attending to the higher amount of suspended solids
near the sewage discharges it was expectable to find higher densities where food availability
is higher.
Concerning the so called “not dominant species”, at the eulittoral, the higher abundances of
the bivalve Lasae adansoni, the isopods Campecopea hirsuta or Dynamene spp., and the
small periwinkles Littorina saxatilis near sewage discharges can be due to the higher amount
of empty barnacle’s cases, which are the habitat of those species (Fish and Fish, 2011). This
led to an increase in species richness in the impacted area. Previous authors (Magurran and
McGill, 2010) have already pointed out that periodic disturbance might increase biodiversity
by adding more resources to the habitat and by promoting the coexistence of species adapted
to different conditions.
The limpets Patella spp. were more abundant in the reference areas, which possibly explains
the higher contribution of herbivores in that areas. But the individuals were bigger near the
sewage discharges. These results are consistent with earlier studies (Tablado and López-
Gappa, 2001) that observed greater sizes and growth rates near the sewage discharges.
Intraspecific competition normally occurs in the rocky intertidal environment when space or
food resources are not enough or when recruitment occurs in high densities leading to
crowding (Boaventura et al., 2002b). Due to the organic enrichment near the sewage
discharges, the competition should be mainly for space. The higher abundance of juveniles
near the sewage discharges promotes competition for space, and only a small number of
Understanding the effects of sewage pollution on intertidal macroinvertebrate assemblages
44
individuals survive and become adults. Nevertheless those adults grow more (than the adults
from the reference areas) due to the higher availability of food. Another important issue to be
taken into account is the higher sea water temperature observed near the sewage discharges
that can also promote the growth of this species.
2.4.2.3 Sublittoral fringe
At the sublittoral fringe were found the highest number of species, and also the higher
abundances. Although the number of species was similar in all sampling areas there were
qualitative differences in the species present in the impacted and reference areas.
In the impacted area the dominant class was Bivalvia, which can be explained by the feeding
mode. Being filter-feeders it was expectable to find higher densities near the sewage
discharges, rich in suspended solids.
Regarding the other taxonomic groups (Gastropoda, Crustacea, Polychaeta and
Polyplacophora) there were species that seem to prefer the reference areas, and others that
were more abundant in the impacted area. Even so, the majority of gastropods and chitons
seem to prefer the reference areas, while Crustacea and Polychaeta seem to prefer the
impacted area. Polyplacophora, like most gastropod species, seem to prefer non-polluted
habitats. Earlier studies (Airoldi, 2003; Terlizzi et al., 2005a) have advanced the possible
explanation that changes in the sedimentation rate due to the increase of suspended solids near
the sewage discharges can have negative effects on gastropods. Atalah and Crowe (2012)
have also found consistent differences in molluscan assemblages related with nutrient
enrichment, which suggests that those assemblages can be potential indicators of pollution in
coastal areas.
Concerning marine worms, the result was expected, since other studies on polychaetes
assemblages have also observed significant greater density, biomass and average number of
species near the sewage discharges (Anger, 1975; Dauer and Conner, 1980; Pearson and
Rosenberg, 1978). Nematoda and nemertinea normally increase its abundance near sewage
discharges due to their ability to exploit the food resources available (Fraschetti et al., 2006
and references therein). Due to that, these groups are classified as tolerant by Borja et al.
(2000).
Understanding the effects of sewage pollution on intertidal macroinvertebrate assemblages
45
Crustaceans are generally considered as very sensitive to pollution (De-la-Ossa-Carretero et
al., 2010 and references therein). The organic content and oxygen availability are some of the
factors used to explain the sensitivity of crustacean species. In this study these characteristics
were also found near the sewage discharges. However, in the present study, the majority of
crustacean species seem to prefer the impacted area. The most common crustaceans found at
the sublittoral fringe were Hyale perieri, Dynamene spp. and Tanais dulongui. Earlier studies
already found higher densities of these amphipods and tanaids species near sewage discharges
(Adami et al., 2004; Kalkan et al., 2007). The higher abundances near sewage are probably
explained by the higher amount of Corallina sp. (Fish and Fish, 2011) acting as refuge and
increasing the heterogeneity of the substrate. Despite all these, some crustacean species were
more abundant at the reference areas (e.g. Pirimela denticulata, Campecopea lusitanica).
Some other classes only appeared in the reference areas, like echinoidea and ophiuroidea.
This pattern was somehow expected since these groups are known to be very sensitive (Borja
et al., 2000).
2.4.3 Secondary production estimates
The secondary production of the macroinvertebrate community was higher near the sewage
discharges for the sublittoral and eulittoral zones, but no differences were found at the littoral
fringe, most probably because the littoral fringe is the level locating further away from the
sewage discharges. Differences in the community production composition were only
statistically significant between tidal levels, however there was a discrimination between
reference and impacted areas (>40% similarity). This increase in production due to nutrient
enrichment has also been observed before, as intermediate levels of nutrient enrichment in
relatively impoverished systems can increase primary production and subsequently secondary
production (Nixon and Buckley, 2002; Singer and Battin, 2007). However, it is important to
identify the source of the production, in particular the species responsible for that increase. It
is assumed that an increase of secondary production does not necessarily represent a healthier
ecosystem (Dolbeth et al., 2012). At the sublittoral fringe and eulittoral, there were
differences in the species that most contributed to total community production. Near the
sewage discharges, at the eulittoral, Patella spp. was replaced by Chthamalus montagui. The
sublittoral fringe in the impacted area was dominated by the bivalve M. galloprovincialis,
Understanding the effects of sewage pollution on intertidal macroinvertebrate assemblages
46
with a considerable decrease in species such as Rissoa parva and Acanthochitona spp. The
dominant species in the impacted area, C. montagui and M. galloprovincialis are tolerant
species to nutrient enrichment and trace elements (Borja et al., 2000,
http://www.marlin.ac.uk), while R. parva and Acanthochitona spp. are sensitive (Terlizzi et
al., 2005a; Atalah and Crowe, 2012) and Patella spp. is moderately sensitive to salinity
decreases (http://www.marlin.ac.uk). In fact, M. galloprovincialis has been associated to
moderate-poor environmental quality status and Patella spp. to high-good status in coastal
rocky assemblages (Díez et al., 2012). So, although there was a general community
production increase in the impacted area, this increase was due to the tolerant species in
detriment of the sensitive ones, a pattern that has already been notice for another habitats
under stress due to nutrient enrichment (Dolbeth et al., 2003; Singer and Battin, 2007) and
contaminants (Whiles and Wallace, 1995; Woodcock and Huryn, 2007).
The feeding guild composition also changed in response to the sewage impact. A previous
study of the macrobenthic trophic structure from Portuguese rocky shore areas (Boaventura et
al., 1999) found that filter feeders were numerically dominant at shallower depths, being
replaced by detritivores at the deepest areas, while in the intermediate areas both herbivores
and carnivores became abundant. In the present study, where feeding guilds were quantified
by production and not by density, the eulittoral and sublittoral fringe were dominated by
herbivores, followed by suspension (or filter) feeders in the reference areas. In the impacted
area, suspension feeders were the main contributor for the total community production. This
dominance of suspension feeders may be related with the higher amount of suspended solids
near the sewage discharges and therefore higher food availability for suspension feeders.
Previous studies pointed out that suspension feeders are an example of optimal foraging in
marine context (Gili and Coma, 1998), and that in favourable conditions (nutrient enrichment
and tolerance to the changes in the environmental parameters) species belonging to this
feeding guild can achieve extremely high abundances. For the reference areas, at the
eulittoral, the herbivores contribution to production was higher, while suspension feeders such
as C. montagui decreased considerably, probably due to lower food resources and decreasing
temperature (Riley, 2002). This decrease of barnacle production might have decrease
competition for space, enabling herbivore species such as Patella spp. to attain higher
production levels.
Understanding the effects of sewage pollution on intertidal macroinvertebrate assemblages
47
Based on all stated above the presence of sewage discharges seem to: (i) change the
environmental variables; (ii) increase the total densities and biomasses of macroinvertebrates,
being Mytilus galloprovincialis, Melarhaphe neritoides and Chthamalus montagui the species
most responsible for the dissimilarities; (iii) have a different impact in the three intertidal
levels. At the sublittoral fringe the community structure was changed. At the eulittoral
suspension-feeders abundances and species richness increased. At the littoral fringe no effect
was observed; (iv) change the feeding guilds moving forward the dominance of suspension
feeders; (v) promote a qualitative change by the replacement of sensitive species by tolerant
ones; (vi) increased the community secondary production, but mostly due to the production of
tolerant species.

48
49
CHAPTER 3
Sewage pollution as a source of trace element contamination and
the example of arsenic accumulation
Chapter 3 is submitted in the form of a manuscript as:
Cabral-Oliveira J, Pratas J, Mendes S, Pardal MA (2013) Trace elements in edible rocky
shore species: effect of sewage discharges. Submitted to Human and Ecological Risk
Assessment.
Cabral-Oliveira J, Coelho H, Pratas J, Mendes S, Pardal MA (2013) Macroalgae as
bioindicators of arsenic contamination on coastal areas. Submitted to Scientia Marina.

50
51
Sewage pollution as a source of trace element contamination and the
example of arsenic accumulation
3.1 Introduction
The aquatic systems are the ultimate deposit for several types of substances released
intentionally or involuntarily by human activities. Among all, the coastal areas suffer the most
severe impacts, due to the higher human pressure existent in those areas (Kennish, 1997).
Sewage treatment plants play an important role in preserving the water quality around the
world. However, the sewage treatment plants fail to remove several contaminants such as
PAHs, drugs or trace elements (Maceda-Veiga et al., 2013). Trace elements can be subdivided
into two categories: (i) essential trace elements (e.g., cobalt, copper, iron, manganese) which
are necessary to the metabolism at low concentrations but may be toxic at high
concentrations; and (ii) non-essential trace elements (e.g., arsenic, cadmium, lead) which
generally are not required for metabolic functions being toxic even at low concentrations
(Kennish, 1997). Trace elements are potentially harmful because they can be accumulated in
living tissues and biomagnified through the food-chain. The accumulation and toxicity of
trace elements on marine organisms will depend on physico-chemical factors, like dissolved
element concentrations, temperature and salinity, and biotic factors such as reproductive and
nutritional state (Maceda-Veiga et al., 2013). This potential toxicity to marine organisms and
persistence in the environment can pose serious environmental and health risks, that are
important to monitor (Alvarez et al., 2002).
Arsenic (As) is a widely distributed element in marine ecosystems and it can enter into the
environment through both natural and anthropogenic processes. The main anthropogenic
sources of this contaminant are domestic and industrial wastewaters, fuel combustion, mining
and agricultural pesticide production (WHO, 2010). The toxicity of As is highly dependent on
its chemical form, but since it can be harmful to humans even at low concentrations (Mieiro et
al., 2012), it has been ranked as number one in the top ten most hazard substances of the
Agency for Toxic Substances and Disease Registry (ATSDR, 2011). The main adverse effects
reported to be associated with ingestion of arsenic in humans are nausea, vomiting, and
diarrhea (low levels) and skin lesions, cancer, cardiovascular diseases (long-term ingestion).
Sewage pollution as a source of trace element contamination and the example of arsenic accumulation
52
Therefore, the potential toxicity of As can pose serious environmental and health risks, that
are important to monitor.
Molluscs and macroalgae have been widely recognized as good bioindicators (Rainbow,
1995; Conti and Cecchetti, 2003; Cravo et al., 2004; Ballesteros et al., 2007). Soft tissues of
marine molluscs may accumulate trace elements from the environment (water, sediment
and/or food) (Cravo and Bebianno, 2005) and generally are not able to regulate these
contaminants in their bodies (Díaz et al., 1992). Within molluscs, species like Mytilus
galloprovincialis (O’Leary and Breen, 1997; Szefer et al., 2002; Duarte et al., 2012) and
Patella ulyssiponensis (Cravo and Bebbiano, 2005 and references therein) are often used as
bioindicators of trace element contamination. Studies using gastropods like Phorcus lineatus
are scarce (Nicolaidou and Nott, 1990; O’Leary and Breen, 1997; Cubadda et al., 2001) being
its potential as a bioindicator species controversial. Intertidal rocky shore macroalgae have
been considered suitable bioindicators of water quality due to their sedentarism, easy
sampling and taxonomic identification, worldwide distribution and capacity to respond to
several anthropogenic impacts (Rainbow, 1995; Ballesteros et al., 2007). More specifically,
macroalgae have high affinity for several trace elements and revealed sensitivity to
environmental changes in As concentrations in the seawater (Chaudhuri et al., 2007).
Macroalgae seemed the most suitable bioindicator of trace elements because, in contrast with
marine fauna, they take up the trace elements directly from the water column (Rodriguez-
Figueroa et al., 2009; Benkdad et al., 2011), responding exclusively to the contaminant levels
in the seawater. The concentrations of As in intertidal macroalgae have already been the focus
of previous studies. Some obtained baseline data to evaluate inter-site and inter-sample
differences (Chaudhuri et al., 2007; Brito et al., 2012), others examined the As concentrations
in industrialized coastal areas (Benkdad et al., 2011). Other studies aimed to assess As
speciation in natural conditions (Slejkovec et al., 2006; Llorent-Mirandes et al., 2010). Also,
Maher and Clarke (1984) have compared the total As concentrations found in macroalgae
collected from clean and contaminated areas due to anthropogenic activities.
In addition to the choice of good bioindicators, it is also important the selection of an
adequate sampling design. The majority of the previous studies compared the accumulation of
trace elements between one reference area and one contaminated area, which could lead to
problems of pseudoreplication. In ecology, the necessity to find methods able to detect
anthropogenic impacts led to the development of BACI (Before-After, Control-Impact)
Sewage pollution as a source of trace element contamination and the example of arsenic accumulation
53
procedures. This method argues that the use of multiple sampling times, before and after the
disturbance, is essential to avoid temporal confounding (Chapman et al., 1995; Glasby, 1997).
However, in many cases, pre-impact data are not available. In order to overtake this problem,
Underwood (1991) developed a beyond-BACI design (ACI design) where the use of two or
more control areas helps to distinguish between natural variability that characterises
assemblages and variability-induced by a particular form of disturbance, such as sewage
discharges.
In this chapter there were two main objectives. The first is to understand if sewage discharges
are a source of trace element contamination. For this purpose, the accumulation of trace
elements by edible molluscs was compared between sewage-impacted area and reference
areas. It was found evidence of arsenic contamination due to the sewage discharges. With this
in mind, the second goal is to compare As accumulation by macroalgae from impacted and
reference areas. At the same time, it was assessed the potential of the molluscan species as
bioindicators of trace element contamination and of the macroalgae species as bioindicators of
As contamination.
3.2 Materials and methods
3.2.1 Study site and data collection
The study was conducted in Peniche peninsula (Fig. 2.1), on the central western Portuguese
coast, as described in chapter 2.
The mollusc and the algae specimens were collected randomly by hand on the intertidal shore
in November 2010, then stored in polythene bags and frozen at -20 ºC until trace elements
analysis. All specimens of the same studied molluscan species (Patella ulyssiponensis,
Phorcus lineatus and Mytilus galloprovincialis) and macroalgae species (Plocamium
cartilagineum, Asparagopsis armata, Codium spp., Ulva spp. and Saccorhiza polyschides)
belonged to the same size class in order to avoid misinterpretations due to size-dependent
accumulation trends, as previously reported (e.g. Szefer et al., 2002, Cravo and Bebbiano,
2005).
Sewage pollution as a source of trace element contamination and the example of arsenic accumulation
54
At all sampling sites, water samples were collected for laboratory determination of As
concentrations, due to the contamination observed in the mollusc tissues. Water samples were
filtered (Whatman GF/F glass-fibre filter, 0.45µm) and stored frozen at -18 ºC until analysis.
3.2.2 Laboratory procedures
At the laboratory, molluscs’ soft tissues were removed from their shells and prepared for
analysis. The mollusc species were selected because they are popular edible-species in many
countries, highlighting the importance to evaluate the associated risk to human health. The
shell height was measured and the soft tissues were accurately weighed in dry, pre-cleaned
Teflon digestion vessels. Approximately 0.5 g of fresh soft body tissues was digested using
5mL of HNO3 65% and 2mL of H2O2 30%.
Five species of algae were chosen due to their different morphological and physiological
characteristics and also because they are common species in the Atlantic shores. In laboratory
the macroalgae were washed with seawater (collected in the respective sampling area) and
epiphytes were eliminated manually. Algae were accurately weighed in dry, pre-cleaned
Teflon digestion vessels. Approximately 1g of fresh algal sample was digested using 8mL of
HNO3 65% and 2mL of H2O2 30%.
The vessels were sealed and placed in the microwave chamber (Multiwave 3000 – Anton
Paar) for digestion. The digests were then diluted with nanopure-distilled water and filtered.
The analytic determinations of As, Cd, Co, Cu, Pb and Ni were performed using an Atomic
absorption spectrophotometer (Thermo scientific SOLAAR M2), with graphite furnace and
autosampler. For Zn, Fe, Mn, the analytical determinations were performed by using atomic
absorption spectrophotometer 2380 Perkin-Elmer.
The accuracy and precision of the analytical methodology for the trace elements
determinations were assessed by replicate analysis of certified reference materials (CRM-
National Research Council Canada), namely DOLT – 4 (dogfish liver) for molluscs samples.
For algal samples, certified references (Virginia tobacco leaves CTA-VTL-2, Polish Certified
Reference Material) were also used to data quality control.
The recovery efficiency depended on the respective element and was: As (96.8%), Cd
(92.8%), Co (98.4%), Cu (94.9%), Fe (92.0%), Ni (97.4%), Pb (98.8%) e Zn (90.6%). The
Sewage pollution as a source of trace element contamination and the example of arsenic accumulation
55
detection limits for trace elements were (in µg. g-1
): 0.01 for As; 0.001 for Cd; 0.005 for Co,
Cu, Pb and Ni; 0.2 for Zn; 0.75 for Fe; and 0.5 for Mn.
The determination of As concentrations on the seawater followed the methods described in
Bermejo-Barrera et al. (1998).
3.2.3 Data analysis
In order to understand if the presence of sewage discharges changed the physical and
chemical parameters in the seawater of the three sampling areas, a principal component
analysis (PCA), based on correlations, was performed using the CANOCO version 4.5
package (ter Braak and Smilauer, 1998). Three-way analysis of variance (ANOVA) was
performed to assess whether trace element concentrations varied significantly among species,
trace elements and areas. Post hoc pairwise comparisons tests (Tukey’s HSD or Dunnett’s
multiple comparison of group means) were employed to determine significant differences
between species, trace elements and areas. A two-way analysis of variance (ANOVA) with
replication was used to assess the differences between sampling areas and species, for As
concentrations (Zar, 1996). All data were checked for normality and homoscedasticity. For all
statistical tests, the significance level was set at p<0.05. All calculations were performed with
IBM SPSS Statistics 19.0.
3.3 Results
3.3.1 Trace element contamination in molluscs
Data on soft tissue concentrations of As, Co, Cd, Cu, Fe, Mn, Ni, Pb and Zn of Patella
ulyssiponensis, Phorcus lineatus and Mytilus galloprovincialis from impacted and reference
area are presented in Fig. 3.1. For all the measured elements significant inter and intra-
specific variations were observed, being the concentrations of Fe, Zn and Mn consistently the
highest in the reference areas for all the three species (Fig. 3.1). However, in the impacted
area the pattern has changed due to the higher concentrations of As, that become the third (M.
galloprovincialis), second (P. ulyssiponensis), and first (P. lineatus) element more abundant
(Fig. 3.1).
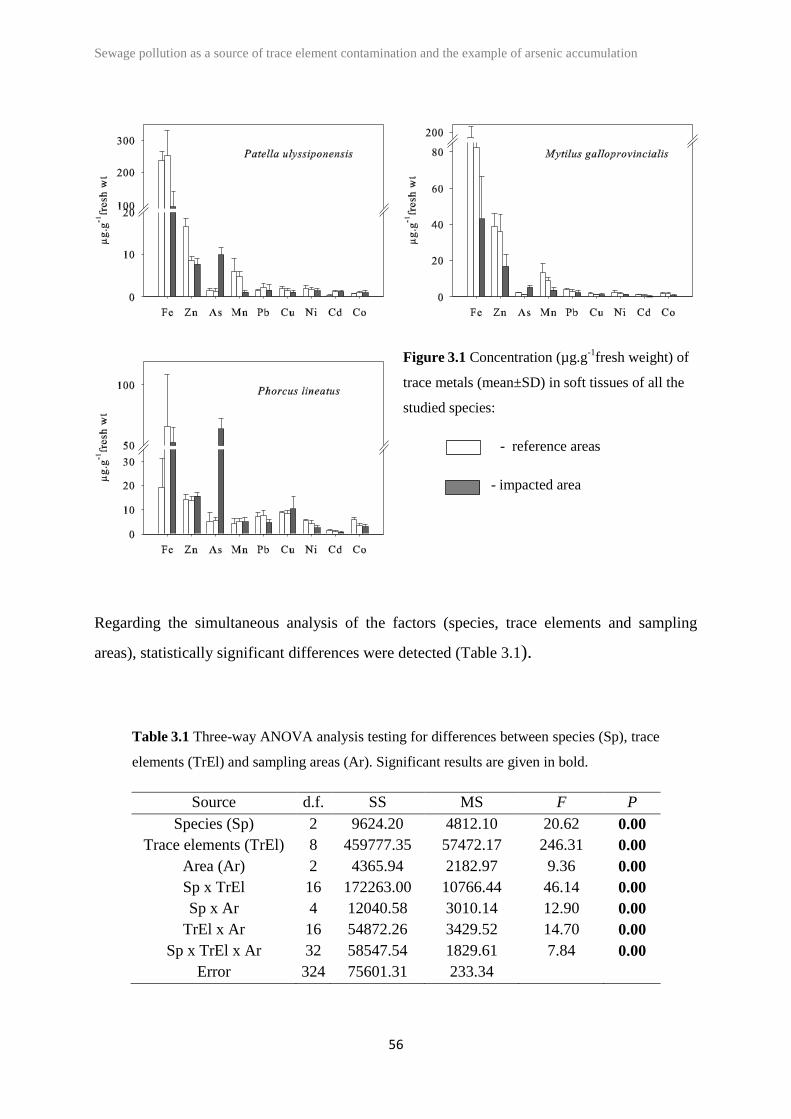
Sewage pollution as a source of trace element contamination and the example of arsenic accumulation
56
Figure 3.1 Concentration (µg.g-1
fresh weight) of
trace metals (mean±SD) in soft tissues of all the
studied species:
- reference areas
- impacted area
Regarding the simultaneous analysis of the factors (species, trace elements and sampling
areas), statistically significant differences were detected (Table 3.1).
Table 3.1 Three-way ANOVA analysis testing for differences between species (Sp), trace
elements (TrEl) and sampling areas (Ar). Significant results are given in bold.
Source d.f. SS MS F P
Species (Sp) 2 9624.20 4812.10 20.62 0.00
Trace elements (TrEl) 8 459777.35 57472.17 246.31 0.00
Area (Ar) 2 4365.94 2182.97 9.36 0.00
Sp x TrEl 16 172263.00 10766.44 46.14 0.00
Sp x Ar 4 12040.58 3010.14 12.90 0.00
TrEl x Ar 16 54872.26 3429.52 14.70 0.00
Sp x TrEl x Ar 32 58547.54 1829.61 7.84 0.00
Error 324 75601.31 233.34
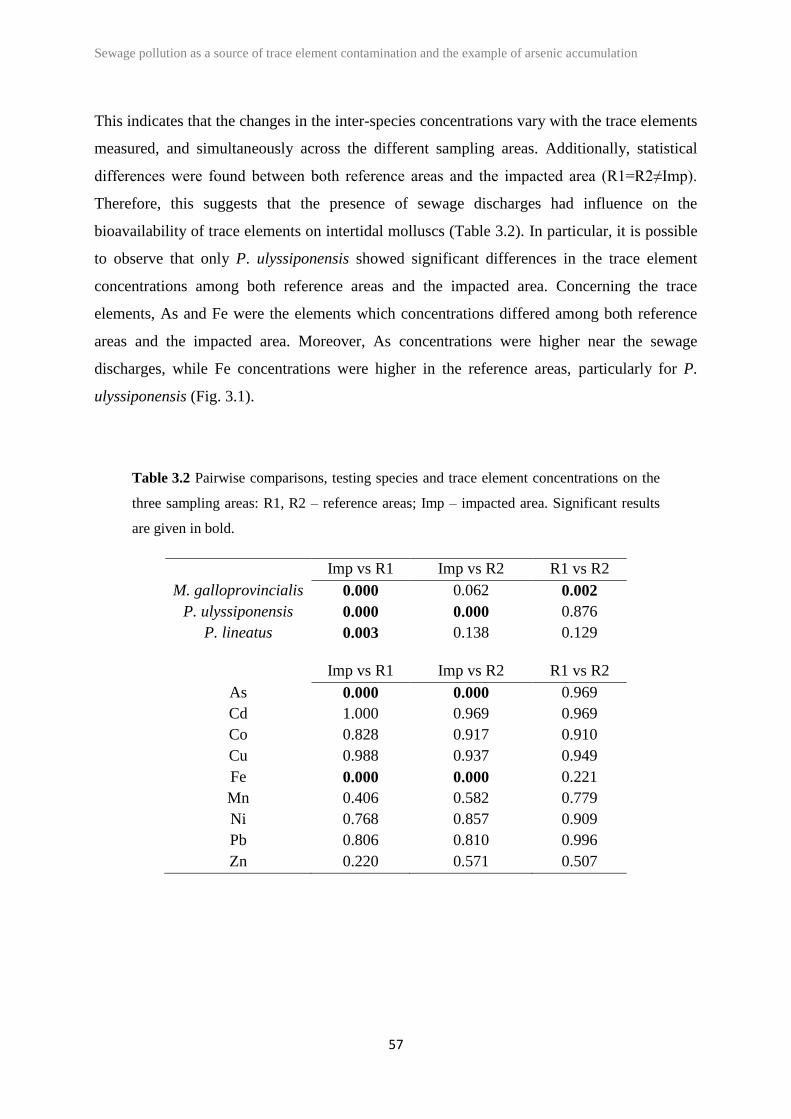
Sewage pollution as a source of trace element contamination and the example of arsenic accumulation
57
This indicates that the changes in the inter-species concentrations vary with the trace elements
measured, and simultaneously across the different sampling areas. Additionally, statistical
differences were found between both reference areas and the impacted area (R1=R2≠Imp).
Therefore, this suggests that the presence of sewage discharges had influence on the
bioavailability of trace elements on intertidal molluscs (Table 3.2). In particular, it is possible
to observe that only P. ulyssiponensis showed significant differences in the trace element
concentrations among both reference areas and the impacted area. Concerning the trace
elements, As and Fe were the elements which concentrations differed among both reference
areas and the impacted area. Moreover, As concentrations were higher near the sewage
discharges, while Fe concentrations were higher in the reference areas, particularly for P.
ulyssiponensis (Fig. 3.1).
Table 3.2 Pairwise comparisons, testing species and trace element concentrations on the
three sampling areas: R1, R2 – reference areas; Imp – impacted area. Significant results
are given in bold.
Imp vs R1 Imp vs R2 R1 vs R2
M. galloprovincialis 0.000 0.062 0.002
P. ulyssiponensis 0.000 0.000 0.876
P. lineatus 0.003 0.138 0.129
Imp vs R1 Imp vs R2 R1 vs R2
As 0.000 0.000 0.969
Cd 1.000 0.969 0.969
Co 0.828 0.917 0.910
Cu 0.988 0.937 0.949
Fe 0.000 0.000 0.221
Mn 0.406 0.582 0.779
Ni 0.768 0.857 0.909
Pb 0.806 0.810 0.996
Zn 0.220 0.571 0.507
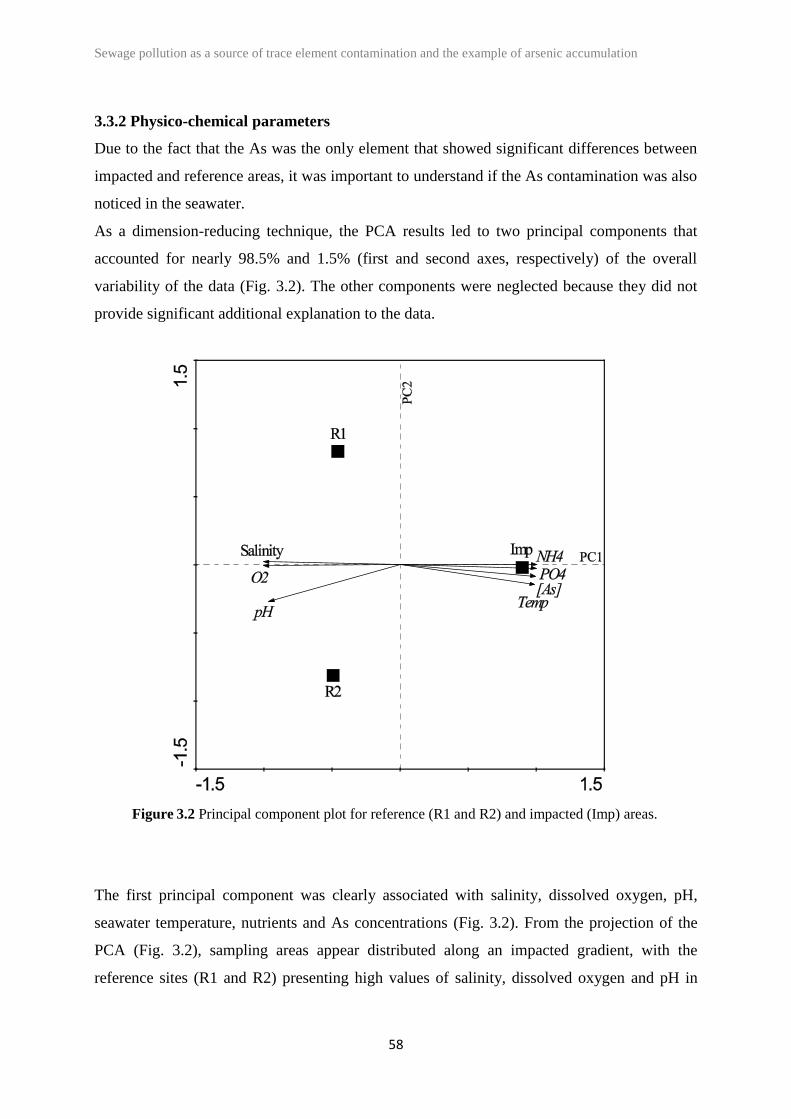
Sewage pollution as a source of trace element contamination and the example of arsenic accumulation
58
3.3.2 Physico-chemical parameters
Due to the fact that the As was the only element that showed significant differences between
impacted and reference areas, it was important to understand if the As contamination was also
noticed in the seawater.
As a dimension-reducing technique, the PCA results led to two principal components that
accounted for nearly 98.5% and 1.5% (first and second axes, respectively) of the overall
variability of the data (Fig. 3.2). The other components were neglected because they did not
provide significant additional explanation to the data.
Figure 3.2 Principal component plot for reference (R1 and R2) and impacted (Imp) areas.
The first principal component was clearly associated with salinity, dissolved oxygen, pH,
seawater temperature, nutrients and As concentrations (Fig. 3.2). From the projection of the
PCA (Fig. 3.2), sampling areas appear distributed along an impacted gradient, with the
reference sites (R1 and R2) presenting high values of salinity, dissolved oxygen and pH in
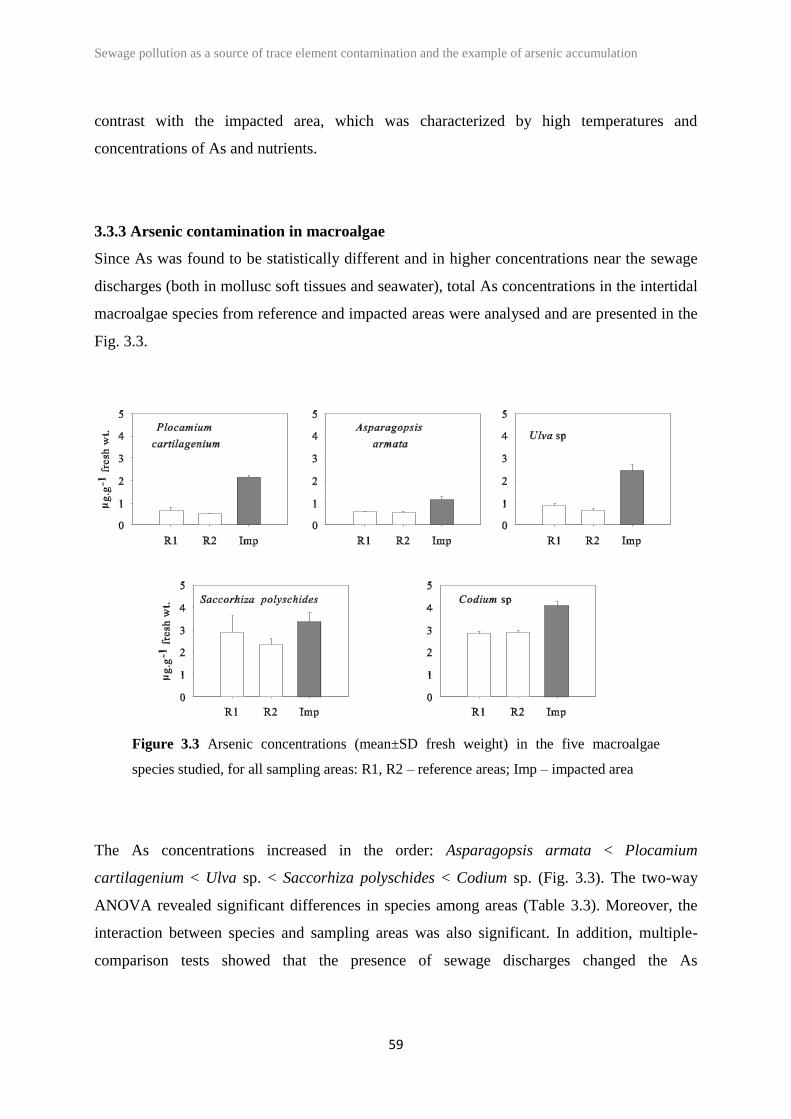
Sewage pollution as a source of trace element contamination and the example of arsenic accumulation
59
contrast with the impacted area, which was characterized by high temperatures and
concentrations of As and nutrients.
3.3.3 Arsenic contamination in macroalgae
Since As was found to be statistically different and in higher concentrations near the sewage
discharges (both in mollusc soft tissues and seawater), total As concentrations in the intertidal
macroalgae species from reference and impacted areas were analysed and are presented in the
Fig. 3.3.
Figure 3.3 Arsenic concentrations (mean±SD fresh weight) in the five macroalgae
species studied, for all sampling areas: R1, R2 – reference areas; Imp – impacted area
The As concentrations increased in the order: Asparagopsis armata < Plocamium
cartilagenium < Ulva sp. < Saccorhiza polyschides < Codium sp. (Fig. 3.3). The two-way
ANOVA revealed significant differences in species among areas (Table 3.3). Moreover, the
interaction between species and sampling areas was also significant. In addition, multiple-
comparison tests showed that the presence of sewage discharges changed the As
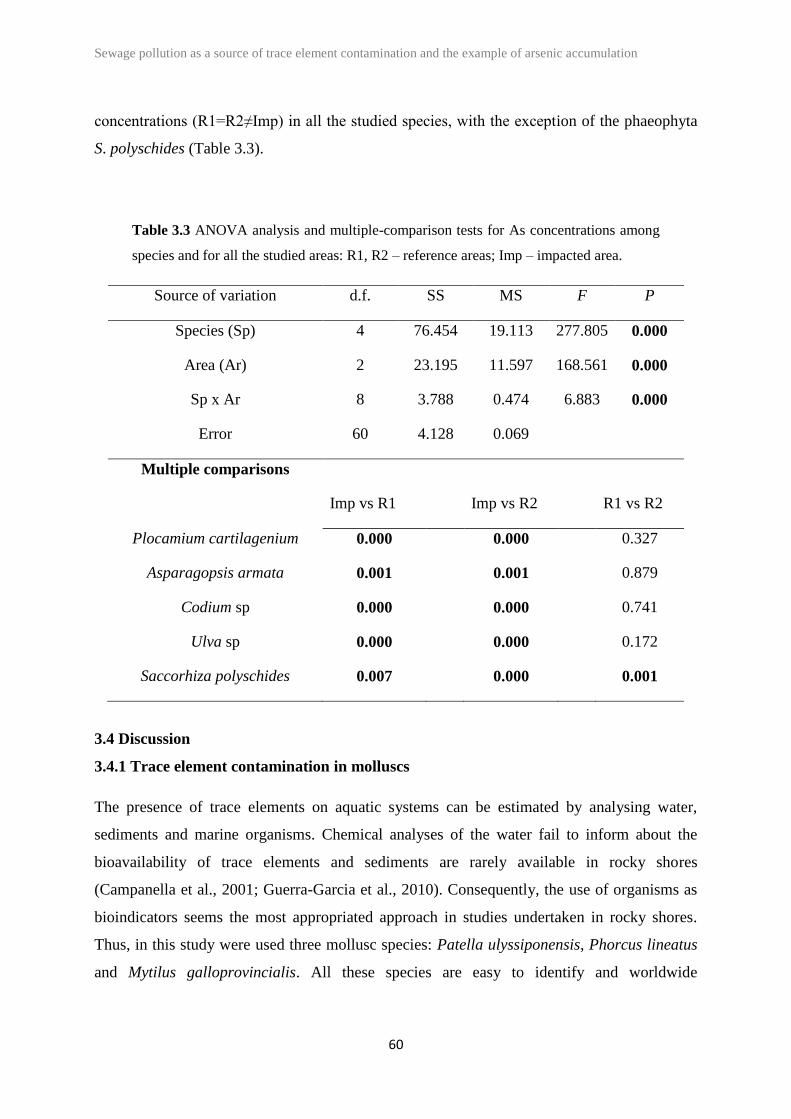
Sewage pollution as a source of trace element contamination and the example of arsenic accumulation
60
concentrations (R1=R2≠Imp) in all the studied species, with the exception of the phaeophyta
S. polyschides (Table 3.3).
Table 3.3 ANOVA analysis and multiple-comparison tests for As concentrations among
species and for all the studied areas: R1, R2 – reference areas; Imp – impacted area.
Source of variation d.f. SS MS F P
Species (Sp) 4 76.454 19.113 277.805 0.000
Area (Ar) 2 23.195 11.597 168.561 0.000
Sp x Ar 8 3.788 0.474 6.883 0.000
Error 60 4.128 0.069
Multiple comparisons
Imp vs R1 Imp vs R2 R1 vs R2
Plocamium cartilagenium 0.000 0.000 0.327
Asparagopsis armata 0.001 0.001 0.879
Codium sp 0.000 0.000 0.741
Ulva sp 0.000 0.000 0.172
Saccorhiza polyschides 0.007 0.000 0.001
3.4 Discussion
3.4.1 Trace element contamination in molluscs
The presence of trace elements on aquatic systems can be estimated by analysing water,
sediments and marine organisms. Chemical analyses of the water fail to inform about the
bioavailability of trace elements and sediments are rarely available in rocky shores
(Campanella et al., 2001; Guerra-Garcia et al., 2010). Consequently, the use of organisms as
bioindicators seems the most appropriated approach in studies undertaken in rocky shores.
Thus, in this study were used three mollusc species: Patella ulyssiponensis, Phorcus lineatus
and Mytilus galloprovincialis. All these species are easy to identify and worldwide
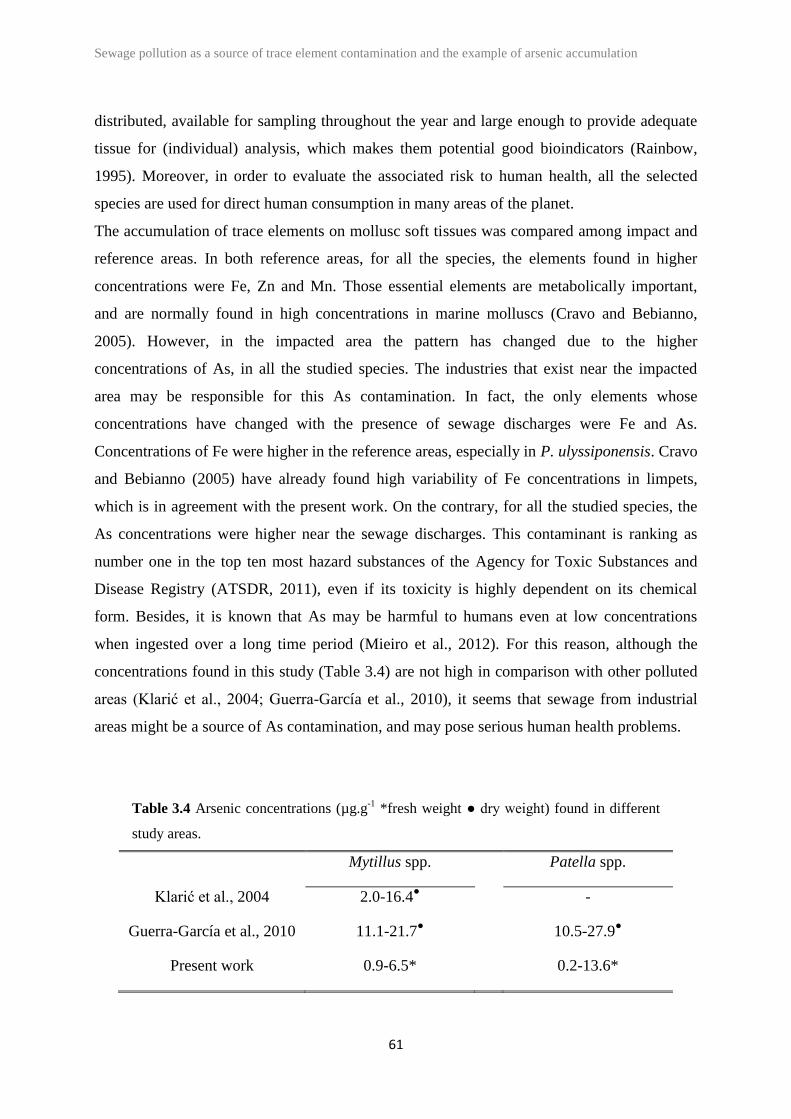
Sewage pollution as a source of trace element contamination and the example of arsenic accumulation
61
distributed, available for sampling throughout the year and large enough to provide adequate
tissue for (individual) analysis, which makes them potential good bioindicators (Rainbow,
1995). Moreover, in order to evaluate the associated risk to human health, all the selected
species are used for direct human consumption in many areas of the planet.
The accumulation of trace elements on mollusc soft tissues was compared among impact and
reference areas. In both reference areas, for all the species, the elements found in higher
concentrations were Fe, Zn and Mn. Those essential elements are metabolically important,
and are normally found in high concentrations in marine molluscs (Cravo and Bebianno,
2005). However, in the impacted area the pattern has changed due to the higher
concentrations of As, in all the studied species. The industries that exist near the impacted
area may be responsible for this As contamination. In fact, the only elements whose
concentrations have changed with the presence of sewage discharges were Fe and As.
Concentrations of Fe were higher in the reference areas, especially in P. ulyssiponensis. Cravo
and Bebianno (2005) have already found high variability of Fe concentrations in limpets,
which is in agreement with the present work. On the contrary, for all the studied species, the
As concentrations were higher near the sewage discharges. This contaminant is ranking as
number one in the top ten most hazard substances of the Agency for Toxic Substances and
Disease Registry (ATSDR, 2011), even if its toxicity is highly dependent on its chemical
form. Besides, it is known that As may be harmful to humans even at low concentrations
when ingested over a long time period (Mieiro et al., 2012). For this reason, although the
concentrations found in this study (Table 3.4) are not high in comparison with other polluted
areas (Klarić et al., 2004; Guerra-García et al., 2010), it seems that sewage from industrial
areas might be a source of As contamination, and may pose serious human health problems.
Table 3.4 Arsenic concentrations (µg.g-1
*fresh weight ● dry weight) found in different
study areas.
Mytillus spp. Patella spp.
Klarić et al., 2004 2.0-16.4● -
Guerra-García et al., 2010 11.1-21.7● 10.5-27.9
●
Present work 0.9-6.5* 0.2-13.6*
Sewage pollution as a source of trace element contamination and the example of arsenic accumulation
62
It is also important to acknowledge the inter- and intra-specific variation in the accumulation
of trace elements. This evidence is in agreement with previous studies, which have already
verified that the accumulation of trace elements was not consistent, varying with location and
taxa (Mayer-Pinto et al., 2010). Moreover, it seems that closely related species could exhibit
different accumulation strategies, and even individuals of the same species can show a great
range of concentrations for each contaminant (e.g. Campanella et al., 2002; Szefer et al.,
2002). This can be justified by several abiotic (e.g. salinity, temperature, pH) and biotic (e.g.
body size, sex, physiological conditions, reproductive status) parameters that can affect
elements bioavailability and accumulation in the soft tissues of molluscs (Szefer et al., 2002;
Cravo and Bebianno, 2005). Although this inter- and intra-specific variation, molluscs are
widely considered good bioindicators of trace element contamination. More specifically, in
this study P. ulyssiponensis seemed to be the best bioindicator. This is in accordance with
previous studies that suggested limpets as good bioindicators of sewage pollution (Bishop et
al., 2002; Espinosa et al., 2007; Atalah and Crowe, 2012), as well as of trace element
contamination (Cravo et al., 2004; Cravo and Bebianno, 2005).
Finally, in order to assess the potential risk for human health, the concentrations of trace
elements found in this study were compared with the European advisory guidelines for
commercialized seafood products. However, given that the European regulations exist only
for bivalve molluscs, it was only possible to compare the concentrations obtained for M.
galloprovincialis with the maximum required by law. According to the Commission
Regulation (EC) nº 1881/2006 the maximum concentration allowed in commercialized
bivalve molluscs is 1.5 µg.g-1
fresh weight of lead and 1.0 µg.g-1
fresh weight of cadmium. In
this work the maximum observed for lead was 4.6 µg.g-1
fresh weight and for cadmium 1.4
µg.g-1
fresh weight in both references and impacted areas. These values were relatively low
when compared with other studies undertaken near polluted areas (Szefer et al., 2002).
Nevertheless, the concentrations of Pb and Cd exceeded the threshold limits set by the EU
legislation, which may pose serious risks both to wildlife and human health.
3.4.2 Physico-chemical parameters
Sewage pollution is normally associated with organic and nutrient enrichment (Arévalo et al.,
2007; Cabral-Oliveira et al., 2009). However, contaminants like trace elements can also be
Sewage pollution as a source of trace element contamination and the example of arsenic accumulation
63
associated with this source of pollution, especially when the sewage treatment plants receive
industrial effluents (Alvarez et al., 2002). In this study, the presence of sewage discharges
seems to change the environmental variables. Results suggested that sewage discharges
increased seawater temperature, and decreased salinity, pH, dissolved oxygen and the nutrient
(ammonia and phosphate) loads in the seawater increased (already focus in chapter 2) and
also increased the trace element concentrations, such as As, in the seawater. Previous studies
(Chaudhuri et al., 2007) have found As concentrations in the seawater between 21.0±9.8µg/L
and 47.6±16.9µg/L. In this study similar concentrations were found in the reference areas
(R1=21.5µg/L and R2=19.9µg/L) but near the sewage discharges the concentrations were
higher (187.4µg/L), thus confirming the As contamination in that area. Therefore, it seems
that the sewage discharges in our case-study are a source of As contamination, probably due
to the industries present in the area (e.g. shipyards, metal smelting).
3.4.2 Arsenic contamination in macroalgae
The response of algal communities to nutrient and organic enrichment is well known, with a
decrease in the number of species and a reduction of stratification due to the disappearance of
large perennial species, replaced by opportunistic ones (May, 1985; Soltan, 2001; Terlizzi et
al., 2002; Arévalo et al., 2007). However, the impact of As contamination due to sewage
discharges and the effects on the As accumulation by intertidal macroalgae has not yet been
assessed.
In this study, near the sewage discharges, along with higher As concentrations in the seawater,
was also noticed significantly higher concentrations of As in all the macroalgae studied,
except for Saccorhiza polyschides. The possibility to identify the samples affected by As
contamination with respect to their distance to the contaminantion source (impacted against
reference areas) attest the use of macroalgae species as suitable bioindicators. The only
exception was the phaeophyta S. polyschides.
Brown algae generally accumulate the highest concentrations of As (Slejkovec et al., 2006;
Brito et al., 2012). Moreover, Maher and Clarke (1984) found that Cystoseira spp. and
Sargassum spp. accumulate more As in polluted areas (exposed to mining activities) than in
clean areas. However, the phaeophyta used in this study (S. polyschides) have shown
significant differences between all the sampling areas, and consequently do not seem a
Sewage pollution as a source of trace element contamination and the example of arsenic accumulation
64
suitable bioindicator of As contamination. This supports the idea that methods based on
indicator-species may be better than those based on functional-form groups (Arévalo et al.,
2007), due to the variations in the species responses to the contamination.
Regarding chlorophyta, both species (Ulva sp. and Codium sp.) responded to the higher As
concentrations in the seawater near sewage discharges. Previous studies (Slejkovec et al.,
2006) have found baseline values for Ulva spp. (1.35±0.07 µg.g-1
fresh wt) slightly superior to
those found in the reference areas of this study (0.76±0.16 µg.g-1
fresh wt). However, there is
no agreement in the response of this species to As contamination. Some studies found similar
As accumulations in clean and polluted areas (Maher and Clarke, 1984), while others noticed
the opposite (Chaudhuri et al., 2007), which raises some questions about the use of Ulva sp.
as bioindicator of As contamination. About Codium sp., to our best knowledge, this is the first
attempt to compare the As accumulation among clean and polluted areas. Nevertheless
previous studies (Llorent-Mirandes et al., 2010) have also found higher As concentrations in
Codium sp. than in Ulva sp. (27.7±2.9µg.g-1
and 5.3±0.8µg g-1
, respectively), such as in the
present study. On the other hand, green algae rocky cover changes seasonally (Archambault et
al., 2001; Bishop et al., 2002) and Rainbow (1995) suggests that a good bioindicator of trace
elements should be available for sampling throughout all year. Therefore, chlorophyta may
not be the most suitable bioindicator to As contamination.
Concerning rhodophyta, both species (Asparagopsis armata and Plocamium cartilagineum)
responded to the higher As concentrations in the seawater near sewage discharges. However,
those species belong to different ecological status groups (ESG). Marine benthic macroalgae
can be divided in two groups: EGS I (late successional) and ESG II (opportunistic). ESG I
comprises thick or calcareous thallus macroalgae, with low growth rates and long life cycles.
ESG II includes sheet-like and filamentous macroalgae species with high growth rates and
short life cycles. P. cartilagineum is perennial (ESG I) while A. armata is an opportunistic
(ESG II) species (Orfanidis et al., 2001). Those groups are associated with alternative
ecological states: ESG I with pristine and ESG II with degraded ecological states. Moreover,
the use of these functional groups has already been tested to water quality (Orfanidis et al.,
2001) and more recently to detect pollution (Díez et al., 2003). This information can be useful
in the selection of appropriated bioindicators. A suitable bioindicator for trace element
contamination should be present in both disturbed and undisturbed areas, to allow
comparisons between areas. Therefore, species from ESG II may be more appropriate as
Sewage pollution as a source of trace element contamination and the example of arsenic accumulation
65
bioindicators for As contamination. Consequently, from all the studied species, A. armata
seems to be the best bioindicator for As contamination in coastal areas.
In conclusion, the effect of sewage pollution on the accumulation of trace elements on
intertidal molluscs seems to suggest that: (i) trace element accumulation by molluscs can be
affected by the presence of sewage discharges (in our case-study As, due to the type of
industries near our sampling areas); (ii) limpets (P. ulyssiponensis) seemed the best
bioindicator for trace elements; (iii) Cd and, especially, Pb exceed the legislation values
concerning human consumption. Moreover, although the recommendations merely focus on
Cd, Pb and Hg, this study suggests the importance of include As in European legislation to
prevent human health concerns; (iv) macroalgae species seem to be suitable bioindicators of
As contamination in coastal areas, with the exception of Saccorhiza polyschides. The
information obtained from previous studies, together with the ecological characteristics of
each species lead to the proposal of Asparagopsis armata as the best bioindicator for As
contamination in temperate Atlantic coastal areas

66
67
CHAPTER 4
Can eulittoral rocky shore macroinvertebrate assemblages be used
as an indicator of sewage pollution?
Chapter 4 is submitted in the form of a manuscript as:
Cabral-Oliveira J, Bevilacqua S, Terlizzi A, Pardal MA (2013) Comparing Atlantic and
Mediterranean shores: testing the ability of eulittoral invertebrate assemblages to detect the
effects of sewage discharges in coastal areas. To be submitted.
Cabral-Oliveira J, Pardal MA (2013) Sewage discharges in oceanic islands: effects and
recovery of eulittoral macrofauna assemblages. Submitted to Environmental Management.

68
69
Can eulittoral rocky shore macroinvertebrate assemblages be used as an
indicator of sewage pollution?
4.1 Introduction
Coastal areas are under high human pressure, being daily exposed to several anthropogenic
impacts such as sewage discharges (Crowe et al., 2000; Halpern et al., 2008; Arévalo et al.,
2007). These anthropogenic impacts seem to affect the ecosystem functioning and resilience,
threatening the supply of ecosystems services provided by coastal areas (de Groot et al., 2012;
Pinto et al., 2012). Ecosystem services are the benefits (essential services and goods) for
human population that derive, directly or indirectly, from ecosystem functions (Constanza et
al., 1997; Pinto et al., 2012). They can be divided into four categories: provisioning,
regulating, cultural and supporting. Provisioning includes the products obtained directly from
the ecosystem, such as food resources. Regulating refers to the benefits obtained from the
ecosystem processes, for example, when rocky shores act like a buffer for wind, water and
waves (disturbance regulation). Cultural involve the nonmaterial benefits like cognitive and
aesthetic experiences. Finally, supporting consist in all the benefits necessary for the
production of all the other ecosystem services (de Groot et al., 2012; Pinto et al., 2012).
Important ecological attributes, such as, biodiversity and community structure can be included
in this last category and influence the provision of others ecosystem services. Tourism and
production of goods and human welfare are some of the economic activities that rely on a
good ecosystem quality (Pinto et al., 2012; Liquete et al., 2013).
Previous studies have already showed that sewage discharges may change the abundances and
structure of intertidal assemblages (Littler and Murray, 1975; Archambault et al., 2001;
Bishop et al., 2002), but there is no consensus about the effect on the species richness.
Polychaetes assemblages increase their abundances near the sewage discharges, due to
opportunistic species (Dauer and Conner, 1980). Crustaceans and bivalves filter-feeders (e.g.
Balanidae, Mytilidae) have been reported to be more abundant near the sewage discharges
due to the higher amount of suspended solids (López-Gappa et al., 1993; Pinedo et al., 2007).
Can eulittoral rocky shore macroinvertebrate assemblages be used as an indicator of sewage pollution?
70
On the contrary, in gastropods assemblages a general decrease in abundance and the
disappearance of sensitive species near sewage discharges is known (Terlizzi et al., 2005;
Atalah and Crowe, 2012).
Eulittoral assemblages of intertidal rocky shores are often exposed to sewage discharges, and
to the potential ensuing perturbations of environmental conditions (Ashton and Richardson,
1995; Bustamante et al., 2012; Fraschetti et al., 2006; Garaffo et al., 2012; Smith, 2000). Such
assemblages generally do not have many species, are accessible to sample, and the species
present have widespread distributions and are easy to identify at high taxonomic resolution.
These features make eulittoral assemblages potentially cost-effective in discerning between
disturbed and undisturbed environmental conditions across different environmental contexts
and geographical regions. Nevertheless, to our knowledge no attempt has been made to
understand whether such assemblages are a suitable indicator of human impacts related to
sewage discharges, able to consistently respond over large spatial scales. Two tasks were
carried out in order to fulfil this gap, and are described in this chapter. The first task compared
the response of eulittoral assemblages to sewage discharges in different bioregions (Atlantic
and Mediterranean shores). Eulittoral assemblages and also the most common and abundant
taxa (i.e. barnacles, Melarhaphe neritoides, Patella spp.) were studied in impacted (near an
outfall) and reference areas in both bioregion, in order to assess the consistency of patterns.
The second task aimed to examine the response of eulittoral assemblages to the presence of
sewage pollution in insular ecosystems (Azorean archipelago). Moreover, in our sampling
area, an outfall has been decommissioned from the original beach (due to civil movements to
save a surf spot) and relocated in another area. This has provided an ecological opportunity to
assess also the recovery dynamics of the community one year after the cessation of the
sewage disposal.
4.2 Materials and Methods
4.2.1 Study areas
4.2.1.1 Atlantic and Mediterranean shores
The study areas were located on the central Western Portuguese shore (E Atlantic) and on the
SE Italian shore (Mediterranean Sea) (Fig. 4.1). In the Mediterranean Sea the mean
temperature of surface waters varies between 14-16 ºC in winter and 22-28 ºC in summer.
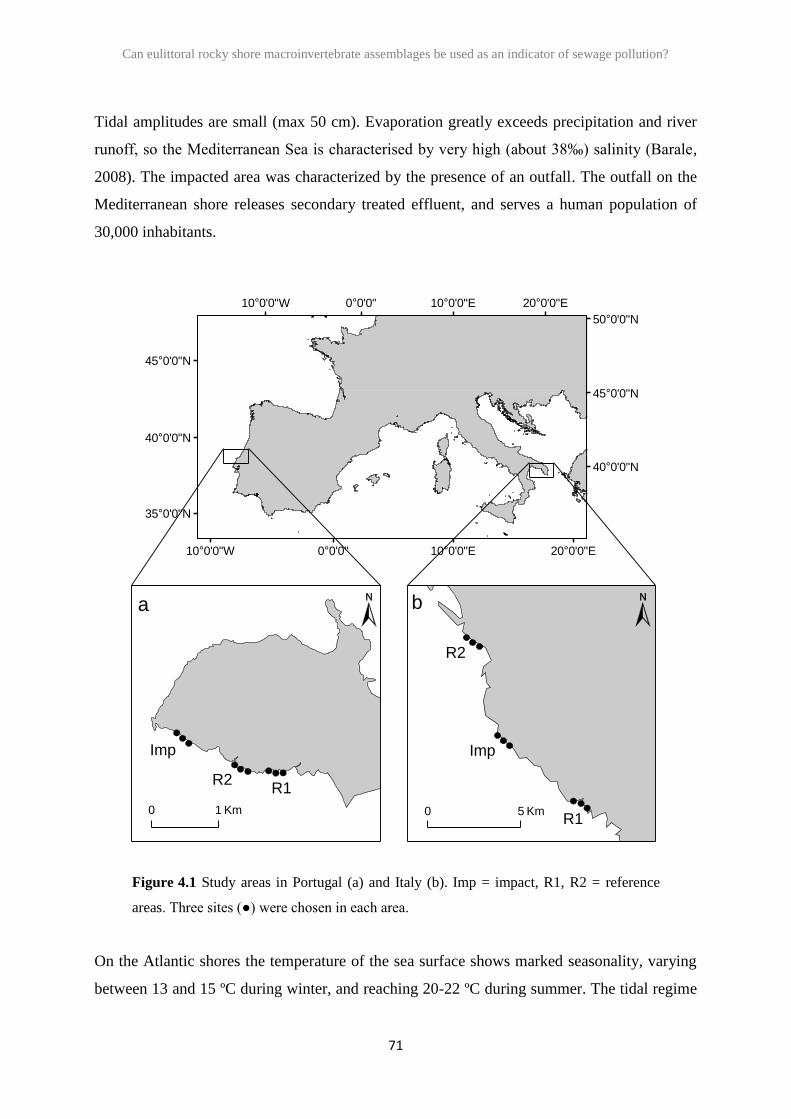
Can eulittoral rocky shore macroinvertebrate assemblages be used as an indicator of sewage pollution?
71
Tidal amplitudes are small (max 50 cm). Evaporation greatly exceeds precipitation and river
runoff, so the Mediterranean Sea is characterised by very high (about 38‰) salinity (Barale,
2008). The impacted area was characterized by the presence of an outfall. The outfall on the
Mediterranean shore releases secondary treated effluent, and serves a human population of
30,000 inhabitants.
Figure 4.1 Study areas in Portugal (a) and Italy (b). Imp = impact, R1, R2 = reference
areas. Three sites (●) were chosen in each area.
On the Atlantic shores the temperature of the sea surface shows marked seasonality, varying
between 13 and 15 ºC during winter, and reaching 20-22 ºC during summer. The tidal regime
20°0'0"E
20°0'0"E
10°0'0"E
10°0'0"E
0°0'0"
0°0'0"
10°0'0"W
10°0'0"W
50°0'0"N
45°0'0"N
45°0'0"N
40°0'0"N
40°0'0"N
35°0'0"N
Km0 1 Km0 5
Imp
R2R1
Imp
R2
R1
a b
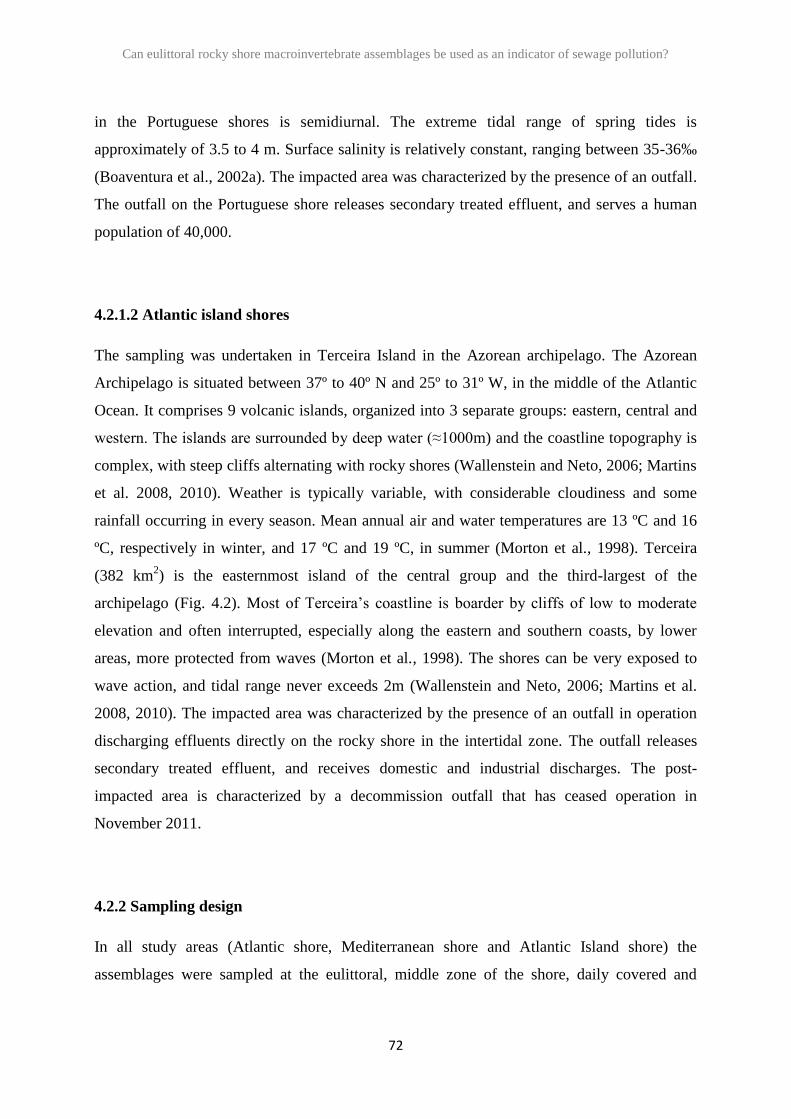
Can eulittoral rocky shore macroinvertebrate assemblages be used as an indicator of sewage pollution?
72
in the Portuguese shores is semidiurnal. The extreme tidal range of spring tides is
approximately of 3.5 to 4 m. Surface salinity is relatively constant, ranging between 35-36‰
(Boaventura et al., 2002a). The impacted area was characterized by the presence of an outfall.
The outfall on the Portuguese shore releases secondary treated effluent, and serves a human
population of 40,000.
4.2.1.2 Atlantic island shores
The sampling was undertaken in Terceira Island in the Azorean archipelago. The Azorean
Archipelago is situated between 37º to 40º N and 25º to 31º W, in the middle of the Atlantic
Ocean. It comprises 9 volcanic islands, organized into 3 separate groups: eastern, central and
western. The islands are surrounded by deep water (≈1000m) and the coastline topography is
complex, with steep cliffs alternating with rocky shores (Wallenstein and Neto, 2006; Martins
et al. 2008, 2010). Weather is typically variable, with considerable cloudiness and some
rainfall occurring in every season. Mean annual air and water temperatures are 13 ºC and 16
ºC, respectively in winter, and 17 ºC and 19 ºC, in summer (Morton et al., 1998). Terceira
(382 km2) is the easternmost island of the central group and the third-largest of the
archipelago (Fig. 4.2). Most of Terceira’s coastline is boarder by cliffs of low to moderate
elevation and often interrupted, especially along the eastern and southern coasts, by lower
areas, more protected from waves (Morton et al., 1998). The shores can be very exposed to
wave action, and tidal range never exceeds 2m (Wallenstein and Neto, 2006; Martins et al.
2008, 2010). The impacted area was characterized by the presence of an outfall in operation
discharging effluents directly on the rocky shore in the intertidal zone. The outfall releases
secondary treated effluent, and receives domestic and industrial discharges. The post-
impacted area is characterized by a decommission outfall that has ceased operation in
November 2011.
4.2.2 Sampling design
In all study areas (Atlantic shore, Mediterranean shore and Atlantic Island shore) the
assemblages were sampled at the eulittoral, middle zone of the shore, daily covered and
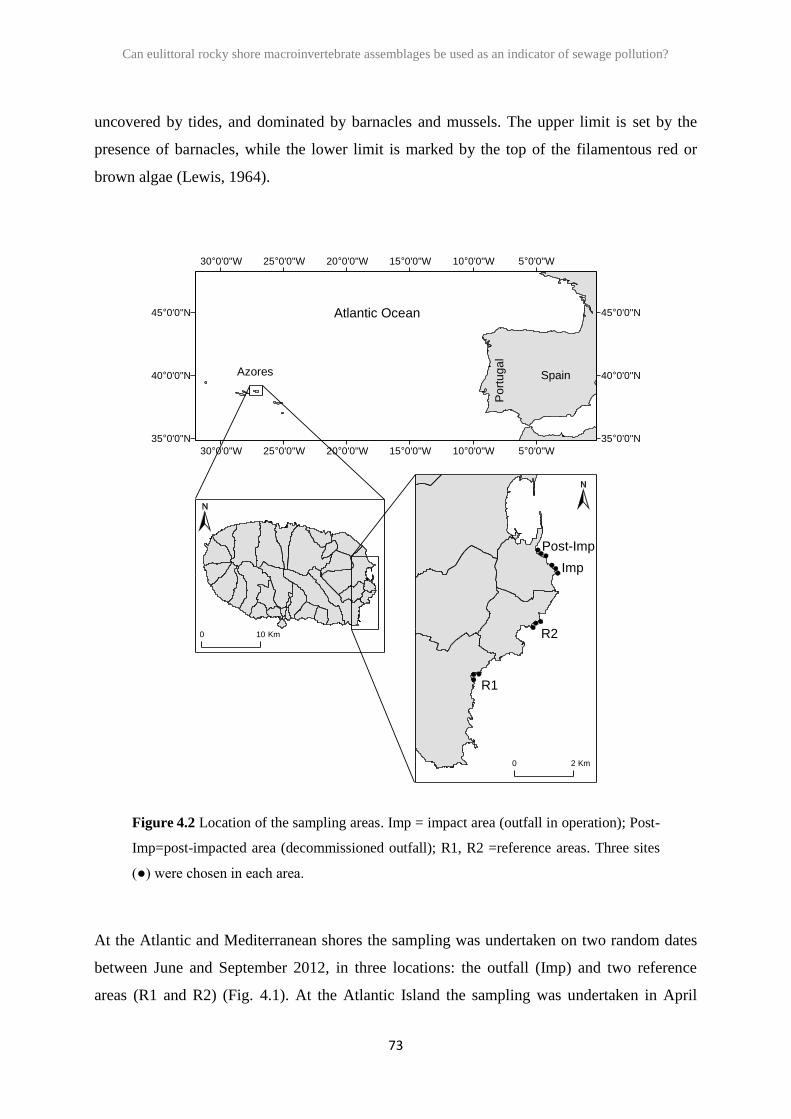
Can eulittoral rocky shore macroinvertebrate assemblages be used as an indicator of sewage pollution?
73
uncovered by tides, and dominated by barnacles and mussels. The upper limit is set by the
presence of barnacles, while the lower limit is marked by the top of the filamentous red or
brown algae (Lewis, 1964).
Figure 4.2 Location of the sampling areas. Imp = impact area (outfall in operation); Post-
Imp=post-impacted area (decommissioned outfall); R1, R2 =reference areas. Three sites
(●) were chosen in each area.
At the Atlantic and Mediterranean shores the sampling was undertaken on two random dates
between June and September 2012, in three locations: the outfall (Imp) and two reference
areas (R1 and R2) (Fig. 4.1). At the Atlantic Island the sampling was undertaken in April
5°0'0"W
5°0'0"W
10°0'0"W
10°0'0"W
15°0'0"W
15°0'0"W
20°0'0"W
20°0'0"W
25°0'0"W
25°0'0"W
30°0'0"W
30°0'0"W
45°0'0"N 45°0'0"N
40°0'0"N 40°0'0"N
35°0'0"N 35°0'0"N
Km0 10
Km0 2
Imp
Post-Imp
R2
R1
Atlantic Ocean
Po
rtu
ga
l
SpainAzores
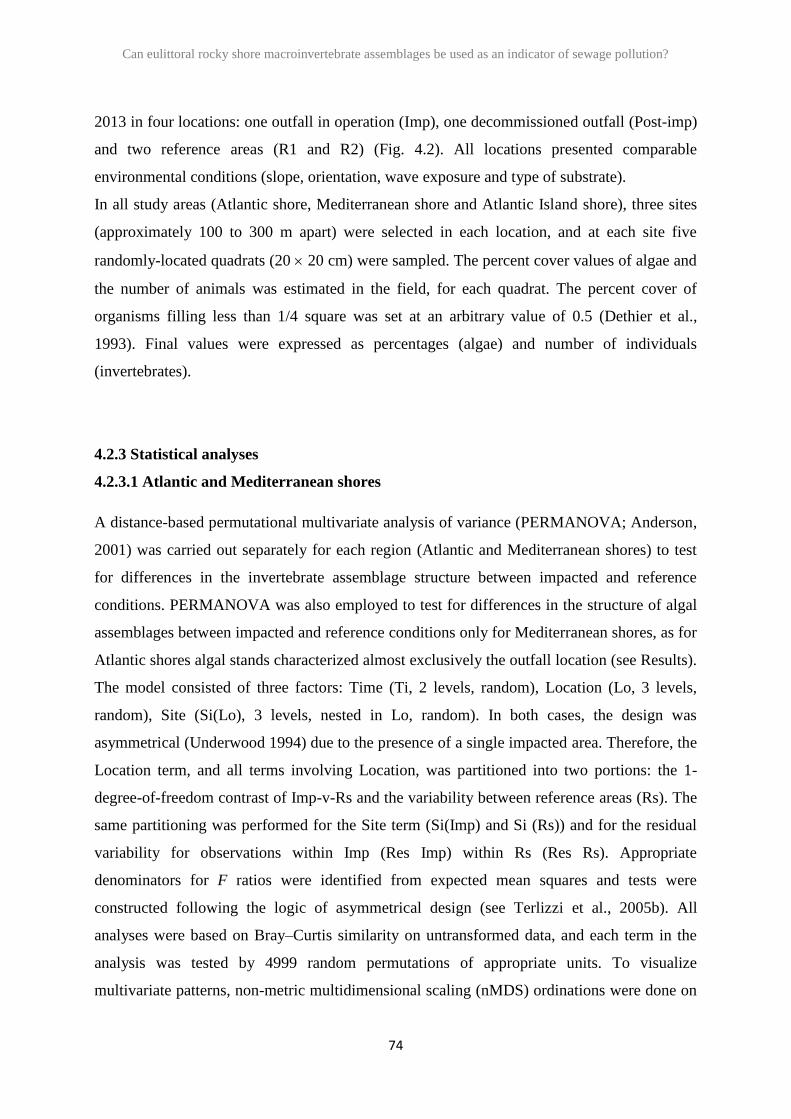
Can eulittoral rocky shore macroinvertebrate assemblages be used as an indicator of sewage pollution?
74
2013 in four locations: one outfall in operation (Imp), one decommissioned outfall (Post-imp)
and two reference areas (R1 and R2) (Fig. 4.2). All locations presented comparable
environmental conditions (slope, orientation, wave exposure and type of substrate).
In all study areas (Atlantic shore, Mediterranean shore and Atlantic Island shore), three sites
(approximately 100 to 300 m apart) were selected in each location, and at each site five
randomly-located quadrats (20 20 cm) were sampled. The percent cover values of algae and
the number of animals was estimated in the field, for each quadrat. The percent cover of
organisms filling less than 1/4 square was set at an arbitrary value of 0.5 (Dethier et al.,
1993). Final values were expressed as percentages (algae) and number of individuals
(invertebrates).
4.2.3 Statistical analyses
4.2.3.1 Atlantic and Mediterranean shores
A distance-based permutational multivariate analysis of variance (PERMANOVA; Anderson,
2001) was carried out separately for each region (Atlantic and Mediterranean shores) to test
for differences in the invertebrate assemblage structure between impacted and reference
conditions. PERMANOVA was also employed to test for differences in the structure of algal
assemblages between impacted and reference conditions only for Mediterranean shores, as for
Atlantic shores algal stands characterized almost exclusively the outfall location (see Results).
The model consisted of three factors: Time (Ti, 2 levels, random), Location (Lo, 3 levels,
random), Site (Si(Lo), 3 levels, nested in Lo, random). In both cases, the design was
asymmetrical (Underwood 1994) due to the presence of a single impacted area. Therefore, the
Location term, and all terms involving Location, was partitioned into two portions: the 1-
degree-of-freedom contrast of Imp-v-Rs and the variability between reference areas (Rs). The
same partitioning was performed for the Site term (Si(Imp) and Si (Rs)) and for the residual
variability for observations within Imp (Res Imp) within Rs (Res Rs). Appropriate
denominators for F ratios were identified from expected mean squares and tests were
constructed following the logic of asymmetrical design (see Terlizzi et al., 2005b). All
analyses were based on Bray–Curtis similarity on untransformed data, and each term in the
analysis was tested by 4999 random permutations of appropriate units. To visualize
multivariate patterns, non-metric multidimensional scaling (nMDS) ordinations were done on
Can eulittoral rocky shore macroinvertebrate assemblages be used as an indicator of sewage pollution?
75
the basis of a Bray–Curtis similarity matrix. The analysis was performed using the computer
programs DISTLM.exe and PERMANOVA.exe (Anderson 2004, 2005). A SIMPER analysis
on Mediterranean algal assemblages was also conducted to identify taxa most contributing to
the observed patterns. The analysis was performed using the PRIMER v 6 software package
(Clarke and Gorley, 2006).
Asymmetrical analysis of variance (ANOVA) based in the same model described above, was
carried out separately for each region (Atlantic and Mediterranean) to test for differences in
the densities of barnacles, limpets (i.e. Patella spp.) and littorinids (i.e. Melarhaphe
neritoides) between Imp-v-Rs. ANOVA was also employed to test for differences in algae
cover between the Atlantic and the Mediterranean shores in each sampling date individually.
The model consisted of three factors: Region (Re, 2 levels, fixed), Location (Lo(Re), 3 levels,
nested in Re, random), Site (Si(Lo(Re)), 3 levels, nested in Lo, random). Asymmetrical
ANOVA was carried out for both regions to test for differences in total algal cover between
Imp-v-Rs, using the same experimental design described above for single taxa. Prior to
analyses, the assumption of homogeneity of variances was checked using Cochran’s C-test
and data were appropriately transformed, whenever required. The analyses were carried out
using the computer program GMAV 5 (University of Sydney, Australia).
4.2.3.2 Atlantic island shores
A distance-based permutational multivariate analysis of variance (PERMANOVA; Anderson,
2001) was carried out separately for each outfall (outfall in operation and decommissioned
outfall) to test for differences in the invertebrate assemblage structure between outfall and
reference conditions. The model consisted of two factors: Location (1 impacted and 2
reference areas, fixed, orthogonal) and site (3 levels, nested in location, random). In both
cases, the design was asymmetrical (Underwood, 1994) due to the presence of a single
impacted area, as described above. All analyses were based on Bray–Curtis similarity on
squared-root transformed data, and each term in the analysis was tested by 4999 random
permutations of appropriate units. To visualize multivariate patterns, differences in
community structure among treatment levels were visualized by principal coordinate (PCO)
analyses on the basis of Bray-Curtis similarities.
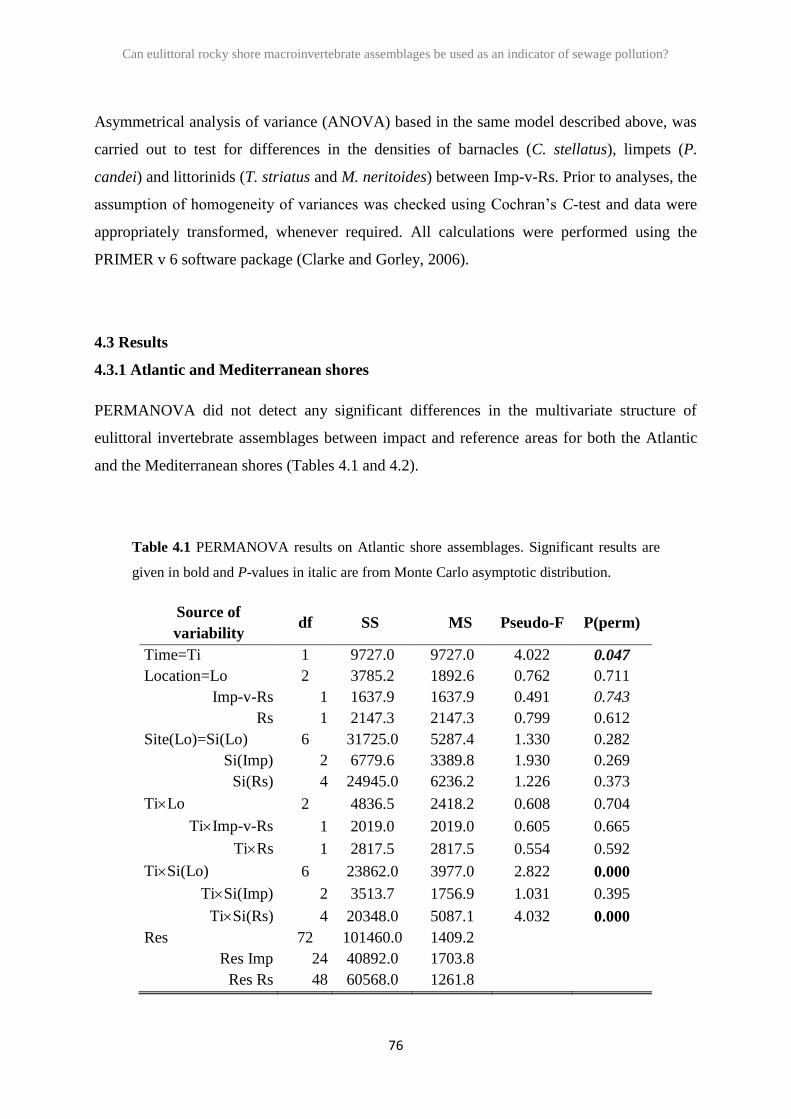
Can eulittoral rocky shore macroinvertebrate assemblages be used as an indicator of sewage pollution?
76
Asymmetrical analysis of variance (ANOVA) based in the same model described above, was
carried out to test for differences in the densities of barnacles (C. stellatus), limpets (P.
candei) and littorinids (T. striatus and M. neritoides) between Imp-v-Rs. Prior to analyses, the
assumption of homogeneity of variances was checked using Cochran’s C-test and data were
appropriately transformed, whenever required. All calculations were performed using the
PRIMER v 6 software package (Clarke and Gorley, 2006).
4.3 Results
4.3.1 Atlantic and Mediterranean shores
PERMANOVA did not detect any significant differences in the multivariate structure of
eulittoral invertebrate assemblages between impact and reference areas for both the Atlantic
and the Mediterranean shores (Tables 4.1 and 4.2).
Table 4.1 PERMANOVA results on Atlantic shore assemblages. Significant results are
given in bold and P-values in italic are from Monte Carlo asymptotic distribution.
Source of
variability df SS MS Pseudo-F P(perm)
Time=Ti 1 9727.0 9727.0 4.022 0.047
Location=Lo 2 3785.2 1892.6 0.762 0.711
Imp-v-Rs 1 1637.9 1637.9 0.491 0.743
Rs 1 2147.3 2147.3 0.799 0.612
Site(Lo)=Si(Lo) 6 31725.0 5287.4 1.330 0.282
Si(Imp) 2 6779.6 3389.8 1.930 0.269
Si(Rs) 4 24945.0 6236.2 1.226 0.373
TiLo 2 4836.5 2418.2 0.608 0.704
TiImp-v-Rs 1 2019.0 2019.0 0.605 0.665
TiRs 1 2817.5 2817.5 0.554 0.592
TiSi(Lo) 6 23862.0 3977.0 2.822 0.000
TiSi(Imp) 2 3513.7 1756.9 1.031 0.395
TiSi(Rs) 4 20348.0 5087.1 4.032 0.000
Res 72 101460.0 1409.2
Res Imp 24 40892.0 1703.8
Res Rs 48 60568.0 1261.8
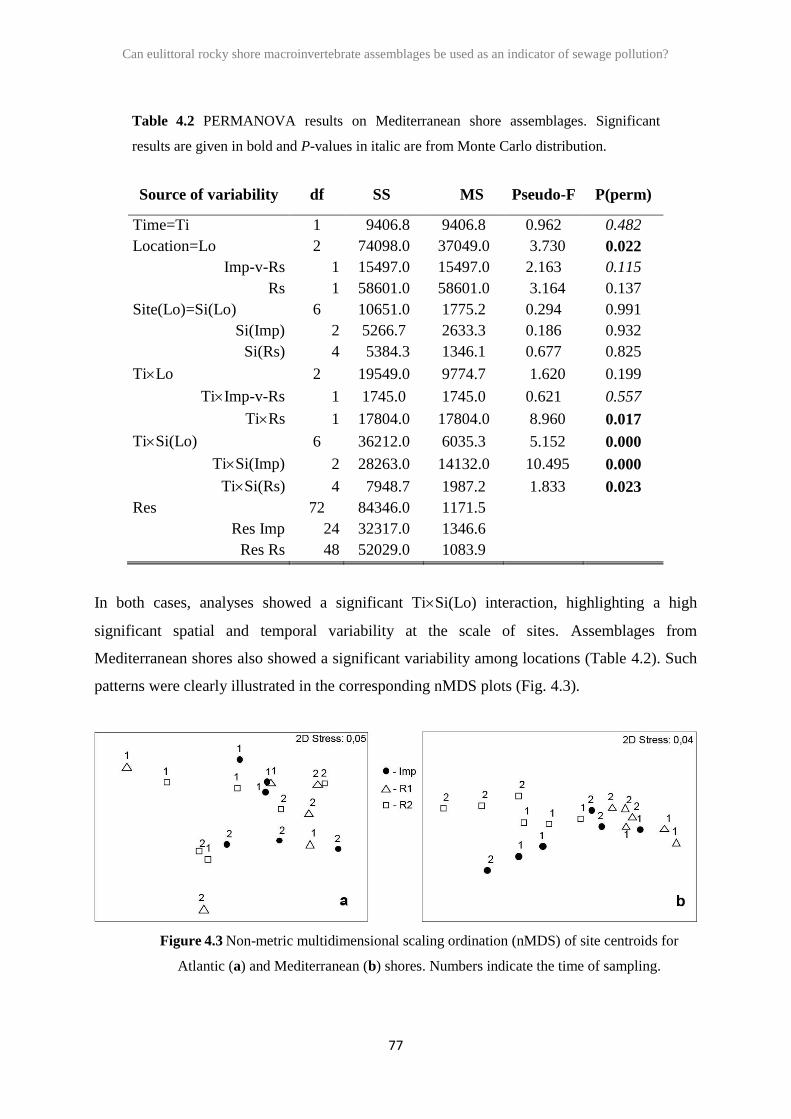
Can eulittoral rocky shore macroinvertebrate assemblages be used as an indicator of sewage pollution?
77
Table 4.2 PERMANOVA results on Mediterranean shore assemblages. Significant
results are given in bold and P-values in italic are from Monte Carlo distribution.
Source of variability df SS MS Pseudo-F P(perm)
Time=Ti 1 9406.8 9406.8 0.962 0.482
Location=Lo 2 74098.0 37049.0 3.730 0.022
Imp-v-Rs 1 15497.0 15497.0 2.163 0.115
Rs 1 58601.0 58601.0 3.164 0.137
Site(Lo)=Si(Lo) 6 10651.0 1775.2 0.294 0.991
Si(Imp) 2 5266.7 2633.3 0.186 0.932
Si(Rs) 4 5384.3 1346.1 0.677 0.825
TiLo 2 19549.0 9774.7 1.620 0.199
TiImp-v-Rs 1 1745.0 1745.0 0.621 0.557
TiRs 1 17804.0 17804.0 8.960 0.017
TiSi(Lo) 6 36212.0 6035.3 5.152 0.000
TiSi(Imp) 2 28263.0 14132.0 10.495 0.000
TiSi(Rs) 4 7948.7 1987.2 1.833 0.023
Res 72 84346.0 1171.5
Res Imp 24 32317.0 1346.6
Res Rs 48 52029.0 1083.9
In both cases, analyses showed a significant TiSi(Lo) interaction, highlighting a high
significant spatial and temporal variability at the scale of sites. Assemblages from
Mediterranean shores also showed a significant variability among locations (Table 4.2). Such
patterns were clearly illustrated in the corresponding nMDS plots (Fig. 4.3).
Figure 4.3 Non-metric multidimensional scaling ordination (nMDS) of site centroids for
Atlantic (a) and Mediterranean (b) shores. Numbers indicate the time of sampling.
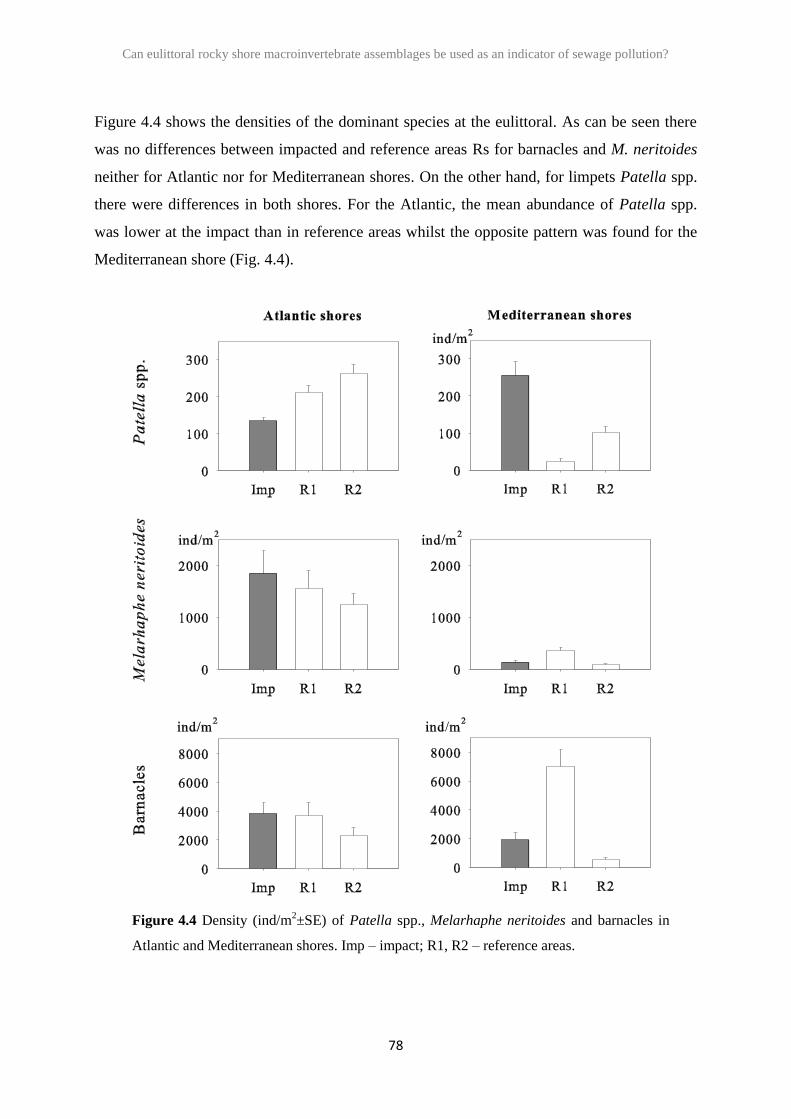
Can eulittoral rocky shore macroinvertebrate assemblages be used as an indicator of sewage pollution?
78
Figure 4.4 shows the densities of the dominant species at the eulittoral. As can be seen there
was no differences between impacted and reference areas Rs for barnacles and M. neritoides
neither for Atlantic nor for Mediterranean shores. On the other hand, for limpets Patella spp.
there were differences in both shores. For the Atlantic, the mean abundance of Patella spp.
was lower at the impact than in reference areas whilst the opposite pattern was found for the
Mediterranean shore (Fig. 4.4).
Figure 4.4 Density (ind/m2±SE) of Patella spp., Melarhaphe neritoides and barnacles in
Atlantic and Mediterranean shores. Imp – impact; R1, R2 – reference areas.
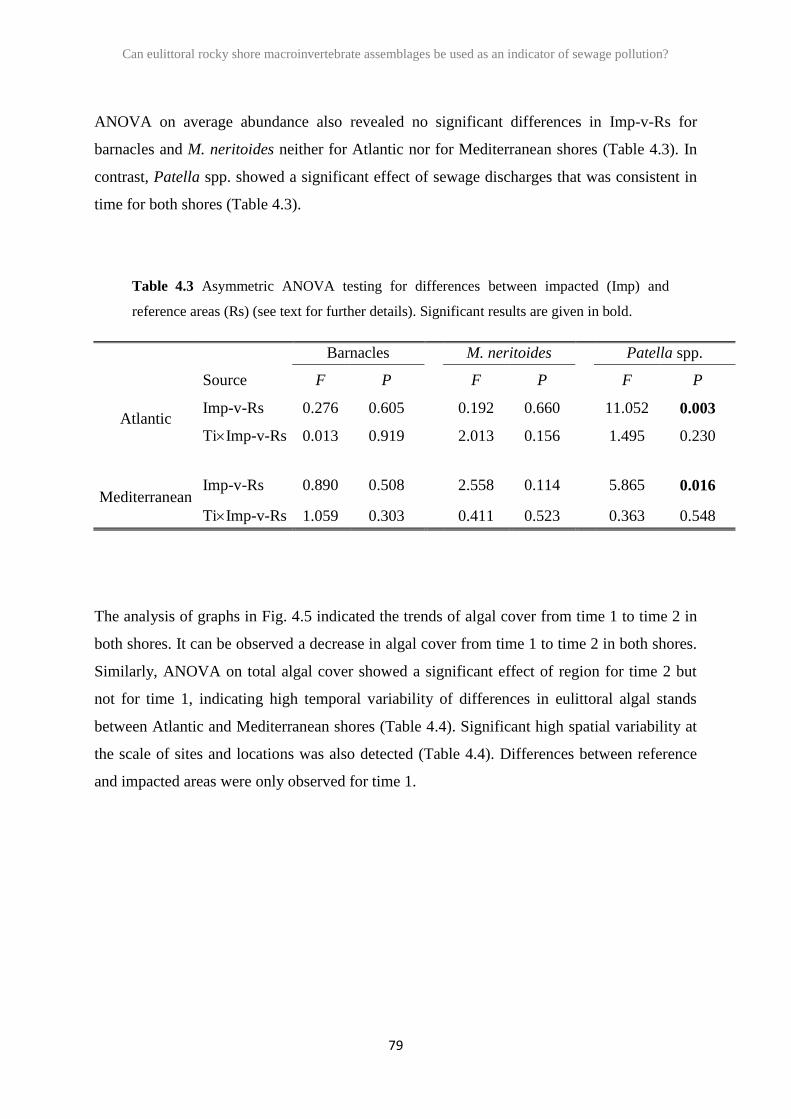
Can eulittoral rocky shore macroinvertebrate assemblages be used as an indicator of sewage pollution?
79
ANOVA on average abundance also revealed no significant differences in Imp-v-Rs for
barnacles and M. neritoides neither for Atlantic nor for Mediterranean shores (Table 4.3). In
contrast, Patella spp. showed a significant effect of sewage discharges that was consistent in
time for both shores (Table 4.3).
Table 4.3 Asymmetric ANOVA testing for differences between impacted (Imp) and
reference areas (Rs) (see text for further details). Significant results are given in bold.
Barnacles M. neritoides Patella spp.
Source F P F P F P
Atlantic Imp-v-Rs 0.276 0.605 0.192 0.660 11.052 0.003
TiImp-v-Rs 0.013 0.919 2.013 0.156 1.495 0.230
Mediterranean Imp-v-Rs 0.890 0.508 2.558 0.114 5.865 0.016
TiImp-v-Rs 1.059 0.303 0.411 0.523 0.363 0.548
The analysis of graphs in Fig. 4.5 indicated the trends of algal cover from time 1 to time 2 in
both shores. It can be observed a decrease in algal cover from time 1 to time 2 in both shores.
Similarly, ANOVA on total algal cover showed a significant effect of region for time 2 but
not for time 1, indicating high temporal variability of differences in eulittoral algal stands
between Atlantic and Mediterranean shores (Table 4.4). Significant high spatial variability at
the scale of sites and locations was also detected (Table 4.4). Differences between reference
and impacted areas were only observed for time 1.
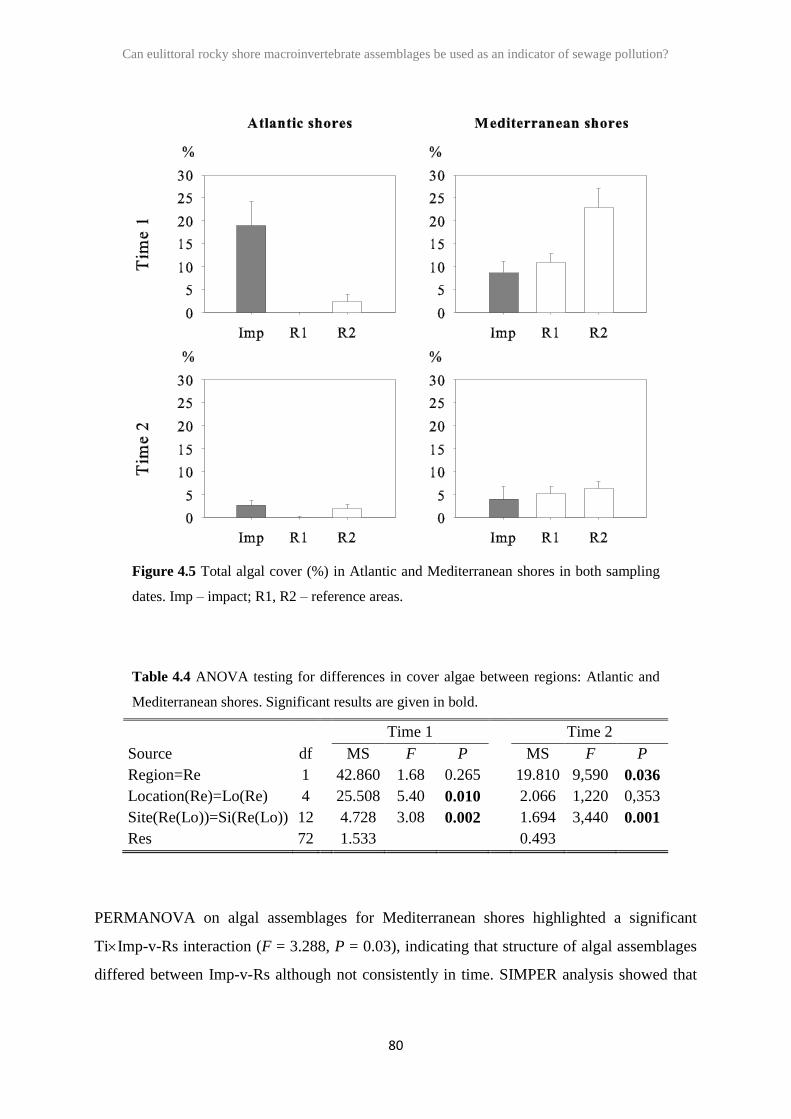
Can eulittoral rocky shore macroinvertebrate assemblages be used as an indicator of sewage pollution?
80
Figure 4.5 Total algal cover (%) in Atlantic and Mediterranean shores in both sampling
dates. Imp – impact; R1, R2 – reference areas.
Table 4.4 ANOVA testing for differences in cover algae between regions: Atlantic and
Mediterranean shores. Significant results are given in bold.
Time 1 Time 2
Source df MS F P MS F P
Region=Re 1 42.860 1.68 0.265 19.810 9,590 0.036
Location(Re)=Lo(Re) 4 25.508 5.40 0.010 2.066 1,220 0,353
Site(Re(Lo))=Si(Re(Lo)) 12 4.728 3.08 0.002 1.694 3,440 0.001
Res 72 1.533 0.493
PERMANOVA on algal assemblages for Mediterranean shores highlighted a significant
TiImp-v-Rs interaction (F = 3.288, P = 0.03), indicating that structure of algal assemblages
differed between Imp-v-Rs although not consistently in time. SIMPER analysis showed that
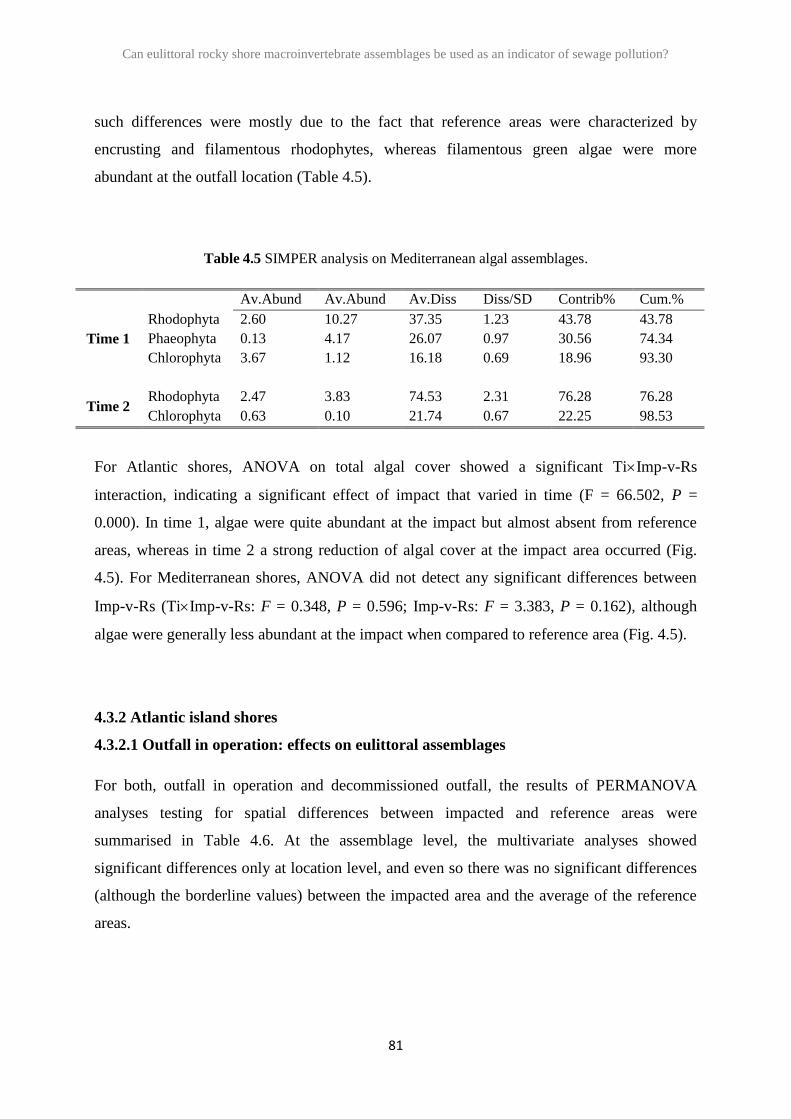
Can eulittoral rocky shore macroinvertebrate assemblages be used as an indicator of sewage pollution?
81
such differences were mostly due to the fact that reference areas were characterized by
encrusting and filamentous rhodophytes, whereas filamentous green algae were more
abundant at the outfall location (Table 4.5).
Table 4.5 SIMPER analysis on Mediterranean algal assemblages.
Av.Abund Av.Abund Av.Diss Diss/SD Contrib% Cum.%
Time 1
Rhodophyta 2.60 10.27 37.35 1.23 43.78 43.78
Phaeophyta 0.13 4.17 26.07 0.97 30.56 74.34
Chlorophyta 3.67 1.12 16.18 0.69 18.96 93.30
Time 2 Rhodophyta 2.47 3.83 74.53 2.31 76.28 76.28
Chlorophyta 0.63 0.10 21.74 0.67 22.25 98.53
For Atlantic shores, ANOVA on total algal cover showed a significant TiImp-v-Rs
interaction, indicating a significant effect of impact that varied in time (F = 66.502, P =
0.000). In time 1, algae were quite abundant at the impact but almost absent from reference
areas, whereas in time 2 a strong reduction of algal cover at the impact area occurred (Fig.
4.5). For Mediterranean shores, ANOVA did not detect any significant differences between
Imp-v-Rs (TiImp-v-Rs: F = 0.348, P = 0.596; Imp-v-Rs: F = 3.383, P = 0.162), although
algae were generally less abundant at the impact when compared to reference area (Fig. 4.5).
4.3.2 Atlantic island shores
4.3.2.1 Outfall in operation: effects on eulittoral assemblages
For both, outfall in operation and decommissioned outfall, the results of PERMANOVA
analyses testing for spatial differences between impacted and reference areas were
summarised in Table 4.6. At the assemblage level, the multivariate analyses showed
significant differences only at location level, and even so there was no significant differences
(although the borderline values) between the impacted area and the average of the reference
areas.
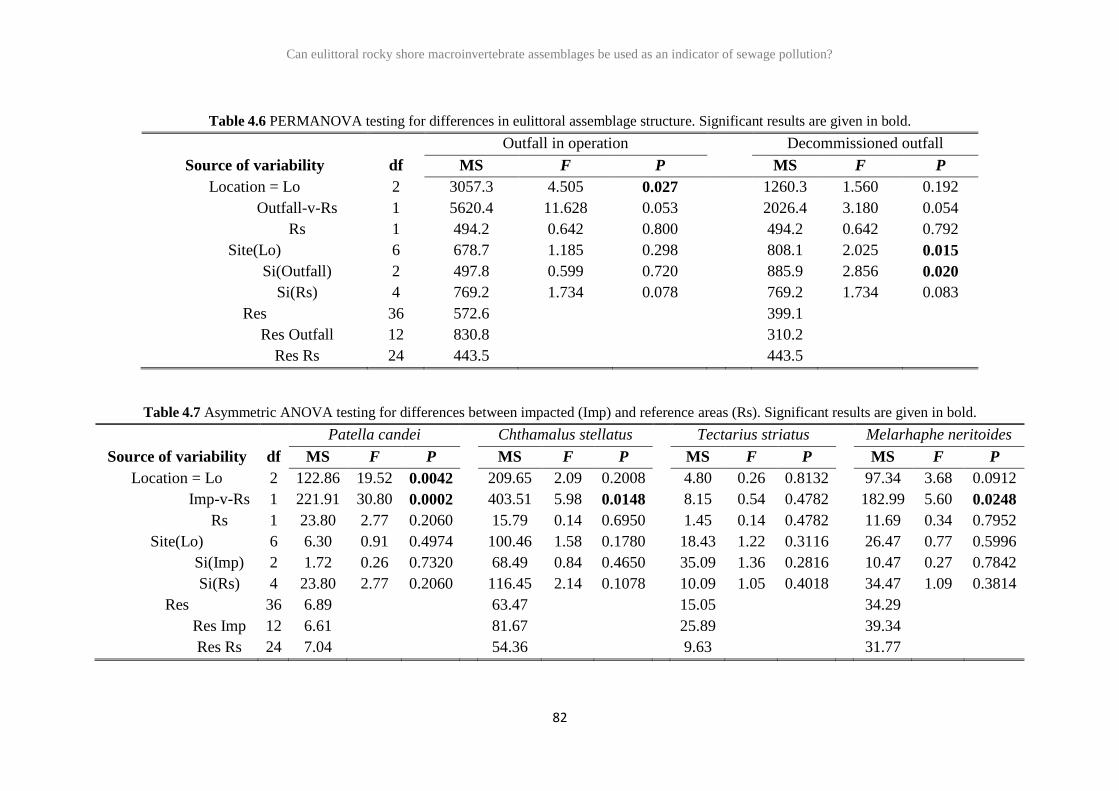
Can eulittoral rocky shore macroinvertebrate assemblages be used as an indicator of sewage pollution?
82
Table 4.6 PERMANOVA testing for differences in eulittoral assemblage structure. Significant results are given in bold.
Outfall in operation Decommissioned outfall
Source of variability df MS F P MS F P
Location = Lo 2 3057.3 4.505 0.027 1260.3 1.560 0.192
Outfall-v-Rs 1 5620.4 11.628 0.053 2026.4 3.180 0.054
Rs 1 494.2 0.642 0.800 494.2 0.642 0.792
Site(Lo) 6 678.7 1.185 0.298 808.1 2.025 0.015
Si(Outfall) 2 497.8 0.599 0.720 885.9 2.856 0.020
Si(Rs) 4 769.2 1.734 0.078 769.2 1.734 0.083
Res 36 572.6 399.1
Res Outfall 12 830.8 310.2
Res Rs 24 443.5 443.5
Table 4.7 Asymmetric ANOVA testing for differences between impacted (Imp) and reference areas (Rs). Significant results are given in bold.
Patella candei Chthamalus stellatus Tectarius striatus Melarhaphe neritoides
Source of variability df MS F P MS F P MS F P MS F P
Location = Lo 2 122.86 19.52 0.0042 209.65 2.09 0.2008 4.80 0.26 0.8132 97.34 3.68 0.0912
Imp-v-Rs 1 221.91 30.80 0.0002 403.51 5.98 0.0148 8.15 0.54 0.4782 182.99 5.60 0.0248
Rs 1 23.80 2.77 0.2060 15.79 0.14 0.6950 1.45 0.14 0.4782 11.69 0.34 0.7952
Site(Lo) 6 6.30 0.91 0.4974 100.46 1.58 0.1780 18.43 1.22 0.3116 26.47 0.77 0.5996
Si(Imp) 2 1.72 0.26 0.7320 68.49 0.84 0.4650 35.09 1.36 0.2816 10.47 0.27 0.7842
Si(Rs) 4 23.80 2.77 0.2060 116.45 2.14 0.1078 10.09 1.05 0.4018 34.47 1.09 0.3814
Res 36 6.89 63.47 15.05 34.29
Res Imp 12 6.61 81.67 25.89 39.34
Res Rs 24 7.04 54.36 9.63 31.77
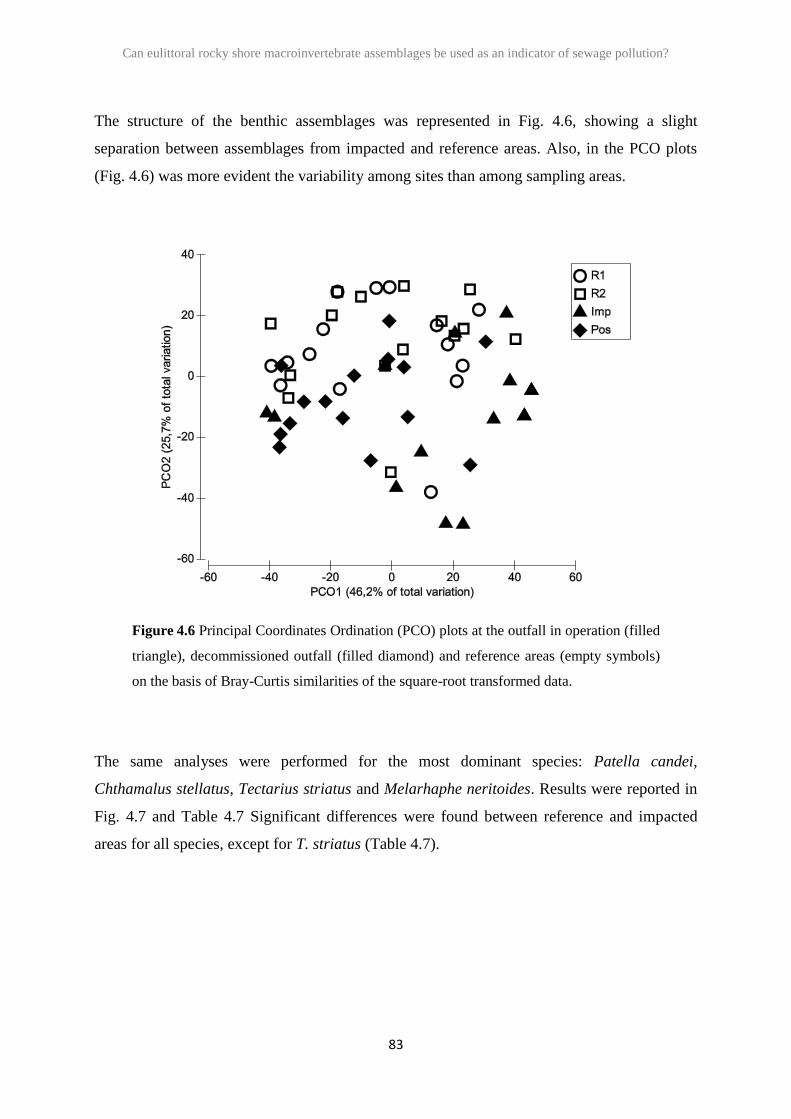
Can eulittoral rocky shore macroinvertebrate assemblages be used as an indicator of sewage pollution?
83
The structure of the benthic assemblages was represented in Fig. 4.6, showing a slight
separation between assemblages from impacted and reference areas. Also, in the PCO plots
(Fig. 4.6) was more evident the variability among sites than among sampling areas.
Figure 4.6 Principal Coordinates Ordination (PCO) plots at the outfall in operation (filled
triangle), decommissioned outfall (filled diamond) and reference areas (empty symbols)
on the basis of Bray-Curtis similarities of the square-root transformed data.
The same analyses were performed for the most dominant species: Patella candei,
Chthamalus stellatus, Tectarius striatus and Melarhaphe neritoides. Results were reported in
Fig. 4.7 and Table 4.7 Significant differences were found between reference and impacted
areas for all species, except for T. striatus (Table 4.7).
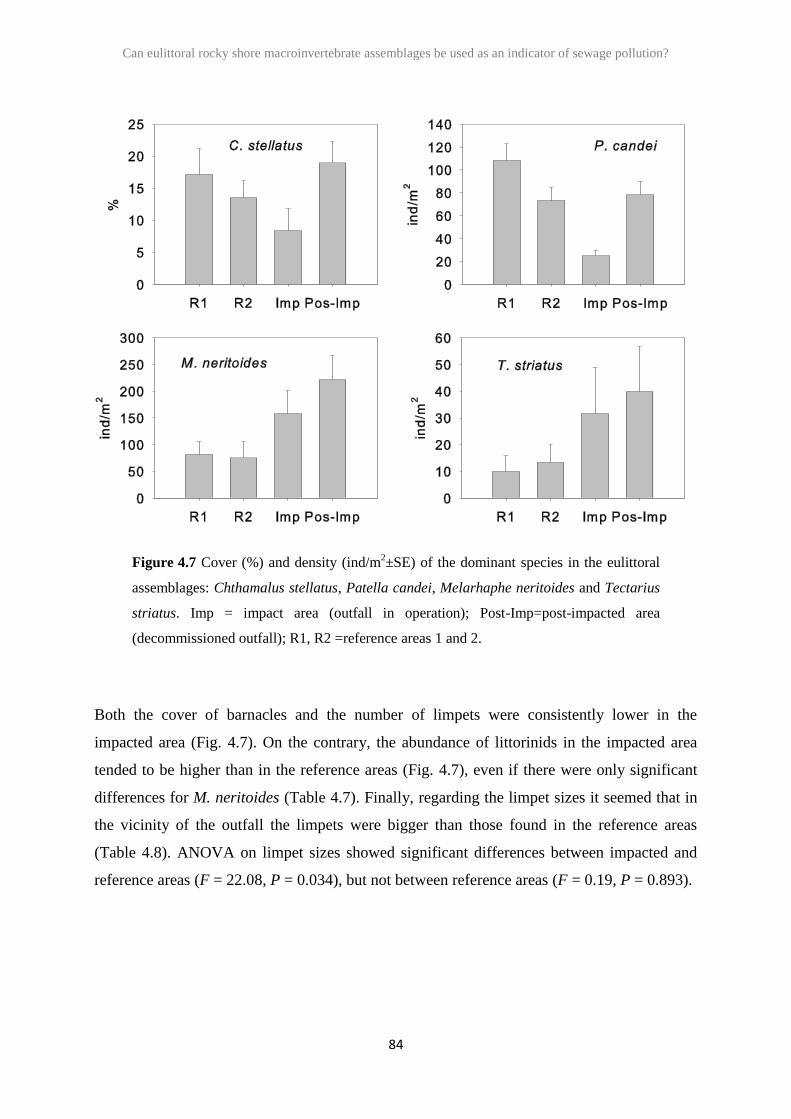
Can eulittoral rocky shore macroinvertebrate assemblages be used as an indicator of sewage pollution?
84
Figure 4.7 Cover (%) and density (ind/m2±SE) of the dominant species in the eulittoral
assemblages: Chthamalus stellatus, Patella candei, Melarhaphe neritoides and Tectarius
striatus. Imp = impact area (outfall in operation); Post-Imp=post-impacted area
(decommissioned outfall); R1, R2 =reference areas 1 and 2.
Both the cover of barnacles and the number of limpets were consistently lower in the
impacted area (Fig. 4.7). On the contrary, the abundance of littorinids in the impacted area
tended to be higher than in the reference areas (Fig. 4.7), even if there were only significant
differences for M. neritoides (Table 4.7). Finally, regarding the limpet sizes it seemed that in
the vicinity of the outfall the limpets were bigger than those found in the reference areas
(Table 4.8). ANOVA on limpet sizes showed significant differences between impacted and
reference areas (F = 22.08, P = 0.034), but not between reference areas (F = 0.19, P = 0.893).
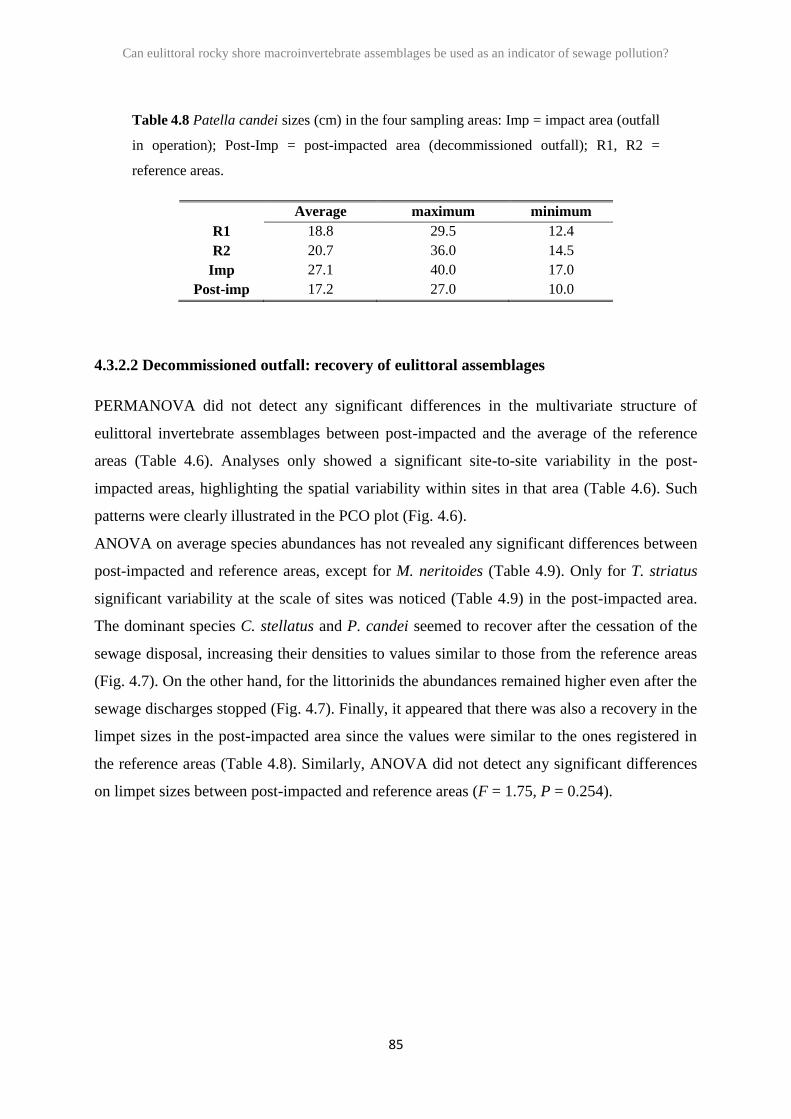
Can eulittoral rocky shore macroinvertebrate assemblages be used as an indicator of sewage pollution?
85
Table 4.8 Patella candei sizes (cm) in the four sampling areas: Imp = impact area (outfall
in operation); Post-Imp = post-impacted area (decommissioned outfall); R1, R2 =
reference areas.
Average maximum minimum
R1 18.8 29.5 12.4
R2 20.7 36.0 14.5
Imp 27.1 40.0 17.0
Post-imp 17.2 27.0 10.0
4.3.2.2 Decommissioned outfall: recovery of eulittoral assemblages
PERMANOVA did not detect any significant differences in the multivariate structure of
eulittoral invertebrate assemblages between post-impacted and the average of the reference
areas (Table 4.6). Analyses only showed a significant site-to-site variability in the post-
impacted areas, highlighting the spatial variability within sites in that area (Table 4.6). Such
patterns were clearly illustrated in the PCO plot (Fig. 4.6).
ANOVA on average species abundances has not revealed any significant differences between
post-impacted and reference areas, except for M. neritoides (Table 4.9). Only for T. striatus
significant variability at the scale of sites was noticed (Table 4.9) in the post-impacted area.
The dominant species C. stellatus and P. candei seemed to recover after the cessation of the
sewage disposal, increasing their densities to values similar to those from the reference areas
(Fig. 4.7). On the other hand, for the littorinids the abundances remained higher even after the
sewage discharges stopped (Fig. 4.7). Finally, it appeared that there was also a recovery in the
limpet sizes in the post-impacted area since the values were similar to the ones registered in
the reference areas (Table 4.8). Similarly, ANOVA did not detect any significant differences
on limpet sizes between post-impacted and reference areas (F = 1.75, P = 0.254).
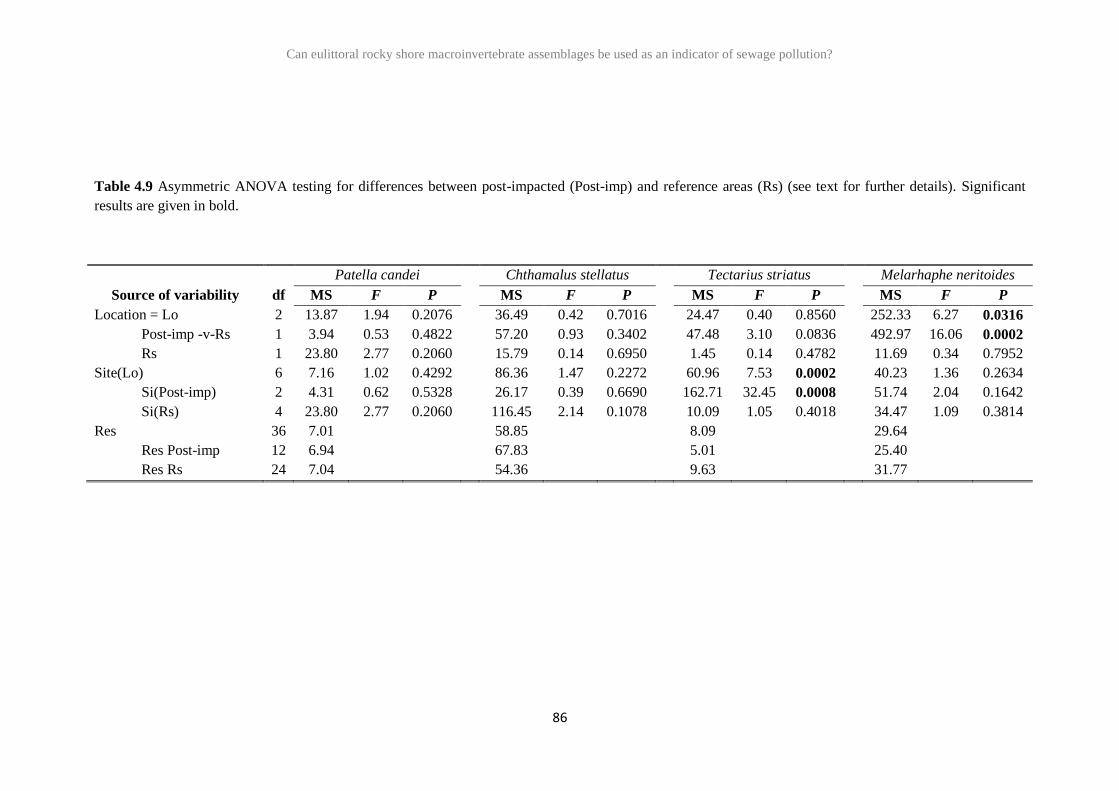
Can eulittoral rocky shore macroinvertebrate assemblages be used as an indicator of sewage pollution?
86
Table 4.9 Asymmetric ANOVA testing for differences between post-impacted (Post-imp) and reference areas (Rs) (see text for further details). Significant
results are given in bold.
Patella candei Chthamalus stellatus Tectarius striatus Melarhaphe neritoides
Source of variability df MS F P MS F P MS F P MS F P
Location = Lo 2 13.87 1.94 0.2076 36.49 0.42 0.7016 24.47 0.40 0.8560 252.33 6.27 0.0316
Post-imp -v-Rs 1 3.94 0.53 0.4822 57.20 0.93 0.3402 47.48 3.10 0.0836 492.97 16.06 0.0002
Rs 1 23.80 2.77 0.2060 15.79 0.14 0.6950 1.45 0.14 0.4782 11.69 0.34 0.7952
Site(Lo) 6 7.16 1.02 0.4292 86.36 1.47 0.2272 60.96 7.53 0.0002 40.23 1.36 0.2634
Si(Post-imp) 2 4.31 0.62 0.5328 26.17 0.39 0.6690 162.71 32.45 0.0008 51.74 2.04 0.1642
Si(Rs) 4 23.80 2.77 0.2060 116.45 2.14 0.1078 10.09 1.05 0.4018 34.47 1.09 0.3814
Res 36 7.01 58.85 8.09 29.64
Res Post-imp 12 6.94 67.83 5.01 25.40
Res Rs 24 7.04 54.36 9.63 31.77
Can eulittoral rocky shore macroinvertebrate assemblages be used as an indicator of sewage pollution?
87
4.4 Discussion
4.4.1 Atlantic and Mediterranean shores
The urgency to find efficient tools allowing to prevent the deterioration of coastal areas led to
the search for indicators able to detect the effects of anthropogenic impacts on those habitats
(Juanes et al., 2008).
The present results showed that, for both Atlantic and Mediterranean shores, the multivariate
structure of eulittoral invertebrate assemblages did not seem to be affected by sewage
discharges. Such findings are aligned with other studies that did not find any evident effect of
sewage discharges in determining changes in assemblages, number and identity of species in
the eulittoral zone (e.g. Archambault et al., 2001; Bustamante et al., 2012). Indeed, this
intertidal zone is exposed daily to high level of natural disturbance caused by tidal regimes,
desiccation, and wave action. Therefore, intertidal species might be better adapted to tolerate
sharp environmental variations (Lüning et al., 1990), such as those potentially induced by
sewage discharges (e.g. organic enrichment, freshwater inputs). However, previous research
in the same areas of the present study, based on destructive sampling methods (chapter 2)
have found differences in Atlantic eulittoral assemblages due to the presence of sewage
discharges, with higher species richness and higher abundance of the dominant species. These
results seem to suggest that an alternative explanation of the observed patterns might rely on
the fact that visual estimates of invertebrate density, although effective for sessile and
sedentary taxa, might not be adequate for motile and/or cryptic ones as well, thus leading to a
restricted appreciation of assemblages response to environmental drivers.
The response of the dominant species were more relevant, especially Patella spp., whose
abundances were significantly different between reference and impacted areas, both in
Atlantic and Mediterranean shores. Atalah and Crowe (2012) have associated the presence of
sewage discharges with changes in the abundance and structure of gastropod assemblages,
highlighting the value of such assemblages as indicators of nutrient enrichment. Furthermore,
previous studies on the effects of sewage pollution on limpets have noticed a reduction in the
number of species near the outfall (e.g., Espinosa et al., 2007), suggesting that limpet species
might be good indicators of nutrient enrichment associated to sewage effluents. Other studies,
in contrast, reported a significant increase of limpets (Patelloida lastritigata) in intertidal
areas impacted by sewage discharges with respect to unaffected areas (e.g. Bishop et al.,
2002).
Can eulittoral rocky shore macroinvertebrate assemblages be used as an indicator of sewage pollution?
88
In this study populations of limpets of the genus Patella were demonstrated to be significantly
affected by sewage discharges in both Atlantic and Mediterranean shores. However, responses
varied across shores. In the Atlantic, limpet density was lower at the outfall than at reference
areas, while the opposite pattern occurred in the Mediterranean. As limpets are herbivorous, it
could be argued that such patterns might be due to difference in algal cover between the two
regions and explained in terms of different food availability. Differences in algal cover
between Atlantic and Mediterranean shores were, nevertheless, not consistent in time and,
when present (i.e., time 1) they appeared to be very low. Moreover, average abundance of
algae seemed comparable (time 2) or even higher (time 1) at the Atlantic than at the
Mediterranean outfall, which is in contrast with the observed differences in limpet densities
for Imp-v-Rs between the two regions. Interestingly, for both regions, algae seemed to show
opposite patterns imputable to the outfall with respect to those exhibited by limpets,
suggesting that differences in the algal cover were likely to be a consequence of differences in
limpet density, and therefore of different grazing pressure, rather than causing them.
However, algal assemblages were quite different comparing the outfall and reference areas in
both shores. For instance, green filamentous algae were more abundant at the impact, while
reference areas were mostly characterized by encrusting and filamentous red algae. This is a
well-known outcome of sewage discharges in the intertidal zone that often leads to increased
organic matter, which, in turn, triggers the proliferation of opportunistic green algae (Raffaelli
and Hawkins, 1996). Several algal taxa that are likely to be facilitated by the presence of the
outfall (such as cyanophyta, diatoms and opportunistic green filamentous Cladophorales) are
the main dietary components of many limpet species (e.g. Della Santina et al., 1993).
Therefore, a higher number of limpets at the impact areas would be expected as a
consequence of the increased availability of food resources. This, nevertheless, does not
exhaustively elucidate the opposite patterns of limpet densities at the outfall between Atlantic
and Mediterranean shores.
A possible explanation of such contrasting patterns may rely on the fact that the species of
limpets are different between the two investigated shores. Species belonging to the genus
Patella reported for the central Portuguese shores are P. depressa and P. ulyssiponensis
(Boaventura et al., 2002), with P. depressa being most common in the eulittoral zone (Silva et
al., 2003). More species are present on Mediterranean shores: P. rustica, P. ulyssiponensis, P.
caerulea, P. ferruginea, P. nigra (Giannuzzi-Savelli et al., 1994). P. ulyssiponensis, P.
Can eulittoral rocky shore macroinvertebrate assemblages be used as an indicator of sewage pollution?
89
rustica, and P. caerulea, in particular, are the most common species in the Mediterranean
eulittoral zone (Della Santina et al., 1993; Simunovic, 1970). Such species might respond
differently to sources of disturbance related to sewage discharges, such as nutrient enrichment
or increased contaminants, showing different levels of tolerance. For instance, P. caerulea is
more tolerant than the other species to environmental changes induced by sewage discharges
(Espinosa et al., 2007), whereas P. ulyssiponensis may tolerate increased amount of pollutants
(e.g., Bebianno et al., 2003). Therefore, discrepancies between the two shores concerning the
effect of sewage discharges on patterns of limpet abundance might depend on the interplay
between tolerance/sensitiveness and the response to resources availability of region-specific
dominant species of the eulittoral zone.
4.4.2 Atlantic island shores
4.4.2.1 Outfall in operation: effects on eulittoral assemblages
The ecology of intertidal rocky shore communities in Atlantic islands has received far less
attention than mainland coastlines, and to our best knowledge this study was the first attempt
to understand the effect of sewage discharges on insular intertidal assemblages. Previous
studies (Benedetti-Cecchi et al., 2003) have found differences between eulittoral assemblages
from islands and the mainland, with higher spatial and temporal variance on islands, but with
lower abundances of barnacles and limpets. Moreover, ecological processes such as patterns
of dispersal or growth are probably different between islands and the mainland (Benedetti-
Cecchi et al., 2003), giving rise to possible differences in the response of the assemblages to
the sewage discharges.
In this study the sewage discharges seemed to have no significant effects on eulittoral
invertebrate assemblages. This is in accordance with previous studies (e.g. Archambault et al.,
2001; Bustamante et al., 2012) which have found no changes in the structure, abundance or
species richness of eulittoral assemblages exposed to sewage discharges. These authors
suggested that eulittoral assemblages were not affected since waves, tides and currents
removed the effluents rapidly from the areas (Underwood and Chapman et al., 1996;
Archambault et al., 2001). Furthermore, invertebrate assemblages from rocky shores are
naturally highly variable and so it becomes more difficult to detect the effects of an impact on
a multivariate analysis (Bustamante et al., 2012). However, other studies, based on destructive
Can eulittoral rocky shore macroinvertebrate assemblages be used as an indicator of sewage pollution?
90
sampling methods (chapter 2) have found differences in eulittoral assemblages due to the
presence of sewage discharges, with higher species richness and higher abundance of
suspension-feeders. These results suggest that the observed patterns may be in part justified
by the fact that visual estimates of invertebrate density could not be so sensible to detect more
subtle effects of anthropogenic impacts.
The distribution pattern of the dominant species was modified by the presence of sewage
discharges. There was a decrease in the cover of barnacles and in the number of limpets, and
an increase in the abundance of littorinids. Previous studies have noticed that sewage
discharges tended to beneficiate filter-feeders like barnacles (Hawkins and Jones, 1992).
These higher densities are probably related with food availability, attending the higher amount
of suspended solids near the sewage discharges. However, in this study, there was a decrease
in the cover of barnacles near the sewage discharges. This may be due to the fact that the
dominant species in Terceira coast is Chthamalus stellatus, known to be very sensitive to
organic enrichment (Borja et al., 2000). Furthermore, it has already been observed that the
recruitment of this species could be affected by physical disturbance (Martins et al., 2009),
and perhaps the same occurs in the presence of sewage pollution. On the other hand, the
higher amount of littorinids near the sewage discharges has already been noticed in previous
works (Cabral-Oliveira et al., 2009). The higher concentration of nutrients near sewage areas
will lead to a larger quantity of microalgae on the rocky surfaces, on which littorinids feed.
This could be attractive to the settling of larvae, producing higher population densities.
Finally, there were fewer limpets in the impacted area, but the individuals were bigger than
those found in the reference areas. Previous studies on the effects of sewage pollution on
limpets have suggested that patellidae species may be good indicators of nutrient enrichment
related to sewage effluents (e.g. Bishop et al., 2002; Espinosa et al., 2007), and have associate
this species to high-good status in coastal rocky assemblages (Díez et al., 2012). Nevertheless,
other authors found that limpets may benefit from nutrient enrichment (Tablado et al., 1994;
Rogers, 2003). These opposing responses could be due to differences between species,
depending on within-taxon heterogeneities of ecological traits. The greater sizes and growth
rates near the sewage discharges observed are also in agreement with previous studies
(Tablado and López-Gappa, 2001). This could be explained with the higher availability of
food, and also the higher sea water temperature observed near the sewage discharges, which
may promote the growth of this species. The effects of sewage pollution on limpets will bring
Can eulittoral rocky shore macroinvertebrate assemblages be used as an indicator of sewage pollution?
91
not only ecological but also socio-economic concerns, due to the commercial and recreational
exploitation of P. candei in the Terceira Island. It could lead to human health concerns, due to
the ingestion of contaminated limpets harvested in the vicinity of the outfall. Moreover, these
traditional activities seemed to be a highly valued good to local population, and may have a
strong local economic importance (Pinto et al., 2012). Therefore, a decreased abundance of
this species may affect the socio-economic conditions of the local population.
4.4.2.2 Decommissioned outfall: recovery of eulittoral assemblages
The primary aim of the closure of the outfall was to prevent the effluent into beaches highly
used by local surfers, in order to avoid human health issues. This objective has been
succeeded, but it is also important to understand if the eulittoral assemblages had recovery.
The multivariate analysis seemed to suggest a recovery of the system, and also the
abundances of the barnacle C. stellatus and the limpet P. candei returned to values similar to
the reference areas. In opposition, the behavior of the littorinids was not so expected, with the
abundances remaining higher even after the sewage discharges ended. Previous studies on
recovery of rocky shore assemblages after the cessation of sewage disposal have not reach
similar conclusions. On the subtidal, some authors found neither evident effects of sewage
discharges, nor recovery after cessation (Underwood and Chapman, 1996). Others registered
changes in the structure of the assemblages, followed by a rapid recovery after the removal of
the outfall (Roberts et al., 1998; Archambault et al., 2001). Birchenough and Frid (2009)
described the effects after the cessation of sewage sludge in subtidal habitats, and have
noticed two recovery phases. The first, immediately after-disposal phase, showed a localized
increased in abundance and species richness. The second, after one year, where it was noticed
that the system started to return to conditions similar to the ones observed in the reference
areas. On the eulittoral, some studies found no changes in the assemblages due to the presence
of sewage discharges (Archambault et al., 2001). Other studies examined the recovery of
eulittoral assemblages after the improvement of sewage treatment (from primary to secondary
level) and noticed a decrease in the cover of suspension feeders and an increase of the limpets
Patella ulyssiponensis.
In the present study, at the assemblage level, there were no statistical differences between
post-impacted and reference areas. However, it was observed a significant site-to-site
Can eulittoral rocky shore macroinvertebrate assemblages be used as an indicator of sewage pollution?
92
variability in the post-impacted areas. Changes in small-scale variability have already been
pointed out as a possible feature of environmental stress (Warwick and Clarke, 1993; Terlizzi
et al., 2005b; Bustamante et al., 2012). This variability among sites may be due to differences
in total cover or species richness, changes in a particular species, or changes in the taxonomic
composition (Terlizzi et al., 2005b). In this case, they were probably related with T. striatus
behavior, which also registered significant differences among sites in the post-impacted area.
At species level, the recovery of limpets and barnacles was an important step to the recovery
of the system. Barnacles are important species since provide shelter to several other species,
while limpets are dominant grazers essential to balance the macroalgae growth (Little et al.,
2010; Fish and Fish, 2011). Not so expected was the response of the littorinids after the
cessation of sewage disposal. The recovery processes and the biological community
composition are controlled by a variety of environmental influences (Birchebough and Frid,
2009). The response of the littorinids could be due to specific characteristics of the species
(dispersal mechanisms, settlement, habitat preferences) or to differences in the ecological
processes of this species in islands. Further research is necessary in order to fully understand
the recovery processes of littorinids species.
Above all, the present study raises some questions about the potential of evaluations based on
eulittoral assemblages to serve as a cost-effective assessment of sewage impact on rocky
shores. Specific taxa, and especially limpets of the genus Patella, might be more effective in
evaluating the environmental status of coastal systems in relation to main human impacts,
such as sewage discharges, without the need of surveying the whole community, which would
be more costly and time-consuming. However, the response of limpet assemblages seems to
be different across the bioregions, depending on within-taxon heterogeneities of ecological
traits, and thus deserving further research in order to ascertain their potential utilization as
suitable environmental indicators over large spatial scales.

93
CHAPTER 5
General discussion

94
95
General discussion
5.1 Sewage disturbance on rocky coastal areas
Disturbance may be physical, chemical or biological, and can have natural or anthropogenic
origin. It can change ecosystem processes and biodiversity patterns. The effects of disturbance
can vary greatly, depending on the timescale (duration and frequency), spatial scale and
intensity of disturbance, as well on the ability of the species present to respond to stress. The
effects can range from total destruction, to the enhancement of local biodiversity. Sewage
pollution is an anthropogenic chemical disturbance, due to the presence of
substances/elements to which the community is not adapted (Magurran and McGill, 2010).
Sewage is a mixture of organic matter, inorganic nutrients and microbes such as viruses and
bacteria (Pinet, 2000). However, only in recent years the direct discharge of sewage into the
sea has been questioned. Since then the sewage treatment methods have developed in order to
prevent further deterioration of aquatic systems (Raffaelli and Hawkins, 1996)
5.1.1 Sewage effects on the abiotic environment
The potential adverse effects of sewage effluents are mainly due to eutrophication, toxicity,
turbidity, sedimentation and decreases in salinity. The stress level from sewage discharges
may vary considerably depending on the type and on the effluent treatment, as well as on the
physical environmental conditions in which the effluent is discharged (Bustamante et al.,
2012).
Sewage includes the waste-water produced by the community, which could have three
different sources: domestic, industrial and rainwater (Seghezzo et al., 1998). The sewage
treatment plants (STP) can involve three stages: primary, secondary and tertiary treatment. In
the primary treatment the sewage is allowed to settle, and then the deposits (gross solids) and
floating materials (e.g. oils, greases) are removed. The secondary treatment aims to degrade
the biological content of the sewage. The majority of STP uses aerobic biological processes to
eliminate the organic matter. The micro-organisms are then removed by sedimentation
processes. Finally, in the tertiary treatment pathogenic organisms and nutrients are removed
General discussion
96
(McKinney and Schoch, 1998). These different treatments gradually improve the effluent
quality, and will be responsible by diverse impacts on the abiotic environment. Previous
studies near untreated sewage discharges (Gappa et al, 1990; Elías et al., 2009) noticed an
increase in temperature of the seawater, turbidity and total coliforms, and a decrease in pH,
salinity and dissolved oxygen. Other authors when comparing secondary to primary
treatment, found a decrease in suspended solids, nutrients and turbidity (De-la-Ossa-Carretero
et al., 2011). To our best knowledge, there is no study comparing secondary and tertiary
treatment effects on abiotic parameters in rocky shores. However, a decrease in nutrients and
bacteria would be expectable.
In this study the environmental parameters suffer changes with the presence of sewage
discharges, especially in salinity, oxygen and nutrients (NH4 and PO4). Although not
statistically significant other parameters also change (seawater temperature, pH, total
coliforms). This occurs because the discharges are not continuous, and due to the dilution of
the waves and tides, the values of standard deviation are higher, which prevent the differences
to be statistically significant. In reality, with secondary treatment some of these parameters
should not be so affected by the presence of sewage discharges. However, this could be
explained by the type of effluents received.
The flow rate and composition of the effluents which enter in the STP seem to vary
significantly, depending on several factors, such as, economic aspects, social behavior, type
and number of industries located in the collection area, climatic conditions or water
consumption (Seghezzo et al., 1998). The Urban Waste-Water Treatment Directive
(91/271/EEC), which aims to prevent the adverse effects of sewage on the environment,
draws attention to the industrial waste waters. Industrial effluents should be subject to a pre-
treatment also due to the presence of contaminants, such as PAHs or trace elements.
The major anthropogenic emissions of trace elements eventually end up in waste-water. If the
STP are not prepared to remove these elements (generally by chemical precipitation
processes), the trace element contamination of marine ecosystems may pose serious
environmental and health risks (Baysal et al., 2013).
The analysis of trace elements is essential to assess the potential environmental and health
risk associated with the sludge and sewage discharges coming from STP. Zinc, copper, nickel,
cadmium, lead, mercury and chromium are the principal elements limiting sludge recycling to
agricultural land (Álvarez et al., 2002). Also, sewage discharged to aquatic systems can pose
General discussion
97
health problems to the organisms and, finally, to humans. For example, seafood (such as the
species studied in this thesis: Mytilus galloprovincialis, Phorcus lineatus, Patella spp) may
represent risk for human health since they can accumulate trace elements from the aquatic
environment and magnify them up the food chain (Maceda-Veiga et al., 2013). Finally, trace
metal contamination may as well be very useful as an index of human exposure (Conti and
Finoia, 2010).
In our sampling area, as already stated in chapter 2, the sewage discharges appear to be a
source of arsenic (As) contamination, probably due to the industries present in the area (e.g.
shypyards and metal smelting). According to the Agency for Toxic Substances and Disease
Registry (ATSDR, 2011) the number one on the priority list of hazardous substances is As.
The toxicity of As in organisms depend on its concentration and speciation, being inorganic
arsenic species generally more toxic than organoarsenic species (Rahman et al., 2012).
Although the information obtained from total arsenic determination is not enough to assess
the toxicological risk in the environment, it can give an important contribute on contamination
risks and help choosing potential good bioindicators. From all the studied species in this
work, Patella spp., representative of the macrofaunal group and Asparagopsis armata
representative of the macroalgae group seem to be the best bioindicators for trace element
contamination.
5.1.2 Effects on the intertidal macroinvertebrate assemblages
5.1.2.1 What to measure
Contamination by the presence of unnatural chemicals is not synonymous with pollution,
which implies the effects of, or responses to, such contamination (Bishop et al., 2002). The
presence of sewage discharges is responsible for the modification of several environmental
parameters (chapter 1 and 2), which will probably lead to changes in the biological
communities. How can these effects on the biological communities be measured?
Sewage discharges can have severe effects on the structure and functioning of the marine
ecosystems (chapter 2). In this section several biological metrics and their ability to detect the
effects of disturbance will be discussed.
The impact of sewage pollution in marine habitats has been studied by assessing the response
of the biological assemblages. One of the ways to measure responses from biological
General discussion
98
communities is by comparing species richness. However there is not a consistent response of
diversity to sewage pollution: in some cases it might increase (López-Gappa et al., 1993),
decrease (Littler and Murray, 1975; Archambault et al., 2001) or have no clear effect, as
previously mentioned in chapter 2. In Peniche shores the species richness response to sewage
discharges change along the tidal levels, increasing at the eulittoral, and decreasing at the
sublittoral fringe. Changes in species richness seem to depend on the type and intensity of
disturbance and on the original community of the study area (Whomersley et al., 2010).
Moreover, species richness have the advantage of being simple to interpret and easy to
calculate, but it could be insensitive to subtle changes (Magurran and McGill, 2010).
Other studies have analysed the effects of sewage pollution on the patterns of density and
biomass of biological assemblages. However, there is not a homogeneous response either. In
some cases the presence of sewage discharges increased the abundances (Littler and Murray,
1975), while in others decreased (López-Gappa et al., 1990, 1993; Archambault et al., 2001).
In our study, the density and biomass increased near the sewage discharges both at eulittoral
and sublittoral fringe.
The most consistent result was observed on the effects of sewage on the community
composition and structure (Littler and Murray, 1975; Chapman et al., 1995; Fraschetti et al.,
2006; among others), but the method requires taxonomic expertise and it might be difficult to
compare studies due to different sampling designs. At the community level, changes in the
structure of assemblages were observed, with the replacement of sensitive species by tolerant
ones (Archambault et al., 2001; Bishop et al., 2002; Littler and Murray, 1975). Polychaete
assemblages seem to increase their abundances and species richness near sewage discharges,
due to the opportunistic species from families like Capitellidae or Spionidae (Dauer and
Conner, 1980; Elías et al., 2006). Crustaceans and bivalves filter-feeders (e.g. Balanidae,
Mytilidae) have been reported to be more abundant near sewage discharges due to the higher
amount of suspended solids (López-Gappa et al., 1993; Pinedo et al., 2007). However,
amphipods appear to be very sensitive to environmental changes due to the presence of
sewage discharges (Dauvin and Ruellet, 2007). A general decrease in abundance and the
disappearing of sensitive species near sewage discharges is also known for gastropod
assemblages (Atalah and Crowe, 2012; Terlizzi et al., 2005a). In our sampling areas, at the
eulittoral, the abundance of suspension feeders (Chthamalus montagui) increased near sewage
discharges. This feeding type seems to be favoured by the presence of sewage discharges, and
General discussion
99
the natural competition between barnacles and limpets (Patella spp.) becomes unbalanced.
Previous studies have pointed out the tolerance of C. montagui (Borja et al., 2000) and have
associated Patella spp. with high-good status in rocky shores (Díez et al., 2012). At the
sublittoral fringe the community structure changed: sensitive species seem to prefer the
reference areas, while tolerant species dominate this fringe near the sewage discharges.
Finally, the incorporation of secondary production in the biological assessment brought more
information about the ecosystem health. The importance of secondary production to assess the
anthropogenic effects has already been recognized for freshwater systems and estuaries
(Whiles and Wallace, 1995; Woodcock and Huryn, 2007; Faupel et al., 2012; Dolbeth et al.,
2011, 2012), but not yet for rocky shore habitats. Secondary production is a measure of
ecosystem functioning and includes life history characteristics such as body mass,
recruitment, age, life span, taxonomy and trophic status, and population biomass and density
(Cusson and Bourget, 2005). In Peniche shores, the secondary production confirmed that the
presence of sewage discharges benefit suspension feeders (Mytilus galloprovincialis and C.
montagui) and reduced the presence of sensitive species (e.g. Rissoa parva).
On balance, the most consistent response to sewage discharges seems to be the replacement of
sensitive species by tolerant ones as already observed by several authors (Archambault et al.,
2001; Atalah and Crowe, 2012; Bishop et al., 2002; Littler and Murray, 1975; Terlizzi et al.,
2005a). Even though, some feeding types appear to be favoured by the organic and nutrient
enrichment. Nevertheless, the tolerance of each individual species to the changes in the
environmental parameters may be the ultimate justification for the changes in the biological
assemblages.
5.1.2.2 How to measure: destructive versus non-destructive sampling
There are two types of sampling: destructive and non-destructive. In the destructive sampling,
all the organisms are removed from the quadrat. The individuals can be counted, and dry-
weighted to estimate biomass. This method has the advantage of being the most accurate way
to quantify organisms, including the smaller species. But, it has also some disadvantages: it is
time consuming, needs expertise knowledge and disturbs the habitat. In the non-destructive
sampling, such as visual census, the survey is carried out in the field, by estimation of the
percentage cover or number of individuals found in the quadrat. Non-destructive sampling has
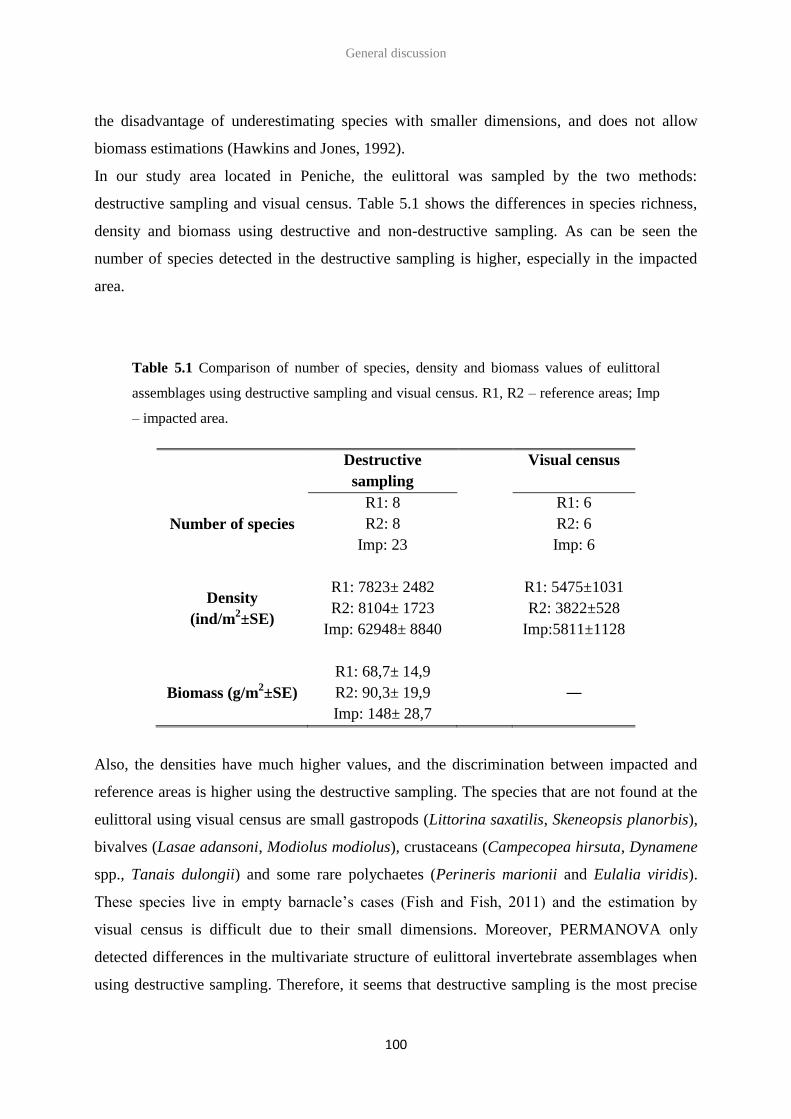
General discussion
100
the disadvantage of underestimating species with smaller dimensions, and does not allow
biomass estimations (Hawkins and Jones, 1992).
In our study area located in Peniche, the eulittoral was sampled by the two methods:
destructive sampling and visual census. Table 5.1 shows the differences in species richness,
density and biomass using destructive and non-destructive sampling. As can be seen the
number of species detected in the destructive sampling is higher, especially in the impacted
area.
Table 5.1 Comparison of number of species, density and biomass values of eulittoral
assemblages using destructive sampling and visual census. R1, R2 – reference areas; Imp
– impacted area.
Destructive
sampling
Visual census
Number of species
R1: 8
R2: 8
Imp: 23
R1: 6
R2: 6
Imp: 6
Density
(ind/m2±SE)
R1: 7823± 2482
R2: 8104± 1723
Imp: 62948± 8840
R1: 5475±1031
R2: 3822±528
Imp:5811±1128
Biomass (g/m2±SE)
R1: 68,7± 14,9
R2: 90,3± 19,9
Imp: 148± 28,7
―
Also, the densities have much higher values, and the discrimination between impacted and
reference areas is higher using the destructive sampling. The species that are not found at the
eulittoral using visual census are small gastropods (Littorina saxatilis, Skeneopsis planorbis),
bivalves (Lasae adansoni, Modiolus modiolus), crustaceans (Campecopea hirsuta, Dynamene
spp., Tanais dulongii) and some rare polychaetes (Perineris marionii and Eulalia viridis).
These species live in empty barnacle’s cases (Fish and Fish, 2011) and the estimation by
visual census is difficult due to their small dimensions. Moreover, PERMANOVA only
detected differences in the multivariate structure of eulittoral invertebrate assemblages when
using destructive sampling. Therefore, it seems that destructive sampling is the most precise
General discussion
101
way of quantifying the community, and thus the most sensible method to detect changes in the
biological patterns due to anthropogenic impacts. Nevertheless, the time spent to sort and
identify all the specimens of all the samples, as well as the expertise knowledge necessary
may not always be available.
How to choose the best sampling method? The decision will depend on several factors. What
is the goal of the work? Are we interest in a rapid assessment or detail knowledge of the
community? How much time and human resources do we have available?
For a detailed knowledge of the community responses it seems necessary to undertake a
destructive sampling, with all species identified to the lowest taxonomic level. Similarly, to
search for cost-effective indicators, a solid choice will be dependent of the amount of
information available. After that first approach, in order to proceed to the monitoring of the
area, the visual census may be the most appropriate method if, saving money and time, could
be able to assess the ecological status of the biological communities. Therefore, beyond a
detailed knowledge of the community, it is essential to find cost-effective indicators that
allow an efficient management of the coastal areas.
5.1.2.3 Where to look: searching for a suitable indicator
Several methods or indices have already been developed to assess the ecological status of
rocky shores being most of them based in macroalgae assemblages (Díez et al., 2012).
Macroalgae communities usually respond with a decrease in the number of species and a
reduction of stratification due to the disappearance of large perennial species, replaced by
opportunistic ones (May, 1985, Soltan et al., 2001, Terlizzi et al., 2002). There are several
quality indices using macroalgae communities, such as, the Ecological Evaluation Index (EEI)
from Greece, the CARLIT from the Mediterranean, the Reduced Species List (RSL) or the
Quality of Rocky Bottoms (CFR) from the Atlantic (Díez et al., 2012). The EEI method is
based on the ecological status group (ESG) of macroalgae, and states that perennial species
(ESG I) dominate in pristine habitats and opportunistic species (ESG II) prevail in impacted
areas (Orfanidis et al., 2001). The CARLIT methodology integrates both cartographic data
and information about the value of communities as indicators of water quality (Ballesteros et
al., 2007). From pristine to impacted areas the communities changed from Cystoseira-
dominated, to Corallina-dominated (intermediated state), to Ulva-dominated (Pinedo et al.,
General discussion
102
2007). The RSL is based on several features of the community structure like species richness,
ecological status groups and percentages of chlorophyta, rhodophyta and opportunistic algae
(Wells et al., 2007). The CFR takes into account the cover and species richness, as well the
presence of opportunistic species (Juanes et al., 2008). Few have attempt to use intertidal
macrofauna (Hiscock et al., 2005), and the existent metric is based on species richness and
number of sensitive and tolerant species. More recently, the simultaneous use of both flora
and fauna lead to the creation of RICQI: Rocky Intertidal Community Quality Index (Díez et
al., 2012) based on indicator species abundances, morphologically complex algae cover,
species richness and faunal cover. The usefulness of these indices is undeniable, but their
application is generally geographically restricted, due to the changes in the community
composition. Therefore, it is necessary an index able to respond to this changes in natural
variability, and still sensible to detect the anthropogenic disturbances.
In this thesis, our goal was not the construction of an index, but a detailed knowledge of the
responses of intertidal macrofauna, and the comparison between several geographical areas, in
order to search for a common pattern that could be used to assess the ecological status of the
rocky shores. In order to achieve this goal eulittoral assemblages from Atlantic (island and
mainland) and Mediterranean shores were compared, searching for similar responses of those
communities to the presence of sewage discharges. The choice of eulittoral assemblages has
already been explained in chapter 4. From all the intertidal levels it seems the best option. At
the littoral fringe the effects of sewage discharges were not detected, and also in sheltered
shores this fringe can be extremely reduced. At the sublittoral fringe the algae composition
differs across bioregions and can only be sampled at spring tides. Even in Portugal, the north
is dominated by large brown algae (such as Laminaria spp., Saccorhiza polyschides) while
the centre and south regions are distinguished by the presence of red algae turf composed by
Corallina spp., Plocamium cartilagineum, among others (Boaventura et al., 2002a).
Moreover, the faunal species are smaller, and live within the algae turfs, which could lead to
difficulties in the species quantification by visual census. The eulittoral is accessible to
sample, and the species present have widespread distributions and are easy to identify at high
taxonomic resolution, which makes these assemblages potential cost-effective indicators of
anthropogenic impacts.
In this study, the effect of sewage discharges on the multivariate structure of eulittoral
assemblages was only detected when the sampling was destructive. The differences between
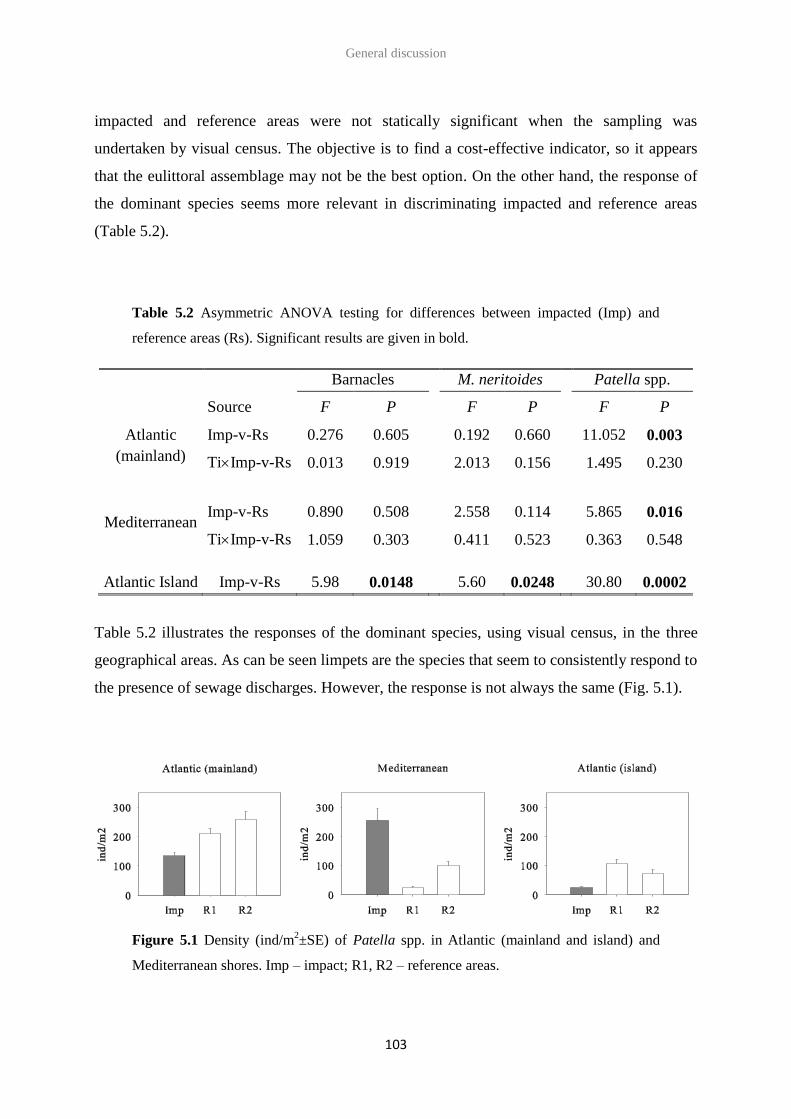
General discussion
103
impacted and reference areas were not statically significant when the sampling was
undertaken by visual census. The objective is to find a cost-effective indicator, so it appears
that the eulittoral assemblage may not be the best option. On the other hand, the response of
the dominant species seems more relevant in discriminating impacted and reference areas
(Table 5.2).
Table 5.2 Asymmetric ANOVA testing for differences between impacted (Imp) and
reference areas (Rs). Significant results are given in bold.
Barnacles M. neritoides Patella spp.
Source F P F P F P
Atlantic
(mainland)
Imp-v-Rs 0.276 0.605 0.192 0.660 11.052 0.003
TiImp-v-Rs 0.013 0.919 2.013 0.156 1.495 0.230
Mediterranean Imp-v-Rs 0.890 0.508 2.558 0.114 5.865 0.016
TiImp-v-Rs 1.059 0.303 0.411 0.523 0.363 0.548
Atlantic Island Imp-v-Rs 5.98 0.0148 5.60 0.0248 30.80 0.0002
Table 5.2 illustrates the responses of the dominant species, using visual census, in the three
geographical areas. As can be seen limpets are the species that seem to consistently respond to
the presence of sewage discharges. However, the response is not always the same (Fig. 5.1).
Figure 5.1 Density (ind/m2±SE) of Patella spp. in Atlantic (mainland and island) and
Mediterranean shores. Imp – impact; R1, R2 – reference areas.
General discussion
104
The possible reasons for these different responses have already been discussed in chapter 4.
The most probable reason is related to the fact that in the different regions was found distinct
limpet species. In the Atlantic shores the dominant species were Patella ulyssiponensis and P.
aspera. In the Atlantic island shores was only found P. candei. And, in the Mediterranean
shores, the dominant species were P. rustica and P. ulyssiponensis. Such species may respond
differently to sewage pollution. The tolerance or sensitiveness of each species could be the
explanation for the patterns observed. Furthermore, and supporting the value of limpets as
indicators of sewage pollution, is the potential of Patella spp. in detecting trace element
contamination.
This thesis suggests that specific taxa, and especially limpets of the genus Patella, may be
more effective in evaluating the environmental status of coastal systems in relation to main
human impacts, such as sewage discharges, without the need of surveying the whole
community which would be more costly and time-consuming. Nevertheless, further research
will be necessary to ascertain their potential utilization as suitable environmental indicators
over large spatial scales.
5.2 Final remarks and future perspectives
The urgency to find efficient indices and indicators to prevent further deterioration of coastal
areas is one of the hot topics in today’s scientific publication. However, a detailed knowledge
of communities’ response to anthropogenic impacts is essential to sustain those indices. This
thesis contributes with important information to understand the response of intertidal
macroinvertebrate assemblages to sewage pollution. The identification of all species to the
lowest taxonomic level possible, and the sampling along all vertical levels, allowed a
comprehensive knowledge of the effects of sewage discharges on macrofauna assemblages
from rocky shores. Furthermore, a first attempt to evaluate and compare the responses of
rocky shore macrofauna assemblages to sewage pollution in different geographical areas was
carried out. Eulittoral assemblages from Atlantic and Mediterranean shores were studied, and
the results seem to suggest that limpets of the genus Patella may be effective in evaluating the
environmental status of coastal systems in relation to human impacts, such as sewage
discharges.
General discussion
105
The knowledge acquire with this thesis brings new questions that should be address in future
research. It would be interesting to promote further studies on areas where the scientific
debate is still open, such as “destructive vs. non-destructive sampling” or “indicator taxon vs.
whole community” approaches. Furthermore, due to our results, it seems important to
continue the effort to find efficient indices or indicators that will assist coastal area
management. The potential utilization of limpets of the genus Patella as indicators of
anthropogenic impacts should be followed. For that, the representativeness must be increase
with further studies in different geographical and ecological scenarios. Moreover, it is
essential to reach a scientific consensus and standardize methodologies and integrate activities
both nationally and internationally. Another challenge is to bring the scientific knowledge to
technicians and politicians, especially because marine biodiversity is not yet a priority to
governments, and even for the general public.
Finally, in the Atlantic island shores, an ecological opportunity has raised to study the
recovery potential of eulittoral assemblages. Although the reference conditions had not yet
been reached after 17 months, a promising recovery of the assemblages near the
decommissioned outfall was evident, especially of limpet and barnacle species. The resilience
of these important habitats may be an incentive to the improvement of the sewage treatment
plants. As a consequence, the priority should be to prevent further deterioration of marine
habitats, in order to continue to benefit from all the products, services al well-being that
coastal areas provide.
“The marine environment is a precious heritage that must be protected, preserved and, where
practicable, restored with the ultimate aim of maintaining biodiversity and providing diverse
and dynamic oceans and seas which are clean, healthy and productive.” (Directive
2008/56/EC)

106
107
References

108
109
References
Adami ML, Tablado A, López-Gappa J (2004) Spatial and temporal variability in intertidal
assemblages dominated by the mussel Brachidontes rodriguezii (d’Orbigny, 1846).
Hydrobiologia 520, 49–59.
ATSDR - Agency for Toxic Substances, Disease Registry (2011) Detailed data for 2011
Priority List of Hazardous Substances. Public Health Service, ATSDR, Division of
Toxicology and Environmental Medicine.
Airoldi L (2003) The effects of sedimentation on rocky coast assemblages. Oceanography and
Marine Biology: an Annual Review 41, 161–236.
Álvarez E, Callejón M, Jiménez Sánchez JS, Ternero Rodríguez M (2002) Heavy metal
extractable forms in sludge from wastewater treatment plants. Chemosphere 47, 765-
775.
Anderson MJ (2001) A new method for non-parametric multivariate analyses of variance.
Austral Ecology 26, 32-46.
Anderson MJ (2004) DISTLM V.2: a FORTRAN Computer Program to Calculate a Distance
Based Multivariate Analysis for a Linear Model. Department of Statistics, University
of Auckland, Auckland. Available at:
http://www.stat.auckland.ac.nz/mja/Programs.htm.
Anderson MJ (2005) PERMANOVA: a FORTRAN Computer Program for Permutational
Multivariate Analysis of Variance. Department of Statistics University of Auckland,
Auckland. Available at: http://www.stat.auckland.ac.nz/mja/Programs.htm.
Anderson MJ, Gorley RN, Clarke KR (2008) PERMANOVA for PRIMER: guide to software
and statistical methods. PRIMER–E Ltd., Plymouth, United Kingdom, 214 pp.
Anger K (1975) On the influence of sewage pollution on inshore benthic communities in the
South Kiel Bay. Part 2. Quantitative studies on community structure. Helgol
Meeresunters 32, 73–148.
Archambault P, Banwell K, Underwood AJ (2001) Temporal variation in the structure of
intertidal assemblages following the removal of sewage. Marine Ecology Progress
Series 222, 51–62.
References
110
Arévalo R, Pinedo S, Ballesteros E (2007) Changes in the composition and structure of
Mediterranean rocky-shore communities following a gradient of nutrient enrichment:
Descriptive study and test of proposed methods to assess water quality regarding macroalgae.
Marine Pollution Bulletin 55, 104-113.
Ashton PH, Richardson BJ (1995) Biological Monitoring of the Marine Ocean Outfall at
Black Rock, Victoria, Australia. Marine Pollution Bulletin 31, 4-12.
Atalah J, Crowe TP (2012) Nutrient enrichment and variation in community structure on
rocky shores: The potential of molluscan assemblages for biomonitoring. Estuarine
Coast and Shelf Science 99, 162-170.
Ballesteros E, Torras X, Pinedo S, García M, Mangialajo L, Torres M (2007) A new
methodology based on littoral community cartography dominated by macroalgae for
the implementation of the European Water Framework Directive. Marine Pollution
Bulletin 55, 172-180.
Barale V (2008) The European marginal and enclosed seas: an overview, in: Remote sensing
of the European seas, 3-22pp.
Baysal A, Ozbek N, Akman S (2013) Determination of trace metals in waste water and their
removal processes. Wastewater-treatment technologies and recent analytical
developments. Prof. Fernando Sebastián García Einschlag (Ed).
Bebianno MJ, Cravo A, Miguel C, Morais S (2003) Metallothionein concentrations in a
population of Patella aspera: variation with size. The Science of the Total
Environment 301, 151-161.
Benedetti-Cecchi L, Maggi E, Bertocci I, Vaselli E, Micheli F, Osio GC, Cinelli F (2003)
Variation in rocky shore assemblages in the north-western Mediterranean: contrasts
between islands and the mainland. Journal of Experimental Marine Biology and
Ecology 293, 193-215.
Benkdad A, Laissaoui A, Tornero MV, Benmansour M, Chakir E, Garrido IM, Moreno JB
(2011) Trace metals and radionuclides in macroalgae from Moroccan coastal waters.
Environmental Monitoring and Assessment 182, 317-324.
Benke AC, Huryn AD (2010) Benthic invertebrate production: facilitating answers to
ecological riddles in freshwater ecosystems. Journal of the North American
Benthological Society 29, 264-285.
References
111
Bermejo-Barrera P, Moreda-Pifieiro J, Moreda-Pifieiro A, Bermejo-Barrera A (1998) Direct
Determination of Arsenic in Sea Water by Electrothermal Atomization Atomic
Absorption Spectrometry using D2 and Zeeman Background Correction.
Mikrochimica Acta 128, 215-22l.
Birchenough SNR, Frid CLJ (2009) Macrobenthic succession following the cessation of
sewage sludge disposal. Journal of Sea Research 62, 258–267.
Bishop MJ, Underwood AJ, Archambault P (2002) Sewage and environmental impacts on
rocky shores: necessity of identifying relevant spatial scales. Marine Ecology Progress
Series 236, 121-128.
Boaventura D, Fonseca LC, Teles-Ferreira C (1999) Trophic structure of macrobenthic
communities on the Portuguese coast. A review of lagoonal, estuarine and rocky
littoral habitats. Acta Oecologica 20, 407-415.
Boaventura D, Ré P, Fonseca LC, Hawkins SJ (2002a) Intertidal rocky shore communities of
the continental Portuguese coast. Comparative analysis of distribution patterns.
Marine Ecology 23(1), 69-90.
Boaventura D, Ré P, Fonseca LC, Hawkins SJ (2002b) Analysis of competitive interactions
between the limpets Patella depressa Pennant and Patella vulgata L. in the northern
coast of Portugal. Journal of Experimental Marine Biology and Ecology 271(2), 171-
188.
Borja A, Franco J, Perez V (2000) A marine biotic index to the establish ecology quality of
soft-bottom benthos within European estuarine coastal environments. Marine
Pollution Bulletin 40, 1100–1114.
Borja A, Dauer DM (2008) Assessing the environmental quality status in estuarine and
coastal systems: comparing methodologies and indices. Ecological indicators 8, 331-
337.
Brey T (2001) Population Dynamics in Benthic Invertebrates. A Virtual Handbook. Version
01.2. Alfred Wegener Institute for Polar and Marine Research, Germany.
Brito GB, Souza TL, Bressy FC, Moura CW, Korn MGA (2012) Levels and spatial
distribution of trace elements in macroalgae species from the Todos os Santos Bay,
Bahia, Brazil. Marine Pollution Bulletin 64, 2238-44.
References
112
Bustamante M, Bevilacqua S, Tajadura J, Terlizzi A, Saiz-Salinas JL (2012) Detecting human
mitigation intervention: effects of sewage treatment upgrade on rocky macrofaunal
assemblages. Marine Environmental Research 8, 27-37.
Cabral-Oliveira J, Maranhão P, Pardal MA (2009) The effect of sewage discharge on
Melarhaphe neritoides (Gastropoda: Littorinidae) population dynamics. Scientia
Marina 73(2), 259-267.
Calcagno JA, López-Gappa J, Tablado A (1998) Population Dynamics of the Barnacle
Balanus amphitrite in an Intertidal Area Affected by Sewage Pollution. Journal of
Crustacean Biology 18, 128-137.
Campanella L, Conti ME, Cubadda F, Sucapane C (2002) Trace metals in seagrass, algae and
molluscs from an uncontaminated area in the Mediterranean. Environmental Pollution
111(1), 117-26.
Chapman MG, Underwood AJ, Skilleter GA (1995) Variability at different spatial scales
between a subtidal assemblage exposed to the discharge of sewage and two control
assemblages. Journal of Experimental Marine Biology and Ecology 189, 103–122.
Chaudhuri A, Mitra M, Havrilla C, Waguespack Y, Schwarz J (2007) Heavy metal
biomonitoring by seaweeds on the Delmarva Peninsula, east coast of the USA.
Botanica Marina 50, 151-158.
Clarke KR, Warwick RM (2001) Change in Marine Communities. An Approach to Statistical
Analysis and Interpretation, second ed. Primer-E, Plymouth.
Clarke KR, Gorley RN (2006) PRIMER V6: User Manual/Tutorial. PRIMER-E, Plymouth.
Costanza R, d’Arge R, de Groot R, Farber S, Grasso M, Hannon B, Limburg K, Naeem S,
O’Neill RV, Paruelo J, Raskin RG, Sutton P, van den Belt M (1997) The value of the
world’s ecosystem services and natural capital. Nature 387, 253-260.
Conti ME, Cecchetti G (2003) A biomonitoring study: trace metals in algae and molluscs
from Tyrrhenian coastal areas. Environmental Research 93, 99-112.
Conti ME, Finoia MG (2010) Metals in molluscs and algae: a north-south Tyrrhenian Sea
baseline. Journal of Hazardous Materials 181(1-3), 388-92.
Cravo A, Bebianno MJ, Foster P (2004) Partitioning of trace metals between soft tissues and
shells of Patella aspera. Environment International 30(1), 87-98.
References
113
Cravo A, Bebianno MJ (2005) Bioaccumulation of metals in the soft tissue of Patella aspera:
Application of metal/shell weight indices. Estuarine, Coastal and Shelf Science 65,
571-586.
Crothers J (2012) Snails on rocky sea shores. Naturalists’ Handbooks 30. Pelagic Publishing,
Exeter. 97pp.
Crowe TP, Thompson RC, Bray S, Hawkins SJ (2000) Impacts of anthropogenic stress on
rocky intertidal communities. Journal of Aquatic Ecosystem Stress and Recovery 7,
273-297.
Cubadda F, Conti ME, Campanella L (2001) Size- dependent concentrations of trace metals in
four Mediterranean gastropods. Chemosphere 45, 561-569.
Cusson M, Bourget E (2005) Global patterns of macroinvertebrate production in marine
benthic habitats. Marine Ecology Progress Series 297, 1–14.
Dauer DM, Conner WG (1980) Effects of moderate sewage input on benthic polychaeta
populations. Estuarine and Coastal Marine Science 10(3), 335-346.
Dauvin JC, Ruellet T (2007) Polychaete/amphipod ratio revisited. Marine Pollution Bulletin
55, 215-224.
Dauvin JC, Bellan G, Bellan-Santini D (2010) Benthic indicators: From subjectivity to
objectivity – Where is the line? Marine Pollution Bulletin 60, 947–953.
De Groot R, Brander L, van der Ploeg S, Costanza R, Bernard F, Braat L, Christie M,
Crossman N, Ghermandi A, Hein L, Hussain S, Kumar P, McVittie A, Portela R,
Rodriguez LC, ten Brink P, van Beukering P (2012) Global estimates of the value of
ecosystems and their services in monetary units. Ecosystem Services 1, 50–61.
Della-Santina P, Sonni C, Sartoni G, Chelazzi G (1993) Food availability and diet
composition of three coexisting Mediterranean limpets (Patella spp.). Marine Biology
116, 87-95.
De-la-Ossa-Carretero JA, Del-Pilar-Ruso Y, Giménez-Casalduero F, Sánchez-Lizaso JL
(2010) Sensitivity of tanaid Apseudes latreillei (Milne-Edwards) populations to
sewage pollution. Marine Environmental Research 69, 309–317.
Dethier MN, Graham ES, Cohen S, Tear LM (1993) Visual versus random-point percent
cover estimations: ‘objective’ is not always better. Marine Ecology - Progress Series
96, 93-100.
References
114
Díaz G, Galindo L, Garcia-Montelongo F, Larrechi MS, Ruis X (1992) Trace metals in
limpets (Patella sp.) from the coast of Santa Cruz de Tenerife (Canary Islands).
Bulletin of Environmental Contamination and Toxicology 48, 55-62.
Díez I, Santolaria A, Gorostiaga JM (2003) The relationship of environmental factors to the
structure and distribution of subtidal seaweed vegetation of the western Basque coast
(N Spain). Estuarine, Coastal and Shelf Science 56, 1041-1054.
Díez I, Bustamante M, Santolaria A, Tajadura J, Muguerza N, Borja A, Muxika I, Saiz-
Salinas JI, Gorostiaga JM (2012) Development of a tool for assessing the ecological
quality status of intertidal coastal rocky assemblages, within Atlantic Iberian coasts.
Ecological Indicators 12, 58-71.
Dolbeth M, Pardal MA, Lillebø AI, Azeiteiro UM, Marques JC (2003) Short- and long-term
effects of eutrophication on the secondary production of an intertidal macrobenthic
community. Marine Biology 143, 1229–1238.
Dolbeth M, Cardoso PG, Grilo TF, Bordalo MD, Raffaelli D, Pardal MA (2011) Long-term
changes in the production of estuarine macrobenthos affected by multiple stressors.
Estuarine Coastal and Shelf Science 92, 10–18.
Dolbeth M, Cusson M, Sousa R, Pardal MA (2012) Secondary production as a tool for better
understanding of aquatic ecosystems. Canadian Bulletin of Fisheries and Aquatic
Sciences 69, 1230 - 1253.
Duarte CA, Giarratano E, Gil MN (2012) Trace metal content in sediments and autochthonous
intertidal organisms from two adjacent bays near Ushuaia, Beagle Channel
(Argentina). Marine Environmental Research, 79, 55-62.
Elías R, Rivero MS, Palacios JR, Vallarino EA (2006) Sewage-induced disturbance on
Polychaetes inhabiting intertidal mussel beds of Brachidontes rodriguezii off Mar del
Plata (Southwestern Atlantic, Argentina). Scientia Marina 70 (3), 187-196.
Elías R, Rivero MS, Sanchez MA, Jaubet L. Vallarino EA (2009) Do treatments of sewage
plants really work? The intertidal mussels' community of the southwestern Atlantic
shore (38ºS, 57ºW) as a case study. Revista de Biología Marina y Oceanografía 44,
357-368.
Elliott M, Quintino V (2007) The estuarine quality paradox, environmental homeostasis and
the difficulty of detecting anthropogenic stress in naturally stressed areas. Marine
Pollution Bulletin 54, 640-645.
References
115
ESS (Environmental Sciences Section), Inorganic Chemistry Unit, Wisconsin State Lab of
Hygiene (1993) ESS Method 340.2: Total Suspended Solids, Mass Balance (Dried at
103–105 °C) Volatile Suspended Solids (Ignited at 550 °C). Wisconsin State Lab of
Hygiene, Madison, USA.
Espinosa F, Guerra-García JM, García-Gómez JC (2007) Sewage pollution and extinction
risk: an endangered limpet as a bioindicator? Biodiversity & Conservation 16, 377-
397.
Fairweather PG (1990) Sewage and the biota on seashores: assessment of impact in relation to
natural variability. Environmental Monitoring and Assessment 14, 197–210.
Fano EA, Mistri M, Rossi R (2003) The ecofunctional quality index (EQI): a new tool for
assessing lagoonal ecosystem impairment. Estuarine, Coastal and Shelf Science 56,
709-716.
Faupel M, Ristau K, Traunspurger W (2012) The functional response of a freshwater benthic
community to cadmium pollution. Environmental Pollution 162, 104-9.
Ferskvandsbiologisk Laboratorium (1985) Limnologisk Metodik. Kobenhawns Universitet
(ed.), Akademisk Forlag, København.
Fish JD, Fish S (2001) A Student's Guide to the Seashore, third ed. Cambridge University
Press, London.
Fraschetti S, Gambi C, Giangrande A, Musco L, Terlizzi A, Danovaro R (2006) Structural
and functional response of meiofauna rocky assemblages to sewage pollution. Marine
Pollution Bulletin 52, 540-548.
Garaffo GV, Jaubet ML, Sánchez M, Rivero MS, Vallarino EA, Elías R (2012) Sewage-
induced polychaetes reefs in a SW Atlantic shore: rapid response to small-scale
disturbance. Marine Ecology 33, 272-279.
Giannuzzi-Savelli R, Pusateri F, Palmeri A, Ebreo C (1994) Atlante delle conchiglie marine
del Mediterraneo. Vol 1: Archaeogastropoda, La Conchiglia, Roma, 125pp.
Gili JM, Coma R (1998) Benthic suspension feeders: their paramount role in littoral marine
food webs. Trends in Ecology and Evolution 13, 316–321.
Glasby TM (1997) Analysing data from post-impact studies using asymmetrical analyses of
variance: a case study of epibiota on marinas. Australian Journal of Ecology 22, 448-
459.
References
116
Guerra-García JM, Ruiz-Tabares A, Baeza-Rojano E, Cabezas MP, Díaz-Pavón JJ, Pacios I,
Maestre M, González AR, Espinosa F, García-Gómez JC (2010) Trace metals in
Caprella (Crustacea: Amphipoda). A new tool for monitoring pollution in coastal
areas? Ecological Indicators 10, 734–743.
Halpern BS, Walbridge S, Selkoe KA, Kappel CV, Micheli F, D'Agrosa C, Bruno JF, Casey
KS, Ebert C, Fox HE, Fujita R, Heinemann D, Lenihan HS, Madin EMP, Perry MT,
Selig ER, Spalding M, Steneck R, Watson R (2008) A Global Map of Human Impact
on Marine Ecosystems. Science 319, 948-952.
Hawkins SJ, Jones HD (1992) Marine Field Course Guide 1: Rocky Shore, Marine
Conservation Society.
Hiscock K, Smith A, Jenkins S, Sewell J, Hawkins S (2005) Development of a hard
substratum Benthic invertebrate Water Framework Directive compliant classification
tool. Report to the Environment Agency and the Joint Nature Conservation Committee
from the Marine Biological Association. Plymouth: Marine Biological Association.
41pp.
Jaubet ML, Sánchez MA, Rivero MS, Garaffo GV, Vallarino EA, Elías R (2011) Sewage-
induced biogenic reefs build by indicator polychaete in intertidal areas of the SW
Atlantic. Marine Ecology – An Evolutionary Perspective 32 (2), 188-197.
Johnston EL, Roberts DA (2009) Contaminants reduce the richness and evenness of marine
communities: a review and meta-analysis. Environmental Pollution 157, 1745-52.
Juanes JA, Guinda X, Puente A, Revilla JA (2008) Macroalgae, a suitable indicator of the
ecological status of coastal rocky communities in the NE Atlantic. Ecological
Indicators 8, 351-359.
Kalkan E, Karhan SU, Mutlu E, Simboura N, Bekbölet M (2007) Application of the bentix
index in assessing ecological quality of hard substrata: a case study from the
Bosphorus Strait, Turkey. The Mediterranean Marine Science 8, 15-29.
Klarić S, Pavičić-Hamer D, Lucu Č (2004) Seasonal variations of arsenic in mussels Mytilus
galloprovincialis. Helgoland Marine Research 58(3), 216-220.
Kennish MJ (1997) Practical Handbook of Estuarine and Marine Pollution. CRC Press,
524pp.
Klein A, Zhai X (2002) The Effect of Sewage Discharge on Intertidal Community Structure.
Chinese Journal of Oceanology and Limnology 2, 124-137.
References
117
Lewis JR (1964) The ecology of rocky shores. London, English University Press.
Liquete C, Zulian G, Delgado I, Stips A, Maes J (2013) Assessment of coastal protection as
an ecosystem service in Europe. Ecological Indicators 30, 205–217.
Littler MM, Murray SN (1975) Impact of sewage on the distribution, abundance and
community structure of rocky intertidal macro-organisms. Marine Biology 30, 277–
291.
Little C, Williams GA, Trowbridge CD (2010) The Biology of Rocky Shores (2nd ed) Oxford
University Press.
Llorrent-Mirandes T, Ruiz-Chancho MJ, Barbero M, Rubio R, López-Sánchez JF (2010)
Measurement of arsenic compounds in littoral zone algae from the Western Sea.
Occurrence of arsenobetaine. Chemosphere 81, 867–875.
López-Gappa JJ, Tablado A, Magaldi NH (1990) Influence of sewage pollution on a rocky
intertidal community dominated by the mytilid Brachidontes rodriguezi. Marine
Ecology Progress Series 63, 163-175.
López-Gappa JJ, Tablado A, Magaldi NH (1993) Seasonal changes in an intertidal
community affected by sewage pollution. Environmental Pollution 82, 157–165.
Lüning K (1990) Seaweeds. Their environment, biogeography and ecophysiology. Wiley,
New York.
Maceda-Veiga A, Monroy M, Navarro E, Viscor G, Sostoa A (2013) Metal concentrations
and pathological responses of wild native fish exposed to sewage discharge in a
Mediterranean river. Science of the Total Environment 449, 9-19.
Magurran A, McGill BJ (2010) Biological diversity: frontiers in measurement and
assessment. Oxford University Press, Oxford.
Maher WA, Clarke SM (1984) The Occurrence of Arsenic in Selected Marine Macroalgae
from Two Coastal Areas of South Australia. Marine Pollution Bulletin 25,111-112.
Martins GM, Thompson RC, Hawkins SJ, Neto AI, Jenkins SR (2008) Rocky intertidal
community structure in oceanic islands: scales of spatial variability. Marine Ecology
Progress Series 356, 15-24.
Martins GM, Amaral AF, Wallenstein FM, Neto AI (2009) Influence of a breakwater on
nearby rocky intertidal community structure. Marine Environmental Research 67, 237-
245.
References
118
May V (1985) Observations on algal floras close to two sewage outlets. Cunninghamia 1,
385-394.
Mayer-Pinto M, Underwood AJ, Tolhurst T, Coleman RA (2010) Effects of metals on aquatic
assemblages: What do we really know? Journal of Experimental Marine Biology and
Ecology 391, 1–9.
McKinney ML, Schoch RM (1998) Environmental Science – Systems and solutions. Jones
and Bartlett Publishers, 639 pp.
Mieiro CL, Coelho JP, Pacheco MP, Duarte AC, Pereira ME (2012) Trace elements in two
marine fish species during estuarine residency: Non-essential versus essential. Marine
Pollution Bulletin 64, 2844-2848.
Morton B, Britton JC, Frias Martins AM (1998). Ecologia Costeira dos Açores. Sociedade
Afonso Chaves, São Miguel, Açores, Portugal.
Nicolaidou A, Nott JA (1990) Mediterranean pollution from a ferro-nickel smelter:
differential uptake of metals by some gastropods. Marine Pollution Bulletin 21, 137-
143.
Nixon SW, Buckley BA (2002) “A strikingly rich zone”—nutrient enrichment and secondary
production in coastal marine ecosystems. Estuaries 25, 782–96.
Nybakken JW, Bertness MD (2005) Marine Biology. An ecological approach. 6th ed. Pearson
Education, San Francisco, CA, USA, 579 pp.
O’Connor NE (2013) Impacts of sewage outfalls on rocky shores: incorporating scale, biotic
assemblage structure and variability into monitoring tools. Ecological Indicators 29,
501–509.
Official Journal of the European Communities (2006) L364, Commission Regulation (EC)
No. 1881/2006 of 19 December 2006. Setting Maximum Levels for Certain
Contaminants in Foodstuffs.
O’Leary C, Breen J (1997). Metal level in seven species of mollusc and in seaweeds from the
Shannon Estuary: Biology and environment: Proceeding of the Royal Irish Academy
97, 121–132.
Orfanidis S, Panayotidis P, Stamatis N (2001) Ecological evaluation of transitional and
coastal waters: a marine benthic macrophytes based model. Mediterranean Marine
Science 2(2), 45–65.
References
119
Pearson TH, Rosenberg R (1978) Macrobenthic succession in relation to organic enrichment
and pollution of the marine environment. Oceanography and Marine Biology: Annual
Review 16, 229–311.
Pinedo S, García M, Satta MP, De Torres M, Ballesteros E (2007) Rocky-shore communities
as indicators of water quality: a case study in the Northwestern Mediterranean. Marine
Pollution Bulletin 55, 126-135.
Pinet PR (1999) Invitation to Oceanography. 2nd edition. Jones and Bartlett Publishers. 556
pp.
Pinto R, de Jonge VN, Neto JM, Domingos T, Marques JC, Patrício J (2013) Towards a
DPSIR driven integration of ecological value, water uses and ecosystem services for
estuarine systems. Ocean and Coastal Management 72, 64-79.
Rainbow PS (1995) Biomonitoring of heavy metal availability in the marine environment.
Marine Pollution Bulletin 31, 183–192.
Raffaelli D, Hawkins S (1996) Intertidal ecology Chapman & Hall, London.
Rahman MA, hasegawa H, Lim RP (2012) Bioaccumulation, biotransformation and trophic
transfer of arsenic in the aquatic food chain. Environmental Research 116, 118–135.
Riley K (2002) Chthamalus montagui. Montagu's stellate barnacle. Marine Life Information
Network: Biology and Sensitivity Key Information Sub-programme [on-line].
Plymouth: Marine Biological Association of the United Kingdom. [cited 12/11/2012].
Available from: http://www.marlin.ac.uk/speciesbenchmarks.php?speciesID=2981.
Roberts DE (1996) Effects of the north head deep-water sewage outfall on nearshore coastal
reef macrobenthic assemblages. Marine Pollution Bulletin 33, 303-308.
Roberts DE, Smith A, Ajani P, Davis AR (1998) Rapid changes in encrusting marine
assemblages exposed to anthropogenic point source pollution: a ‘Beyond BACI’
approach. Marine Ecology Progress Series 163, 213-224.
Roberts DE, Scanes PR (1999) Spatial patterns in the macrobenthic assemblages inhabiting
kelp (Ecklonia radiata) forests exposed to sewage effluent. Australasian Journal of
Ecotoxicology 5, 89–102.
Rodriguez-Figueroa GM, Shumilin E, Sánchez-Rodríguez I (2009) Heavy metal pollution
monitoring using the brown seaweed Padina durvillaei in the coastal zone of the Santa
Rosalía mining region, Baja California Peninsula, Mexico. Journal of Applied
Phycology 21, 19–26
References
120
Rogers KM (2003) Stable carbon and nitrogen isotope signatures indicate recovery of marine
biota from sewage pollution at Moa Point, New Zealand. Marine Pollution Bulletin
46, 821-827.
Seghezzo L, Zeeman G, Lier JB, Hamelers HVM, Lettinga G (1998) The anaerobic treatment
of sewage in UASB and EGSB reactors: a review. Bioresource Technology 65, 175-
190.
Silva A, Boaventura D, Ré P (2003) Population structure, recruitment and distribution
patterns of Patella depressa (Pennant, 1777) on the central Portuguese coast. Boletin
del Instituto Español de Oceanografia 19, 461-471.
Simboura N, Zenetos A (2002) Benthic indicators to use in ecological quality classification of
Mediterranean soft bottom marine ecosystems, including a new biotic index.
Mediterranean Marine Science 3, 77-111.
Simunovic A (1970) Recherches écologiques sur les peuplements faunistiques de l'étage
supralittoral des côtes rocheuses de l'Adriatique moyenne. Acta adriatica 14, 3-39.
Singer GA, Battin TJ (2007) Anthropogenic subsidies alter stream consumer–resource
stoichiometry, biodiversity, and food chains. Ecological Applications 17(2), 376–389.
Slejkovec Z, Kápolna E, Ipolyi I, Elteren JT (2006) Arsenosugars and other arsenic
compounds in littoral zone algae from the Adriatic Sea. Chemosphere 63, 1098-1105.
Smith AH, Archibald M, Bailey T, Bouchon C, Brathwaite A, Comacho R, George S, Guiste
H, Hastings M, James P, Jeffrey-Appleton C, Meyer KD, Miller A, Nurse L, Petrovic
C, Phillip P (2000) Status of Coral Reefs in the Eastern Caribbean: The OECS,
Trinidad and Tobago, Barbados, The Netherlands Antilles and The French Caribbean.
In: Wilkinson, C. (ed.). Status of Coral Reefs of the World: 2000. Australian Institute
for Marine Science, Australia, 315-330pp.
Soltan D, Verlaque M, Boudouresque CF, Francour P (2001) Changes in macroalgal
communities in the vicinity of the Mediterranean sewage outfall after the setting up of
a treatment plant. Marine Pollution Bulletin 42, 59–70.
Strickland JDH, Parsons TR (1972) A practical handbook of seawater analysis, second ed.
Bulletin of the Fisheries Research Board of Canada 167, 1-311.
Szefer P, Frelek K, Szefer K, Lee CB, Kim BS, Warzocha J, Zdrojewska I, Ciesielski T
(2002) Distribution and relationships of trace metals in soft tissue, byssus and shells
References
121
of Mytilus edulis trossulus from the southern Baltic. Environmental Pollution 120,
423-444.
Tablado A, López-Gappa JJ (2001) Morphometric diversity of the pulmonate limpet
Siphonaria lessoni in different coastal environments. Scientia Marina 65(1), 33-41.
Teixeira H, Borja A, Weisberg SB, Ranasinghe JA, Cadien DB, Dauer DM, Dauvin J,
Degraer S, Diaz RJ, Grémare A, Karakassis I, Llansó RJ, Lovell LL, Marques JC,
Montagne DE, Occhipinti-Ambrogi A, Rosenberg R, Sardá R, Schaffner LC, Velarde
RG (2010) Assessing Coastal Benthic Macrofauna Community Condition Using Best
Professional Judgement - developing consensus across North America and Europe.
Marine Pollution Bulletin 60, 589-600.
ter Braak CJF, Šmilauer P (1998) CANOCO Reference Manual and User's Guide to Canoco
for Windows: Software for Canonical Community Ordination version 4).
Microcomputer Power (Ithaca, NY USA) 352pp.
Terlizzi A, Fraschetti S, Guidetti P, Boero F (2002) The effects of sewage discharge on
shallow hard bottom sessile assemblage. Marine Pollution Bulletin 44, 542–548.
Terlizzi A, Scuderi D, Fraschetti S, Anderson MJ (2005a) Quantifying effects of pollution on
biodiversity: a case study of highly diverse molluscan assemblages in the
Mediterranean. Marine Biology 148, 293-305.
Terlizzi A, Benedetti-Cecchi L, Bevilacqua S, Fraschetti S, Guidetti P, Anderson MJ (2005b)
Multivariate and univariate asymmetrical analyses in environmental impact
assessment: a case study of Mediterranean subtidal hard substrate sessile assemblages.
Marine Ecology Progress Series 289, 27-42.
Underwood AJ (1991) Beyond BACI: experimental designs for detecting human
environmental impacts on temporal variations in natural populations. Australian
Journal of Marine & Freshwater Research 42, 569-587.
Underwood AJ (1994) On Beyond BACI: sampling designs that might reliably detect
environmental disturbances. Ecological Applications 4, 3-15.
Underwood AJ, Chapman MG (1996) Subtidal assemblages on rocky reef at cliffface sewage
outfall (north Head, Sydney, Australia): what happened when the outfall was turned
off? Marine Pollution Bulletin 33, 293-302.
Vallarino EA, Rivero MS, Gravina MC, Elías R (2002) The community-level response to
sewage impact in intertidal mytilid beds of the Southwestern Atlantic, and the use of
References
122
the Shannon index to assess pollution. Revista de Biología Marina y Oceanografía
37(1), 25 - 33
Vallarino EA, Elías R (2006) High-diverse lowly variable sewage-impacted community, low-
diverse highly variable natural community: The paradox of the intertidal mussel beds
of temperates areas of the SW Atlantic. Current Trends in Ecology 1, 77-91.
Wallenstein FM, Neto AI (2006) Intertidal rocky shore biotopes of the Azores: a quantitative
approach. Helgoland Marine Research 60(3), 196-206.
Warwick RM, Clarke KR (1993) Increased variability as a symptom of stress in marine
communities. Journal of Experimental Marine Biology and Ecology 172, 215-226.
Wells E, Wilkinson M, Wood P, Scanlan C (2007) The use of macroalgal species richness and
composition on intertidal rocky seashores in the assessment of ecological quality
under the European Water Framework Directive. Marine Pollution Bulletin 55, 151-
161.
Whiles MR, Wallace JB (1995) Macroinvertebrate production in a headwater stream during
recovery from anthropogenic disturbance and hydrologic extremes. Canadian Bulletin
of Fisheries and Aquatic Sciences 52, 2402–2422.
Whomersley P, Huxham M, Bolam SG, Schratzberger M, Augley J, Ridland D (2010)
Response of intertidal macrofauna to multiple disturbance types and intensities – an
experimental approach. Marine Environmental Research 69, 297–308.
WHO – World Health Organization (2010) Exposure to arsenic: A major public health
concern. World Health Organisation, Geneva.
Woodcock TS, Huryn AD (2007) The response of macroinvertebrate production to a pollution
gradient in a headwater stream. Freshwater Biology 52, 177–196.
Zar JH (1996) Biostatistical analysis. Third editions Prentice-Hall International Editions, New
Jersey.
123
Appendix

124
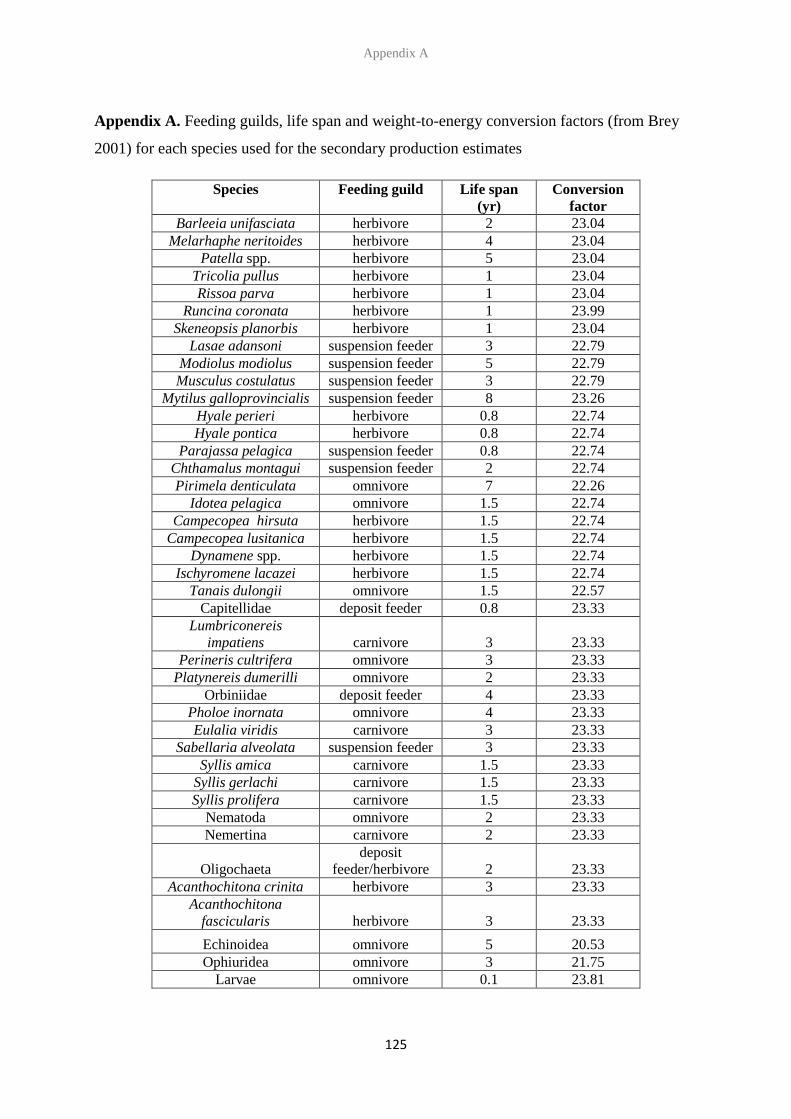
Appendix A
125
Appendix A. Feeding guilds, life span and weight-to-energy conversion factors (from Brey
2001) for each species used for the secondary production estimates
Species Feeding guild Life span
(yr)
Conversion
factor
Barleeia unifasciata herbivore 2 23.04
Melarhaphe neritoides herbivore 4 23.04
Patella spp. herbivore 5 23.04
Tricolia pullus herbivore 1 23.04
Rissoa parva herbivore 1 23.04
Runcina coronata herbivore 1 23.99
Skeneopsis planorbis herbivore 1 23.04
Lasae adansoni suspension feeder 3 22.79
Modiolus modiolus suspension feeder 5 22.79
Musculus costulatus suspension feeder 3 22.79
Mytilus galloprovincialis suspension feeder 8 23.26
Hyale perieri herbivore 0.8 22.74
Hyale pontica herbivore 0.8 22.74
Parajassa pelagica suspension feeder 0.8 22.74
Chthamalus montagui suspension feeder 2 22.74
Pirimela denticulata omnivore 7 22.26
Idotea pelagica omnivore 1.5 22.74
Campecopea hirsuta herbivore 1.5 22.74
Campecopea lusitanica herbivore 1.5 22.74
Dynamene spp. herbivore 1.5 22.74
Ischyromene lacazei herbivore 1.5 22.74
Tanais dulongii omnivore 1.5 22.57
Capitellidae deposit feeder 0.8 23.33
Lumbriconereis
impatiens carnivore 3 23.33
Perineris cultrifera omnivore 3 23.33
Platynereis dumerilli omnivore 2 23.33
Orbiniidae deposit feeder 4 23.33
Pholoe inornata omnivore 4 23.33
Eulalia viridis carnivore 3 23.33
Sabellaria alveolata suspension feeder 3 23.33
Syllis amica carnivore 1.5 23.33
Syllis gerlachi carnivore 1.5 23.33
Syllis prolifera carnivore 1.5 23.33
Nematoda omnivore 2 23.33
Nemertina carnivore 2 23.33
Oligochaeta
deposit
feeder/herbivore 2 23.33
Acanthochitona crinita herbivore 3 23.33
Acanthochitona
fascicularis herbivore 3 23.33
Echinoidea omnivore 5 20.53
Ophiuridea omnivore 3 21.75
Larvae omnivore 0.1 23.81

126