Image Quality Image Contrast - AAPM: The American …€¦ · · 2004-07-23Image Quality •...
13
Optimizing MRI Protocols 7/27/2004 G.D. Clarke, AAPM 2004 1 Optimizing MRI Protocols (SNR, CNR, Spatial Accuracy) Geoffrey D. Clarke, Ph.D. University of TX Health Science Center San Antonio, TX Overview • Parameters Affecting Image Quality • Manipulating Image Contrast (Standard) • Classifications of Pulse Sequences • Relationships Between Resolution & SNR • MR Image Speed • Manipulating Image Contrast (Advanced) Image Quality • Image Contrast • Image Resolution • Signal-to-Noise Ratio • Imaging Speed Image Contrast • Basic image contrast is effected by the amplitude and timing of the RF pulses used to excite the spin system. • More advanced methods may use gradient pulses (to modulate motion) and alter tissue properties with exogenous contrast agents Intrinsic (Tissue) Parameters • Tissue Water Density (Proton Density) • Longitudinal Relaxation Time (T1) – Magnetization transfer rate coefficients • Transverse Relaxation Time (T2) • Chemical Shift (water vs. fat) • Tissue Motion – Macroscopic (flowing blood) – Microscopic (apparent diffusion coefficient) • Tissue Susceptibility (air, fat, bone, blood) Extrinsic (Selectable) Parameters • Magnetic Field Strength • RF Pulse timing – Excitation pulse repetition time (TR) – Time to echo (TE) & inter-echo spacing (T ie ) – Inversion time (TI) • RF pulse amplitude (flip angles) • Gradient Amplitude & Timing – b-value • RF pulse excitation frequency & bandwidth • Receiver bandwidth
-
Upload
duongnguyet -
Category
Documents
-
view
215 -
download
0
Transcript of Image Quality Image Contrast - AAPM: The American …€¦ · · 2004-07-23Image Quality •...
Optimizing MRI Protocols 7/27/2004
G.D. Clarke, AAPM 2004 1
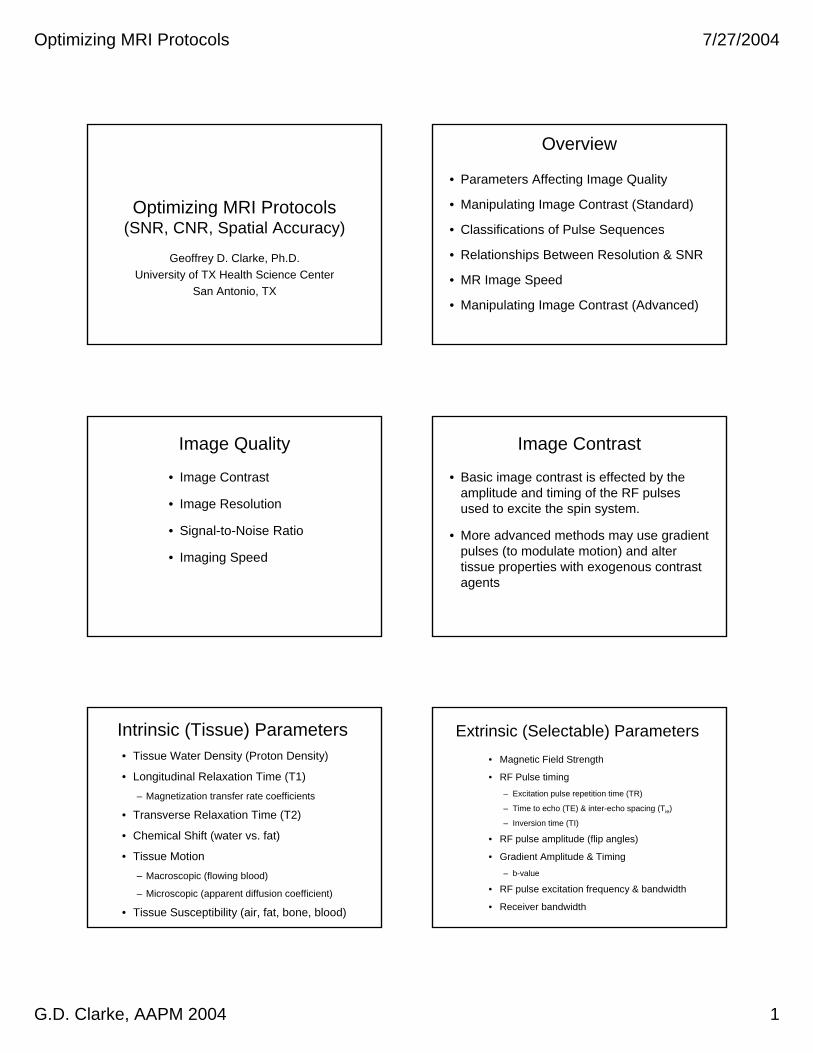
Optimizing MRI Protocols(SNR, CNR, Spatial Accuracy)
Geoffrey D. Clarke, Ph.D.University of TX Health Science Center
San Antonio, TX
Overview
• Parameters Affecting Image Quality
• Manipulating Image Contrast (Standard)
• Classifications of Pulse Sequences
• Relationships Between Resolution & SNR
• MR Image Speed
• Manipulating Image Contrast (Advanced)
Image Quality
• Image Contrast
• Image Resolution
• Signal-to-Noise Ratio
• Imaging Speed
Image Contrast
• Basic image contrast is effected by the amplitude and timing of the RF pulses used to excite the spin system.
• More advanced methods may use gradient pulses (to modulate motion) and alter tissue properties with exogenous contrast agents
Intrinsic (Tissue) Parameters• Tissue Water Density (Proton Density)
• Longitudinal Relaxation Time (T1)– Magnetization transfer rate coefficients
• Transverse Relaxation Time (T2)
• Chemical Shift (water vs. fat)
• Tissue Motion – Macroscopic (flowing blood)
– Microscopic (apparent diffusion coefficient)
• Tissue Susceptibility (air, fat, bone, blood)
Extrinsic (Selectable) Parameters• Magnetic Field Strength
• RF Pulse timing– Excitation pulse repetition time (TR)
– Time to echo (TE) & inter-echo spacing (Tie)
– Inversion time (TI)
• RF pulse amplitude (flip angles)
• Gradient Amplitude & Timing– b-value
• RF pulse excitation frequency & bandwidth
• Receiver bandwidth
Optimizing MRI Protocols 7/27/2004
G.D. Clarke, AAPM 2004 2
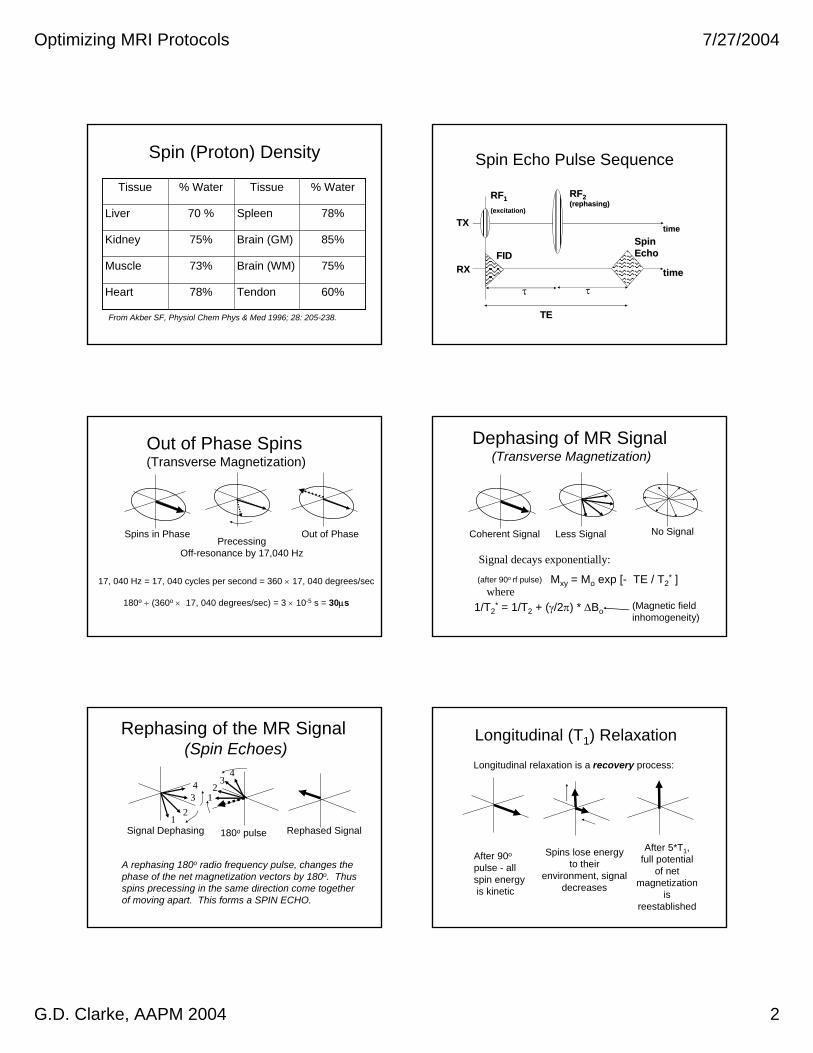
Spin (Proton) Density
From Akber SF, Physiol Chem Phys & Med 1996; 28: 205-238.
60%Tendon78%Heart
75%Brain (WM)73%Muscle
85%Brain (GM)75%Kidney
78%Spleen70 %Liver
% WaterTissue% WaterTissue
ττ
Spin Echo Pulse Sequence
RFRF11
(excitation)(excitation)
TXTX
RXRX
RFRF22((rephasingrephasing))
timetime
timetime
SpinSpinEchoEchoFIDFID
TETE
Out of Phase Spins(Transverse Magnetization)
Spins in Phase Out of PhasePrecessing
Off-resonance by 17,040 Hz
17, 040 Hz = 17, 040 cycles per second = 360 × 17, 040 degrees/sec
180o ÷ (360o × 17, 040 degrees/sec) = 3 × 10⁻⁵ s = 30µs
Dephasing of MR Signal(Transverse Magnetization)
Signal decays exponentially:
Mxy = Mo exp [ - TE / T2* ](after 90o rf pulse)
where1/T2
* = 1/T2 + (γ/2π) * ∆Bo (Magnetic field inhomogeneity)
Coherent Signal Less Signal No Signal
Rephasing of the MR Signal(Spin Echoes)
Signal Dephasing1
234
12
34
180o pulse Rephased Signal
A rephasing 180o radio frequency pulse, changes the phase of the net magnetization vectors by 180o. Thusspins precessing in the same direction come together of moving apart. This forms a SPIN ECHO.
After 90o
pulse - all spin energyis kinetic
Spins lose energyto their
environment, signaldecreases
After 5*T1,full potential
of net magnetization
isreestablished
Longitudinal (T1) Relaxation
Longitudinal relaxation is a recovery process:
Optimizing MRI Protocols 7/27/2004
G.D. Clarke, AAPM 2004 3
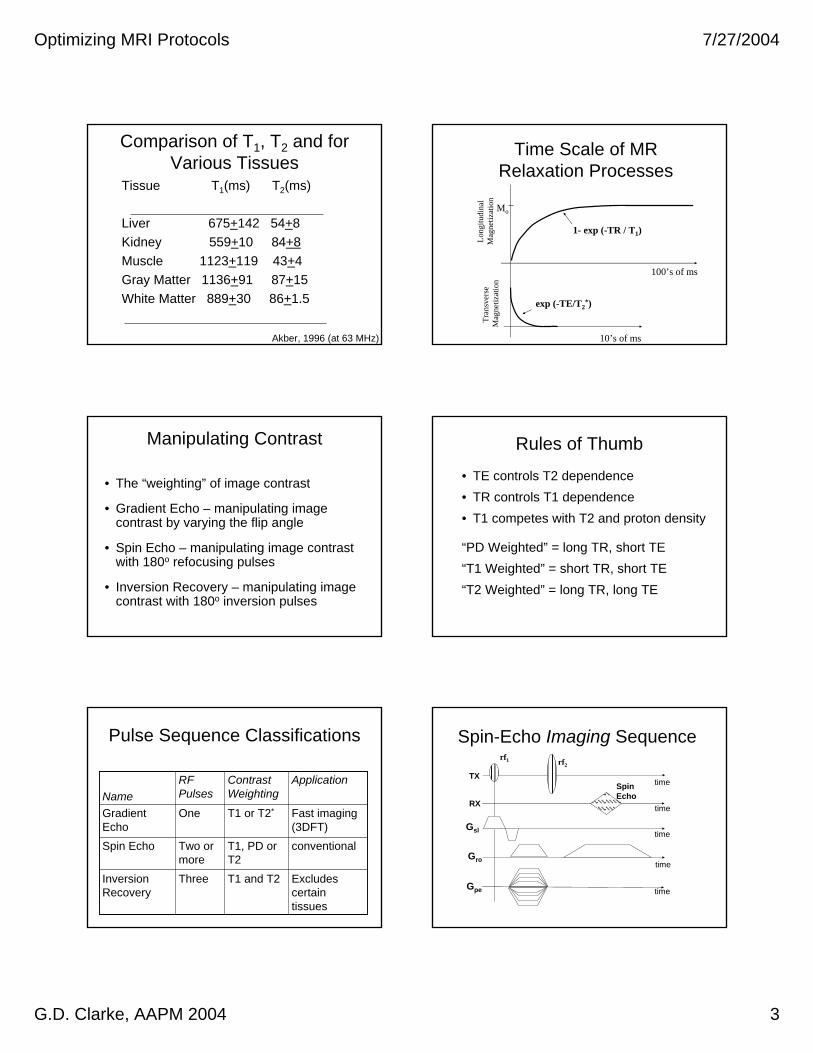
Comparison of T1, T2 and for Various Tissues
Tissue T1(ms) T2(ms)
Liver 675+142 54+8 Kidney 559+10 84+8Muscle 1123+119 43+4Gray Matter 1136+91 87+15White Matter 889+30 86+1.5
Akber, 1996 (at 63 MHz)
Time Scale of MR Relaxation Processes
Lon g
itudi
n al
Ma g
netiz
a tio
nTr
a nsv
erse
M
a gne
tiza t
ion
exp (-TE/T2*)
Mo
1- exp (-TR / T1)
100’s of ms
10’s of ms
Manipulating Contrast
• The “weighting” of image contrast
• Gradient Echo – manipulating image contrast by varying the flip angle
• Spin Echo – manipulating image contrast with 180o refocusing pulses
• Inversion Recovery – manipulating image contrast with 180o inversion pulses
Rules of Thumb
• TE controls T2 dependence• TR controls T1 dependence• T1 competes with T2 and proton density
“PD Weighted” = long TR, short TE“T1 Weighted” = short TR, short TE“T2 Weighted” = long TR, long TE
Pulse Sequence Classifications
ApplicationContrast Weighting
RF PulsesName
Excludes certain tissues
T1 and T2ThreeInversion Recovery
conventionalT1, PD or T2
Two or more
Spin Echo
Fast imaging (3DFT)
T1 or T2*OneGradient Echo
Spin-Echo Imaging Sequence
TX
rf1 rf2
Spin Echo
time
timeRX
time
time
time
Gsl
Gro
Gpe

Optimizing MRI Protocols 7/27/2004
G.D. Clarke, AAPM 2004 4
Spin Echo Imaging – Effect of TRTR = 63 ms, NSA = 16 TR =125 ms, NSA = 8 TR = 250 ms, NSA = 4 TR = 500 ms, NSA = 2
TR = 1 s, NSA = 1 TR = 2 s, NSA = 1 TR = 4 s, NSA = 1
Bo = 1.5 T
FOV = 230 mm
256 x 256
st = 4 mm
TE = 15 ms
Vlaardingerbroek & den Boer, 1999
time90o 180o 180o180o
SE1
SE3SE2
Mo exp(-TE/T2)Mo exp (-TE/T2
*)
TE 2*TE 3*TE
Sign
al
Stre
ngth
Gslice
Gread
Gphase
Multi-Echo Acquisitions
TR (s)4
2
1.5
1.2
0.9
0.6
TE 30 60 90 120 150 180 ms
MultiechoImage Matrix
Most T1 Weighted
Most Proton Density Weighted
Most T2 Weighted
Sensitivity Plots(pulse sequence optimization)
104
103
102
10
TR(ms)
10 102 103
TE (ms)
Proton Density T1 T2
10 102 103
TE (ms)10 102 103
TE (ms)
0.9 Mo
0.1 Mo
Multi-Slice Imaging
• Increased efficiency by scanning multiple planes during TR interval
(Crooks L, Arakawa M, Hoenninger J et al. Radiology 1982; 143: 169-174.)
Inversion Recovery 180o 180o90o
Inversion Excitation Refocusing
Spin Echo
TI TE
TR
180o
M = Mo (1 – 2 exp[-TI/T1])+Mo
-Mo
TI
Optimizing MRI Protocols 7/27/2004
G.D. Clarke, AAPM 2004 5
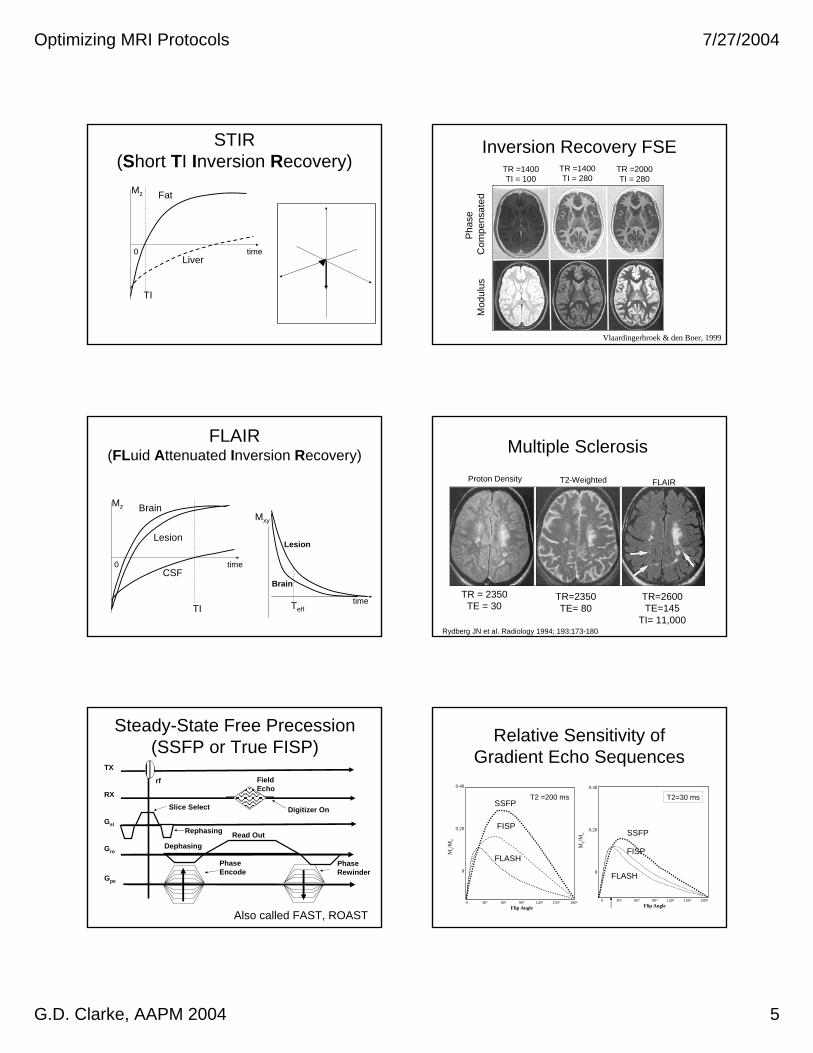
STIR(Short TI Inversion Recovery)
Fat
Liver
TI
0 time
Mz
Inversion Recovery FSE
Vlaardingerbroek & den Boer, 1999
Mod
ulus
Phas
e C
ompe
nsat
ed
TR =1400TI = 100
TR =1400TI = 280
TR =2000TI = 280
FLAIR(FLuid Attenuated Inversion Recovery)
Brain
Lesion
CSF
TI
0 time
Tefftime
Lesion
Brain
Mz
Mxy
Multiple Sclerosis
TR = 2350TE = 30
Proton Density
Rydberg JN et al. Radiology 1994; 193:173-180
T2-Weighted
TR=2350 TE= 80
FLAIR
TR=2600TE=145
TI= 11,000
Steady-State Free Precession (SSFP or True FISP)
TX
rf Field Echo
RX
Gsl
Gro
Gpe
Phase Encode
Phase Rewinder
Dephasing
Rephasing
Slice Select
Read Out
Digitizer On
Also called FAST, ROAST
Relative Sensitivity of Gradient Echo Sequences
T2 =200 msSSFP
FISP
FLASH
0 30o 60o 90o 120o 150o 180o
Flip Angle
0.40
0.20
0
My/M
o
T2=30 ms
SSFP
FISP
FLASH
0 30o 60o 90o 120o 150o 180o
Flip Angle
0.40
0.20
0
My/M
o
Optimizing MRI Protocols 7/27/2004
G.D. Clarke, AAPM 2004 6
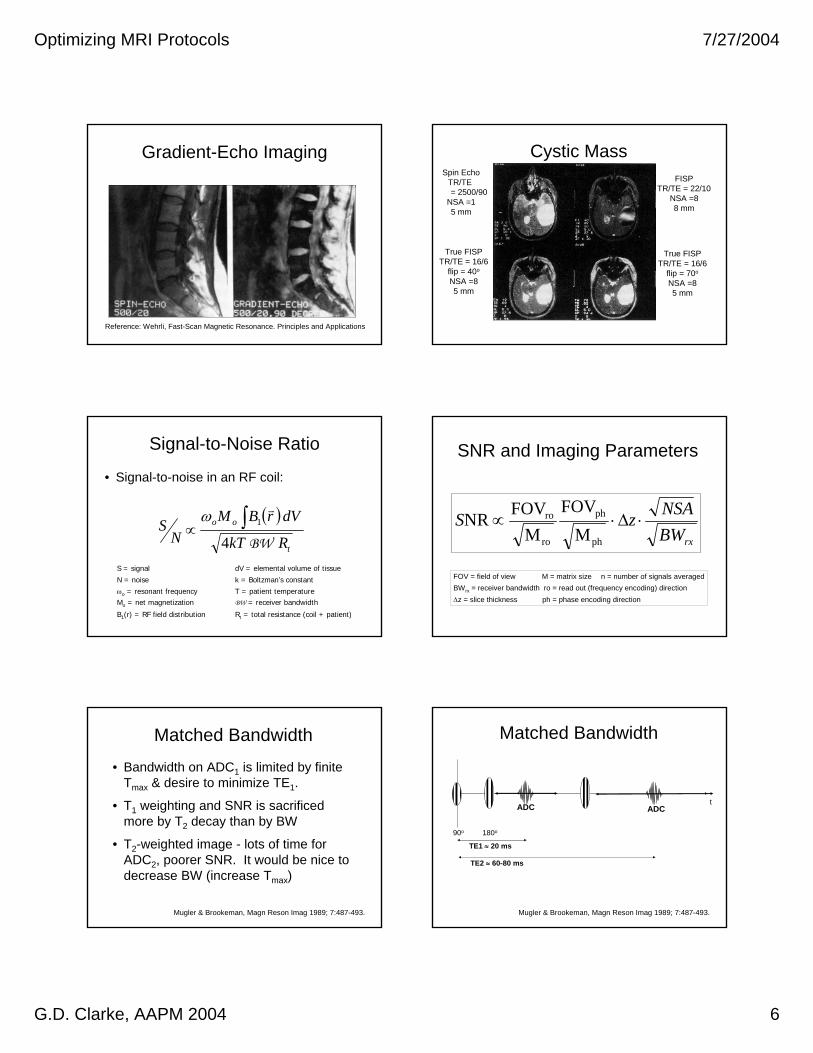
Gradient-Echo Imaging
Reference: Wehrli, Fast-Scan Magnetic Resonance. Principles and Applications
Cystic MassFISP
TR/TE = 22/10NSA =88 mm
Spin EchoTR/TE = 2500/90
NSA =15 mm
True FISPTR/TE = 16/6
flip = 40o
NSA =85 mm
True FISPTR/TE = 16/6
flip = 70o
NSA =85 mm
Signal-to-Noise Ratio
• Signal-to-noise in an RF coil:
( )t
oo
RkT
dVrBMN
S 4
1
BW∫∝
vω
S = signal dV = elemental volume of tissue
N = noise k = Boltzman’s constant
ωo = resonant frequency T = patient temperatureMo = net magnetization BW = receiver bandwidth
B1(r) = RF field distribution Rt = total resistance (coil + patient)
SNR and Imaging Parameters
rxBWNSAzS ⋅∆⋅∝
ph
ph
ro
ro
MFOV
MFOV NR
FOV = field of view M = matrix size n = number of signals averagedBWrx = receiver bandwidth ro = read out (frequency encoding) direction∆z = slice thickness ph = phase encoding direction
Matched Bandwidth
• Bandwidth on ADC1 is limited by finite Tmax & desire to minimize TE1.
• T1 weighting and SNR is sacrificed more by T2 decay than by BW
• T2-weighted image - lots of time for ADC2, poorer SNR. It would be nice to decrease BW (increase Tmax)
Mugler & Brookeman, Magn Reson Imag 1989; 7:487-493.
Matched Bandwidth
Mugler & Brookeman, Magn Reson Imag 1989; 7:487-493.
90o 180o
ADC
TE1 ≈ 20 ms
tADC
TE2 ≈ 60-80 ms
Optimizing MRI Protocols 7/27/2004
G.D. Clarke, AAPM 2004 7
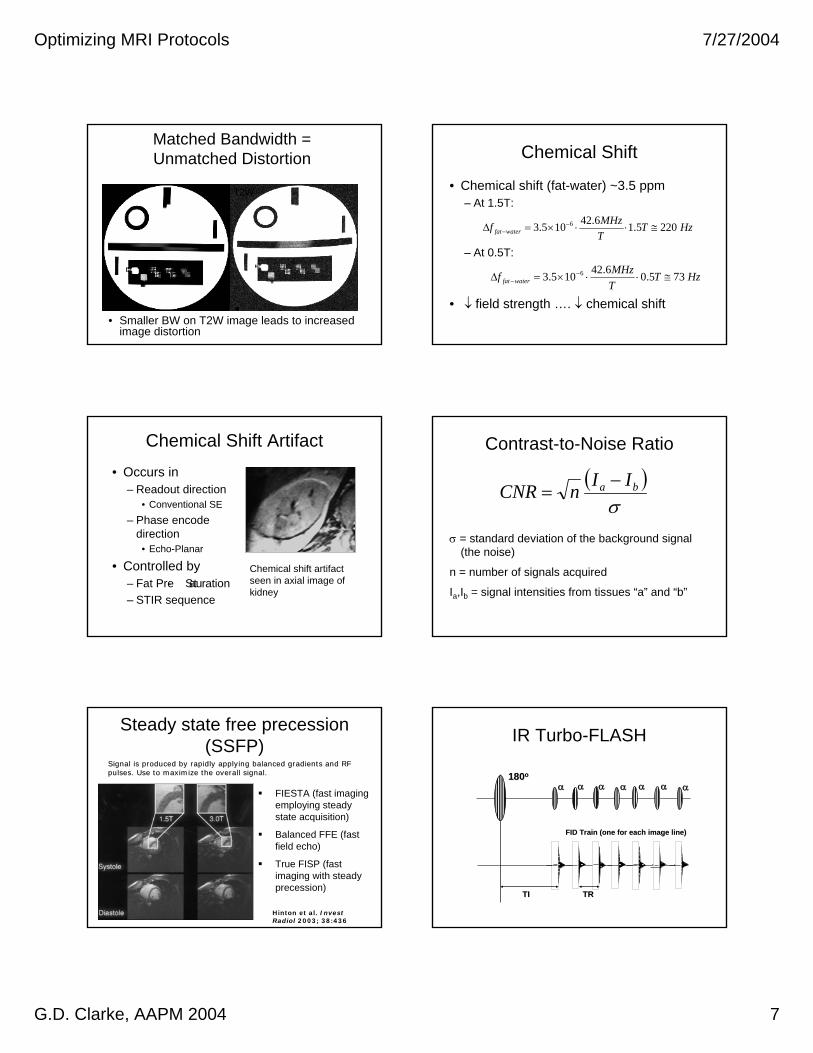
Matched Bandwidth = Unmatched Distortion
• Smaller BW on T2W image leads to increased image distortion
T1W T2W
Chemical Shift
• Chemical shift (fat-water) ~3.5 ppm– At 1.5T:
– At 0.5T:
• ↓ field strength …. ↓ chemical shift
HzTTMHzf waterfat 2205.16.42105.3 6 ≅⋅⋅×=∆ −
−
HzTTMHzf waterfat 735.06.42105.3 6 ≅⋅⋅×=∆ −
−
Chemical Shift Artifact• Occurs in
– Readout direction• Conventional SE
– Phase encode direction
• Echo-Planar
• Controlled by– Fat Pre- Saturation– STIR sequence
Chemical shift artifact seen in axial image of kidney
Contrast-to-Noise Ratio
σ = standard deviation of the background signal (the noise)
n = number of signals acquired
Ia,Ib = signal intensities from tissues “a” and “b”
( )σ
ba IInCNR −=
Steady state free precession (SSFP)
FIESTA (fast imaging employing steady state acquisition)
Balanced FFE (fast field echo)
True FISP (fast imaging with steady precession)
Signal is produced by rapidly applying balanced gradients and RFSignal is produced by rapidly applying balanced gradients and RFpulses. Use to maximize the overall signal.pulses. Use to maximize the overall signal.
Hinton et al. Invest Radiol 2003; 38:436
IR Turbo-FLASH
180180oo
αα αα αα αα αα αα αα
FID Train (one for each image line)FID Train (one for each image line)
TRTRTITI
Optimizing MRI Protocols 7/27/2004
G.D. Clarke, AAPM 2004 8
3D FLASH vs. 3D Turbo FLASH
IR Turbo FLASH FLASHTI = 500 ms, TR/TE = 10/4.5 TR/TE = 12/4.5NSA =1, flip = 10o NSA = 1, flip = 8o
FSE Pulse Sequence
ETL = Echo Train Length
Tie
RF
Gro
GpeOverallSignal
Echo
Center of K-space
Things That have “Blurry” point spread functions are “Sharp” in the
Image
K-space FTImageSpace
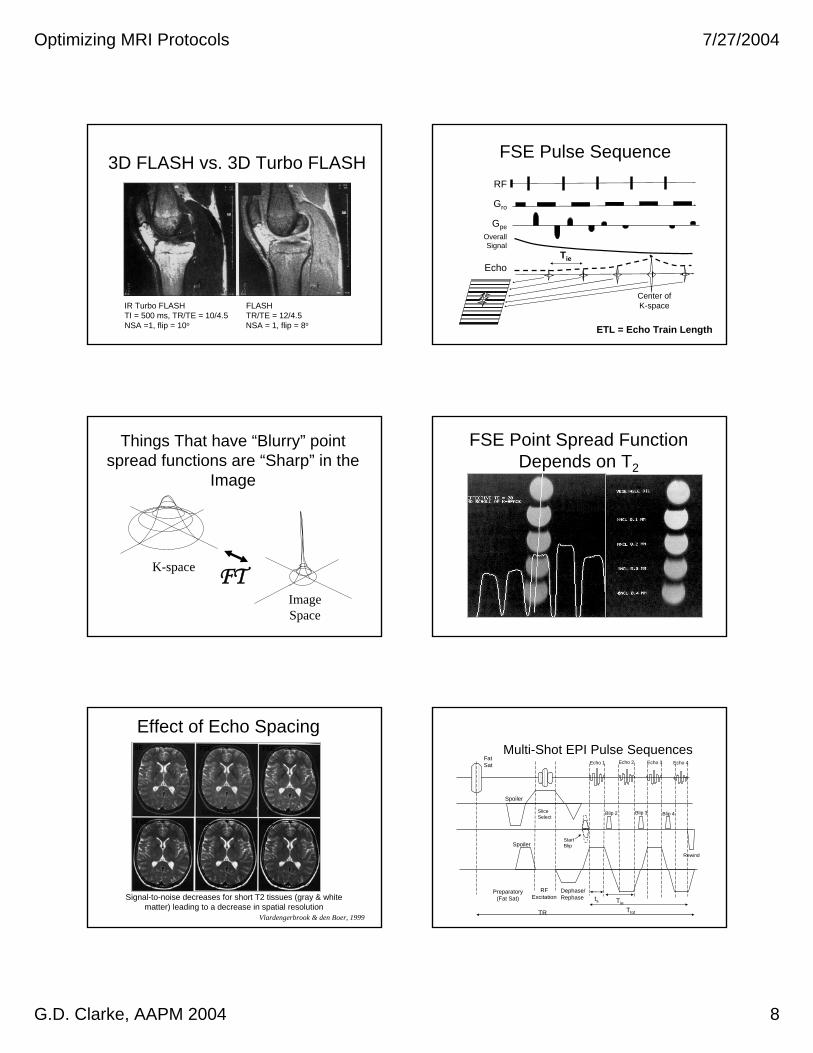
FSE Point Spread Function Depends on T2
Effect of Echo SpacingSE FSE FSE
FSE FSE FSE
Vlardengerbrook & den Boer, 1999
ES = 60 ms, TF =3 ES = 30 ms, TF =7
ES = 15 ms, TF =15 ES = 13 ms, TF =20 ES = 10 ms, TF =27
Signal-to-noise decreases for short T2 tissues (gray & white matter) leading to a decrease in spatial resolution
Preparatory(Fat Sat)
RF Excitation ts Tie
Echo 1 Echo 2 Echo 3 Echo 4
Blip 2 Blip 3 Blip 4SliceSelect
Dephase/Rephase
TtotTR
FatSat
Spoiler
Spoiler
Rewind
StartBlip
Multi-Shot EPI Pulse Sequences
Optimizing MRI Protocols 7/27/2004
G.D. Clarke, AAPM 2004 9
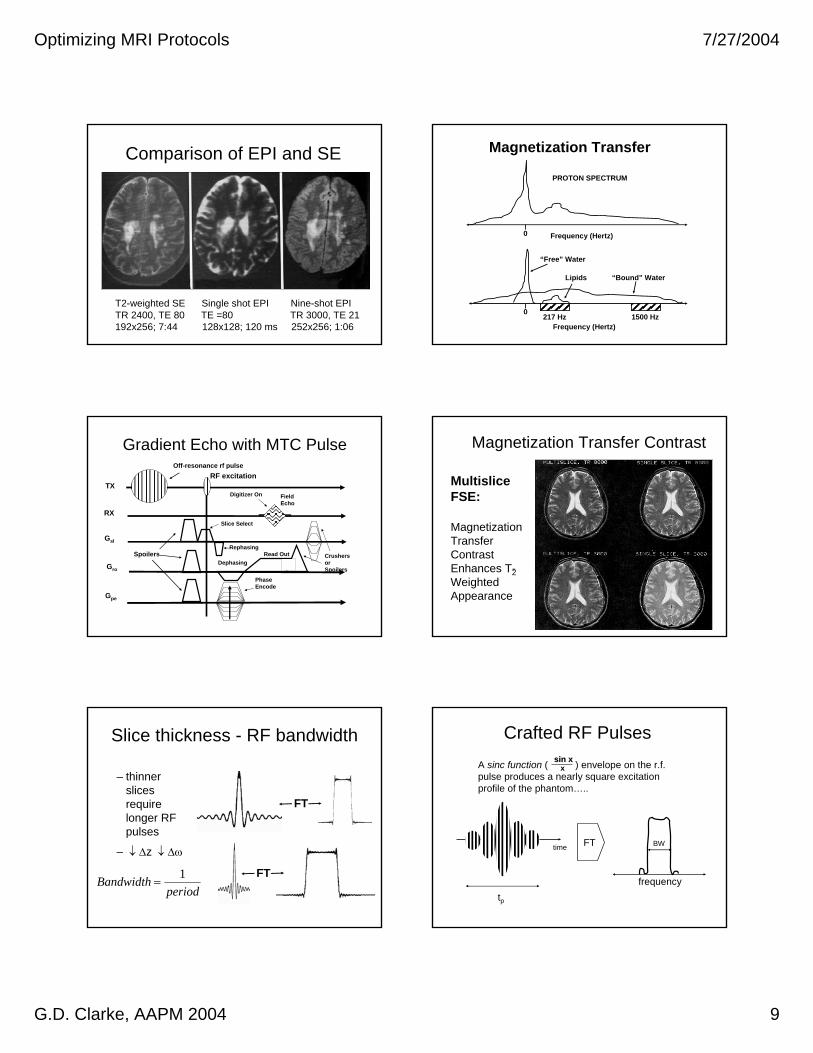
Comparison of EPI and SE
T2-weighted SE Single shot EPI Nine-shot EPITR 2400, TE 80 TE =80 TR 3000, TE 21192x256; 7:44 128x128; 120 ms 252x256; 1:06
Magnetization Transfer
“Free” Water
Lipids “Bound” Water
PROTON SPECTRUM
Frequency (Hertz)
Frequency (Hertz)
217 Hz 1500 Hz
0
0
Gradient Echo with MTC Pulse
TX
RX
Gsl
Gro
Gpe
RF excitation
Field Echo
Crushers or Spoilers
Phase Encode
Dephasing
Rephasing
Slice Select
Read Out
Digitizer On
Off-resonance rf pulse
Spoilers
MultisliceFSE:
Magnetization Transfer Contrast Enhances T2-Weighted Appearance
Magnetization Transfer Contrast
Slice thickness - RF bandwidth
– thinner slices require longer RF pulses
– ↓ ∆z ↓ ∆ω
periodBandwidth 1
=
FT
FT
Crafted RF Pulses
time FT
frequency
BW
tp
A sinc function ( ) envelope on the r.f.pulse produces a nearly square excitationprofile of the phantom…..
sin xsin xxx

Optimizing MRI Protocols 7/27/2004
G.D. Clarke, AAPM 2004 10
MRI Slice Thickness
• Signal ramps have a slope of 10:1
• Signal from ramp is 10 x slice thickness
• Two ramps are used to compensate for in-plane rotation of the phantom
• Phantom does not compensate for tilting backwards or swaying left-right
Cranial Nerves
10 mm slice 3 mm slice
Frequency Encoding & FOV– The field of view (FOVx) is determined by
the range of frequencies in the x- axis which are sampled
xx G
BandwidthFOV⋅
=γ
– The receiver bandwidth is not the same as the RF bandwidth
• ↑ BW ↑ FOVx
• ↓ Gx ↑ FOVx
– FOV must be sufficient to cover all tissue in the slice to avoid aliasing
Phase Encode Gradient
• Note that a factor of two is gone from Gph-max because Gph runs from - Gph=max to Gph=max
yph TFOV
NFOVBWG ⋅
⋅=⋅=− γ
πγπ2
max
where FOV is the desired field of viewwhere FOV is the desired field of view
The maximum phaseThe maximum phase--encoding gradient is :encoding gradient is :
yph TFOVG ⋅
⋅=∆1
γπ
The phaseThe phase--encoding gradient increment is :encoding gradient increment is :
Sampling the Signal
– Each signal is digitally sampled to produce one line in the k- space matrix
xx
x
xxx
FOVk
mcycles
mmT
TMHzk
tGk
1
msec
=∆
=
⋅⋅=∆
∆⋅=∆ γ
CHESS
RF
Signal
900 1800900sat
Gspoiler
• This is typically accomplished by preceding a SE or FSE sequence with a 90o pulse that is frequency, not spatially, selective.
Optimizing MRI Protocols 7/27/2004
G.D. Clarke, AAPM 2004 11
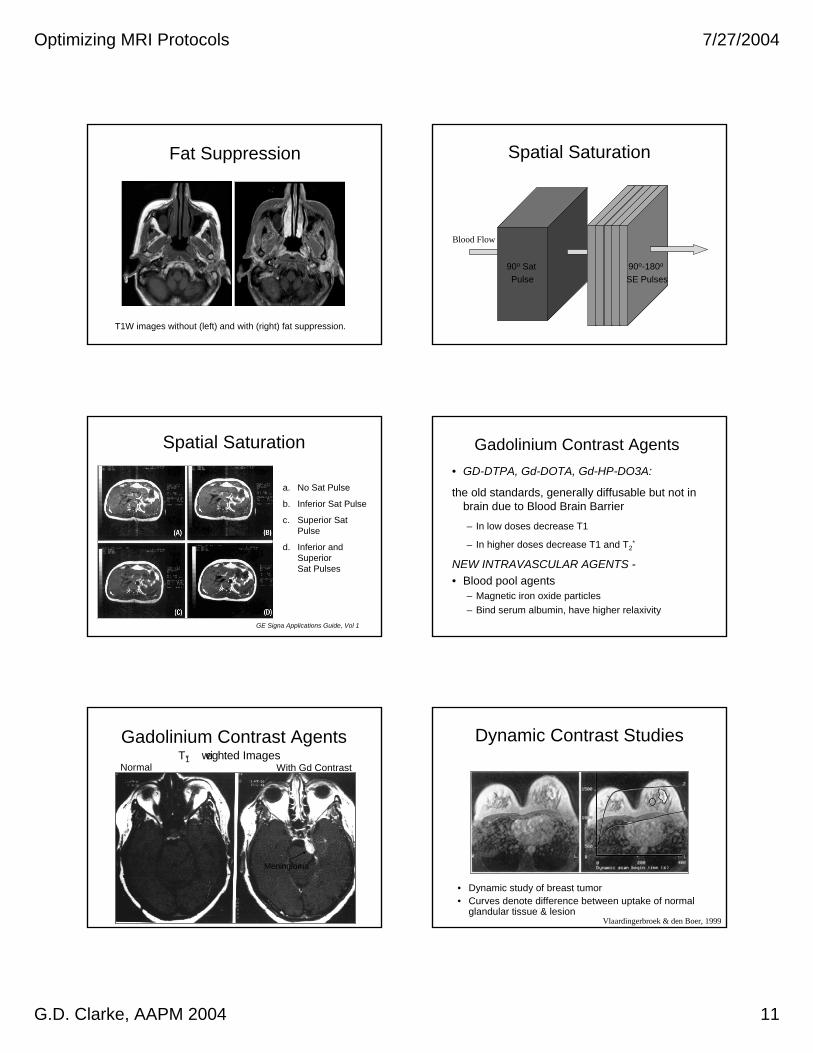
Fat Suppression
T1W images without (left) and with (right) fat suppression.
Spatial Saturation
90o Sat Pulse
90o-180o
SE Pulses
Blood Flow
Spatial Saturation
a. No Sat Pulse
b. Inferior Sat Pulse
c. Superior Sat Pulse
d. Inferior and Superior Sat Pulses
GE Signa Applications Guide, Vol 1
Gadolinium Contrast Agents• GD-DTPA, Gd-DOTA, Gd-HP-DO3A:
the old standards, generally diffusable but not in brain due to Blood Brain Barrier
– In low doses decrease T1
– In higher doses decrease T1 and T2*
NEW INTRAVASCULAR AGENTS -• Blood pool agents
– Magnetic iron oxide particles– Bind serum albumin, have higher relaxivity
Gadolinium Contrast AgentsT1- weighted Images
Normal With Gd Contrast
Meningioma
Dynamic Contrast Studies
• Dynamic study of breast tumor• Curves denote difference between uptake of normal
glandular tissue & lesionVlaardingerbroek & den Boer, 1999
Optimizing MRI Protocols 7/27/2004
G.D. Clarke, AAPM 2004 12
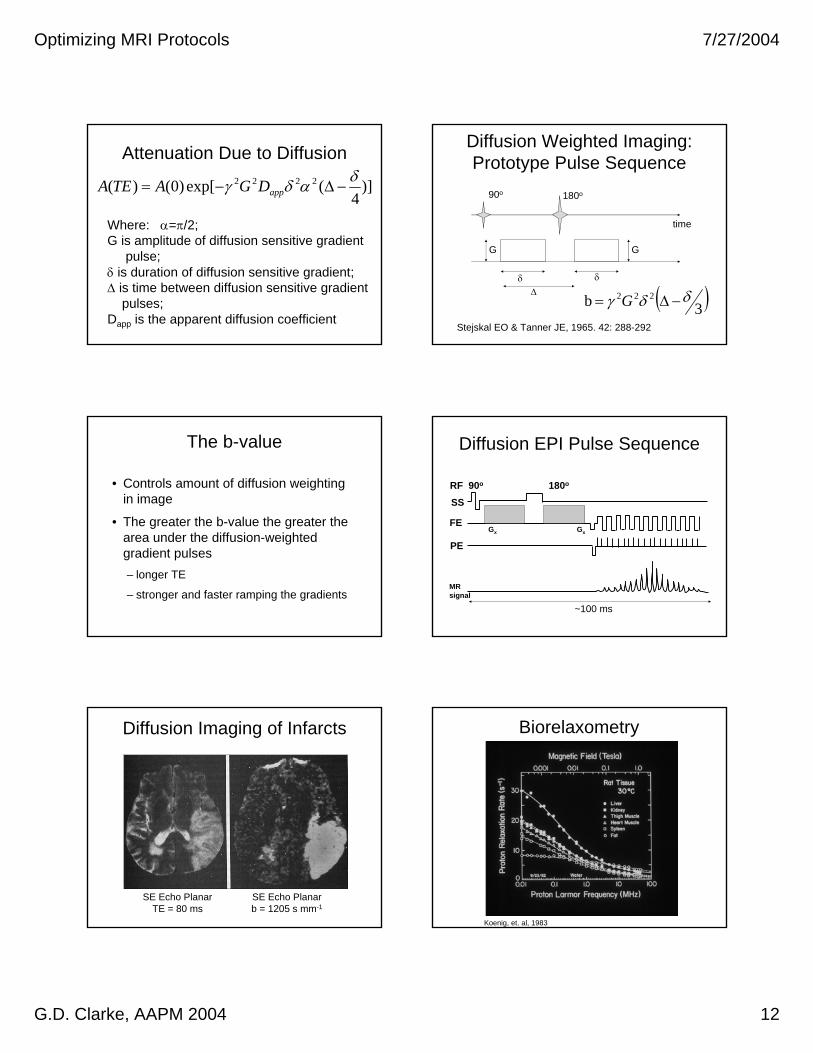
Attenuation Due to Diffusion
)]4
(exp[)0()( 2222 δαδγ −∆−= appDGATEA
Where: α=π/2;G is amplitude of diffusion sensitive gradient
pulse;δ is duration of diffusion sensitive gradient; ∆ is time between diffusion sensitive gradient
pulses; Dapp is the apparent diffusion coefficient
Diffusion Weighted Imaging: Prototype Pulse Sequence
Stejskal EO & Tanner JE, 1965. 42: 288-292
time
180o90o
δ δ∆
G
( )3 b 222 δδγ −∆= G
G
The b-value
• Controls amount of diffusion weighting in image
• The greater the b-value the greater the area under the diffusion-weighted gradient pulses– longer TE
– stronger and faster ramping the gradients
Diffusion EPI Pulse Sequence
RF 90o 180o
SS
FEGx Gx
PE
MRsignal
~100 ms
Diffusion Imaging of Infarcts
SE Echo PlanarTE = 80 ms
SE Echo Planarb = 1205 s mm-1
Koenig, et. al, 1983
Biorelaxometry
Optimizing MRI Protocols 7/27/2004
G.D. Clarke, AAPM 2004 13
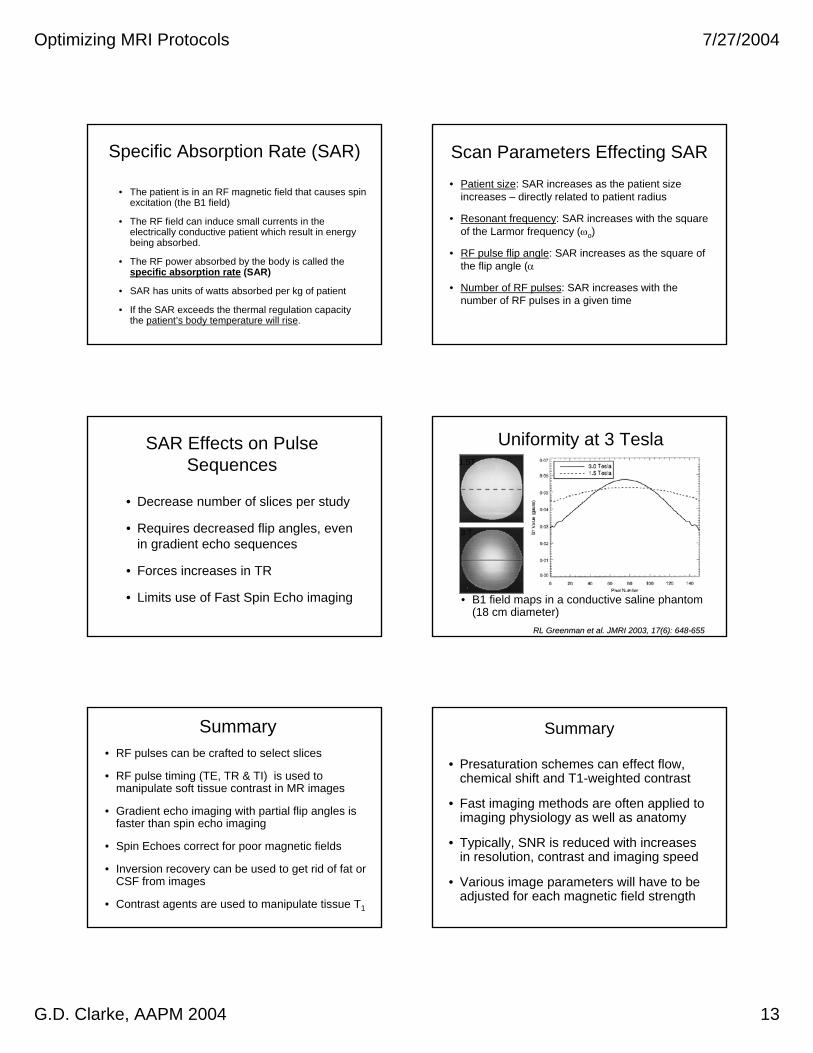
Specific Absorption Rate (SAR)
• The patient is in an RF magnetic field that causes spin excitation (the B1 field)
• The RF field can induce small currents in the electrically conductive patient which result in energy being absorbed.
• The RF power absorbed by the body is called the specific absorption rate (SAR)
• SAR has units of watts absorbed per kg of patient
• If the SAR exceeds the thermal regulation capacity the patient’s body temperature will rise.
Scan Parameters Effecting SAR• Patient size: SAR increases as the patient size
increases – directly related to patient radius
• Resonant frequency: SAR increases with the square of the Larmor frequency (ωo)
• RF pulse flip angle: SAR increases as the square of the flip angle (α
• Number of RF pulses: SAR increases with the number of RF pulses in a given time
SAR Effects on Pulse Sequences
• Decrease number of slices per study
• Requires decreased flip angles, even in gradient echo sequences
• Forces increases in TR
• Limits use of Fast Spin Echo imaging
Uniformity at 3 Tesla
• B1 field maps in a conductive saline phantom (18 cm diameter)
RL RL GreenmanGreenman et al. JMRI 2003, 17(6): 648et al. JMRI 2003, 17(6): 648--655655
1.5T
3 T
Summary• RF pulses can be crafted to select slices
• RF pulse timing (TE, TR & TI) is used to manipulate soft tissue contrast in MR images
• Gradient echo imaging with partial flip angles is faster than spin echo imaging
• Spin Echoes correct for poor magnetic fields
• Inversion recovery can be used to get rid of fat or CSF from images
• Contrast agents are used to manipulate tissue T1
Summary
• Presaturation schemes can effect flow, chemical shift and T1-weighted contrast
• Fast imaging methods are often applied to imaging physiology as well as anatomy
• Typically, SNR is reduced with increases in resolution, contrast and imaging speed
• Various image parameters will have to be adjusted for each magnetic field strength