vecmastf - vector spaces, vector algebras, and vector geometries

Image Enhancement
Using Vector Quantisation Based Interpolation
W. Paul Cockshott, Sumitha L. Balasuriya, Irwan Prasetya Gunawan,
and J. Paul Siebert
University of Glasgow, Computing Science Department
17 Lilybank Gardens, Glasgow G12 8QQ
{wpc,sumitha,ipguna,psiebert}@dcs.gla.ac.uk
Abstract
We present a novel method of image expansion using vector quantisa-
tion. The algorithm is inspired by fractal coding and uses a statistical model
of the relationship between details at different scales of the image to inter-
polate detail at one octave above the highest spatial frequency in the original
image. Our method aims at overcoming the drawbacks associated with tradi-
tional approaches such as pixel interpolation, which smoothes the scaled-up
images, or fractal coding, which bears high computational cost and has lim-
ited use due to patent restrictions. The proposed method is able to regenerate
plausible image detail that was irretrievable when traditional approaches are
used. The vector quantisation-based method outperforms conventional ap-
proaches in terms of both objective and subjective evaluations.
1 Introduction
Digital cinema sequences can be captured at a number of different resolutions, for ex-
ample 2K pixels across or 4K pixels across. The cameras used for high resolutions are
expensive and the data files they produce are large. Because of this, studios may chose to
capture some sequences at lower resolution and others at high resolution. The different
resolution sequences are later merged during post production. The merger requires that
some form of image expansion be performed on the lower resolution sequences. In this
paper we present a new method of doing the image expansion that has some advantages
over the orthodox interpolation methods.
The paper is organised as follows. Section 2 will review some of the existing tech-
niques of image expansion and highlight their shortcomings. In Section 3, we will de-
scribe the proposed algorithm in details including the process of training the algorithm,
constructing the library used in it, and producing as well as enhancing the expanded image
using the algorithm. Section 4 contains our experimental results in which our proposed
method is evaluated. The paper concludes in Section 5.

2 Background
In the traditional pixel interpolation method, new pixels are generated in the scaled-up im-
age; however, there is no information pertaining to what these pixels should contain, other
than interpolation of the original pixels by some polynomial function. Because the poly-
nomial function works over a neighbourhood in the original, smaller image, the scaled-up
image will contain less energy at the highest spatial frequencies than the original, making
it looks smoother.
An alternative approach through fractal encoding, originally reported by Barnsley [1],
allows rescaled images to contain new high frequency information. Fractal encoding
takes advantage of the self similarity across scales of natural scenes. A fractal code for an
image consists of a set of contractive affine maps from the image, onto the image. Taken
as a whole, these maps compose a collage such that each pixel is mapped onto by at least
one such map. The maps operate both in the spatial and the luminance domain. In the
luminance domain they specify a target pixel p by an equation of the form p = a + bq
where q is the mean brightness of a downsample region of source pixels. In the spatial
domain they specify the coordinates of the source pixels supporting q as the result of
rotation, scaling and translation operations on the coordinates of the destination pixels.
The image is regenerated from the codes by iterated application of the affine maps.
The iteration process has an attractor that is the output image. If the maps have been well
chosen this attractor approximates well to a chosen input image.
A particular fractal code might specify each 4x4 rectangle within a 256x256 pixel
output image in terms of a contractive map on some 8x8 rectangle at some other point in
the image. As the iteration proceeds higher and higher frequency information is built up.
If we start from a uniform grey image, the first iteration will generate detail at a spatial
frequency of 8 pixels. After one iteration source blocks of 8 pixels across will contain
up to one spatial wave. After the second interpolation these waves will have been shifted
up in frequency to 4 pixels across. Each iteration adds detail one octave higher until the
Nyquist limit of the output image is reached: 128 spatial cycles in this case.
It is evident that if we specify the contractive mappings relative to the scale of the
whole image rather than in terms of pixels, then the same set of mappings could be used
to generate a 512x512 pixel output image. In this case the contractive mappings would
shrink 16 pixel blocks to 8 pixel blocks. After an additional round of iteration the 512
pixel output image will contain spatial frequencies up to 256 cycles.
Fractal codes can thus be used to expand an image, generating new and higher spatial
frequencies in the process. Although the additional detail that is added by this process can
not have been available in the source image it nevertheless ‘looks plausible’ because the
‘new’ details are scaled down versions of details that were present in the original picture
(see Figure 1). The search process used in a fractal encoder scans a half sized copy of
the original image to find a match for each small block in the original image. In fractal
enhancement the small blocks are then replaced by their full sized corresponding blocks.
The detail enhancement comes because there is a systematic relationship between the
low frequency and high frequency information within blocks. This allows high frequency
information in a larger block to be plausibly substituted into a smaller block when the
latter is enlarged.
Fractal codes however suffer from two serious obstacles to their widespread adoption:
the encoding algorithm is slow and their general use is blocked by patent restrictions. In

Figure 1: Illustration of how shrinking is used to fill in detail in fractal enhancement.
this paper we present an alternative approach that learns lessons from fractal coding but
avoids these difficulties. Instead of using fractals we use vector quantisation to enhance
the detail of an image.
3 Proposed method
The key idea of our approach is that because there is a systematic relationship between
low and high frequency information within a neighbourhood, it should be possible for a
machine learning algorithm to discover what this relationship is and exploit this knowl-
edge when enhancing an image. We use vector quantisation to categorise areas of the
image at different scales, learn the systematic relationship between the coding of cor-
responding areas at varying scales, and then use this information to extrapolate a more
detailed image. The entire process works by
1. Running a training algorithm to learn the cross-scale structure relations in exam-
ple pictures. In the experiments here two images were used; one from the ‘face’
sequence and one from the outside ‘trees’ sequence.
2. Using this information to automatically construct a new image enhancing program.
3. Applying the enhancing program to digital cine images to generate new images at
twice the resolution.
3.1 The Training Algorithm
The aim of the training algorithm is to learn what high frequency detail is likely to be
associated with the low frequency features at a given point in an image. Given an im-
age I we construct a half sized version of the image I0.5 and expand this to form a new
blurred image Ib which is the original size, by using linear interpolation. We now form a
difference image Id = I− Ib which contains only the high frequency details.

It is clear that we have a genetive association between position I0.5[x,y] and the four
pixel block Gx,y = {Id[2x,2y], Id[2x + 1,2y], Id[2x,2y + 1], Id[2x + 1,2y + 1]}. We aim
to categorise the regions around each position in I0.5[x,y], categorise the corresponding
blocks Gx,y and learn the associations between these categories.
3.1.1 Categorising the Upper Layer
Associate with each pixel p ∈ I0.5 a neighbourhoodp
and compute the differences
between p and its neighbours. These define a 4 element vector. Using the algorithm given
in [6] construct a vector quantisation codebook B1 for these features. Assume that the
code book has n entries.
3.1.2 Categorising the Lower Layer
Use the same vector quantisation algorithm to construct a second vector quantisation
codebook B2 for the set of vectors Gx,y. Assume that the code book again has n entries.
3.1.3 Learning the Association
Encode the neighbourhoods around each pixel p ∈ I0.5 with B1 to yield an encoded image
E0.5. Encode each Gx,y associated with each pixel p ∈ I0.5 with B2 to yield an encoded
image Eb. The entries in both the encoded images are indexed into the respective code-
books.
Construct an n×n frequency table F that counts how frequently each code from B1 is
associated with each code from B2. Finally convert the frequency table to a conditional
probability table by dividing by the number of observations.
3.2 The Program Generator
The aim of the program generator is to take the tables B1,B2,F and use them to generate
pascal libraries that can be used to index and predict detail in subsequent images. The
process is analogous to the way Lex [5] constructs scanner tables in C from a regular
grammar.
Two optimisations are performed prior to outputting the tables:
1. Table F is converted from a conditional probability table to a table encoding the
cumulative probability of each entry in B2 being associated with and entry in B1.
2. Hierarchical Vector Quantisation [2] indices are constructed for the two codebooks
to enable future encoding to be of O(4) rather than O(n).
3.3 The Enhancement Algorithm
The enhancement program has the library produced above linked to it. The aim of the
program is to read in an image J and produce an image J2 of twice the size with enhanced
detail. The algorithm is described by Algorithm 1.
Once this process has been completed for each pixel in J the image Jd contains details
whose spatial frequency is one octave higher than those that are represented in Jb. Each

Algorithm 1 Proposed method
1: Create image Jb of twice the size of J using linear interpolation.
2: Create an empty image Jd twice the size of J.
3: for all pixel p ∈ J at position x,y do
4: Compute its differences with its four neighbours as described in 3.1.1
5: Encode the four differences using a vector quantisation index for book B1 to yield a code index number
i
6: Select the ith row of F
7: Draw a real number r at random such that 0 ≤ r < 1
8: Scan row F [i] until F[i, j] > r is found
9: Select the 4 element vector B2[ j].10: Place this vector in the image Jd at positions {Jd [2x,2y],Jd [2x+1,2y],Jd [2x,2y+1],Jd [2x+1,2y+1]}.
11: end for
12: Forms the enhanced image J2 by the operation J2 = Jb + Jd
detail occurs with the same probability with respect to the categorisation of localities in J
as details occurred in Id with respect to the categorisation of localities in I0.5.
4 Results
Our experiments were conducted on 1920×1080 video frames in the DPX image format
captured by a Thompson Viper D-Cinema video camera. The pixels were in 10 bit loga-
rithmic format. Image expansion using our system was compared to conventional bilinear
and B-spline interpolation techniques. The experimental procedure can be described as
follows:
1. The enhancement system was trained on a 1920× 1080 DPX frame from an out-
door sequence. The test images used were a studio frame (Figure 2), a later frame
from the outdoor sequence from which original training frame had been selected
(Figure 4), and a train sequence (Figure 6). The training and test frame from this
sequence had different zoom settings, the training frame having had a higher zoom
factor than the second test frame.
2. The test images were downsampled using bilinear interpolation to 960× 540 and
output in DPX format.
3. Image expansion to double the original resolution of 1920× 1080 was performed
using our algorithm, bilinear and B-spline interpolations.
4. Original and expanded DPX video frames were compared subjectively based on
perceived detail in image patches. The quality of reproduction was also evaluated
objectively using several image quality metrics described below.
We used several methods of assessment to evaluate the quality of the reconstructed
images. First, a traditional measure based on Peak Signal-to-Noise Ratio (PSNR) [7]
was calculated. In this paper, the PSNR was calculated on the 10-bit logarithmic repre-
sentation of pixel values. This metric is very practical and easy to compute, however critic
says that it does not always correlate well with the quality perceived by human users [3].
An alternative using a modified version of the PSNR based on perceived visibility of er-
ror, namely Weighted Peak Signal-to-Noise Ratio (WPSNR) [8], was also computed. In
this metric, error on textured area would be given less weighting factor than that on flat
surface.

Figure 2: Reduced scale colour image from original DPX digital cine frame from studio sequence
‘face’. Relatively soft focus is used with a moving subject. Box indicates where detail is shown in
Figure 3. Note that this and all following images are uncorrected log colour space.
(a) Original (b) Our algorithm
(c) B-spline (d) Bilinear
Figure 3: A region with high frequency detail from original DPX video frame from the ’face’
sequence (a) and the corresponding region generated by expansion of the half-resolution video
frame by our algorithm (b), as well as by B-spline interpolation (c) and bilinear interpolation (d).
Since image expansion algorithms usually introduce blur artifacts, a quality metric
[4] capable of detecting and measuring the degree of blurriness on the degraded image
was used. This metric computes features extracted from the frequency domain through
two-dimensional Discrete Fourier Transfrom (DFT) computation over a localised area
on the gradient image. In an image contaminated by blurring distortion, some frequency
components appear attenuated when compared to the corresponding set of components
on the original image. Blurriness detection can be done by analysing the decay in the

Figure 4: Image taken outside in bright light, with sharp focus containing more high frequency
detail. Box shows area used in Figure 5.
(a) Original (b) Our algorithm
(c) B-spline (d) Bilinear
Figure 5: Samples taken from the frame shown in Figure 4. The algorithm convincingly synthesises
speckle on the concrete wall but leaves the white wall in the background speckle free.
strength of these frequency components. One of the quality parameters produced by this
metric is harmonic loss blur index, which we used to measure the degree of blurriness on
our images in this paper. Because blur index is a distortion metric, higher value of the
index on an image implies that the image contains more blurring artifacts.
In addition to the above metrics, we also use another quality metric that is sensitive to
structural distortions. Blurriness in the expanded images may appear as a result of edge
widening as well as change of contrast. The universal quality index (UQI) [9], which
is a special case of structural similarity (SSIM) index, has the ability to measure such
structural distortions due to image expansion. This metric is significantly different from
the traditional PSNR/WPSNR since the latter attempt to quantify the visibility of errors
between the degraded images and the original image, whilst UQI models any distortions
as a combination of three different factors: loss of correlation, luminance distortion, and
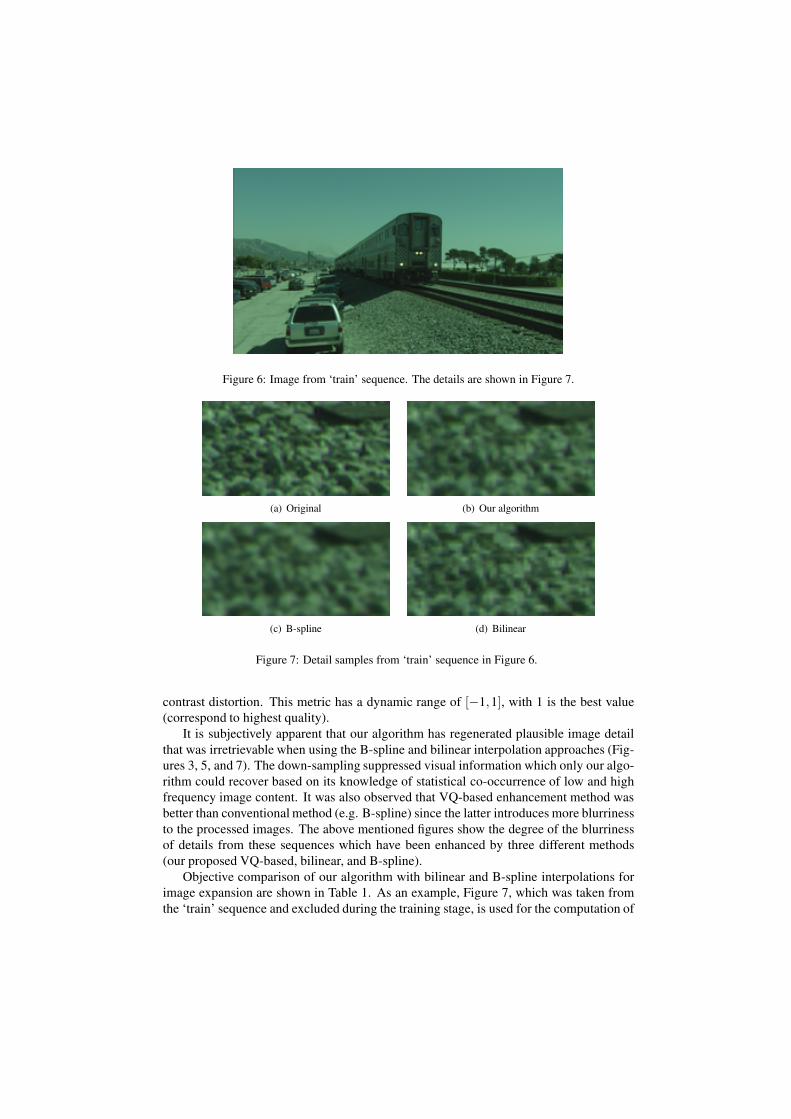
Figure 6: Image from ‘train’ sequence. The details are shown in Figure 7.
(a) Original (b) Our algorithm
(c) B-spline (d) Bilinear
Figure 7: Detail samples from ‘train’ sequence in Figure 6.
contrast distortion. This metric has a dynamic range of [−1,1], with 1 is the best value
(correspond to highest quality).
It is subjectively apparent that our algorithm has regenerated plausible image detail
that was irretrievable when using the B-spline and bilinear interpolation approaches (Fig-
ures 3, 5, and 7). The down-sampling suppressed visual information which only our algo-
rithm could recover based on its knowledge of statistical co-occurrence of low and high
frequency image content. It was also observed that VQ-based enhancement method was
better than conventional method (e.g. B-spline) since the latter introduces more blurriness
to the processed images. The above mentioned figures show the degree of the blurriness
of details from these sequences which have been enhanced by three different methods
(our proposed VQ-based, bilinear, and B-spline).
Objective comparison of our algorithm with bilinear and B-spline interpolations for
image expansion are shown in Table 1. As an example, Figure 7, which was taken from
the ‘train’ sequence and excluded during the training stage, is used for the computation of

Objective quality metrics Proposed method Bilinear B-Spline
PSNR [7] 36.9 dB 28.4 dB 36.6 dB
WPSNR [8] 44.8 dB 39.2 dB 44.5 dB
Blur index [4] 0.180 0.193 0.298
UQI [9] 0.836 0.456 0.826
Table 1: Objective image quality metrics for the image expansions shown in Figure 7.
40 41 42 43 44 45
66
68
70
72
74
76
78
80
82
84Pixel value horisontal cross section profile
Pixel column index (x)
Lum
inance
originalVQ−basedb−spline
P1 P0 P2 P2 P3
Figure 8: Cross-sectional luminosity profile
these metrics. Our method is superior than the others in terms of the objective measures
used in this paper. For example, the blur index values are in favour of our VQ-based
method; it shows that the blurriness indices of the B-spline and bilinear enhanced images
are generally higher than those of VQ-based, with B-spline enhanced image is the worst
in quality (i.e., contains the most blur distortions). The bilinear method, although compa-
rable with our method in terms of blur index, has the most damaged structure as shown
by the UQI values.
The blurring effect of expansion method on edges can also be illustrated by observing
pixel-value cross-section along a row (or column) in an image. Cross-sectional luminosity
profile of the detail images (Figure 7) are shown in Figure 8. In this figure, the local
maxima around edges are indicated by the dashed lines (P0 and P1) and local minima by
the dotted lines (P2 and P3). The graph shows that the edge in the image expanded by the
B-spline method is wider (with an edge width of P3−P0) than those in the original and
the VQ-based enhanced images (edge width of P2−P1). It explains that the blur in the
traditional expansion method is due to the increased edge width.
5 Conclusions
This paper presented a novel approach to image enhancement using a technique which
would avoid the known shortcomings of fractal enhancement. We learnt the statistical
properties of the co-occurrence of low and high frequency image content and used these

probability distributions to predict image content during image expansion. Subjective
evaluations show that our algorithm outperforms conventional approaches. This is also
confirmed by the results of objective evaluations based on several published quality met-
rics suitable for the application presented here. We hope to continue working on our
algorithm which is still in its preliminary stages by: 1) Learning statistical co-occurrence
of neighbouring codebook blocks in images; and 2) Mediating the addition of high fre-
quency predicted detail with the energy of the underlying region in the image to prevent
prediction of detail in the absence of high frequency information in the original image.
Acknowledgements
This work is supported by the European Commission under the IP-RACINE project (IST-
2-511316-IP).
References
[1] M.F. Barnsley and L.P. Hurd. Fractal image compression. AK Peters, 1993.
[2] N. Chaddha, M. Vishwanath, and PA Chou. Hierarchical vector quantization of per-
ceptually weighted block transforms. Proceedings of the Conference on Data Com-
pression, 1995.
[3] Bernd Girod. What’s wrong with mean-squared error? In A. B. Watson, editor,
Digital Images and Human Vision, pages 207–220. 1993.
[4] Irwan Prasetya Gunawan and Mohammed Ghanbari. Image quality assessment based
on harmonics gain/loss information. In Proceedings of ICIP’05 (IEEE International
Conference on Image Processing), volume 1, pages 429–432, Genoa, Italia, Septem-
ber 11–14 2005.
[5] J.R. Levine, T. Mason, and D. Brown. lex & yacc. O’Reilly & Associates, Inc.
Sebastopol, CA, USA, 1992.
[6] Y. Linde, A. Buzo, and R. Gray. An Algorithm for Vector Quantizer Design. IEEE
Transactions on Communications, 28(1):84–95, 1980.
[7] William K. Pratt. Digital Image Processing. John Wiley and Sons, 1978.
[8] Sviatoslav Voloshynovskiy, Alexander Herrigel, Nazanin Baumgartner, and Thierry
Pun. A stochastic approach to content adaptive digital image watermarking. In In-
ternational Workshop on Information Hiding, volume LNCS 1768 of Lecture Notes
in Computer Science, pages 212–236, Dresden, Germany, 29 September –1 October
1999. Springer Verlag.
[9] Zhou Wang, Alan Conrad Bovik, Hamid Rahim Sheikh, and Eero P. Simoncelli. Im-
age quality assessment: From error visibility to structural similarity. IEEE Transac-
tion on Image Processing, 13(4):600–612, April 2004.