IMA REPORTING - Imagine Learningmedia.thinkthroughmath.com/TTM-Reporting.pdf · 2017-01-17 ·...
13
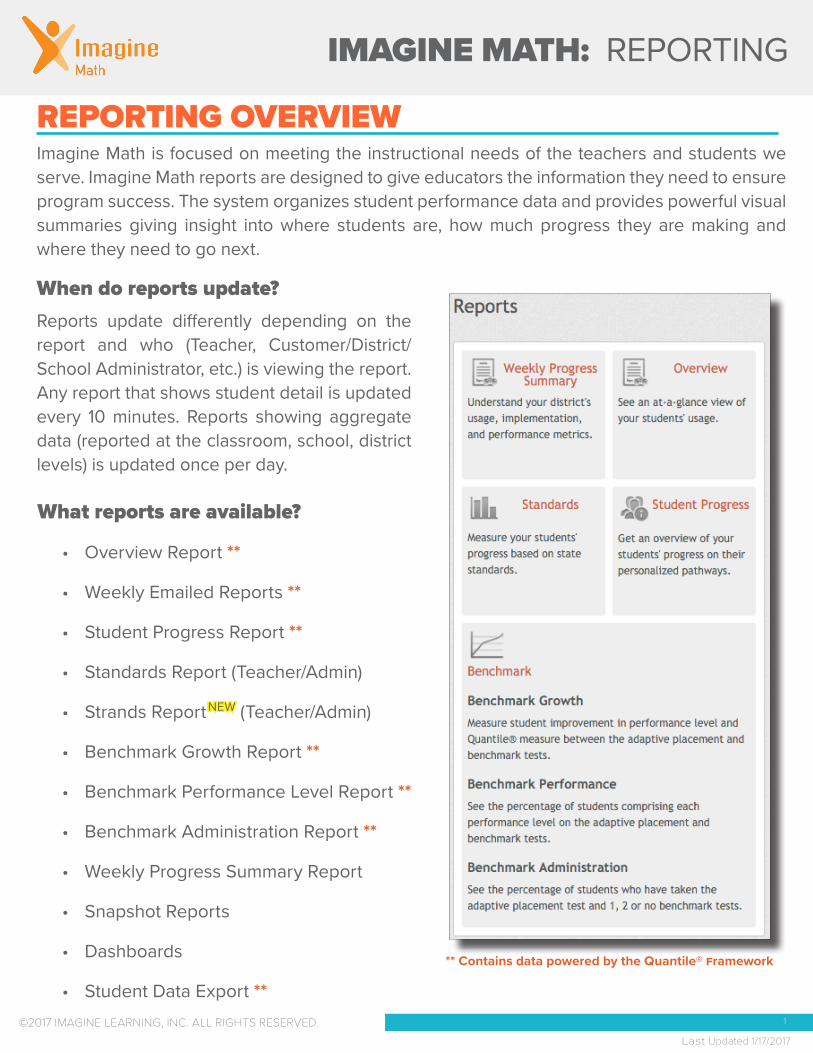
IMAGINE MATH: REPORTING 1 Last Updated 1/17/2017 ©2017 IMAGINE LEARNING, INC. ALL RIGHTS RESERVED. REPORTING OVERVIEW When do reports update? Reports update differently depending on the report and who (Teacher, Customer/District/ School Administrator, etc.) is viewing the report. Any report that shows student detail is updated every 10 minutes. Reports showing aggregate data (reported at the classroom, school, district levels) is updated once per day. What reports are available? • Overview Report ** • Weekly Emailed Reports ** • Student Progress Report ** • Standards Report (Teacher/Admin) • Strands Report NEW (Teacher/Admin) • Benchmark Growth Report ** • Benchmark Performance Level Report ** • Benchmark Administration Report ** • Weekly Progress Summary Report • Snapshot Reports • Dashboards • Student Data Export ** ** Contains data powered by the Quantile® Framework Imagine Math is focused on meeting the instructional needs of the teachers and students we serve. Imagine Math reports are designed to give educators the information they need to ensure program success. The system organizes student performance data and provides powerful visual summaries giving insight into where students are, how much progress they are making and where they need to go next.
Transcript of IMA REPORTING - Imagine Learningmedia.thinkthroughmath.com/TTM-Reporting.pdf · 2017-01-17 ·...
IMAGINE MATH: REPORTING
1
Last Updated 1/17/2017
©2017 IMAGINE LEARNING, INC. ALL RIGHTS RESERVED.
REPORTING OVERVIEW
When do reports update?Reports update differently depending on the report and who (Teacher, Customer/District/ School Administrator, etc.) is viewing the report. Any report that shows student detail is updated every 10 minutes. Reports showing aggregate data (reported at the classroom, school, district levels) is updated once per day.
What reports are available?
• Overview Report **
• Weekly Emailed Reports **
• Student Progress Report **
• Standards Report (Teacher/Admin)
• Strands Report NEW (Teacher/Admin)
• Benchmark Growth Report **
• Benchmark Performance Level Report **
• Benchmark Administration Report **
• Weekly Progress Summary Report
• Snapshot Reports
• Dashboards
• Student Data Export **
** Contains data powered by the Quantile® Framework
Imagine Math is focused on meeting the instructional needs of the teachers and students we serve. Imagine Math reports are designed to give educators the information they need to ensure program success. The system organizes student performance data and provides powerful visual summaries giving insight into where students are, how much progress they are making and where they need to go next.
IMAGINE MATH: REPORTING
2
Last Updated 1/17/2017
©2017 IMAGINE LEARNING, INC. ALL RIGHTS RESERVED.
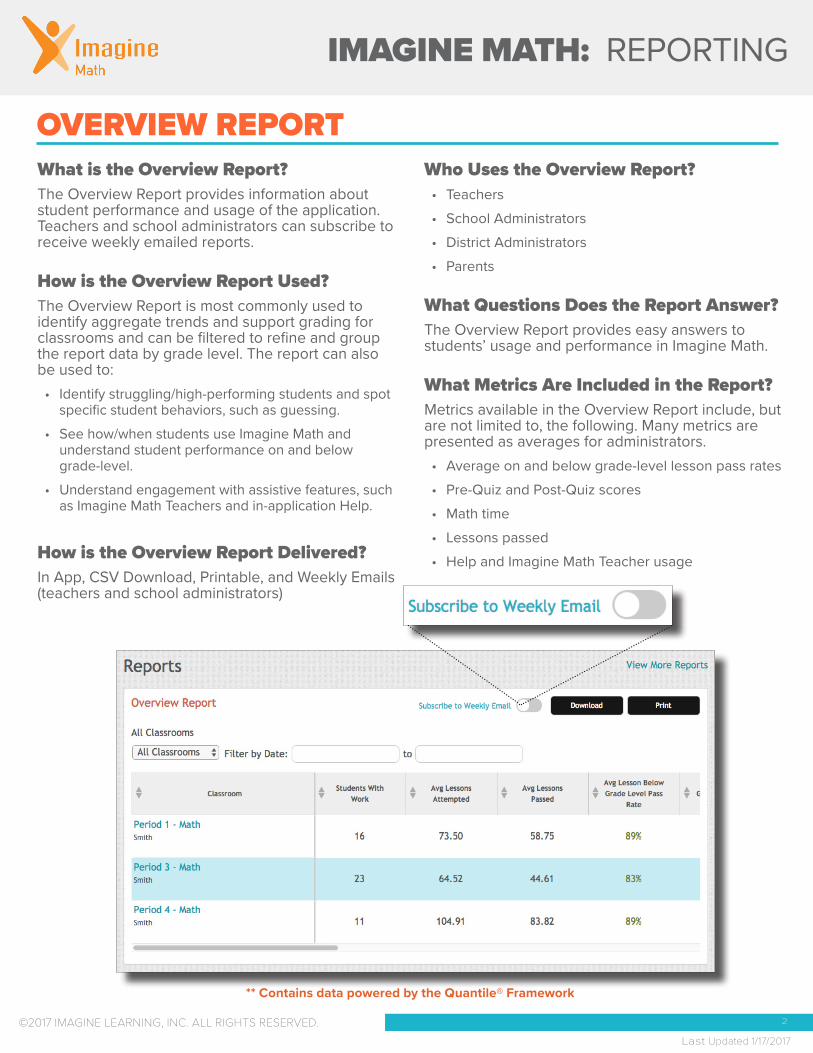
What is the Overview Report? The Overview Report provides information about student performance and usage of the application. Teachers and school administrators can subscribe to receive weekly emailed reports.
How is the Overview Report Used? The Overview Report is most commonly used to identify aggregate trends and support grading for classrooms and can be filtered to refine and group the report data by grade level. The report can also be used to:• Identify struggling/high-performing students and spot
specific student behaviors, such as guessing.
• See how/when students use Imagine Math and understand student performance on and below grade-level.
• Understand engagement with assistive features, such as Imagine Math Teachers and in-application Help.
How is the Overview Report Delivered? In App, CSV Download, Printable, and Weekly Emails (teachers and school administrators)
Who Uses the Overview Report? • Teachers
• School Administrators
• District Administrators
• Parents
What Questions Does the Report Answer? The Overview Report provides easy answers to students’ usage and performance in Imagine Math.
What Metrics Are Included in the Report? Metrics available in the Overview Report include, but are not limited to, the following. Many metrics are presented as averages for administrators.• Average on and below grade-level lesson pass rates
• Pre-Quiz and Post-Quiz scores
• Math time
• Lessons passed
• Help and Imagine Math Teacher usage
OVERVIEW REPORT
** Contains data powered by the Quantile® Framework
IMAGINE MATH: REPORTING
3
Last Updated 1/17/2017
©2017 IMAGINE LEARNING, INC. ALL RIGHTS RESERVED.
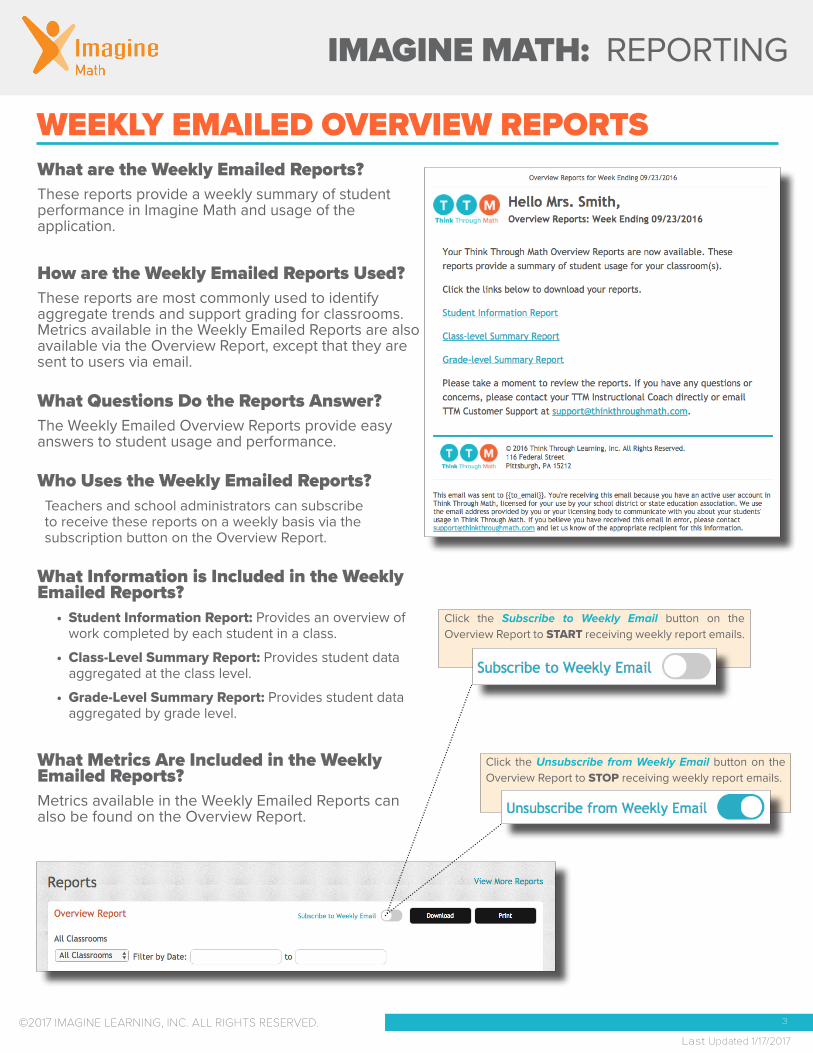
WEEKLY EMAILED OVERVIEW REPORTSWhat are the Weekly Emailed Reports?These reports provide a weekly summary of student performance in Imagine Math and usage of the application.
How are the Weekly Emailed Reports Used? These reports are most commonly used to identify aggregate trends and support grading for classrooms. Metrics available in the Weekly Emailed Reports are also available via the Overview Report, except that they are sent to users via email.
What Questions Do the Reports Answer? The Weekly Emailed Overview Reports provide easy answers to student usage and performance.
Who Uses the Weekly Emailed Reports? Teachers and school administrators can subscribe to receive these reports on a weekly basis via the subscription button on the Overview Report.
What Information is Included in the Weekly Emailed Reports?
• Student Information Report: Provides an overview of work completed by each student in a class.
• Class-Level Summary Report: Provides student data aggregated at the class level.
• Grade-Level Summary Report: Provides student data aggregated by grade level.
What Metrics Are Included in the Weekly Emailed Reports?Metrics available in the Weekly Emailed Reports can also be found on the Overview Report.
Click the Unsubscribe from Weekly Email button on the Overview Report to STOP receiving weekly report emails.
Click the Subscribe to Weekly Email button on the Overview Report to START receiving weekly report emails.
IMAGINE MATH: REPORTING
4
Last Updated 1/17/2017
©2017 IMAGINE LEARNING, INC. ALL RIGHTS RESERVED.
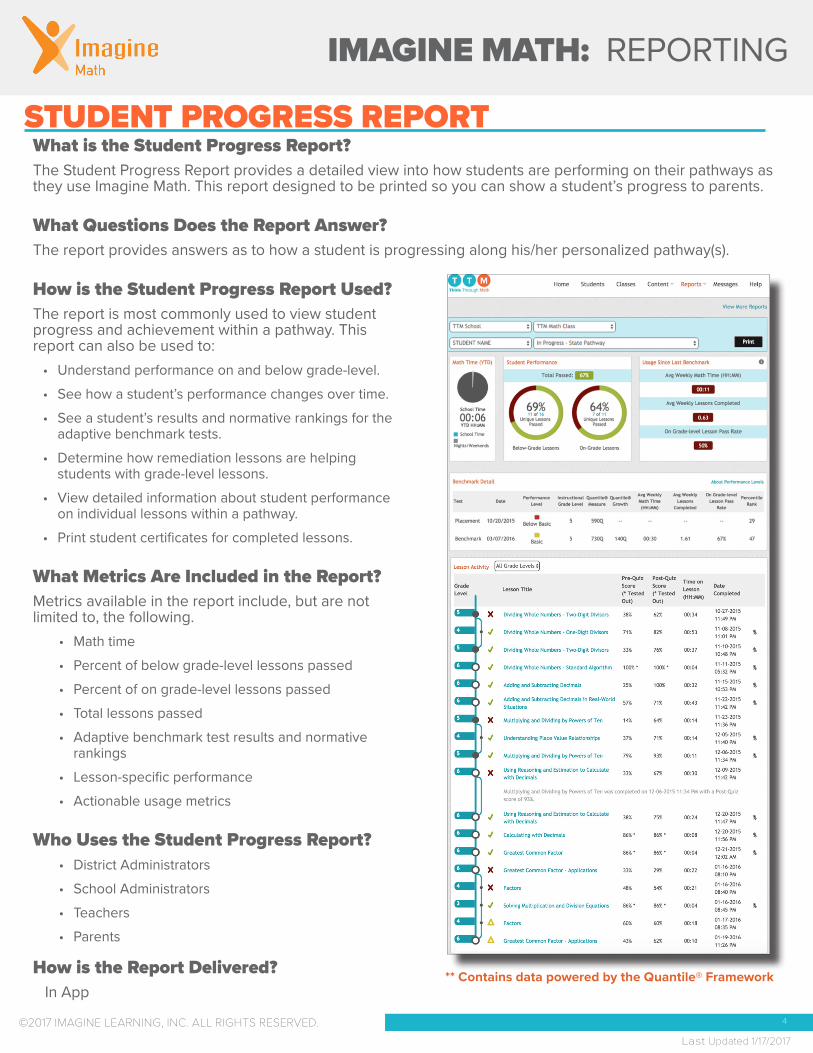
STUDENT PROGRESS REPORT
How is the Student Progress Report Used? The report is most commonly used to view student progress and achievement within a pathway. This report can also be used to:
• Understand performance on and below grade-level.
• See how a student’s performance changes over time.
• See a student’s results and normative rankings for the adaptive benchmark tests.
• Determine how remediation lessons are helping students with grade-level lessons.
• View detailed information about student performance on individual lessons within a pathway.
• Print student certificates for completed lessons.
What Metrics Are Included in the Report? Metrics available in the report include, but are not limited to, the following.
• Math time
• Percent of below grade-level lessons passed
• Percent of on grade-level lessons passed
• Total lessons passed
• Adaptive benchmark test results and normative rankings
• Lesson-specific performance
• Actionable usage metrics
Who Uses the Student Progress Report? • District Administrators
• School Administrators
• Teachers
• Parents
What is the Student Progress Report? The Student Progress Report provides a detailed view into how students are performing on their pathways as they use Imagine Math. This report designed to be printed so you can show a student’s progress to parents.
What Questions Does the Report Answer? The report provides answers as to how a student is progressing along his/her personalized pathway(s).
** Contains data powered by the Quantile® FrameworkHow is the Report Delivered? In App
IMAGINE MATH: REPORTING
5
Last Updated 1/17/2017
©2017 IMAGINE LEARNING, INC. ALL RIGHTS RESERVED.
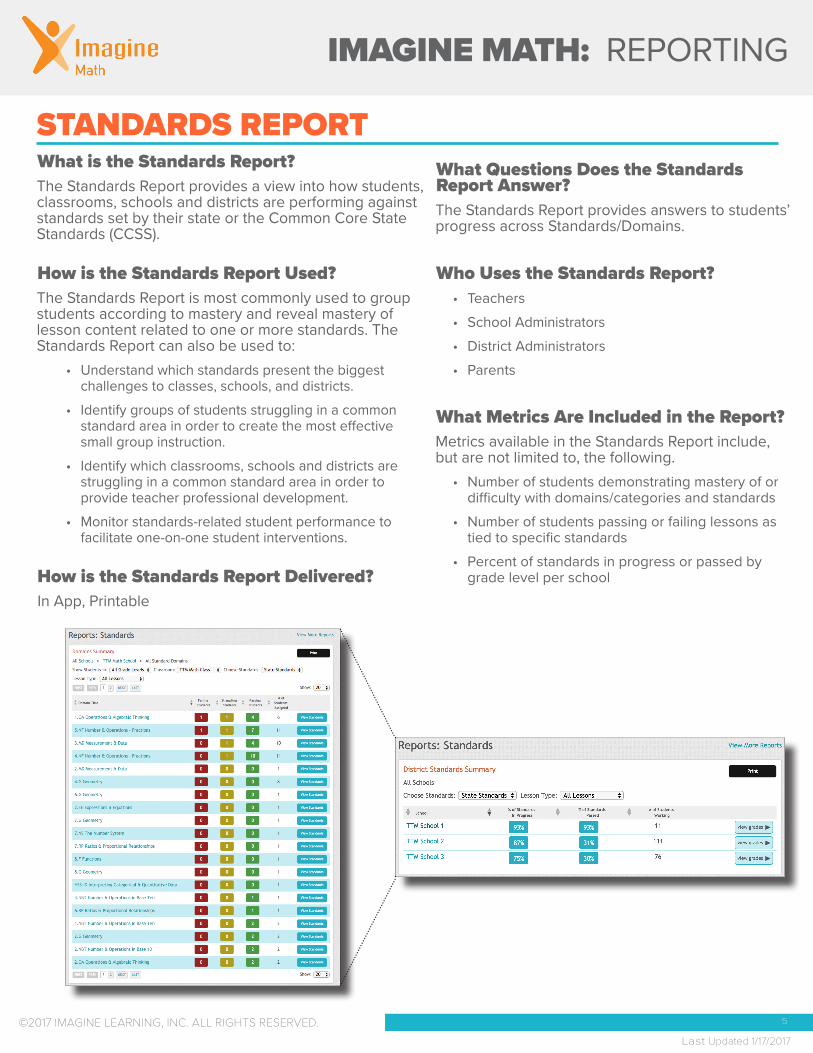
What Questions Does the Standards Report Answer? The Standards Report provides answers to students’ progress across Standards/Domains.
Who Uses the Standards Report? • Teachers
• School Administrators
• District Administrators
• Parents
What Metrics Are Included in the Report? Metrics available in the Standards Report include, but are not limited to, the following.
• Number of students demonstrating mastery of or difficulty with domains/categories and standards
• Number of students passing or failing lessons as tied to specific standards
• Percent of standards in progress or passed by grade level per school
STANDARDS REPORTWhat is the Standards Report? The Standards Report provides a view into how students, classrooms, schools and districts are performing against standards set by their state or the Common Core State Standards (CCSS).
How is the Standards Report Used? The Standards Report is most commonly used to group students according to mastery and reveal mastery of lesson content related to one or more standards. The Standards Report can also be used to:
• Understand which standards present the biggest challenges to classes, schools, and districts.
• Identify groups of students struggling in a common standard area in order to create the most effective small group instruction.
• Identify which classrooms, schools and districts are struggling in a common standard area in order to provide teacher professional development.
• Monitor standards-related student performance to facilitate one-on-one student interventions.
How is the Standards Report Delivered? In App, Printable
IMAGINE MATH: REPORTING
6
Last Updated 1/17/2017
©2017 IMAGINE LEARNING, INC. ALL RIGHTS RESERVED.
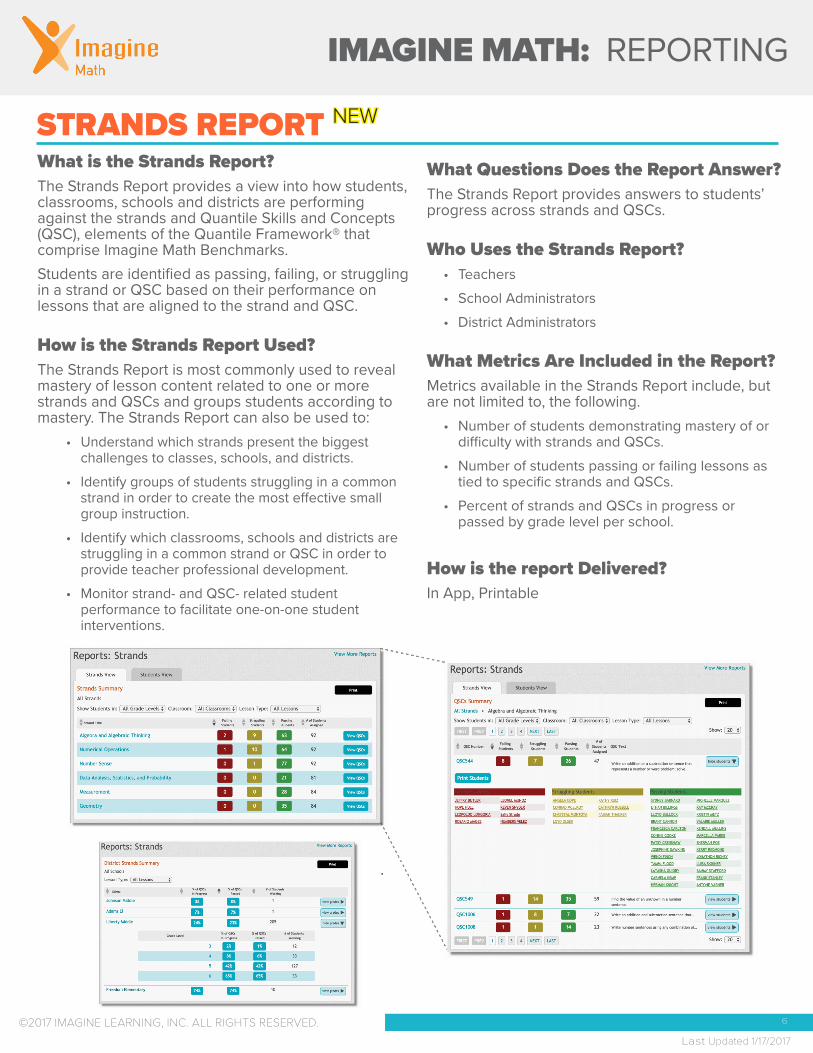
STRANDS REPORT NEWWhat Questions Does the Report Answer? The Strands Report provides answers to students’ progress across strands and QSCs.
Who Uses the Strands Report? • Teachers
• School Administrators
• District Administrators
What Metrics Are Included in the Report? Metrics available in the Strands Report include, but are not limited to, the following.
• Number of students demonstrating mastery of or difficulty with strands and QSCs.
• Number of students passing or failing lessons as tied to specific strands and QSCs.
• Percent of strands and QSCs in progress or passed by grade level per school.
How is the report Delivered? In App, Printable
What is the Strands Report? The Strands Report provides a view into how students, classrooms, schools and districts are performing against the strands and Quantile Skills and Concepts (QSC), elements of the Quantile Framework® that comprise Imagine Math Benchmarks. Students are identified as passing, failing, or struggling in a strand or QSC based on their performance on lessons that are aligned to the strand and QSC.
How is the Strands Report Used? The Strands Report is most commonly used to reveal mastery of lesson content related to one or more strands and QSCs and groups students according to mastery. The Strands Report can also be used to:
• Understand which strands present the biggest challenges to classes, schools, and districts.
• Identify groups of students struggling in a common strand in order to create the most effective small group instruction.
• Identify which classrooms, schools and districts are struggling in a common strand or QSC in order to provide teacher professional development.
• Monitor strand- and QSC- related student performance to facilitate one-on-one student interventions.
IMAGINE MATH: REPORTING
7
Last Updated 1/17/2017
©2017 IMAGINE LEARNING, INC. ALL RIGHTS RESERVED.
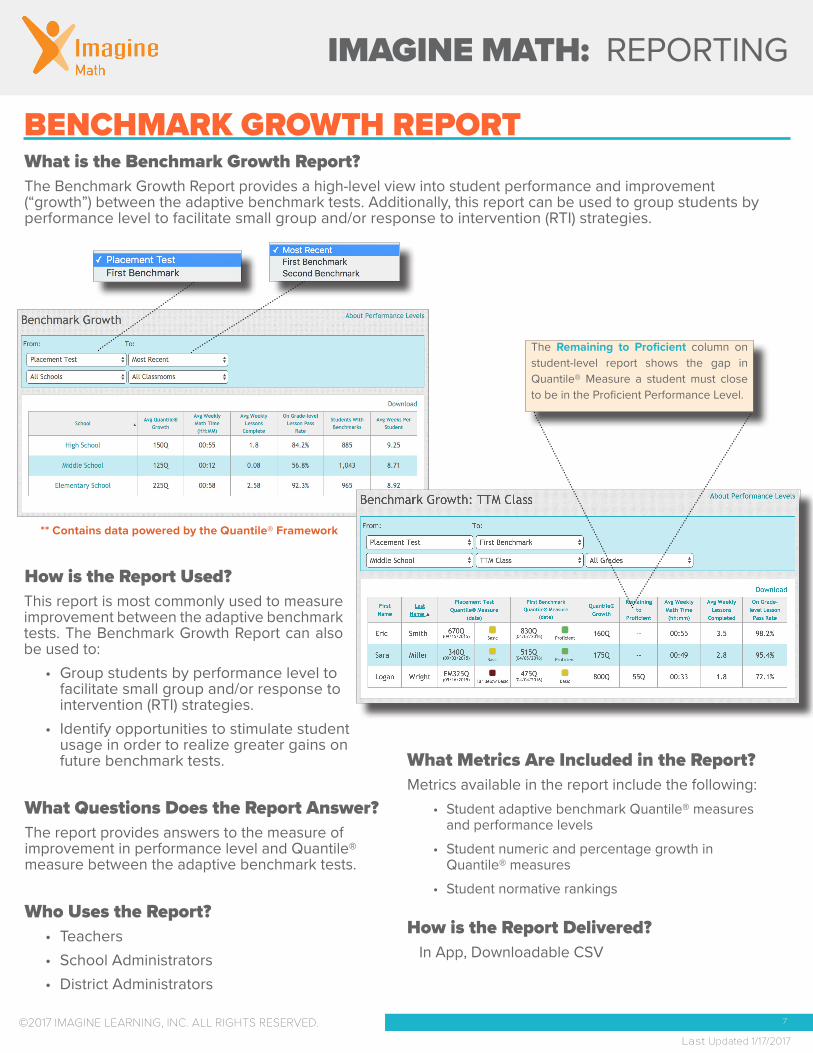
BENCHMARK GROWTH REPORTWhat is the Benchmark Growth Report? The Benchmark Growth Report provides a high-level view into student performance and improvement (“growth”) between the adaptive benchmark tests. Additionally, this report can be used to group students by performance level to facilitate small group and/or response to intervention (RTI) strategies.
What Metrics Are Included in the Report?Metrics available in the report include the following:
• Student adaptive benchmark Quantile® measures and performance levels
• Student numeric and percentage growth in Quantile® measures
• Student normative rankings
How is the Report Delivered? In App, Downloadable CSV
How is the Report Used? This report is most commonly used to measure improvement between the adaptive benchmark tests. The Benchmark Growth Report can also be used to:
• Group students by performance level to facilitate small group and/or response to intervention (RTI) strategies.
• Identify opportunities to stimulate student usage in order to realize greater gains on future benchmark tests.
What Questions Does the Report Answer? The report provides answers to the measure of improvement in performance level and Quantile® measure between the adaptive benchmark tests.
Who Uses the Report? • Teachers• School Administrators• District Administrators
** Contains data powered by the Quantile® Framework
The Remaining to Proficient column on student-level report shows the gap in Quantile® Measure a student must close to be in the Proficient Performance Level.
IMAGINE MATH: REPORTING
8
Last Updated 1/17/2017
©2017 IMAGINE LEARNING, INC. ALL RIGHTS RESERVED.
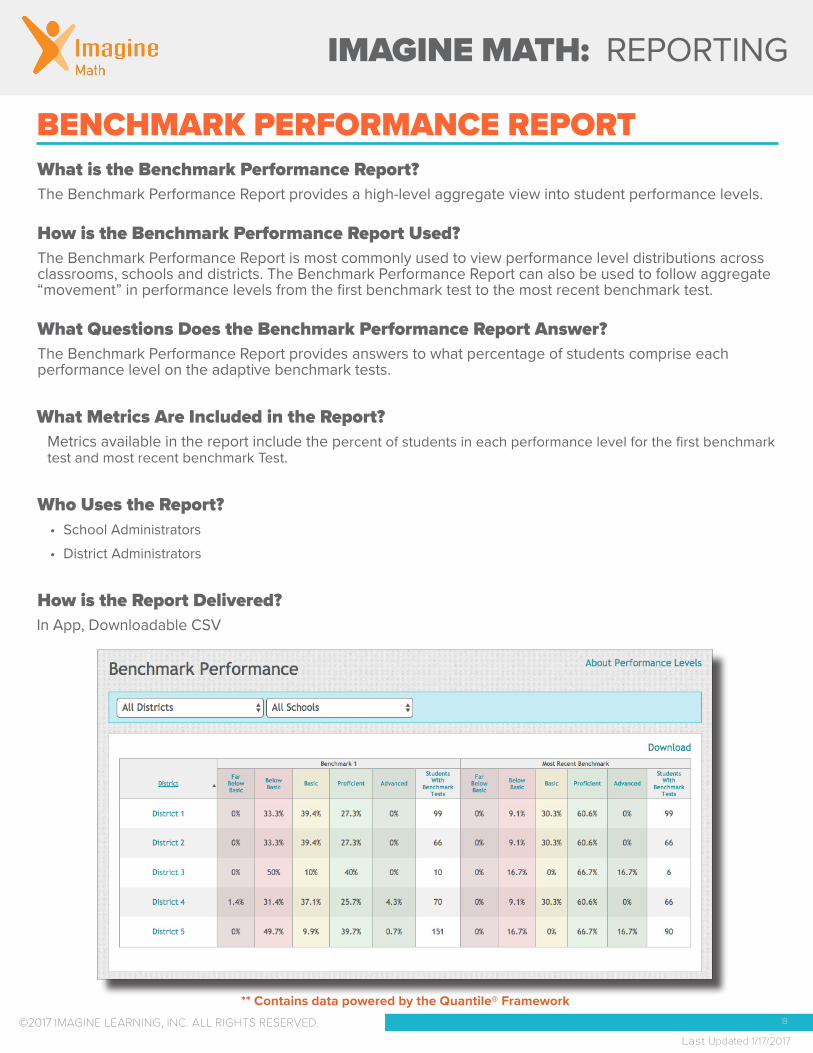
BENCHMARK PERFORMANCE REPORTWhat is the Benchmark Performance Report? The Benchmark Performance Report provides a high-level aggregate view into student performance levels.
How is the Benchmark Performance Report Used? The Benchmark Performance Report is most commonly used to view performance level distributions across classrooms, schools and districts. The Benchmark Performance Report can also be used to follow aggregate “movement” in performance levels from the first benchmark test to the most recent benchmark test.
What Questions Does the Benchmark Performance Report Answer? The Benchmark Performance Report provides answers to what percentage of students comprise each performance level on the adaptive benchmark tests.
What Metrics Are Included in the Report? Metrics available in the report include the percent of students in each performance level for the first benchmark test and most recent benchmark Test.
Who Uses the Report? • School Administrators
• District Administrators
How is the Report Delivered? In App, Downloadable CSV
** Contains data powered by the Quantile® Framework
IMAGINE MATH: REPORTING
9
Last Updated 1/17/2017
©2017 IMAGINE LEARNING, INC. ALL RIGHTS RESERVED.
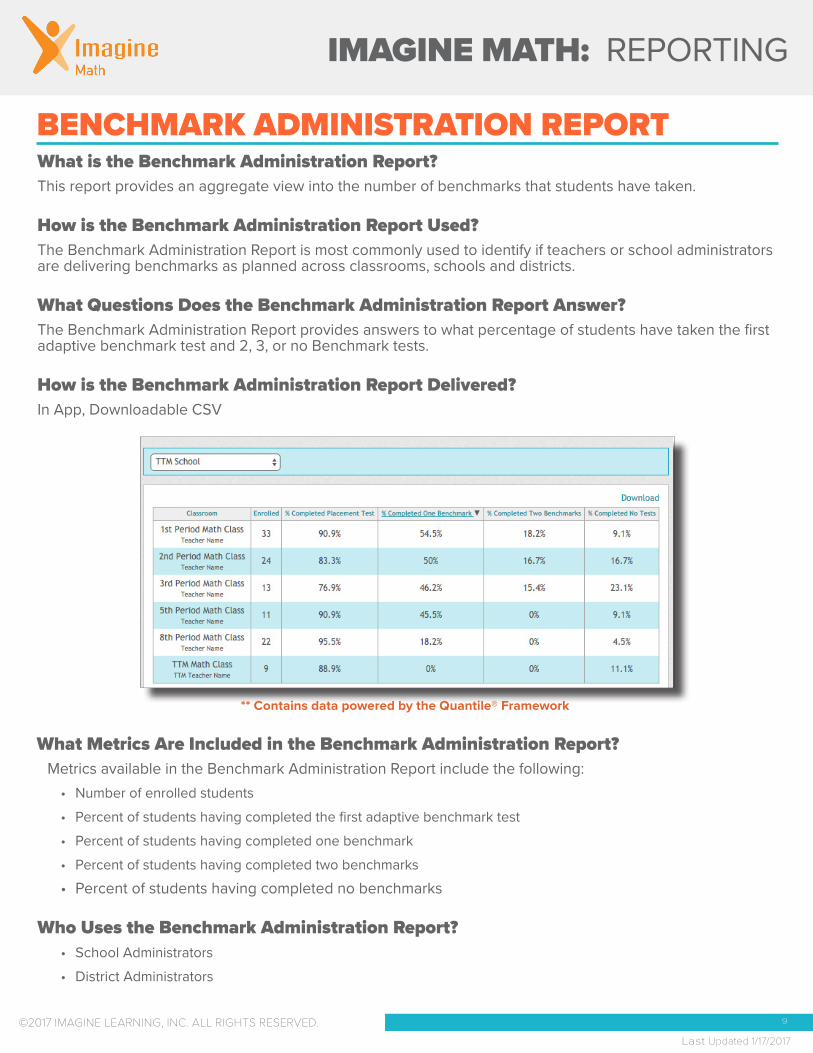
What Metrics Are Included in the Benchmark Administration Report? Metrics available in the Benchmark Administration Report include the following:
• Number of enrolled students
• Percent of students having completed the first adaptive benchmark test
• Percent of students having completed one benchmark
• Percent of students having completed two benchmarks
• Percent of students having completed no benchmarks
Who Uses the Benchmark Administration Report? • School Administrators
• District Administrators
BENCHMARK ADMINISTRATION REPORTWhat is the Benchmark Administration Report? This report provides an aggregate view into the number of benchmarks that students have taken.
How is the Benchmark Administration Report Used? The Benchmark Administration Report is most commonly used to identify if teachers or school administrators are delivering benchmarks as planned across classrooms, schools and districts.
What Questions Does the Benchmark Administration Report Answer? The Benchmark Administration Report provides answers to what percentage of students have taken the first adaptive benchmark test and 2, 3, or no Benchmark tests.
How is the Benchmark Administration Report Delivered? In App, Downloadable CSV
** Contains data powered by the Quantile® Framework
IMAGINE MATH: REPORTING
10
Last Updated 1/17/2017
©2017 IMAGINE LEARNING, INC. ALL RIGHTS RESERVED.
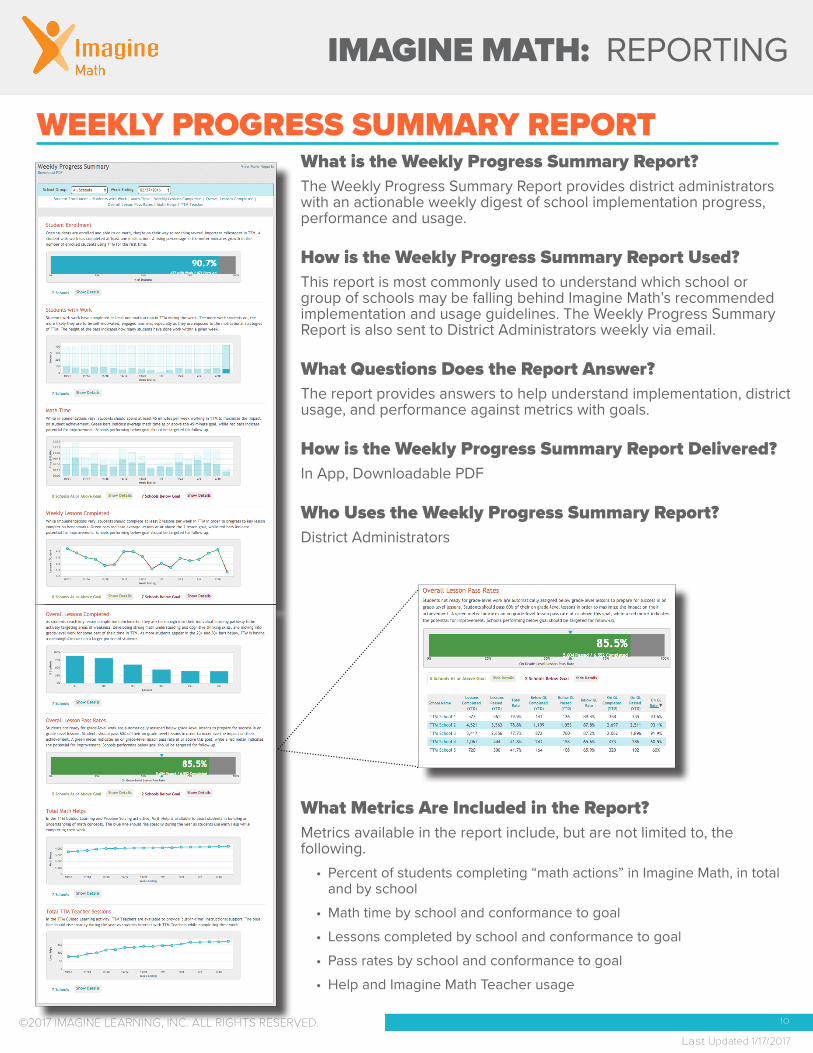
What Metrics Are Included in the Report? Metrics available in the report include, but are not limited to, the following.
• Percent of students completing “math actions” in Imagine Math, in total and by school
• Math time by school and conformance to goal
• Lessons completed by school and conformance to goal
• Pass rates by school and conformance to goal
• Help and Imagine Math Teacher usage
WEEKLY PROGRESS SUMMARY REPORTWhat is the Weekly Progress Summary Report? The Weekly Progress Summary Report provides district administrators with an actionable weekly digest of school implementation progress, performance and usage.
How is the Weekly Progress Summary Report Used? This report is most commonly used to understand which school or group of schools may be falling behind Imagine Math’s recommended implementation and usage guidelines. The Weekly Progress Summary Report is also sent to District Administrators weekly via email.
What Questions Does the Report Answer? The report provides answers to help understand implementation, district usage, and performance against metrics with goals.
How is the Weekly Progress Summary Report Delivered? In App, Downloadable PDF
Who Uses the Weekly Progress Summary Report?District Administrators
IMAGINE MATH: REPORTING
11
Last Updated 1/17/2017
©2017 IMAGINE LEARNING, INC. ALL RIGHTS RESERVED.
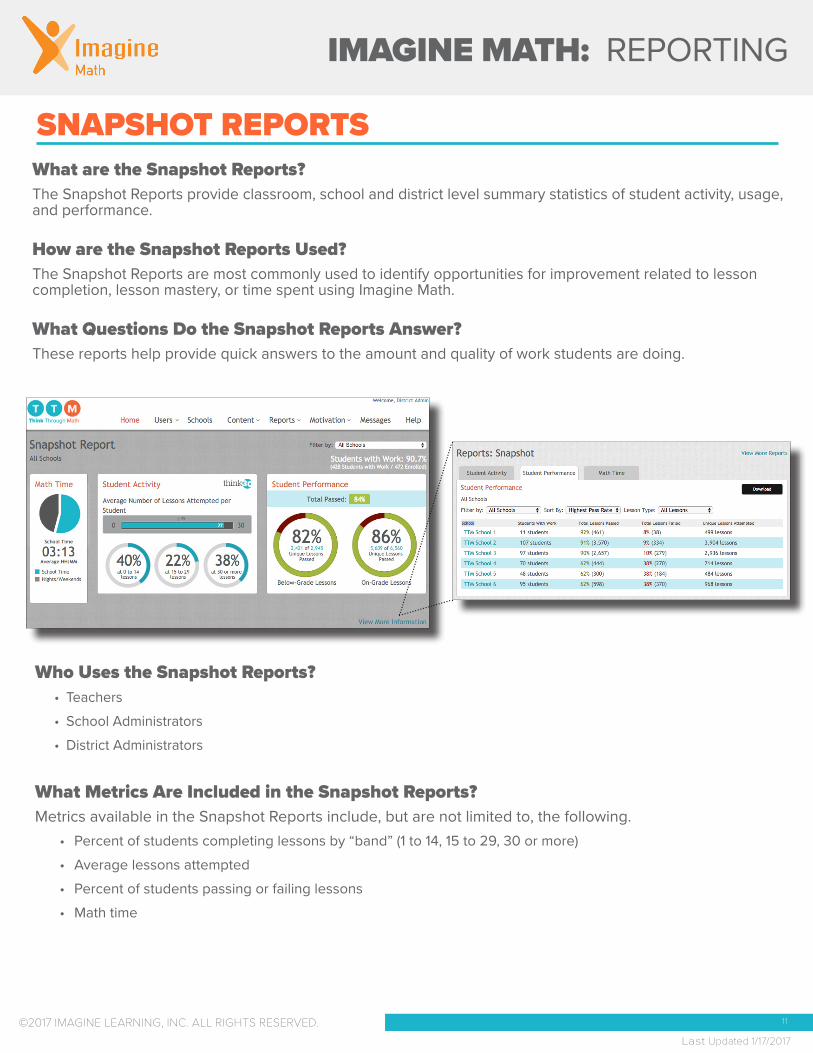
Who Uses the Snapshot Reports? • Teachers
• School Administrators
• District Administrators
What Metrics Are Included in the Snapshot Reports?Metrics available in the Snapshot Reports include, but are not limited to, the following.
• Percent of students completing lessons by “band” (1 to 14, 15 to 29, 30 or more)
• Average lessons attempted
• Percent of students passing or failing lessons
• Math time
SNAPSHOT REPORTSWhat are the Snapshot Reports?The Snapshot Reports provide classroom, school and district level summary statistics of student activity, usage, and performance.
How are the Snapshot Reports Used? The Snapshot Reports are most commonly used to identify opportunities for improvement related to lesson completion, lesson mastery, or time spent using Imagine Math.
What Questions Do the Snapshot Reports Answer? These reports help provide quick answers to the amount and quality of work students are doing.
IMAGINE MATH: REPORTING
12
Last Updated 1/17/2017
©2017 IMAGINE LEARNING, INC. ALL RIGHTS RESERVED.
DASHBOARDS
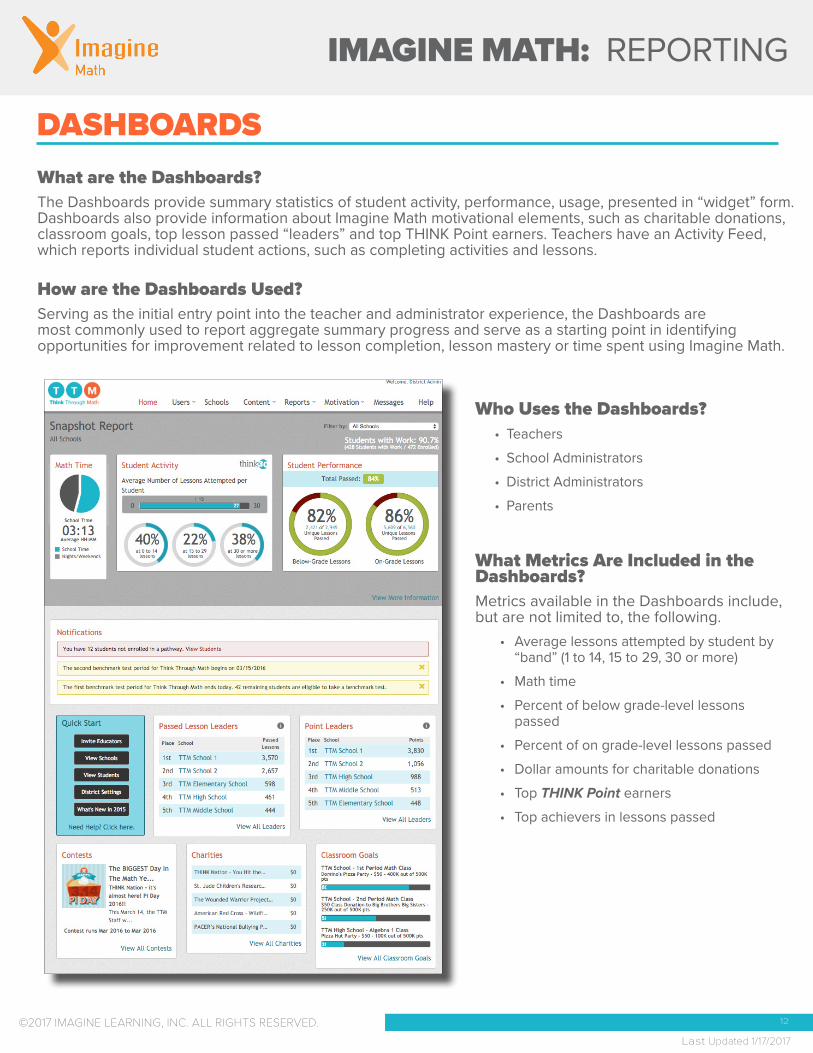
Who Uses the Dashboards? • Teachers
• School Administrators
• District Administrators
• Parents
What Metrics Are Included in the Dashboards?Metrics available in the Dashboards include, but are not limited to, the following.
• Average lessons attempted by student by “band” (1 to 14, 15 to 29, 30 or more)
• Math time
• Percent of below grade-level lessons passed
• Percent of on grade-level lessons passed
• Dollar amounts for charitable donations
• Top THINK Point earners
• Top achievers in lessons passed
What are the Dashboards?The Dashboards provide summary statistics of student activity, performance, usage, presented in “widget” form. Dashboards also provide information about Imagine Math motivational elements, such as charitable donations, classroom goals, top lesson passed “leaders” and top THINK Point earners. Teachers have an Activity Feed, which reports individual student actions, such as completing activities and lessons.
How are the Dashboards Used? Serving as the initial entry point into the teacher and administrator experience, the Dashboards are most commonly used to report aggregate summary progress and serve as a starting point in identifying opportunities for improvement related to lesson completion, lesson mastery or time spent using Imagine Math.
IMAGINE MATH: REPORTING
13
Last Updated 1/17/2017
©2017 IMAGINE LEARNING, INC. ALL RIGHTS RESERVED.
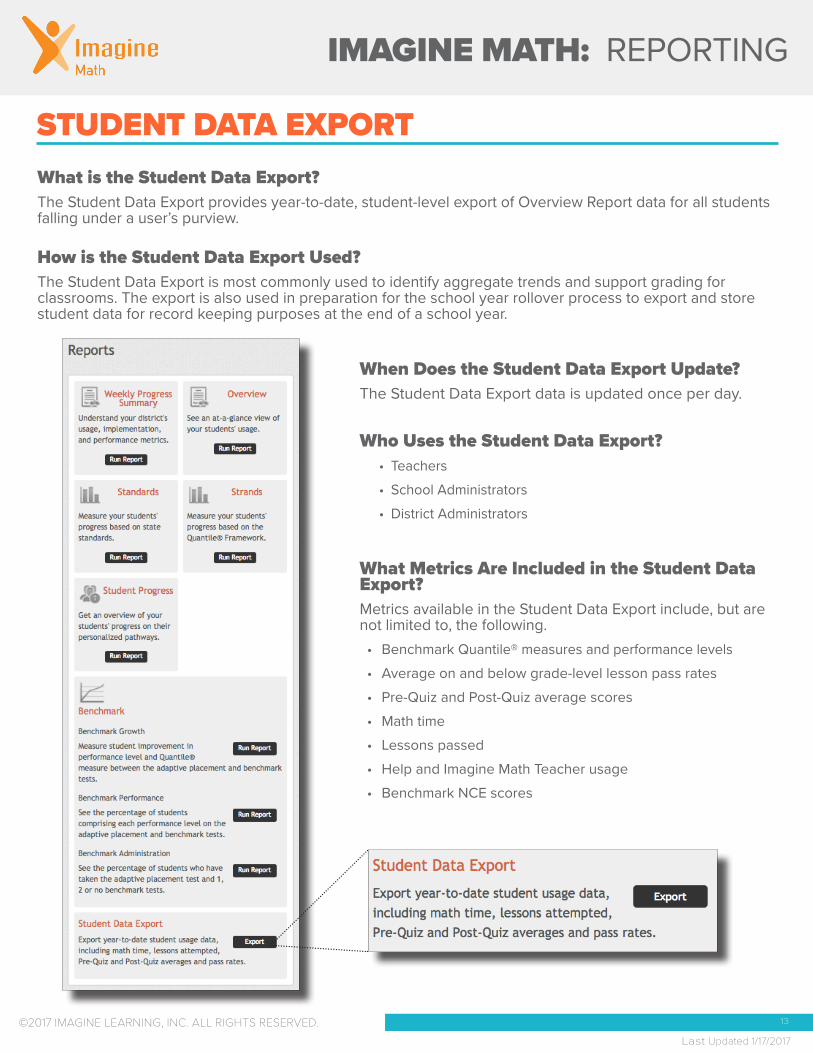
STUDENT DATA EXPORT
When Does the Student Data Export Update?The Student Data Export data is updated once per day.
Who Uses the Student Data Export? • Teachers
• School Administrators
• District Administrators
What Metrics Are Included in the Student Data Export?Metrics available in the Student Data Export include, but are not limited to, the following.• Benchmark Quantile® measures and performance levels
• Average on and below grade-level lesson pass rates
• Pre-Quiz and Post-Quiz average scores
• Math time
• Lessons passed
• Help and Imagine Math Teacher usage
• Benchmark NCE scores
What is the Student Data Export?The Student Data Export provides year-to-date, student-level export of Overview Report data for all students falling under a user’s purview.
How is the Student Data Export Used? The Student Data Export is most commonly used to identify aggregate trends and support grading for classrooms. The export is also used in preparation for the school year rollover process to export and store student data for record keeping purposes at the end of a school year.