ILVER THE FIRST MOVER ADVANTAGE - Defiance SilverFavourable mining jurisdictions, Silver and Gold...
26
SILVER, THE FIRST MOVER ADVANTAGE TSXV:DEF OTC:DNCVF
Transcript of ILVER THE FIRST MOVER ADVANTAGE - Defiance SilverFavourable mining jurisdictions, Silver and Gold...

SILVER, THE FIRST MOVER ADVANTAGE TSXV:DEF OTC:DNCVF

DISCLAIMER
FORWARD-LOOKING INFORMATION AND STATEMENTS
This presentation contains “forward-looking information” and “forward-looking statements” within themeaning of applicable securities laws. This information and statements address future activities, events,plans, developments and projections. All statements, other than statements of historical fact, constituteforward-looking statements or forward-looking information. Such forward-looking information andstatements are frequently identified by words such as “may”, “will”, “should”, “anticipate”, “plan”, “expect”,“believe”, “estimate”, “intend” and similar terminology and reflect assumptions, estimates, opinions andanalysis made by management of Defiance in light of its experience, current conditions, expectations offuture developments and other factors which it believes to be reasonable and relevant. Forward-lookinginformation and statements involve known and unknown risks and uncertainties that may causeDefiance’s actual results, performance and achievements to differ materially from those expressed orimplied by the forward-looking information and statements and accordingly, undue reliance should not beplaced thereon. Risks and uncertainties that may cause actual results to vary include but are not limitedto the speculative nature of mineral exploration and development, including the uncertainty of reserveand resource estimates; operational and technical difficulties; the availability of suitable financingalternatives; fluctuations in gold and other commodity prices; changes to and compliance with applicablelaws and regulations, including environmental laws and obtaining requisite permits; political, economicand other risks arising from Defiance’s South American activities; fluctuations in foreign exchange rates;as well as other risks and uncertainties which are more fully described in our annual and quarterlyManagement’s Discussion and Analysis and in other filings made by us with Canadian securities regulatoryauthorities and available at www.sedar.com. Defiance disclaims any obligation to update or revise anyforward-looking information or statements except as may be required by law.
NI43-101 DISCLOSURE:
Peter J. Hawley, P. Geo., a Qualified Person under the meaning of Canadian National Instrument 43-101 is responsible for the technical
information in this presentation.
2
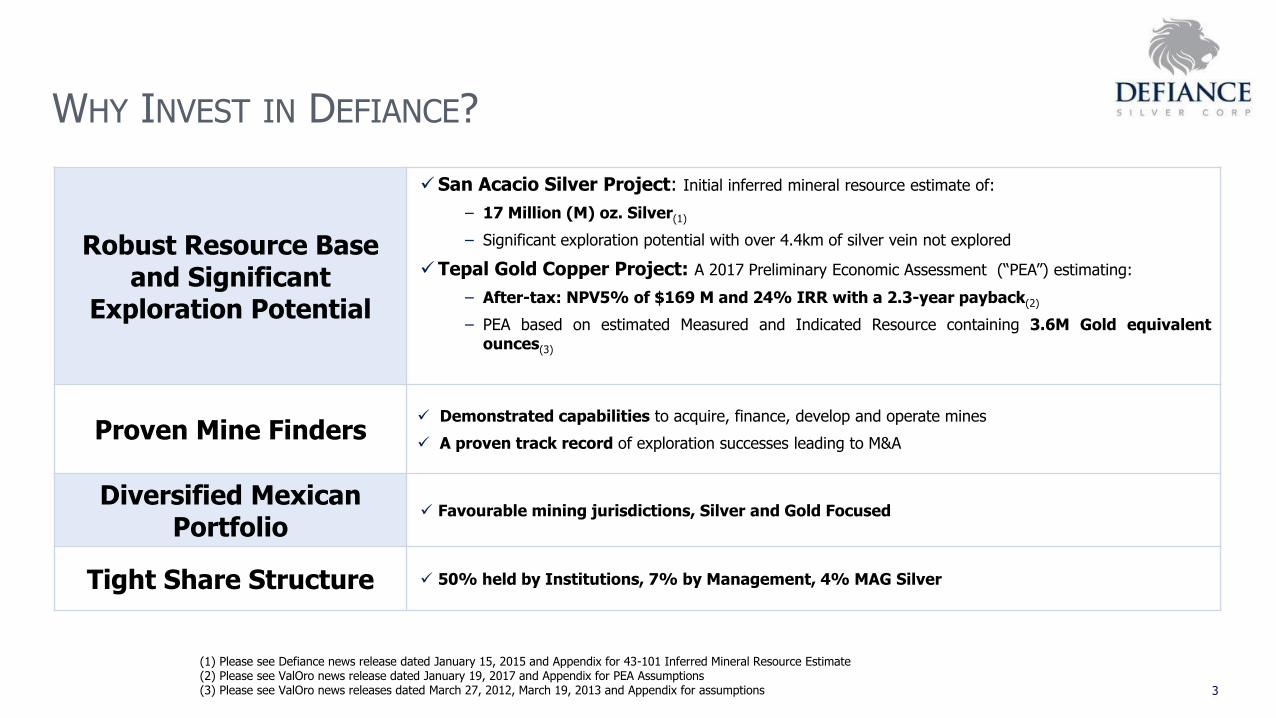
WHY INVEST IN DEFIANCE?
Robust Resource Baseand Significant
Exploration Potential
✓San Acacio Silver Project: Initial inferred mineral resource estimate of:
– 17 Million (M) oz. Silver(1)
– Significant exploration potential with over 4.4km of silver vein not explored
✓Tepal Gold Copper Project: A 2017 Preliminary Economic Assessment (“PEA”) estimating:
– After-tax: NPV5% of $169 M and 24% IRR with a 2.3-year payback(2)
– PEA based on estimated Measured and Indicated Resource containing 3.6M Gold equivalentounces(3)
Proven Mine Finders✓ Demonstrated capabilities to acquire, finance, develop and operate mines
✓ A proven track record of exploration successes leading to M&A
Diversified Mexican Portfolio
✓ Favourable mining jurisdictions, Silver and Gold Focused
Tight Share Structure ✓ 50% held by Institutions, 7% by Management, 4% MAG Silver
3
(1) Please see Defiance news release dated January 15, 2015 and Appendix for 43-101 Inferred Mineral Resource Estimate(2) Please see ValOro news release dated January 19, 2017 and Appendix for PEA Assumptions(3) Please see ValOro news releases dated March 27, 2012, March 19, 2013 and Appendix for assumptions

PROVEN MINE FINDERS
Peter J. Hawley, BSc, BEng, PGeo.
CEO
Worked with Teck, Noranda, Placer Dome and Barrick Gold,Director of Americas Silver Corp., and Chairman of Scorpio Gold Corporation.
Chris D. Wright, BA
Chairman
President and Director of Windermere Capital, an investment firm and manager of two private investment funds; the Navigator and Breakaway Strategic Resource Funds, both of which are significant shareholders of Defiance.
Randy V. J. Smallwood, P. Eng.
Director
Co-founder and Chief Executive Officer of Wheaton Precious Metals. Worked with Homestake Mining Company, Teck Corp. and Westmin Resources Limited.
Darrell Rader, BBA DirectorFounder of Defiance Silver, raised over $100 million for mineral exploration and development. Currently the President and CEO of Mexico-focused Minaurum Gold Inc.
Paul Smith, MADirectorMost recently he was a founding shareholder and Finance Director of Ocean Partners Holdings Limited, a global trader of copper, zinc and lead concentrates. Career in non-ferrous mining and smelting industry working with Rio Tinto Zinc, Pasminco, Mount Isa Mines and Pechiney World Trade in the UK and internationally.
Ron Sowerby, CA DirectorDirector of Glentel Inc. which subsequently was purchased by Bell Inc. for $594 million in May 2015. Comptroller and Chief Financial Officer of TCG International Inc. (Trans Canada Glass Ltd.)
Dunham L. Craig, P.GeoDirector
Worked with Cominco Exploration Ltd., Kennecott Canada Inc., Glencairn Gold and most notably was vice president of exploration and corporate development for Wheaton River, and past President and CEO of Valoro.
Gillian Kearvell, B.Sc.
VP Exploration
Geologist with over 30 years of experience working with junior and senior mining companies. Worked at Teck Resources’ San Nicolas VMS deposit in Zacatecas State and managed the pre-feasibility field program at Goldcorp’s Los Filos Mine.
4

TIGHT SHARE STRUCTURE
Symbol DEF:TSX.V ; DNCVF:OTC ; D4E:Frankfurt
($CDN)
Shares Issued 132,914,557
Options 4,756,011Price Range: $0.10 - $1.13
Warrants 25,564,603Pricing: $0.18 - $1.41
Market Cap $25M
52 Week Hi-Low $0.38 - $0.16
MAG Silver Corp. 4%
Institutional Ownership 50%
5

DIVERSIFIED PROJECT PORTFOLIO
San Acacio Project Tepal Project
Deposit TypeSilver-Gold-Copper
Epithermal Vein Gold-Copper Porphyry
StageExploration Drilling,
Initial 43-101 Inferred Resource
43-101 M&I Resource, PEA & PFS
43-101 Resource
17M oz Silver1.8M oz Gold,
813,000,000lbs Copper
Location Zacatecas, MX Michoacan, MX
Infrastructure
Excellent with road, power grid, water and experienced Mexican
labour
Excellent with road, sea port access and low topographical
relief
Ownership Under Option 100%
6

SAN ACACIO PROJECT
BILLION OZ ZACATECAS SILVER CAMP
7
✓ Four Major Vein Systems:
✓ Veta Grande Vein: Over 150M oz Ag historically produced from only a small portion of the Veta Grande vein. Defiance controls 5.6km of the 8.5km Veta Grande Vein including 3.9km of the vein that has never been explored. The remainder of the vein not controlled by Defiance is currently in production.
✓ Malanoche Vein; Over 50M oz Ag historically produced. Currently being mined by Capstone Mining Corp. (2018 Production: 34M lbs Cu, 15M lbs Zn, 1.15M Oz Ag)
✓ Panuco Vein; Controlled by Pan American Silver and Santacruz Silver Mining
✓ El Orito; Historical Producer, Currently being mined by Endeavour Silver
✓ San Acacio Deposit: 1.2km of Defiance’s portion of the Veta
Grande vein contains the 17M oz San Acacio Silver Deposit. Current resource doesn’t include base metals nor over 5000m of successful drilling since the original calculation.
✓ 135,000ha Regional Database; Defiance owns a database MAG
Silver spent over $10 million to assemble including; 90 holes, core facility, extensive geochemistry, geophysics, satellite imagery, and detailed drill logs stretching from the Zacatecas Silver District to the Fresnillo Silver District.

SAN ACACIO PROJECT
VETA GRANDE VEIN
8
Veta Grande Vein
Average Historical Width of 12m

SAN ACACIO PROJECTTHREE SIGNIFICANT EXPLORATION TARGETS
✓ Resource Expansion Drilling.
✓ First 8 step out holes extended mineralization by 140m below the base of the initial resource.
✓ Holes 9-11 extended mineralization over 550m to the southeast of the first 8 holes drilled, and also extendedmineralization 140m below the initial resource.
✓ 3.9km of Unexplored Veta Grande Vein Extension
✓ Surface mapping and sampling has identified the vein over 3.9km.
✓ No Drilling nor geophysics has been conducted on the extension.
✓ Veta Grande Extension is exposed at a higher level in the system
✓ Major Copper Target on Underexplored 500m portion of Veta Grande Vein
✓ Induced Polarization (IP) geophysical survey defined a large target.
✓ An Atomic Energy Resonance Imaging (AERI) geophysical program identified numerous anomalies including one coincident with the IP anomaly that is a high priority for drilling.
• Shallow drilling outlined high-level epithermal mineralization under-explored portion that warrants follow up.
9
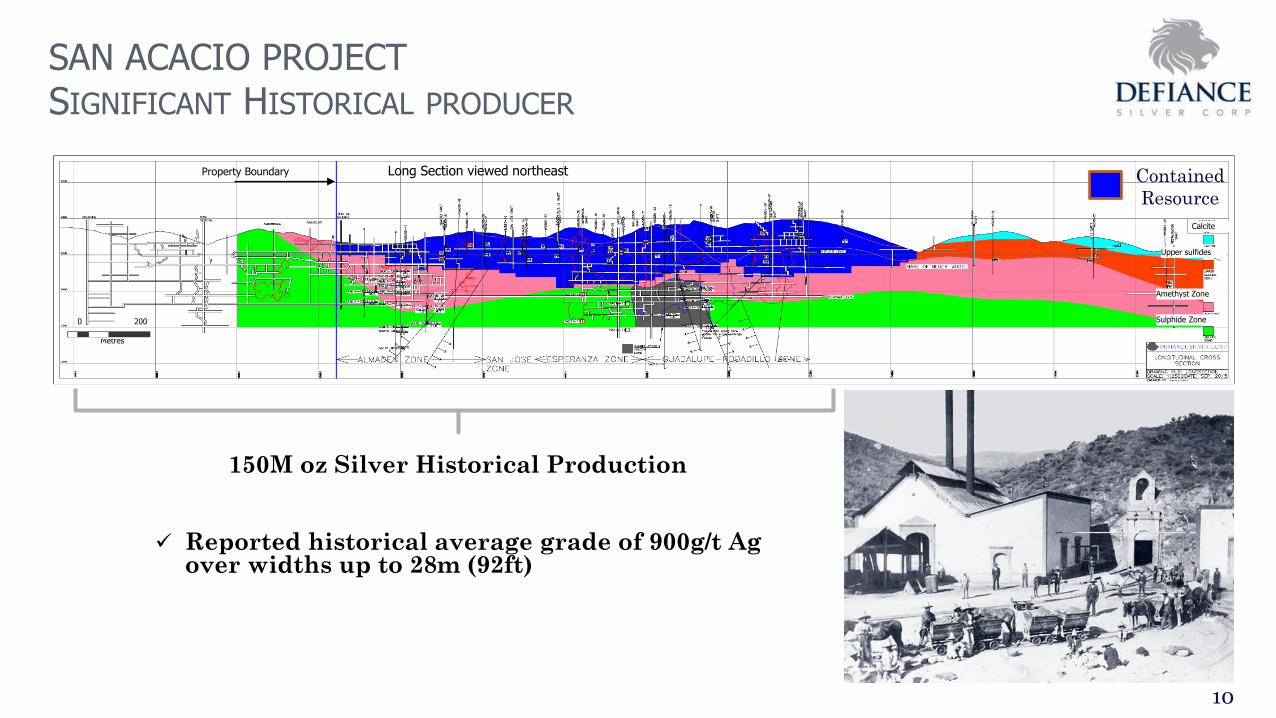
Property Boundary
Calcite
Upper sulfides
Amethyst Zone
Sulphide Zone
10
0 200
Metres
Long Section viewed northeast
150M oz Silver Historical Production
SAN ACACIO PROJECT
SIGNIFICANT HISTORICAL PRODUCER
Contained
Resource
✓ Reported historical average grade of 900g/t Ag over widths up to 28m (92ft)

11
SAN ACACIO PROJECT
RESOURCE EXPANSION DRILLING
Hole_ID Length (m) Ag g/t Au g/t AgEq g/t
SA14-01 8.10 222.12 0.22 268.13
SA14-02 3.20 419.09 0.82 499.43
SA14-03 8.30 42.89 0.92 278.33
SA14-04 6.10 138.35 0.80 340.4
SA15-07 3.60 211.49 0.14 234.17
SA15-08 7.25 631.46 0.43 675.58
SA15-10 2.1 283.31 0.17 337.8
SA17-12 27.03 148.2 0.29 202.99
Includes 7.58 212.9 0.05 230.03
Includes 5.00 230.7 0.51 354.97
Includes 6.05 122.1 0.74 222.59
SA17-13 10.00 171.2 0.08 204.65
Includes 3.00 372.2 0.10 404.03
Includes 5.00 104.4 0.08 136.15
SA17-14 0.60 139.5 0.40 276.74
SA17-14 0.88 213.8 0.30 236.21
SA17-14 0.30 477.6 0.46 520.27
SA17-15 3.18 285.0 0.02 296.30
SA17-16 6.18 7.4 0.25 65.88
SA17-17 1.01 33.9 0.12 187.85
✓ 17M oz Ag Resource based on 44 Holes totaling 10,200m of drilling
✓ 5000m of Drilling Completed Since Resource Calculation
✓ Significant Intersections outside of resource prove mineralization is
open to depth and along strike
✓ Drilling has returned multiple percent Zinc, Lead and Copper, none
of which are included in the initial resource

SAN ACACIO PROJECT3.9KM OF UNEXPLORED VETA GRANDE VEIN EXTENSION
12
Dr. Peter Megaw, Chief
Exploration Officer MAG
Silver Corp.
“…MAG chose to partner with Defiance because of our long-held
interest in the exploration potential of the Veta Grande Vein, the second most important vein in the billion-ounce Zacatecas silver district. A number of high-grade ore-shoots have been found along
its length and the ability to expand exploration to a
continuous 5.6 km stretch of this historically under-explored vein
greatly enhances the potential for discovering more. This strategic
interest in Defiance provides MAG with exposure to the upside
of future discoveries as their exploration of this important vein
advances.”

IP SurveyArea
Property Boundary
Calcite
Upper sulfides
Amethyst Zone
Sulphide Zone
SAN ACACIO PROJECTLARGE IP ANOMALY IDENTIFIED ON 500M OF UNDEREXPLORED VEIN
13
Plan View
A SignificantAnomaly
300m wide.Open on strike and at depth
Cross Section Oblique View
High Chargeability Values
Detected
Area of current resource
3D IP Chargeability Inversion Voxel
E
0 200
Metres
Long Section viewed northeast

SAN ACACIO PROJECTCOINCIDENT AERI ANOMALY ON UNDEREXPLORED 500M OF VEIN
14
Atomic Energy Resonance Imaging Survey
✓ CoIncident anomaly confirms IP Anomaly
✓ Anomaly measures 400m in width, 300m in length, and is open to over 1km in depth
✓ Shape, size and mineral zonation compares favourably with geophysical images generated by Capstone Mining (Sept 17, 2018 NR)
Area of current resource
OPEN AERISurvey Area
Property Boundary
Calcite
Upper sulfides
Amethyst Zone
Sulphide Zone
Long Section viewed northeast

TEPAL GOLD-COPPER PROJECTTECHNICALLY & FINANCIALLY DE-RISKED
✓ 100% ownership
✓ Current M&I resource of 3.6 Moz. AuEq. (Using US$1285/oz. Au price, US$2.77/lb. Cu price)
✓ C$27M spent to-date
✓ Excellent infrastructure: road accessible with power, water, and port facilities
✓ Surface rights currently held by private landowners
✓ 50 megawatts available today (28 MW required for mine)
✓ Significant Exploration Target: Un-tested, recently discovered High Grade Gold Feeder System
15

TEPAL GOLD-COPPER PROJECTLOW COST & LARGE SCALE - 2017 PEA HIGHLIGHTS ($USD)
16
Pre-tax NPV5%
$299M
$0
$200
$400
$600
$800
$1,000
$1,200
0
50
100
150
200
250
300
1 2 3 4 5 6 7 8 9 10
Co
st/oz. (U
S$)
An
nu
al P
rod
uct
ion
(k
oz.
)
LOM Production & Cash Costs
Au AuEq. AISC/oz.
Using base case price assumptions of $1,250/oz. gold, $2.50/lb copper and $18.00/oz. silver, Tepal has an estimated $169 million after-tax NPV at a 5% discount rate, an attractive 24% after-tax IRR, and an after-tax payback period of 2.3 years. Base case LOM revenue split is 54% gold/43% copper/3% silver. The base case economic evaluation used metals prices that are close to current spot prices and near the median of current medium to long term analyst forecasts. After-tax economics were prepared using the following assumptions: a 2.5% Net Smelter Return (NSR) royalty, 0.5% Mexican royalty based on precious metals revenue, 7.5% Mexican royalty based on EBITDA, 12% annual depreciation rate, accumulated tax loss carry forward of US$22.4 million, and a 30% Mexican income tax rate. Please see Valoro News Release dated January 29, 2017
(1) Using US$1,250/oz. Au price, US$2.50/lb. Cu price and US$18.00/oz. Ag price(2) Cash cost includes all mining, milling & refining, transport, mine-level G&A, and royalty costs; net of byproduct credits
Pre-tax IRR
$36%
Payback
1.6 Yrs
Post-tax NPV5%
$169M
Post-tax IRR
$24%
Payback
2.3 Yrs
Production Averages LOM 10 Years
Au: 79,000 ozCu: 32Mlbs
LOM 10 Years Per Oz Au Cost
Avg cash cost $313/oz AISC $396/oz
Initial Capital Cost
$214M
LOM
10 Years
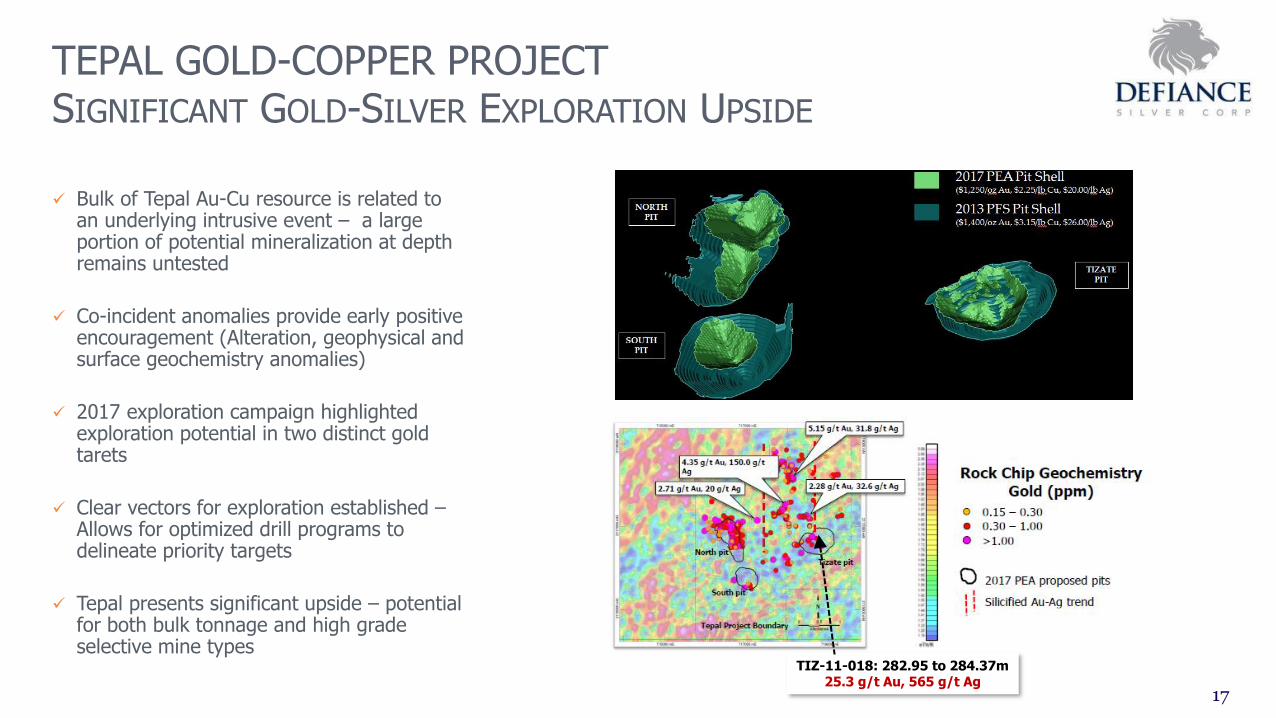
TEPAL GOLD-COPPER PROJECTSIGNIFICANT GOLD-SILVER EXPLORATION UPSIDE
✓ Bulk of Tepal Au-Cu resource is related to an underlying intrusive event – a large portion of potential mineralization at depth remains untested
✓ Co-incident anomalies provide early positive encouragement (Alteration, geophysical and surface geochemistry anomalies)
✓ 2017 exploration campaign highlighted exploration potential in two distinct gold tarets
✓ Clear vectors for exploration established –Allows for optimized drill programs to delineate priority targets
✓ Tepal presents significant upside – potential for both bulk tonnage and high grade selective mine types
17
TIZ-11-018: 282.95 to 284.37m25.3 g/t Au, 565 g/t Ag
CATALYSTS
SAN ACACIO Silver Project:
✓ Drill the IP/AERI anomaly along 500m under-explored strike of the Veta Grande Vein
✓ Conduct IP surveys and AERI surveys along 3.9km of unexplored Veta Grande Vein to define new anomalies targets
✓ Release updated NI-43-101 Resource Estimate
TEPAL Gold-Copper Project:
✓ Follow up new high-grade feeder exploration targets
18
19
Defiance Silver Corp
Suite 2300 – 1177 West Hastings Street
Vancouver, BC, V6E 2K3 Canada
www.defiancesilver.com
604 669 7315

APPENDIX

SAN ACACIO PROJECT43-101 COMPLIANT INFERRED MINERAL RESOURCE ESTIMATE
43-101 Inferred Mineral Resource Estimate
Vein Tonnes > Cut-off (tonnes)
Grade>Cut-off Contained Metal
Ag(g/t)
Au (g/t)
AgEq(g/t)
Ag (ozs)
Au (ozs) AgEq(ozs)
VETA G 2,150,000 192.43 0.19 204.66 13,302,000 10,000 14,147,000
VETA C 739,000 153.28 0.08 158.66 3,642,000 1,900 3,770,000
TOTAL 2,889,000 182.42 0.16 192.89 16,944,000 11,900 17,917,000
21
The San Acacio Deposit has a 43-101 Inferred Mineral Resource Estimate available on www.sedar.com or www.defiancesilver.com. Using a silver equivalent (“AgEq”)* cut-off grade of 100 grams tonne (“g/t”). Using a gold price of $1270/ oz Au and silver price of $19.60 the silver equivalent value would be silver content plus 65 times the gold content. (Note: total contained AgEq values may not add exactly because of rounding). Metallurgical recoveries are not taken into account.
• Base Metals not included in initial inferred resource

SAN ACACIO PROJECT“Post-Resource” Drill Results Summary
22
Hole # From (m)
To (m) Length (m)*
Ag (g/t) Au (g/t) Cu % Pb % Zn % AgEq(g/t)**
SAD14-01 134.00 142.10 8.10 222.12 0.22 0.01 0.20 0.53 268.13
SAD14-02 168.50 171.70 3.20 419.09 0.82 0.02 0.14 0.30 499.43
SAD14-03 05.00 213.30 8.30 42.89 0.92 0.04 1.87 2.44 278.33
SAD14-04 147.00 153.10 6.10 138.35 0.80 0.19 1.27 1.90 340.4
SAD15-07 136.40 140.00 3.60 211.49 0.14 0.01 0.11 0.20 234.17
SAD15-08 106.05 113.30 7.25 631.46 0.43 0.01 0.09 0.22 675.58
SAD15-10 331.5 333.6 2.1 283.31 0.17 0.01 0.38 0.70 337.8
SAD15-12 226.2 253.65 27.03 148.21 0.29 0.02 0.13 0.67 202.99
SAD15-13 261.00 271.00 10.00 171.22 0.08 0.01 0.27 0.42 204.65
SAD15-15 209.82 213.00 3.18 285.04 0.02 0.01 0.05 0.17 296.30
*True Widths are approximately 70% to 80% of each intersection **Reported for comparison only, with no assumptions regarding metal recovery or smelter payments. Prices used are Au: $1210.50/ounce, Ag: $16.33/ounce, Cu; $2.80/pound, Pb; $0.83/pound and Zn $0.95/pound in US$. 1 Gram = 0.03215074657 Troy ounce ***Grade not calculated because of no data for open mine workings

TEPAL GOLD-COPPER PROJECT43-101 M&I RESOURCE ESTIMATE
23
Resource ClassificationTonnes
Au Grade
(g/t)
Cu Grade
(%)
Ag Grade
(g/t)
Contained Au
(oz)
Contained Cu
(lbs)
Measured 34,100,000 0.48 0.25 0.95 528,000 185,000,000
Indicated 153,700,000 0.26 0.19 1.67 1,276,000 628,000,000
Measured & Indicated 187,800,000 0.3 0.2 1.54 1,804,000 813,000,000
Inferred 35,700,000 0.16 0.15 1.68 182,000 120,000,000
Resource ClassificationTonnes
Au Grade
(g/t)
Cu Grade
(%)
Ag Grade
(g/t)
Contained Au
(oz)
Contained Cu
(lbs)
Oxide Measured & Indicated 21,100,000 0.34 0.21 1.18 233,000 96,000,000
Oxide Inferred 700,000 0.19 0.13 2.01 4,000 2,000,000
Sulphide Measured & Indicated 166,700,000 0.29 0.2 1.59 1,571,000 717,000,000
Sulphide Inferred 35,000,000 0.16 0.15 1.67 177,000 118,000,000
Total Tepal Project Resource Estimate(1) - March 2012
Oxide and Sulphide Resources(1) - March 2012
(1) The resource stated in the table conforms to CIM guidelines for reasonable potential for economic extraction and is not to be confused as
reserves. Resource numbers above are rounded to nearest 100,000 tonnes, 1,000 oz Au and 1,000,000 lbs Cu
Resource ClassificationTonnes
Au Grade
(g/t)
Cu Grade
(%)
Ag Grade
(g/t)
Contained Au
(oz)
Contained Cu
(lbs)
Measured 26,800,000 0.51 0.25 0.95 438,000 150,000,000
Indicated 61,700,000 0.28 0.20 1.58 550,000 269,000,000
Measured & Indicated 88,500,000 0.35 0.21 1.39 988,000 419,000,000
Inferred 2,000,000 0.19 0.18 2.73 12,000 8,000,000
(2) NSR cut-off for sulphide material is $8.19/tonne milled and for oxide material is $10.13/tonne milled
Mineral Resource (Mine Diluted) Included in PEA Mine Plan(1)(2)
(1) The resource stated in the table conforms to CIM guidelines for reasonable potential for economic extraction and is not to be confused as
reserves. Resource numbers above are rounded to nearest 100,000 tonnes, 1,000 oz Au and 1,000,000 lbs Cu
Source: JDS Mining & Engineering

TEPAL GOLD-COPPER PROJECT2017 OPTIMIZED PEA DETAILS
2017 PEA Operating Assumptions($USD)Millions
Pre-Production Capital Costs $214.2
Sustaining Capital Costs $86.7
Mine Life 9.8 years
Total Material Mined 142.9 Mt
Strip Ratio 0.6 : 1Average Plant Throughput
(Sulphide + Oxide) 9.6 Mtpa
Average Au Sulphide Head Grade 0.33 g/t
Average Cu Sulphide Head Grade 0.21%
Average Au Oxide Head Grade 0.45 g/tLOM Average Au Sulphide Recovery (combined
Flotation & CIL) 77%
LOM Average Cu Sulphide Recovery 87%
LOM Average Au Oxide Recovery 81%
24
(1) Cash cost includes all mining, milling & refining, transport, mine-level G&A, and royalty costs

TEPAL GOLD-COPPER PROJECT43-101 M&I RESOURCE ESTIMATE CONT’D
25
Au = gold, Cu = copper, Ag = silver, Mo = molybdenum, g/t = grams per tonne, % = percent, oz. = ounces, lbs. = pounds, 1The in situ resource stated in the table conforms to CIM guidelines for reasonable potential for economic extraction and is not to be confused as reserves. Resource numbers above are rounded to nearest 100,000 tonnes, 1,000 oz Au, 1,000,000 lbs Cu and 1,000 oz. AuEq 2 AuEq = gold equivalent and is calculated using gold and copper only using $1000 Au, $2.75 Cu metal prices (AuEq = (lbs. Cu*$2.75/$1000) + Au oz.). All dollar values stated are $USD

TEPAL GOLD-COPPER PROJECTPEA PRODUCTION PROFILE
26
(1) Using US$1,250/oz. Au price, US$2.50/lb. Cu price and US$18.00/oz. Ag price(2) Cash cost includes all mining, milling & refining, transport, mine-level G&A, and royalty costs; net of byproduct credits
Production Year units 1 2 3 4 5 6 7 8 9 10 LOM
Resource Mined Mt 12.2 10.4 8.5 8.7 9.5 9.5 8.1 8.1 8.0 6.0 90
Waste Mined Mt 3.0 6.7 3.3 4.7 6.1 6.9 3.8 3.9 1.7 0.2 52
Strip Ratio w : o 0.2 0.6 0.4 0.5 0.6 0.7 0.5 0.5 0.2 0.0 0.6
Payable Gold koz. 133 115 119 80 94 60 40 40 35 28 766
Payable Copper Mlbs. 52 34 33 32 36 27 25 24 28 18 308
Payable Silver koz. 123 136 156 123 108 353 461 357 345 271 2,458
Gold Equivalent(1) koz. 239 186 186 146 167 119 95 93 95 68 1,418All-In Sustaining Cash Cost(2) US$/oz. $1 $291 $322 $394 $261 $705 $757 $828 $581 $1,094 $396