ILO-UNHCR Cooperation Towards Comprehensive Solutions · PDF fileILO-UNHCR Cooperation Towards...
107
ILO-UNHCR Cooperation Towards Comprehensive Solutions for Afghan Displacement – Research Phase AFGHAN HOUSEHOLDS IN IRAN: PROFILE AND IMPACT FINAL REPORT By Piyasiri Wickramasekara, Jag Sehgal, Farhad Mehran, Ladan Noroozi and Saeid Eisazadeh with contributions from Novine Movarekhi, Bhaswati Sengupta, Otoe Yoda, Faramarz Akramiand Mohammad Nejatian A study funded by the European Commission International Migration Programme International Labour Office Geneva October 2006
-
Upload
hoangkhanh -
Category
Documents
-
view
232 -
download
3
Transcript of ILO-UNHCR Cooperation Towards Comprehensive Solutions · PDF fileILO-UNHCR Cooperation Towards...

ILO-UNHCR Cooperation Towards Comprehensive Solutions for Afghan
Displacement – Research Phase
AFGHAN HOUSEHOLDS IN IRAN: PROFILE AND IMPACT
FINAL REPORT
By
Piyasiri Wickramasekara, Jag Sehgal, Farhad Mehran,
Ladan Noroozi and Saeid Eisazadeh
with contributions from Novine Movarekhi, Bhaswati Sengupta, Otoe Yoda, Faramarz Akramiand
Mohammad Nejatian
A study funded by the European Commission
International Migration Programme
International Labour Office Geneva
October 2006

2
TABLE OF CONTENTS
EXECUTIVE SUMMARY ......................................................................................... 4 CHAPTER 1: INTRODUCTION.............................................................................. 10
1.1 Objectives of the study ........................................................................................ 10 1.2 Structure of the report........................................................................................ 11 1.3 The Research team .............................................................................................. 11
CHAPTER 2: RESEARCH METHODOLOGY ..................................................... 12
2.1 Survey of Afghan households in Iran .................................................................. 12 2.2 Survey of Establishments hiring Afghan workers ............................................... 16 2.3 Case studies of Afghan households in Tehran .................................................... 18 2.4 Other methods of information gathering ........................................................... 19 2.5 Report preparation and presentation.................................................................. 19
CHAPTER 3: THE SETTING: AFGHAN POPULATION IN THE ISLAMIC REPUBLIC OF IRAN ................................................................................................ 22
3.1 The Economy of Iran........................................................................................... 22 3.2 Stages of Afghan population movements into Iran ............................................. 23 3.3 Iranian government policy towards Afghans ...................................................... 26
CHAPTER 4: THE AFGHAN POPULATION IN IRAN: THE DEMOGRAPHIC PROFILE .................................................................................... 30
4.1 Characteristics of the Afghan population and households ................................. 30 4.2 Population structure: Afghanistan, Iran and Pakistan ....................................... 33 4.3 The second generation of the Afghan population in Iran .................................. 36 4.4.Ethnicity and migration patterns ........................................................................ 36 4.5 Marital status ..................................................................................................... 38 4.6 Housing and accommodation ............................................................................. 39 4.7 Education and the Afghan population ................................................................ 40 4.8 Conclusions......................................................................................................... 43
CHAPTER 5: THE AFGHAN POPULATION: LABOUR AND EMPLOYMENT ......................................................................................................... 44
5.1 Activity Status of the Afghan Population ............................................................ 44 5.2 Conditions of Work: Remuneration, and Other Working Conditions................. 49 5.3 Unemployment among the Afghan Population ................................................... 54 5.4 Changes in employment status............................................................................ 56 5.5 Linkages with Afghanistan .................................................................................. 57 5.6 Female Headed Households ............................................................................... 63 5.7 Concluding Remarks ........................................................................................... 65

3
CHAPTER 6: IRANIAN AND AFGHAN WORKERS IN THE LABOUR MARKET OF IRAN................................................................................................... 66
6.1 Introduction......................................................................................................... 66 6.2 Major characteristics of establishments surveyed .............................................. 66 6.3 Profile of Afghan and Iranian workers ............................................................... 68 6.4 Wage levels of workers ....................................................................................... 72 6.5 Utilization of local and Afghan workers ............................................................. 74 6.6 Employer reasons for using Afghan workers...................................................... 76 6.7 Iranian worker views .......................................................................................... 77 6.8 Employer views on withdrawal of Afghan workers, and possible impacts ......... 80 6.9 Can Iranian establishments continue without Afghan workers? ........................ 82 6.10 Conclusions....................................................................................................... 84
CHAPTER 7: CONCLUSIONS AND POLICY IMPLICATIONS ....................... 87
7.1 Demographic issues ............................................................................................ 87 7.2 Labour market issues .......................................................................................... 88 7.3 Linkages with Afghanistan and return ................................................................ 89 7.4 Policy implications.............................................................................................. 89
References Appendix: Statistical tables

4
EXECUTIVE SUMMARY 1. The Afghanistan situation remains one of the world’s largest and most
longstanding refugee and displacement problems. Following the political upheavals in Afghanistan from the late 1970s onwards, the Islamic Republics of Iran and Pakistan experienced a massive influx of Afghan refugees. Both countries have demonstrated commendable generosity to refugees over more than two decades.
2. The present study on the Afghan population in Iran forms part of ILO-UNHCR
cooperation on developing comprehensive solutions for Afghan displacement. It has been financed by the European Commission. It was carried out with the support of the Ministry of Labour and Social Welfare, the Government of the Islamic Republic of Iran, and local institutions and researchers. The overall objective of the study was to gain greater insight into the dynamics of the Afghan population and their impact in Iran, especially in the local labour market.
3. In line with the objectives of the study, several information-gathering methods were employed, with emphasis on generation of primary data. A sample survey of Afghan households in Iran collected detailed socio-economic data from 1505 households in 10 selected cities with large presence of Afghans. An establishments survey included 4,412 questionnaires including 1,049 employers, 1,261 Iranian workers and 2102 Afghan workers.
Population movements from Afghanistan into Iran 4. Temporary and seasonal migration of Afghans to Iran was common prior to 1979.
It was driven primarily by economic opportunities, poverty, and drought. But movements in the last two to three decades have been particularly dramatic, triggered by political crisis and armed conflict in Afghanistan. The most recent registration (amayesh) exercise carried out by the Iranian authorities at the end of 2005 enumerated 920,000 Afghans, the majority of whom have been in Iran for a long period. There are also a large but unknown number of unregistered migrants whose status is considered illegal.
5. Very few Afghans have been granted the status of refugees and given the right of settlement in Iran. Even those who arrived as refugees in the early 1980s have only temporary stay permits.The reservations made by the Government of Iran on the 1951 Convention of Refugees and the Associated Protocol of 1967, and the policies followed by the government for much of the period 1980 to 1992, effectively restricted Afghans to low skilled occupations. In recent years, increasing restrictions have been imposed on Afghans and those employing them. These factors influence the presence and activities of Afghans in the labour market and their relations with local employers.

5
Household survey findings
6. Characteristics of the Afghan population and households
• The average household size in the surveyed population is 5.6 persons, which is higher than the average for Iran at 4.1 persons. The ethnic distribution of Afghans shows that the majority are Hazara (34.6%), Tajiks (22%) and Pashtun (11%).
• The Afghan population is relatively young. About 40% of the surveyed households are 0-14 years old and 58.3% are in the 15-64 age bracket.
• Women (48%) and children up to the age of 14 (40%) constitute a large proportion of the sampled Afghan population. Female-headed households constituted a small part of the total - only 66 out of 1505 households or 4.4% of the total.
• More than half (53%) of the sampled Afghan population was born in Iran. Their average stay was 15 years, with over 70 percent of them having been resident for more than 10 years. This is almost identical with the results of official registration (amayesh) data.
• 80% of heads of Afghan households originally fled to iran to escape war and insecurity, 11% followed household members and relatives, and 7% for job search. Of those surveyed, 93% claimed that they possessed documents permitting them to stay in Iran.
• The majority of households (83%) live in rented houses with only 7% of the households having their own accommodation.
• Low educational attainments characterize the surveyed Afghan population though there are marked differences between the older and younger generations. 31% of the population aged six and above in this sample were uneducated (women 36%, men 26%) and about 50% had completed only primary or secondary school education. Of the Afghan population aged six and above with education, 71% have obtained their education in Iran, 21% in Afghanistan and 8% in khodgardan Afghani schools managed by Afghan communities in Iran.
Labour markets and employment 7. Registered Afghans (920,000) now number less than 2% of the overall population
(c. 68 million) in Iran. Afghans of working age account for only 1.8 % of the total active Iranian labour force (23.7 million).
8. There is a marked divergence in the labour force participation rates among Afghan
men and women at 69.1% and 10.4% respectively. The corresponding participation rates for Iranian men and women are 44.6% and 11.6%. The differences may largely be attributable to the fact that Afghans need to work to survive and are prepared to accept employment on unattractive terms and conditions.
9. About 80% of Afghans work in three sectors - manufacturing, construction, trade and commerce. They are characterised by private sector ownership, by small and
6
medium sized enterprises, and by a high degree of informal economic activity. Only 26% of Iranian employees work in these three sectors. In terms of employment status, Afghans are comprised of regular workers (39%), casual workers (28%), and self-employed (23%). There are very few employers among the surveyed population but there are a significant proportion of self-employed or own account workers.
10. Only one third of the Afghan workers remained in the same sector as their previous employment in Afghanistan. While 50 per cent were employed in agriculture in Afghanistan, only 13% remained in the sector in Iran. The other marked change is in the construction sector which saw a rise from 5% in Afghanistan to 30% in Iran.
11. Afghans workers in Iran undertake work without any pre-conditions. Less than 3% of the Afghan employees had written contracts, 77% had only an oral contract, and the remaining 20% had no clear defined contract. More than 99% of Afghan employees did not have any type of work-related insurance (accident, unemployment and retirement insurance) and only 5% were entitled to paid annual or sick leave.
12. The unemployment rate for Afghan men in this sample was 3.9%. Women had reported a much higher unemployment rate at 21.4%, despite their low labour force participation rate. 43% of unemployed Afghans were in the 15-19 years age group and 21% in the 20-24 years group
13. The household survey and the case studies found no clear association between the
duration of residence in Iran and improvements in their economic situation. Neither has the long stay of Afghans in Iran benefitted their homeland much in terms of remittances. Only 7% of housholds reported sending money home echoing the findings of other recent research. This is attributable to the high cost of daily life, low wages (and consequently modest savings), and their having migrated with families leaving no immediate relatives behind.
14. There have been few links with Afghanistan with only 15 per cent of Afghan
persons visiting Afghanistan during their stay. The observed pattern was that the longer staying residents were less willing to return. This is consistent with observations about the long staying Afghan households being integrated into the local economy.
Establishments survey 15. Of the total number of surveyed establishments (1,049), some 33% have started up
within the last five years while 17 per cent had been operational for more than 10 years. Those beginning their businesses within the last three years account for 55% of total workers in the survey. Most of the establishments were in industry including construction; 70% of the establishments and 78 % of the workforce was in this sector.
16. The survey found no substantive differences between the two groups of workers
as regards age, work experience, hours of work, and unemployment levels. But Iranians had generally higher education achievements, better wages, and more insurance coverage.
7
17. The coverage of Aghan workers by social protection measures was very limited
(less than 1%). Employers had mentioned the lack of obligation to make other payments as a reason for preferring Afghan workers. However, only 23 per cent of Iranian workers were covered by insurance. This may be due to the informal nature of the establishments, which makes it easy to avoid such payments.
18. According to the employer survey, the average wage of Iranian workers was $195
compared to $172 for Afghan workers, indicating a difference of about 13%. The highest wages for both workers was in the industrial sector. In services the wages ranged from $148 (Afghan) to $162 (Iranian). The total wages (including extra payments) ranged from $182 (for Afghans) to $224 (Iranians). In both cases, Iranians enjoyed a 10-23% wage differential.
19. Iranian employers cited a number of reasons for preferring Afghan workers – hard
work, flexibility, and reliability as well as cost advantages (wages and product prices). Many employers also maintained that they could use Iranian workers and that they could continue business without Afghan workers though there would be an impact on wages and prices.
20. A preliminary analysis would suggest that there are also low skilled Iranian
workers with limited mobility and options. They face working conditions similar to those faced by Afghan workers in informal, low paid labour. A substantive proportion of both sets of workers may form part of the vulnerable population in the labour market. More research is required to analyse their profiles. One possibility is that Iranian workers are migrants from rural areas with few connections or networks.
21. According to survey findings, the type of employment that would be available to
Iranian workers following the repatriation of Afghans would be predominantly found in the informal and private sector, and typically require low levels of skill and education, long working hours, and low pay. It may be that job opportunities opened up since 2002 by the return of 1.5 million Afghans from within the old registered population have been taken by more recent migrant workers from Afghanistan.
Policy implications 22. The impact of the registered Afghan refugees on the population size and
composition in Iran is insignificant. Registered Afghans (920,000) account for only 1.4% of the overall population.
23. At the macro-economic level, it is improbable that Afghans exercise any significant influence. Their impact on the labour market is localised and confined to certain provinces. In statistical terms those of working age number approximately 400,000 and form only 1.8% of the total labour force of Iran of 23.7 million. Moreover, the numbers of Afghans actually working full time is much less once factors such as unemployment and female labour market participation are included.

8
24. The survey did not generate any evidence that Afghan workers are displacing Iranian labour. Afghans appear to be concentrated in sub-sectors and working under conditions which are unattractive to Iranians. Further research is required to determine the impact, if any, on wage levels of local workers. In the Establishments survey, the Afghan share in the total work force was found to be 47 per cent. However, this most probably reflects the sample bias in favour of smaller enterprises in the informal sector.
25. There is effectively no social protection for Afghan workers. More than 95% of Afghan employees do not have written employment contracts with their employers nor do they enjoy any benefits such as sick leave. The lack of employment authorization and exclusion from the formal sector are largely responsible for this situation and for the evident lack of upward mobility in employment despite their length of stay in Iran.
26. The return of Afghans to their homeland is complicated by a number of economic and social impediments. The bulk of the remaining Afghan households are those who had stayed for a long period (average 15 years) in Iran. A sizeable number have been born in Iran itself comprising a second generation that has never visited Afghanistan.
27. Despite their long stay in Iran these Afghans households exist on a day to day basis, largely on the margins of society and the economy. Analysis of their wage levels, expenditure, and insecure employment suggests that building up financial savings and resources for a sustainable return is difficult. Increasing restrictions and controls are likely to increase this marginalization without a perceptible impact on prospects for return.
28. An important policy implication is whether differentiated policies are required for addressing the situation of the long-staying registered population and the increase in the numbers of those Afghans arriving for seasonal and short term employment driven by economic considerations. International experiences suggests that intensified restrictions and controls of these movements would likely play into the hands of traffickers and smugglers with consequences for security, law, and order.
Policy recommendations
29. The insights generated by this study suggest that further research to document the role and impact of Afghans in specific sectors of the economy, on local labour markets, and on local workers would be valuable in framing appropriate policies.
30. In theory, the construction, petty trade/commerce, and services would be impacted by the repatriation of Afghans since these are the sectors where the Afghans are concentrated at least at local level. However, the prospects for substituting Iranian workers for repatriated Afghans may be limited because of the unattractive pay and conditions.
31. All stakeholders recognise that creating conditions for return and reintegration in
Afghanistan should be accorded very high priority. But there appears to be little likelihood that this can be achieved on a sustainable basis in the short to medium term. Continuing international cooperation and bilateral dialogue are essential to address the complex economic, social and political challenges that this objective implies.

9
32. While more sustainable medium term and long-term solutions are being pursued, consideration could be given to creating acceptable conditions for the continued stay and employment opportunities for those long staying, registered households given their already marginal and precarious position. The lack of employment authorization has made a large number of Afghan workers vulnerable to exploitation. This also has consequences for the labour market position and employment opportunities for Iranian workers.
33. Consultations on the development of a transparent work permit scheme will help both workers and employers. It would be preferrable if both employers’ and workers’ organizations are involved in the formulation of policies in this area since both have a direct stake in the outcome.
34. The position of Afghan children and their access to education should be given due consideration. This is a sensitive issue which also affects their prospects for employment on return to Afghanistan. The situation of the second generation needs to be given special attention.
35. Efforts to develop workable temporary migration programmes for employment of foreign workers should also continue. These will also help to address irregular cross border movements and the security and protection problems associated with them.

10
CHAPTER 1: INTRODUCTION
“The Afghanistan situation remains one of the world’s largest and most longstanding refugee and displacement problems.” (UNHCR 2003b) The bulk of the refugee movement was to the neighboring countries – the Islamic Republic of Iran and Pakistan1, highlighting a South-South movement. Both countries illustrate a most generous sharing of the Afghan refugee spread over more than two decades. While there have been regular population movements between Afghanistan and Iran, the last 2-3 decades have been unprecedented in crisis-driven movements. Following the political upheavals in Afghanistan from the late 1970s onwards, Iran experienced a massive influx of Afghan refugees.2 In the early 1990s there were still over 2 million Afghans in Iran, which made them the biggest foreign population community in the country. The effects of this presence on Iran’s economy and society have been as yet largely undocumented. It is estimated that there are close to one million registered Afghans still remaining in Iran. There is also evidence to suggest that cross border flows are still continuing and that there are many undocumented Afghans in the country. (IOM and Stigter 2006).
The UNHCR launched the programme on comprehensive solutions for Afghan displacement in 2004. The ILO International Migration Programme as a partner in this programme undertook research on Afghans and the labour market in Iran and Pakistan. The ultimate purpose of the study is to help the voluntary and sustainable reintegration of Afghans on their return to their country and its future development.
The study on the Afghan population in Iran is in response to continuing concerns about their extensive and protracted presence. It is intended to provide more information about the different factors that lie behind this phenomenon. It was carried out with the support of the Ministry of Labour and Social Welfare, Government of the Islamic Republic of Iran, and local institutions and researchers.
1.1 Objectives of the study
The overall objective of the study is to gain greater insight into the dynamics of the Afghan population and their impact in Iran, especially in the Iranian labour market. The study is expected to provide policy advice to policies and programmes both in Iran and Afghanistan. The research phase had the following objectives.
i. Develop more detailed demographic, social and economic profiles of the Afghan population in Iran than has to date been available;
1 The Islamic Republic of Iran will be referred to as Iran in the rest of this report. 2 See UNHCR (2004b). Chronology of a crisis (1973-2002), United Nations High Commissioner for Refugees, Geneva http://www.unhcr.ch/cgi-bin/texis/vtx/afghan?page=chrono (accessed 21 December 2005).

11
ii. Review the labour force and employment situation of the Afghan population in Iran.
iii. Assess their impact on the local labour market.
1.2 Structure of the report
The report is structured as follows. Chapter 2 deals with the methodology of the study and outlines the field surveys and data analysis. Chapter 3 provides a macro overview of the Afghan population and policies in Iran. The next two chapters deal with the profile and situation of Afghan households in Iran based on the household survey. Chapter 6 analyses the profile of Afghan and Iranian workers on the basis of the Establishments survey. The final chapter presents overall conclusions and recommendations to concerned governments and agencies.
1.3 The Research team
1.3 The Research team
The project was initiated by Mr. Manolo Abella, the then Chief of the International Migration Programme, ILO in Agusut 2004. Dr. Piyasiri Wickramasekara took over coordination of the project from January 2005, and supervised it to its completion in March 2006. This final report has been prepared by a team of researchers led by Dr. Piyasiri Wickramasekara, Senior Migration Specialist, International Migration Programme of the International Labour Office. The other team members were: Dr. Jag Sehgal (Consultant demographer & ex-ILO), Dr. Farhad Mehran (Senior Statistician, ILO), Ms. Ladan Noorzi (Consultant), Professor Saeid Eisazedah (Consultant), Ms. Novine Movarekhi (Consultant), Ms. Bhaswati Sengupta (Consultant), Ms. Otoe Yoda (Associate Expert, International Migration Programme, ILO) and Mr. Faramarz Akrami (Graduate student, Faculty of Economics, University of Fribourg), and Mr. Mohammad Nejatian (Consultant). The ILO deeply appreciates the contribution of the Iranian research collaborators: Ms. Ladan Noroozi, Mr. Mohammad Hossein Nejatjian and Professor Saeid Eisazedah, who undertook the field surveys and provided preliminary reports. It is also grateful to Ms. Novine Movarekhi, Consultant based in Geneva, who was associated with the initial planning phase of the studies, and later completed the report on the case studies of Afghan households... The ILO also wishes to place on record the valuable support of Mr. Pirouz Sa’adati, Director-General, Overseas Employment Development Department, Ministry of Labour and Social Affairs, for field surveys in Iran. Last but not least, the ILO wishes to place on record the generous financial support provided by the European Commission for this project. It also acknowledges the excellent support and guidance received from the UNHCR colleagues - Mr. Salvatore Lombardo, Coordinator of the Afghanistan Project, and Mr. Ewen Macleod, Senior Advisor, at all stages of the project.

12
CHAPTER 2: RESEARCH METHODOLOGY
In line with the objectives of the overall study, several information-gathering methods were employed. The main thrust was on the generation of primary data through field surveys. The following research methods were used:
a. Sample survey of Afghan households in Iran
b. Survey of establishments hiring Afghan workers in Iran
c. Case studies of selected Afghan households in Tehran
d. Review of secondary sources
2.1 Survey of Afghan households in Iran The objective of the survey was to obtain detailed data on the demographic
characteristics, employment and labour market situation of the Afghan population in Iran using a structured questionnaire. The survey was designed to obtain specific information on the following:
• Sex and age composition, marital status, literacy and educational status
• Place of birth, ethnicity, reason for leaving Afghanistan, total years of residence in Iran, return since first entry, resident permit in Iran, number of years working in Iran
• Type of economic activity, employment status before leaving Afghanistan, and training or skill acquired in Iran
• Current employment status, main occupation, type of economic activity and status in employment, secondary job, usual hours of work and average weekly income from work
• Nature of contracts, leave entitlements, insurance against work accident and other insurance (health, unemployment, retirement benefits)
• Profile of the unemployed persons: Current availability for work; job-search methods and duration; reason for not looking for work.
• Linkages with Afghanistan through visits, remittances; tools and equipment to take back to Afghanistan.
The survey instrument was a structured questionnaire with 45 questions developed in cooperation with the ILO. The first part of the questionnaire related to all household members, and the second part was designed to collect employment-related information from the population 10 years and above. The questionnaire and the interviewer’s instructions were finalized following a pilot testing. 2.1.1 Sampling design
The detailed information on the method of the sample selection, cities, and provinces is provided in Annex 7. A summary is provided below.

13
All members of Afghanistan households living Iran represented the total population of concern to be covered in the survey. Three basic features should be taken into account in designing the sample of the survey of Afghan households in Iran: • There are both documented and undocumented Afghans living in Iran. According to the registration exercise carried out in the spring of 2001 by the Iranian Ministry of Interior, Bureau for Aliens and Foreign Immigrants Affairs (BAFIA) there were a total of 2,349,068 Afghans recorded. The most recent exercise carried out in late 2005 and early 2006 indicated a total of approximately 920,000 registered Afghans. There are also a large but unknown number of undocumented Afghans in the country. • Most Afghans live outside camps dispersed throughout the country mixed with
Iranian households. A high proportion of them are living as regular one-family households dispersed throughout the country and in many parts mixed with the Iranian households. The 2002 Statistical Yearbook of the UNHCR reports that only 6% of the population of refugees, asylum-seekers and others of concern to UNHCR are living in camps or refugee centres in Iran, of whom only 3% were Afghans. Although the four provinces of Tehran, Sistan Baluchistan, Esfahan, and Khorasan account for close to 70% of the total Afghan population residing in Iran, all other provinces had some Afghan population in 2001. In 2003, as a result of the repatriation programme or possibly because of the perceived threat of deportation, the number of registered Afghans in Iran diminished and their distribution across the country somewhat narrowed, seven provinces registering no Afghan population. • Relative population size Relative to the total population of Iran, the Afghans constitute a “rare” population. The last two population censuses conducted in 1986 and 1996 as well as the mid-decade large scale sample survey conducted in 1991 measure the size of the foreign born population residing in Iran. The figures reported by Mohammed Ahmadi Movahed (Ahmadi Movahed 2003) show that the foreign born population has not exceeded 1.7% of the total population throughout this period. The bulk of the foreign born population comprises the Afghan population in Iran, born in Afghanistan or other countries. It does not include, however, the Afghan population subsequently born in Iran. But, even if one accounts for the Iran-born Afghans, the share of the Afghan population in Iran should not exceed 2-3% of the total population. For sampling purposes, a population with such a low rate of incidence is considered as a “rare” population. Based on the data of the amayesh (registration) plan of the Ministry of Interior Affairs (2004) related to the distribution of the Afghan population, the decision was made to collect the data from 1540 households in 10 cities from 7 provinces of the country.

14
Network sampling of Afghan households The conventional method of sampling households in Iran is based on selecting a representative sample of geographical areas and listing all households in the sample areas from which a random sample of households is finally selected from the list. Such a procedure is however difficult to apply in the case of Afghan households as many households need to be listed in order to reach one Afghan household. Since the cost of listing is relatively high, any sampling design involving listing of households would be inefficient in the present circumstances. Therefore, an alternative method based on network sampling (snowball sampling) was adopted. The proposed procedure involved three stages: • sampling of geographical areas (districts or Shahrestans); • sampling of Afghan “leaders”; and • sampling of Afghan households. The sample areas of the survey were selected on the basis of the latest estimates on the Afghan population by district in the amayesh and Repatriation Databases (as of 1/12/04 for the amayesh data and as of 1/1/04 for the Repatriation data).3 The sample areas were selected with probability proportional to the size of Afghan population in the area. According to this sampling scheme, districts with large Afghan population were selected with probability one. These were Meshad, Zahedan, Qom and Isfahan. The other sample areas were Ghazvin, Kerman, Varamin, Tehran, Raye, Rafsanjan, and Najafabad. Within each sample area, a set of Afghan “leaders” were then selected, according to a particular scheme4 that parallels a probability sample proportional to size, where size is defined to be the number of Afghan acquaintances that each Afghan person has in the area. At the last stage of sampling, each selected Afghan “leader” was asked to designate on a random or haphazard basis a fixed number of Afghan households in the sample area constituting a representative sample of Afghan households in the area. Based on limited sources of time and budget, the total number of sampling units was confined to 1400 Afghan persons.
2.1.2 Field operations The field operations of the survey and the processing of the results including the recruitment and training of Afghan and Iranian interviewers and supervisors were entrusted to Mr. Mohammad Hossein Nejatian, ILO Consultant, and Director, Shakhes-Negar, a statistical consultancy firm affiliated to the Statistical Centre of Iran. (Nejatian 2005) 3 The database was obtained from the Bureau for Aliens and Foreign Immigrants Affairs (BAFIA), Ministry of Interior, Islamic Republic of Iran through the good office of the UN High Commissioner for Refugees, Tehran. Some 76'000 Afghans who have returned home spontaneously from 1/1/04 to 30/11/04 could not be excluded from the database as information on their regional breakdown was not available. Some missing data were also noted in the source. 4 Salganik, Mathew, J., and Douglas D. Heckathorn, “Sampling and Estimation in Hidden Populations Using Respondent-Driven Sampling,” Sociological Methodology, 34:193-239, 2004.

15
The field operations were carried out during May and June 2005. An Executive Committee was responsible for the field operation. Under the supervision of this committee, there were seven provincial managers, in the seven sample provinces. In each province, an Afghan advisor was hired to help the manager in his job, especially in searching for Afghan leaders who were supposed to introduce a certain number of Afghan households to be interviewed. Face to face interviews were done by Afghan enumerators. These enumerators were hired, trained in each province locally among high-school educated Afghans, so that they were known and trusted by sample households. Some administrative problems occurred in the field operations in Isfahan and Kerman which were solved thanks to the intervention of Mr. Sa’adati, Director-General, Overseas Employment Development Department, Ministry of Labour and Social Affairs. In Qom province the sample was reduced to 75 from the planned 110 households. Finally the data of 1505 Afghan households were collected, amounting to 8430 persons. 2.1.3 Data Processing and tabulation In the selection of data entry software, the small sample size, small number of records (less than 65000), and the small number of fields (less than 256) guided the selection of the Microsoft Office package and visual basic. For efficient and low cost verification, several key questions were identified which formed the basis for other questions and also classification and were verified totally (100%): age, sex, place of birth, ethnicity, and relationship to head of household. During data editing, 3,159 entries were corrected where the errors related mostly to questions which should not have been asked, but were wrongly asked and reported. They could easily be omitted without any problem.
At the analysis stage, to evaluate the sample for consistency and accuracy, 45 questionnaires (2.5 percent of the complete sample) were randomly chosen from different cities and the information of each individual was compared with the information entered in the file. The data entry accuracy was precise and rarely any error was observed. The response rate to the questions was high.
Although the questionnaires were mostly controlled and some corrections were made, the test tables generated and the compared random sample sometimes showed some inconsistency; for example 730 people aged above ten that have passed their highest educational level in Iranian schools, have mentioned they have not acquired any education and skills in Iran. But because skills and education consists of general education it should have been noticed that they have been educated in training centres.
156 of non-students have mentioned that due to education they do not work, of course most of these persons were of schooling age, and probably because of limitations and barriers created in recent years on their way to education, have no access to further studies.
The responses to the question about “why are you not searching for a job?” many of the women who do not have permission due to cultural reasons have checked the “no

16
permission to work” item. But the main fact considered in designing this question was legal work permits by Iranian authorities.
The data has been analysed using the SPSS statistical package. The dataset has been analysed as a simple random sample, and no attempt has been made to inflate the figures to derive global figures. The broad findings are consistent with trends indicated by other sources (Mehran 2005).
Ms. Ladan Noroozi, Management and Planning Organization, Tehran, acted as the coordinator of the household survey, and produced the preliminary report based on the survey findings. An edited version of this report was submitted by the ILO to the UNHCR in mid-October 2005 (Noroozi and Wickrmasekara 2005).
2.2 Survey of Establishments hiring Afghan workers
2.2.1 Objectives and organization of the survey. The Iranian Institute of Labour & Social Affairs had commissioned a study of the employment impact of Afghan workers in Iran, carried out by Professor Saeid Eisazadeh, Department of Economics, Bu-Ali-Sina University, and Hamedan. The study involved a survey of employers of Afghan workers in four regions of Iran. The ILO agreed with Professor Eisazadeh to extend the coverage of the survey to Iranian workers as well, providing the extra expenses for the expanded survey. The survey had two objectives: (a) to obtain comparative information on the characteristics of Afghan workers and Iranian workers working in the same establishment; and (b) to obtain information on the effect of Afghan workers in the outputs and profits of the establishment. The information required for this research was collected through a questionnaire survey. Three groups - Afghan workers and Iranian workers and employers- were interviewed based on three different questionnaires. Basic information collected from Iranian and Afghan workers consisted of the following: demographic profile; labour market characteristics including wage information; period of residence in Iran, job before migration, savings, remittances by Afghans workers and the willingness of Iranian workers to do work performed by Afghans and the reasons. The employer's questionnaire included additional questions on enterprise type, number of employed workers, the amount of initial capital and starting year of operations. Employer views were obtained on a comparison of Iranian and Afghan workers. Employers were asked why they employed Afghans instead of Iranians, costs involved, and the possibility of continuing the activity in absence of Afghan workers. Four provinces (Tehran, Isfahan, Khorassan and Sistan-Balochestan) were selected as representative of a high incidence of Afghan workers. A total of 4,660 questionnaires were administered in the 4 cities consisting of 1,121 employers and 3,539 workers (Afghans and Iranians). Table 2 shows the distribution of the questionnaires in the four cities and among different groups of workers. 248 questionnaires were discarded because of unreliable or incomplete data. This involved 72 employer questionnaires

17
and 172 Iranian and Afghan worker questionnaires. The balance 4,412 questionnaires relate to 1,049 employers, 1,261 Iranians workers and 2102 Afghans workers.
Distribution of questionnaires by location No. of Questionnaires
C ities Employers Iranian
workers Afghan workers
Total accepted
Discarded Total
Tehran 431 594 1,149 2,175 194 2,369 Isfahan 302 368 392 1,062 14 1,074 Khorasan 271 248 434 953 10 963 Sistan – sedan
45 51 126 222 30 252
Total 1,049 1,261 2,102 4,412 248 4,532 Trained interviewers were sent to all parts and towns of Tehran in which presence of Afghan workers was observed such as Islamshahr, Karaj, Shahre Rey etc. Employer survey The employer's questionnaire was designed to gather information on comparison of different groups of labour (Afghan workers and Iranian workers), the reason for using Afghan workers, and the effects of absence of Afghans on job opportunities, production costs, and continuing the activity. While efforts were made to interview employers using both Iranian and Afghan workers in their establishment, some establishments used only one group of workers. For instance, 44 establishments relied only on Afghan workers at the survey time. Only in 6 establishments, only native labour has been used during the survey period. In 999 establishments the employers have used both internal and foreign workers in their activity. According to the employers, the 1049 establishment contained 9,442 workers of which 5,566 (58.9%) were Iranian and 3,876 (41.4%) were Afghan workers. The data shows that the employers have used more local workers. It should be mentioned that there are many establishments and jobs in which only the local workers are being used, but these establishments have not been considered in this study. A high percent of visited establishments were those with simple unskillf jobs in which basically the Afghans were working. 2.2.2 Field operations: Obstacles and limitations in gathering information One of the main problems of interview and filling questionnaires was non-cooperation by respondents. Because of various reasons such as time constraints, uncertainty, inability and lack of sufficient knowledge for answering some questions, the interviewee might be unwilling or unable to give information to the interviewer. The subject of the research regarding the relation of the research to undocumented migrant labour and the restrictions and pressures impressed upon Afghan migrants for leaving the country have added to the obstacles and limitations of the research. This is because the Afghan workers are willing to remain in Iran and the employers benefit from their presence in Iran. They both may answer the questions with bias.

18
In a number of instances, employers may have tried to hide the truth about the number of Afghan workers employed. Also some of the non-cooperating employers encouraged the workers also to non- cooperation. In some cases the employer went into hiding as soon as the interviewer entered the establishment. Afghan workers also were not willing to take part in the interviews because the first idea entering their mind was the fear that the interviewer had came from the authorities with a view to sending them back to Afghanistan. So, they either refused to be interviewed or if interviewed, gave imperfect answers to questions like wage amount, period of residence in Iran, saving amount and amount of money sent to Afghanistan. Besides, given the Afghan distribution in cities and unlawful employment, they did not have real clear addresses which made locating them a hard and time consuming task. The analysis was undertaken using Microsoft Access software. Professor Eisazedah submitted a report on the preliminary findings.5
2.3 Case studies of Afghan households in Tehran
The objective of the case studies was to obtain qualitative information and highlight interesting issues relating to Afghan migration to Iran, based on the experience of different households. The questions and group discussions focused on history and conditions of migration, household socio-economic situation and livelihoods, working conditions, linkages with Afghanistan, plans of return, positive/negative aspects of living in Iran, and the impact of UNHCR and Iranian government policies. The case studies were carried out by Ms. Novine Movarekhi, Consultant, supported by Dr. Mihir.
A set of 28 questions – closed and open-ended - were divided into four groups, including:
• Reasons and conditions of migration: questions on reasons for choosing
Iran; difficulties encountered on the way; recourse to smugglers. • Links with and perceptions of Afghanistan: questions on savings and
remittances; valuables; assets in Afghanistan; number of travels back home; means of contacts with relatives/friends in Afghanistan.
• Intentions to return to Afghanistan: questions on probable difficulties; perception of the future of Afghanistan; viewpoints on and expectations from UNHCR and Iranian government policies; changes in socio-economic conditions during their stay in Iran.
• Work conditions and extent of labour market integration: questions on working hours, salary, and benefits; access to opportunities and facilities; similarities and differences between life in Iran and Afghanistan; restrictions imposed by the Iranian government
5 Eisazedah, S. (2005). Preliminary results of the Establishments survey using Afghan workers, Report submitted to the International Labour Office, Geneva, Department of Economics, Bu-Ali-Sina University, Hamedan.

19
The 25 Afghan households were selected from the list of respondents in Tehran in the main survey, taking into account a number of criteria, including balanced ethnic diversity, duration of stay in Iran, type of occupation, remittances to their homeland, and gender. On the basis of this, Afghan “leaders” were contacted to solicit support to access selected Afghan households in the sample area. Afghans living in Tehran and outside Tehran were interviewed, for the greater diversity that they would represent in terms of the above-mentioned criteria and the high concentration of Afghans. Consequently, Afghan households were selected in the province of Tehran - including Tehran city, Shahr-e Rey and Varamin - and in Qazvin which offered a reasonable proportion of Pashtuns and other types of economic activities, such as agriculture. Twelve interviews were undertaken in Tehran province, and thirteen in Qazvin, with an average of three to four interviews per day. The interviews generally lasted 40 to 50 minutes.
Provinces (Ostan) Districts (Shahrestan) households interviewed Tehran
Shahr-e Rey Varamin Tehran
5 3 4
Qazvin Qazvin 13 Total 25
The report on the case studies has highlighted the major findings, and outlined the individual case studies in an appendix. (Movarekhi 2005)
2.4 Other methods of information gathering In addition to the field surveys, the research team consulted a range of source on Afghan population in Iran including the various reports and data provided by the UNHCR, research reports of the Afghanistan Research and Evaluation Unit (AREU), and other literature obtained through web search. The statistical reports of the Iran Statistical Centre and the Central Bank of Iran were useful in providing background information on the overall economy of Iran. The overall impression gathered by the researchers is that there are many gaps in the data on the Afghan population which need to be addressed in the future. The amayesh database based on the 2001 registration exercise was updated again in November 2005 and recorded approximately 920,000 Afghans.
2. 5 Report preparation and presentation The ILO research team encountered a number of problems in analyzing the field survey data. These related to incomplete data definitions provided with the datasets, coding of some variable information only in Farsi, and data problems revealed by consistency checks. It took some time to obtain the complete definitions and descriptions of the datasets. The ILO team carried out extensive analysis of the original data sets in the preparation of the present report.

20
The present report comprises the main findings and conclusions of the studies. All detailed tables and those with technical content have been placed in Appendix I to ensure flow and readability in the main text. These tables carry the prefix ‘A’ indicating that they are in an appendix. In the course of the project, a number of supporting studies and documents relating to the present study were prepared. Thy have been included in separate annexes as follows: Annex 1: First Report - Survey Report on Afghan Households in Iran by Ladan Noroozi and Piyasiri Wickramasekara Annex 2: Preliminary results of the Iran Establishments Survey by S. Eisazedah Annex 3: Case Studies of Afghans Living In Tehran and Qazvin, Islamic Republic of Iran by Novine Movarekhi Annex 4: An Empirical Investigation into Iranian Labour Markets with High Concentrations of Afghan Migrants: An Analysis of Various Employees and Employer Level Decisions by Bhaswati Sengupta

21
Annex 5: ILO study on the Afghan population in the Islamic Republic of Iran: Powerpoint presentation at Islamabad AREU Conference by Piyasiri Wickramasekara Annex 6: ILO Study on the contributions of Afghans in Iran and Pakistan: Field surveys in Iran, Powerpoint presentation by Farhad Mehran Annex 7 : Report on the Survey of Afghan Households in the Islamic Republic of Iran,
M. Nejatian Annex 8 : Copies of Questionnaires used.
1. Household survey 2. Establishments survey – employers 3. Establishments survey - Workers
These project studies and documents provide additional information, but most of them have not been formally edited by the ILO and the responsibility for their content lies with the authors.

22
CHAPTER 3: THE SETTING: AFGHAN POPULATION IN THE ISLAMIC REPUBLIC OF IRAN
3.1 The Economy of Iran
The Islamic Republic of Iran has been classified as a lower middle-income country in the Middle East and the North African region, according to the World Development Indicators 2005. The country has a total surface area of 1.6 millions square kilometres, and a total population of 69 million in 2005. The annual population growth rate has declined over the years and reached 0.9 by 2004. The adult literacy has reached at 77.0 in 2004. According to the UN Human Development Index, Iran ranked 99th out of 177 countries in 2003 with an HDI value of 0.736.6
The per capita GDP in 2005 is estimated at $2,550 by the Economist Intelligence Unit country report (June 2006). Table 3.1 shows the sectoral distribution of economic activity. The share of the agriculture sector in the total GDP has declined to 10.9% by the year 2004 from 19.8 in 1984. The major industries of the country are petroleum, petrochemicals, cement and other construction materials, food processing, metal fabrication, etc. The share of the industrial sector is now about 41 % of the GDP. The average annual growth rate of GDP in 2004 was 4.9%.
Table 3.1: Structure of the economy (% of GDP)
Sector 1984 1994 2003 2004 Agriculture 19.8 15.7 11.3 10.9 Industry 31.3 39 41.2 41.0 Manufacturing 9.2 13.7 12.5 12.7 Services 48.9 45.3 47.6 48.1
Source: The World Bank. The Islamic Republic of Iran at a glance.
The demographic profile (Table 3.2) shows the population rising from 66 million in 2000 to 73 million by 2010. The working age population is also showing a rising trend from 61 to 70 per cent over the same period. The labour force in 2005 is estimated at 24 million persons.
6 UNDP (2005) Human Development Report 2005, New York.

23
Table 3.2: Demographic profile
2000 2005 2010 Population (millions) Total 66.4 69.4 72.6 Male 33.9 35.4 36.1 Female 32.5 34 36.5 Age profile (% of total population) 0-14 34.3 26.9 22.9 15-64 61.1 68.2 69.7 65+ 4.6 4.8 4.9 Working-age population (million) 40.6 47.4 50.6 Urbanisation (% of total) 64 68.1 71.2 Labour force (million) 20.3 23.7 27.1
Sources: EIU Country report 2006: based on International Labour Organisation (ILO), labour
force projections; Economist Intelligence Unit estimates and forecasts; national statistics.
3.2 Stages of Afghan population movements into Iran
Population movements from Afghanistan to neighbouring Iran have a long history. Temporary and seasonal migration of Afghans to Iran has been common prior to 1979, driven by economic opportunities, poverty, drought and other household needs (AREU, 2005b). But movements in the last two to three decades have been particularly dramatic, triggered by major political upheavals and armed conflict in Afghanistan. The UNHCR schematic chart on the chronology of Afghan crisis highlights these developments (UNHCR 2004b). Several distinct stages of Afghan refugee flows into Iran can be distinguished (AREU 2005b) (CMI and PRIO 2004). a) 1979-1989 – Soviet occupation and exodus of refugees The Soviet occupation of Afghanistan from 1979–1989 triggered a large movement of Afghans into Pakistan and Iran. By 1990, the number of civilians in exile reached 6.3 million - an estimated 3.3 million in Pakistan and 3 million in Iran - and Afghanistan had become the world's largest refugee crisis. (UNHCR 2003a). The refugees were welcomed out of a strong sense of Islamic solidarity. The Government of Iran provided generous support. To some extent, Afghans filled gaps in the local labour market that had occurred during the 1980s at the time of the war with Iraq. Most of the Afghans who entered Iran lived outside camps and settled in poor neighbourhoods on the periphery of Iranian cities (AREU 2005b). b) Return flows (1990-1993) The end of Soviet occupation and the fall of the communist regime prompted large scale return flows to Afghanistan, which was facilitated through a formal repatriation process based on a tripartite agreement between Afghanistan, Iran and UNHCR. c) 1994-2001: Intensified civil war and the halting of repatriation movements propelled by the repressive Taliban regime

24
Repatriation flows suffered a setback in the face of renewed warfare among the various mujahedin groups and the gradual takeover by the Taliban from 1994 onwards. A new outflow of Afghans sought safety and work in Iran in the period 1994– 2001, though they were not recognized as refugees. Increased border surveillance, prompted particularly by the incidence of drug trafficking, made most cross-border movement irregular and dependent on smuggling networks. d) The next movement was following the September 11, 2001 events in the US when the US and allied forces waged war on Afghanistan. e) Since November 2001: The fall of the Taliban and establishment of a new transitional administration. Within five months of the commencement of the joint facilitated return programme in March 2002, more than 1.3 million refugees returned with UNHCR assistance from Iran and Pakistan (UNHCR 2003a) The AREU studies on transnational networks of Afghans (AREU, 2005a and b; 2006) mirror a complex pattern of recent movements to Iran and Pakistan. These movements reflect the pre-1979 migration patterns driven by economic opportunities. AREU (2006) refers to these Afghans as “labour migrants” defined as “usually undocumented men whose families remain in Afghanistan, who work in Iran and regularly remit savings”. A better term is ‘migrant workers’. The AREU survey found that their families had never lived in Iran. They included daily labourers, small traders, sharecroppers, tenants and small landlords. The ILO survey of households did not distinguish between this category and those who had moved earlier. Table 3.3 indicates the broad patterns mentioned above. Out of the remaining population in January 2004, 41% arrived between 1978-85 during the Soviet occupation. Another 16% had arrived between 1986-91, partly reflecting the Soviet occupation and subsequent developments. The next bulge in arrivals was between 1996-2001 – the period of the Taliban. The broad distribution has remained unchanged by January 2006 although the numbers had fallen significantly. The last column of Table 3.3 shows the distribution of the Afghan population according to the 2005 ILO survey of Afghan households. It seems to have captured a higher proportion of the early arrivals compared to the UNHCR macro figures.
Table 3.3: Estimated Afghan population in Iran by year of exile

25
Year of Exile
(1)
Amayesh (as of
1/1/04) (2)
% of total
(3)
Remaining(as of
1/1/05) (4)
% of total
(5)
Remaining (as of
1/1/06) (6)
% of total
(7)
2005 ** Survey data %
(8)
Before 1978 33,831 2.4 26,626 2.8 26,343 2.9 1.5 1978-1985 519,233 36.9 377,602 39.6 368,390 40.0 40.8 1986-1991 214,935 15.3 150,263 15.8 147,262 16.0 26.3 1992-1995 107,536 7.6 62,229 6.5 57,302 6.2 10.1 1996-9/2001 (incl.) 532,625 37.8 341,621 35.9 328,762 35.7 18.6 After 9/2001 6 0.0 -5,539 -0.6 (7,811) -0.8 2.7 Total 1,408,166 100.0 952,802 100.0 920,248 100.0 100 Sources: Cols. 2-7 are UNHCR estimates. **- Col.8 - ILO 2005 Survey of Afghan Households in Iran – this refers to arrival dates of household heads only. With the fall of the Taliban regime in November 2001 and the stability of the new Transitional Authority in Kabul, hundreds of thousands of Afghans started returning home. A Tripartite Repatriation Agreement was signed by Afghanistan, Iran, and UNHCR. From 1 March 2002 to 31 October 2004, 770,643 Afghans returned from Iran with the voluntary repatriation operation. Table 3.4 provides the estimated number of Afghan population in Iran at different points in time. The steady decline shows the impact of repatriation.
Table 3.4 Afghan population in Iran
Year Number1994 1,623,3311998 1,400,7222000 1,482,0002002 1,104,9092003 834,699End 2005 920,248
Source: UNHCR Some features of the returnee movements are interesting. • The majority of returnees during 2002 had left Afghanistan within the last five
years; • A much higher than expected number (42%) returned to urban destinations. • Approximately 40% (predominantly single, undocumented men) repatriated
outside the official UNHCR assisted voluntary return process. • In relation to other ethnic groups, only a small proportion of the Hazaras
(predominantly Shia) returned to Afghanistan. The macro situation of the remaining Afghan population can be analyzed using the UNHCR data. Males are in the majority with 56% of the total. In terms of age distribution, 42% of the remaining population is 17 years and below. Fifty-one per cent is in the working age group (18-59 years).

26
Table 3.5. Estimated Remaining number and percentage
(as of 1/1/06) Age groups Female % Male % Total %
0-4 15,795 1.7% 17,800 1.9% 33,595 3.7% 5-17 183,175 19.9% 205,748 22.4% 388,923 42.3% 18-59 191,892 20.9% 277,451 30.1% 469,343 51.0%
60 more 9,982 1.1% 18,405 2.0% 28,387 3.1% Total 400,844 43.6% 519,404 56.4% 920,248 100.0%
Source: UNHCR
Only 11 per cent are in single member households with 89 per cent being in families.
3.3 Iranian government policy towards Afghans
It is generally accepted that Iran has been one of the most generous countries in the world in hosting a very large Afghan population for decades. The primary responsibility for foreign nationals in Iran lies with the Ministry of the Interior, in cooperation with the Ministry of Foreign Affairs and the Ministry of Labour. Refugee matters are handled by the Ministry’s Bureau of Aliens and Foreign Immigrant Affairs (BAFIA), established in the early 1980s. In 1976, Iran ratified the 1951 UN Refugee Convention and its 1967 Protocol with reservations regarding Articles 17 (wage earning employment), 23 (public relief), 24 (labour legislation and social security), and 26 (freedom of movement). The provisions in the Refugee Convention regarding the above Articles are meant to ensure in large measure the equality of treatment of refugees with nationals. For instance, Article 24 is meant to ensure that the refugees are covered by national labour law and also entitled to social security on par with nationals. The Government of Iran has treated the stipulations contained in articles 17, 23, 24 and 26 as being recommendations only with a view to protecting the interests of national workers in the labour market. For instance, the requirement under Article 17, for recognized refugees with residence permits to obtain work permits in Iran, has restricted them to mostly manual labour occupations. Even though the government did not grant many work permits, it has tolerated the presence of Afghan workers in labour shortage areas. Article 122 of the Labour Law of Iran provides that the Ministry of Labour and Social Affairs may issue, extend, or renew the work permits of immigrants from foreign countries, particularly Islamic countries, as well as those of refugees, provided they have a valid immigration or refugee card and are subject to the written agreements of the Ministries of the Interior and Foreign Affairs (AREU 2005b)

27
Iran (Islamic Republic of) Reservations to the 1951 Convention relating to the Status of Refugees
Subject to the following reservations:
1. In all cases where, under the provisions of this Convention, refugees enjoy the most favourable treatment accorded to nationals of a foreign State, the Government of Iran reserves the right not to accord refugees the most favourable treatment accorded to nationals of States with which Iran has concluded regional establishment, customs, economic or political agreements.
2. The Government of Iran considers the stipulations contained in articles 17,
23, 24 and 26 as being recommendations only.
Source: (UNHCR 2006)
Over the years, there have been important changes in the attitude of the Government of Iran towards Afghan refugees. The general feeling is that the Iranian government has been very generous in handling the refugee crisis for more than two decades, and that it should no longer shoulder this burden. There is a converging view on the part of the government that it is time for Afghans to return to Afghanistan, a view strongly advocated by BAFIA. This effectively applies to Iranian women also who marry Afghan men since they lose their Iranian citizenship in consequence and, until recent legislative changes, any children do not receive Iranian citizenship. While there are no reliable estimates, some quote a figure of 30,000 or so as being affected by this ruling. Loss of citizenship due to marriage to a foreign citizen is not a common practice internationally. This new attitude reflects Iran’s economic problems with high levels of unemployment, and changing political scenarios in the absence of a communist threat and the fall of the Taliban regime in Afghanistan. In 2003, the Executive Coordination Council for Foreign Nationals approved eleven articles entitled “Regulations on accelerating repatriation of Afghan nationals” (AREU 2006). These imposed a number of tough measures against Afghans including legal actions against employers for unauthorised employment of Afghans, denial of access to a number of essential services and also restrictions on renting of accommodation. The introduction of various restrictive measures and the strong emphasis on repatriation are signals to the Afghan community that they are no longer as welcome as before. The ILO case studies clearly show feelings of frustration and experience of discrimination among Afghans. (Movarekhi 2005).

28
The UNHCR has however, pointed out the many barriers that still remain to speedy return of the Afghan population. (UNHCR 2004a). It has also raised important concerns about the protracted refugee situation and the continued presence of the long staying component of the Afghan population still remaining in Iran and Pakistan. The UNHCR has succinctly summarized the situation as follows: “The Afghanistan situation remains one of the world’s largest and most longstanding refugee and displacement problems. Events since late 2001 have permitted substantial progress towards durable solutions. UNHCR remains committed to voluntary repatriation as the key strategy for the period 2003-2005. It is of the view, however, that the protracted nature of the problem has already evolved beyond the parameters of a refugee paradigm into a more complex, multifaceted challenge that will require additional solutions beyond 2005. It also holds the position that this type of challenge can only be addressed by innovative arrangements that go beyond UNHCR’s mandate and competence as envisaged by the High Commissioner through the Convention Plus initiative.” The most recent development is the Afghan Compact – the product of the 2006 London Conference - the result of consultations between the Government of Afghanistan, the United Nations and the international community. It represents a framework for co-operation for the next five years. The agreement affirms the commitment of the Government of Afghanistan and the international community to work towards conditions where the Afghan people can live in peace and security under the rule of law, with good governance and human rights protection for all, and can enjoy sustainable economic and social development.
Box 1: Perceptions of Afghan households about government pressures
• “Once they announce that Afghans should go back, and later we are told that we can remain. We are always under moral pressure.” • Our problem is being in an uncertain situation.” • “I could find a job one day and be without any job the next day.” • “We can easily feel that pressure especially in relation to the money they’re asking from Afghan students to get access to schools. • “We have no option but to remain silent because we are migrants”“ • I don’t go out because young people humiliate and abuse me.”
Source: Movarekhi 2005.

29
One relevant aspect of the Compact is that by 2010, the Afghanistan, its neighbours and countries in the region will reach agreements to enable Afghanistan to bring in skilled labour, and to enable Afghans to seek work in the region and send remittances home.7 This means that Afghanistan should develop the capacity and start to put in place policies and programmes and infrastructure for labour migration management within the next five years.
7 Government of Afghanistan (2006). Building On Success: The Afghanistan Compact. The London Conference on Afghanistan, 31 January - 1 February 2006-, London. http://www.ands.gov.af/admin/ands/ands_docs/upload/UploadFolder/The%20Afghnistan%20Compact%20-%20Final%20English.pdf

30
CHAPTER 4: THE AFGHAN POPULATION IN IRAN: THE DEMOGRAPHIC PROFILE
The present section describes the demographic and related characteristics of the population in the survey data that covered 1,505 sample households comprising of 8,430 persons. Some comparisons have been made for this sample population with the population in Iran and the population in Afghanistan itself, and the data from these have been obtained from various sources in Iran and from the population estimates made by the UN Population Division, as assessed in 2004.
As mentioned earlier in the report, the vast majority of Afghan refugees are to be found in two countries, Iran and Pakistan. While there are many similarities between the two refugee populations (e.g. reasons for migration, age and sex composition, etc.), there are also some differences between the two, such as ethnic composition. These differences will be highlighted where relevant.
4.1 Characteristics of the Afghan population and households
4.1.1 Large household sizes
The average household size in the survey population is 5.6 persons, which is higher than the average for Iran at 4.1 persons8. There are fairly large differences in the average household size among the provinces, ranging from 4.46 persons in Qazvin to 6.60 persons in Qom. Possible explanations for this could be higher Afghan fertility and migration with families.
In a similar study of Afghan refugees in Pakistan, the average household size was found to be 7.1 which is even higher9.
The sex ratio is 108 males per 100 females, and is higher than that for the Iranian population (103 males per 100 females).
8 - Iran statistical centre,” Survey of the specifications of employment and unemployment of households”, autumn 1383 (2004) in Farsi.. 9 Kemal A.R. and Nasir, Z.A., Afghan Population in Pakistan and their contribution to the Economies of Pakistan and Afghanistan,Report prepared for the ILO, 2006, draft.

31
Table 4.1. Afghans Population and Households by Province and City in Sample
Province City Population Households Average
household size Ray 737 150 4.91 Tehran 696 150 4.64 Varamin 665 110 6.05
Tehran
Total 2098 410 5.12 Rafsanjan 936 150 6.24 Kerman 868 150 5.79
Kerman
Total 1804 300 6.01 Najafabad 805 130 6.19 Isfahan 680 120 5.67
Isfahan
Total 1485 250 5.94 Mashad 1378 240 5.74 Khorasan Total 1378 240 5.74
Qazvin Total 580 130 4.46 Zahedan Total 590 100 5.90 Qom Total 495 75 6.60 Total Total 8430 1505 5.60
Chart 4.2: Afghan population by sex
4,383 , 52%
4,047 , 48%
Male Female
4.1.2 The Afghan population is relatively young.
About 40% of the surveyed households are 0-14 years old and 58.3% are in the 15-64 years group (Appendix Table A4.1). As a comparison, at the end of 2004 (1383), 27% of the population of Iran was 0-14 years old, and 68% were 15-64

32
years old. This indicates that the Afghan population resident in Iran is much younger than Iranians.
Table 4.2 compares the survey data on age groups with those of the Amayesh (2005) database and the last population census. There is broad correspondence among the different estimates
Table 4.2: Age structure comparison Age group Afghan survey
(2005) Amayesh (2005) Population
census (1995)
0-4 11.30% 3.70% 10.30% 5-17 37.00% 42.21% 37.00% 18-59 47.90% 50.98% 50.40% 60+ 3.80% 3.08% 2.30%
Total 8,430 743,856 60.055,000
Source: Mehran (2005).
It is normally more meaningful to look at the median age of a population to see if it is a young population.
Table 4.3 Median Age of Afghan Residents in the Sample
Born in Iran Afghanistan Pakistan Total Males 9.35 29.52 13.25 17.41
Females 10.01 30.20 14.40 17.60 Total 9.67 29.33 13.00 17.51
In the case of the Afghan population, the median age is 17.4, 17.6 and 17.5 years for the male, female and total population, indicating that while there are practically no differences in the age distribution of male and female Afghan populations living in Iran, the population is very young, pointing to a high fertility rate for the Afghan household. (As a rough guide, for young populations, the proportion of the population under 15 years of age provides a fairly good indicator for the crude birth rate).

33
The dependency rate, calculated as the proportion of children and old population to the population in the working age groups, for the survey population is 71.6 percent. This means that each 100 working age people have to support 71 dependents. The dependency rate for the population in Afghanistan is much higher at 96.9 percent implying almost one worker to one dependent. The rate for Iran is 49.8 percent only since it has a much lower proportion of population in the 0-14 year’s age group.
4.2 Population structure: Afghanistan, Iran and Pakistan The population of Iran has grown from 39.3 million in 1980 to 69.5 million in 2005, according to the UN Population Division estimates. This compares the 920,000 documented Afghans as of early 2006 according to registration (amayesh) data, which is just about one percent of the total Iran population. The growth in the Iran population has slowed down in recent years because of a sharp decline in fertility, which is also reflected in the population pyramids as well as the increase in the median age, which has gone up from 17.5 years to 23.4 years over the last 25 years. This increase (as well as the age distribution is uniformly distributed by sex; the median age for males has gone up from 17.4 years to 23.2 years for males and from 17.7 years to 23.6 years for females during the same 25 year period 1980-2005. The proportion of children below 14 years of age has gone down from 44.7% to 28.7% between the period 1980-2005, with very slight variation by sex. This has not yet resulted in any significant increase in the older ages (65 years and above). While the percentage increase in this age group has been significant (a 36% increase from 3.3% to 4.5% in 25 years), this percentage is still just about 4.5% of the total population. No doubt this would have a more notable reflection in future years. The population of Iran was growing at the rate of about 3 percent per year during the period 1965 to 1980. This increased to over 4 percent in the next quinquennial period partly due to influx of migrant population, but has since declined, both due to a reduction in the fertility and due to reduction in the immigration. The annual growth rate during 2000-2005 was of the order of 0.9 percent.
Chart 4.3: Afghan Population by age group % share
11%
13%
30%
42%
4%
0-4 5-9 10-19 20-59 60 and above

34
There have been some perceptible changes in the overall sex ratio. It has declined from 104.7 males per 100 females in 1980 to 102.9 males per 100 females, probably due to slightly higher increase in the expectations of life at birth for females. The expectation of life for males at age zero has gone up from 58.8 year to 68.8 years during the period 1980-85 to 2000-2005, and from 60.7 years to 71.7 years for females over the same time period. The ILO has undertaken some projection scenarios that would indicate the likely effect on Iran population under various assumptions regarding the future of Afghan refugees’ return to their homeland. The scenarios are necessarily for short-term, until 2010, in view of the uncertainties regarding the assumptions regarding refuges return in the long term. The various scenarios envisaged (i) no refugees return during the next five years, (ii) refugees returning at the rate of 120,000 per year during the period 2005-2010, and (iii) refugees returning at the rate of 200,000 per year (so that there are no Afghan refugees left in Iran at the end of the five year period). In the extreme scenario of all the refugees being repatriated, the Iranian population would be of the order of 73.4 million in 2010 instead of 74.3 million, a difference of just over 1%. The impact on the population of Afghanistan, however, would be relatively significant, and would also include the return of refugees from Pakistan. In the situation where all Afghan refugees are repatriated both from Iran and from Pakistan in the next five years, the population of Afghanistan is projected to increase by more than 8% while the labour force would increase from 10.2 million in 2005 to 13.5 million in 2010, an increase of nearly 32 percent in 5 years resulting in increased unemployment, since the Afghan economy is unlikely to generate such a large number of new jobs during the next five years. The age pyramid of the Afghan residents in Iran shows a remarkably close resemblance to that for the Iran population, and markedly different from that of the resident parent population in Afghanistan.

35
Chart 4.3: Afghans in Iran: Age Pyramid
20 15 10 5 0 5 10 15 20
+0-4
+5-9
+10-14
+15-19
+20-24
+25-29
+30-34
+35-39
+40-44
+45-49
+50-54
+55-59
+60-64
+65-69
+70-74
+75-79
+80-84
+85+
Age
% Population
Female
Male
Chart 4.4: Iran Population 2005
15 10 5 0 5 10 15
+0-4
+5-9
+10-14
+15-19
+20-24
+25-29
+30-34
+35-39
+40-44
+45-49
+50-54
+55-59
+60-64
+65-69
+70-74
+75-79
+80-84
+85+
Age
% Population
Female
Male
Chart 4.5: Afghanistan Population 2005
25 20 15 10 5 0 5 10 15 20 25
+0-4
+5-9
+10-14
+15-19
+20-24
+25-29
+30-34
+35-39
+40-44
+45-49
+50-54
+55-59
+60-64
+65-69
+70-74
+75-79
+80-84
+85+
Age
% Population
Female
Male

36
4.3 The second generation of the Afghan population in Iran 53.3% of the sample population was born in Afghanistan, 46.2% born in Iran and less than 0.5% was born in other countries. The high ratio of Iran-born persons indicates the long duration of stay of persons in many households in Iran.
Table 4.4: Afghan Population by Sex and Place of Birth
Place of Birth Male Female Total Iran 2025 1871 3896 Afghanistan 2338 2156 4494 Pakistan 18 14 32 Others 2 6 8
Total 4383 4047 8430 Based on Appendix tables A4.2 and A4.3
42.0
44.0
46.0
48.0
50.0
52.0
54.0
% share
Male Female
Gender
Chart 4.7: Place of birth
IranAfghanistan
.
The younger population, to a large extent, would obviously have been born in Iran. The median age of the Iran born Afghans is only 9.67 years, compared to 29.33 for those born in Afghanistan. Not surprisingly, a very large proportion of population below 15 years was born in Iran, and practically all Afghans living in Iran above the age 25 years (age group 5) were born in Afghanistan.
4.4. Ethnicity and migration patterns The ethnic distribution of Afghans shows that the majority are Hazara (34.6%) while Tajiks (22%) and Pashtun (11%) form the other major Afghan ethnic groups.

37
Table 4.5 Afghan Population by Sex and Ethnicity
Ethnicity Male Female Total Per cent Tajik 965 891 1856 22.0 Hazara 1474 1442 2916 34.6 Uzbek 101 84 185 2.2 Pashtun 520 382 902 10.7
Other Afghans 1268 1192 2460 29.2 Iranian 6 13 19 0.2 Other nationality 49 43 92 1.1
Total 4383 4047 8430 100.0
Duration of stay and reasons for moving
The average duration of residence of Afghans in Iran who were born in Afghanistan is 15 years, with over 70 percent of these having been resident for more than 10 years. While this may not be representative of the overall Afghan population still in Iran, it does indicate that many of the households surveyed are long stayers. About 48% of Afghans have entered Iran about 15-24 years ago during the war between Soviet Union and the Afghan mujahidin; 23% of them entered 5 to 9 years ago during the war between various Islamic groups, and following the ascendancy of the Taliban. About 3% of the Afghans have entered during the removal of the Taliban by the coalition forces.
Table 4.6 Afghan Population by Sex and Years of Residence 10 years and above
Years of
Residence Male Female Total Percent
0-4 149 101 250 5.8 5-9 504 484 988 23.0 10-14 350 317 667 15.5 15-19 485 498 983 22.9 20-24 551 513 1064 24.8 25-29 185 139 324 7.5 +30 15 4 19 0.4
Total 2239 2056 4295 100.0
Reasons for migration and residence permits
40% of the Afghans born in Afghanistan have given escaping from war and insecurity as the reason for migration to Iran, while 54% were accompanying their household and relatives.
Table A4.4 was compiled according to age groups and reasons for migration. Among the persons who gave escape from the war as the reason for migration, 13% of males and about 28% of females were under the age of 10 years at the time of migration. One would think that a great majority of these would fall under the reason “accompanying the family members”. It is, therefore more meaningful to look at the reasons for moving of the heads of households, rather than all the

38
population. If we limit the sample to the head of household, 80% have migrated due to escaping from war and insecurity, 11% accompanying household and relatives and 7% for job search.
In this sample 93% of the Afghan immigrants have claimed that they have obtained some permit document to stay in Iran as a foreigner (Table A4.5). There was no attempt at verification of this response, and it is quite possible that the actual situation may be different because many would not admit to being unauthorized. Any attempt at further probing could have led to non-cooperation given the fear that information will be shared with the authorities.
Out of these 4,295 persons (10 years and above), there does not seem to be much variation by age in the older age groups (30 years and above), with almost 95 percent of the population with valid papers. The younger age groups have slightly lower percentages. In almost all age groups with two exceptions, the male population seems to have a slightly lower percentage with valid papers.
Only 276 persons admitted to be without valid resident permits, distributed proportionately equally among males and females.
Most Afghan residents in Iran generally have a good command of the Farsi language and less than one percent has mentioned inability to speak or understand Farsi.
About half of the Afghans born in Afghanistan in this sample have travelled to Afghanistan during their stay in Iran.
4.5 Marital status Analysis of the marital status of Afghans aged ten and above in this sample shows that about 49.5% of the population are married, while 47% have not yet married. For Iran, the corresponding figures are respectively 53%, and 42.6%10. The lower age of marriage by Afghans compared to Iranians is due to the younger age structure of the Afghans.
Table 4.7. Afghan Population by Sex and Marital Status
Marital Status Male Female Total
Per cent Married 1597 1569 3166 49.5 Widowed 33 191 224 3.5 Divorced 8 12 20 0.3 Never married 1662 1326 2988 46.7
Total 3300 3098 6398 100.0
One way to look at the marital status is to compute singulate mean age at marriage. The methodology to compute this involves taking proportion of never married persons over 15-54 years age group, and presuming that no marriages occur after this age. Using this technique, we get the following table:
Table 4.8. Singulate Mean Age at Marriage (Afghan Population) 10 Iran statistical centre, 2004.

39
Kerman Mashhad Esfahan Sistan & Baluchistan
Tehran Qom Qazvin
Total 20.88 24.78 22.68 22.63 24.21 21.71 21.60 Male 22.44 26.18 23.99 24.09 26.04 24.05 23.52
Female 19.40 23.47 21.55 21.01 22.02 19.62 18.95
While the age at marriage for Afghan males is uniformly higher than that for females, which is to be expected, there are significant variations among regions where they live. The age at marriage is highest in Tehran and lowest in Kerman. The average difference in the age at marriage for males and females also varies from 2.44 years in Esfahan to 4.57 years in Qazvin. The reasons for these differences need farther analysis.
4.6 Housing and accommodation The majority of households (82.5%) live in rented houses with only 7% of the households having their own house. This is quite at variance from that observed in Pakistan where, more than a third of the Afghans owned their houses and less than half were living in rented quarters.11 This factor will also affect the savings and remittance capacity of the households because the rent would absorb a good part of the earnings.
Table 4.9. Afghan Households by Nature of Housing Occupancy
Nature of housing occupancy Freq. %
Rented 1241 82.5 Non personal owner 53 3.5 Gholname owner* 40 2.7 In workplace 41 2.7 Housekeeper 12 0.8 Free 113 7.5 Others 5 0.3
Total 1505 100 * Informal purchase transaction between buyer and seller without formally registering with the government.
The case studies have shed more light on the housing and accommodation issues (Movarekhi 2005). Housing instability and frequent dislocation were reported as major sources of stress. Afghan residents often had to move out regularly, on short-term intervals, and find other accommodations, and were faced with unregulated and unaffordable rents.
11 Kemal and Nasir, op. cit., 2006.

40
• 2 respondents owned their own house • 1 respondent was renting from agencies • 17 respondents were renting from individuals • 3 respondents were sharing house • 2 respondents were living in workplace
Several households with very low incomes were sharing a house. The monthly rent usually ranged between 30,000 and 70,000 tomans ($33-78). The restrictions imposed on Afghans in addition to financial constraints often compelled more than two families to share a house. Forced evacuation was also reported as frequent, when the landlord was not satisfied enough with the amount paid, or when there was delay in the payment of the rent. All of the case study Afghan houses in Tehran and Qazvin except one were equipped with the following basic facilities and durable goods: water, electricity, gas cylinder, fixed phone, TV-set and refrigerator.
4.7 Education and the Afghan population Low educational attainments characterize the Afghan population. 31% of the population aged six and above in this sample are uneducated (women 36%, men 26%) and about 50% have only primary or secondary school education.
In Iran 15% of the population of aged 6 and above are uneducated (women 20% and men 11%). About 57% have only primary and secondary school education1. It can be observed that illiteracy among Afghan immigrants is twice that of the Iranians. (But the differentials between men and women are the same).
1 See: Iran Statistical Centre, 2004. (cited by Noroozi).
Table 4.10. Afghan Population by Sex, Age Group and Literacy
Literacy Age group Male Female TotalAttending school 484 372 856 Literate 371 423 794 Illiterate 270 259 529 Total
6=<Age<15yrs
1125 1054 2179 Attending school 158 134 292 Literate 1767 1321 3088Illiterate 715 1009 1724Total
Age>=15yrs
2640 2464 5104 Attending school 642 506 1148 Literate 2138 1744 3882 Illiterate 985 1268 2253
Total
Age>=6yrs
3765 3518 7283

41
Dividing the population into two age groups 6-14 & 15 years and above, we note that the illiteracy rate of Afghan girls and boys aged between 6-14 years is similar at 24%. However, for the 15 years old and above this rate is 27% for men and 41% for women.
There are significant differences in the literacy level among provinces, ranging from 54% in Qazvin (for males), to 84% in Mashhad. Qazvin is the only province where females have a higher literacy rate than for males, though the difference is small.
0102030405060708090
Per cent
Ker
man
Mas
hhad
Esf
ahan
Sis
tan
&B
aluc
hist
an
Tehr
an
Qom
Qaz
vin
Location
Chart 4.4: Literacy Level by Districts
Males Females
71% of the Afghan population aged six and above with education have obtained their education in Iran, 21% in Afghanistan and 8% in khodgardan Afghani schools. The Khodgarden schools are managed by Afghans in Iran and are not under the supervision of Ministry of Education in Iran.
The case study findings showed a general feeling of deep frustration and injustice among Afghans in terms of accessing educational services in Iran. Although they were highly motivated to get on with their education, children in most of the households studied had either no right to go to school or faced unfounded expulsion in the middle of their studies. The most recent restrictive measures by the Iranian government – making all Afghans either pay high fees to access Iranian education services or preventing them from continuing education - had further enhanced this feeling of grievance and were major causes of stress and concern among respondents. These restrictions were also generally regarded as a means of pressure for them to return to Afghanistan. Out of the 23 respondents who had children, 13 had their children currently prevented from attending Iranian schools. The remaining 10 had their children attending school. The respondents regarded the Afghan community

42
“private” schools as having poor facilities and teaching quality. The cost of schooling fees was about $167 per year for Iranian schools and about $28 in Afghan schools. The Afghan community believed lack of access to Iranian education would handicap their children in contributing to Afghan development on their return to Afghanistan
Table 4.11. Afghan Population by Sex and Education
(% of total) Education level Male Female Total
Illiterate 26.2 36.1 31.0 IR-primary 22.1 23.9 23.0 IR-secondary 15.3 14.2 14.7 IR-high school 7.9 9.5 8.7 IR-vocational technical 0.3 0.1 0.2 IR- university 1.3 0.6 1.0 IR- religion education 0.7 0.0 0.4 IR-informal 0.6 1.3 0.9 AF-primary 8.1 3.9 6.0 AF-secondary 3.5 1.9 2.7 AF- high school 3.9 1.7 2.8 AF-vocational technical 0.2 0.0 0.1 AF-university 2.1 1.0 1.6 AF-relational education 1.4 0.3 0.8 AF-informal 0.4 0.3 0.3 Unknown 0.7 0.7 0.7 Khodgardan Afghani* 5.4 4.7 5.0
Total% 100.0 100.0 100.0 Total 3760 3516 7276
The Altai survey of Afghanistan (2006) found the following information on the level of education across all surveyed households.
Highest level of education of household members
Total children < 16 adultIlliterate 42% 34% 47%Primary education 26% 50% 13%Lower secondary education 12% 12% 13%High school 13% 3% 18%University degree 4% 0% 7%English 0% 0% 0%Computer 0% 0% 0%Other 1% 1% 2%N=3340 100% 100% 100% According to Altai findings, illiteracy in the surveyed households is higher among adults than among children. 70% of children between the age of 6 and 16 go to school (65% of girls, 74% of boys), 29% of them are still illiterate. Among adults, 47% are illiterate, but this had to be crossed with age and gender: Illiteracy is stronger among the over 40 age group (56, 5%), and among women: 54% among adult women under

43
40, and 78% over 40 years old. The Afghan population in Iran has reported lower illiteracy levels. This overall picture for Afghanistan shows a positive trend while the children remaining in Iran face difficulties in attending Iranian schools due to high costs.
4.8 Conclusions
The Afghan population in Iran is characterized by its youth. The relatively young population is the result of high fertility among the Afghans. In comparison to the Iranian resident population, it is less well educated, and marries at a younger age. A majority of the population was born in Afghanistan, but with the increasing duration of residence in Iran, the proportion of Afghans born in Iran is catching up with those in born in Afghanistan. The main reasons for moving to Iran were escaping from war and accompanying the family members. A very small proportion owns property, and almost all of them claim to have legal resident permits. There are some noticeable differences among Afghan refugees in Iran and those in Pakistan. The literacy rate for the sub-population in Iran is substantially higher than that in Pakistan, the average household size is lower and the ownership of properties is equally lower in Iran than in Pakistan. There also are ethnic and religious differences in the refugee populations in the two countries, with the majority migrating from the areas nearer the borders of the country concerned, and a significant percentage of the Afghan population in Iran being Shia. The impact on the population, size, and composition of the Afghan population cannot be considered very significant. The numbers of Afghan refugees have declined over the years, and now they are less than 2 per cent of the total population of Iran.

44
CHAPTER 5: THE AFGHAN POPULATION: LABOUR AND EMPLOYMENT
The demographic profile discussed in the previous chapter has important implications for the labour force and employment patterns of the Afghan population which will be highlighted in this Chapter. The nature of the movement of the Afghan population into Iran and Iranian government polices are other crucial factors in deciding the labour market and employment outcomes. Almost all have entered initially as refugees fleeing from a conflict situation in Afghanistan. They have not come into Iran under any formal labour migration system. AREU’s transnational network research has revealed the emergence of informal labour migration patterns with bordering provinces in both Iran and Pakistan. The reservations made by the Government of Iran on the 1951 Convention of Refugees and the associated Protocol of 1967 have effectively restricted Afghan persons to low skilled occupations. Very few have been granted the status of refugees and right of settlement in Iran. Thus even those who have stayed more than 20-30 years would be regarded as in temporary status. All these affect the status of Afghan persons in the labour market, and their relations with the local employers. This chapter uses the data from the Afghan Household survey.
5.1 Activity Status of the Afghan Population
Not surprisingly, the survey population has a relatively high activity rate for the Afghan male population (aged 10 and above) at 65.4%, though the labour force participation rates for females is quite low at 8.2 percent, with an average of 41 percent for the total population. The corresponding rates for the Iranian population in the end of 2004 were 38.5% and 10.3% respectively.

45
0.010.020.030.040.050.060.070.080.090.0
100.0
Per
cen
t
Working Absent from work Not workingActivity status
Chart 5.1: Activity status of Afghan population
Male Female
Table 5.1 Afghan working age population
(10 years and above) by activity status
Activity status Male Female Total % of Total
Working 2043 244 2287 35.7 Absent from work 148 9 157 2.5 Not working 1110 2847 3957 61.8 Total 3301 3100 6401 100.0
The Employed
About 8% of the Iranian employees and 25% of the Afghan employees are aged between 10-19 years. It is logical that the average period of schooling among Iranian will be more than Afghans. The Afghan children would start working at a younger age, giving the Afghan population a higher participation rate. This is especially true for males.
There is a marked divergence in the labour force participation rates among Iranian men and women - 44.6% and 11.6% respectively. The corresponding participation rates for Afghan men and women are higher at 69.1% and 10.4% respectively.12
12 Cited by Ms. Noroozi (2005) based on Iran Statistical Centre, 2004

46
Table 5.2 Afghan Labour Force by Sex
Activity Male Female Total
Employed 2191 253 2444 Unemployed 90 69 159
Total 2281 322 2603
Source: Afghan Household Survey
About 80% of Afghans work in three sectors; manufacturing, construction and trade and commerce. Less than 10% work at the agriculture sector. Only 26% of Iranian employees work in the three sectors mentioned above which are mostly in the private sector. Most of the Iranians work in the service sector, which is usually public. Afghan workers work for long hours, are not under insurance and work regulations, and have relatively low wages.
Source: Household survey Table 5.4 provides some data for the overall economy of Iran. While the household data may not be fully representative of the overall Afghan population numbers in Iran, amayesh data can be used as a comparison. The most recent registration exercise in Iran estimated the total number of remaining documented Afghans as of January 2006 to be 920,428 (519,404 males and 400,814 females). This is about 1.3 per cent of the total Iranian population. To assess their size in the labour market, we can apply the same labour force participation rates as observed in the survey (Table 5.3) to these numbers. Then the total economically active Afghan population in Iran is estimated at 400,593 persons (358,908 males and 41,685 females). This represents only 1.8 per cent of the total active Iranian labour force of 23.7 million in 2005. These indicate that the macro impact of the Afghan population and labour force cannot be considered significant in the Iranian economy to affect overall employment and unemployment
Table 5.3 Afghan Activity Rate and Unemployment Rate by Age and Sex
Activity rate Unemployment rate Age group Male Female Total Male Female Total
10_14 13.6 3.6 8.7 14.4 26.1 16.4 15-19 64 13.5 39.2 10.9 28.9 14 20-24 88 17.9 52.6 3.8 22 6.9 25-29 96.6 11.1 58 0.6 18.8 2.2 30-34 97.2 12.3 53.4 1 25 3.8 35-39 98.1 10.2 50.8 0.5 8 1.3 40-44 98 8.1 52.2 1 11.8 1.9 45-49 94.4 13.8 62.2 1.1 16.7 2.5 50-54 90.8 7.1 54.8 2.5 0 2.4 55-59 82.4 6.5 51.8 1.8 0 1.7 60-65 63 1.5 34.1 6.5 0 6.4 +65 30.3 3.7 18.9 3 3.3 5.6
Total 69.1 10.4 40.7 3.9 21.4 6.1

47
levels. Research in other countries where immigrant population is more than 10 per cent of the population also have not found much impact on employment and wages of local workers (ILO, 2004). The Afghan unemployment rates are much lower than the Iranian unemployment rates. But this may only reflect the fact that the Afghan workers have to undertake any form of work as a survival strategy in the informal and other sectors whereas Iranians, particularly educated youth, can afford to wait for better jobs in the formal sector including public sector employment.
Table 5.4: Islamic Republic of Iran: Population and Employment, 2000/01–2004/05
(in thousands except for ratios).
2000/01 2001/02 2002/03 2003/04 2004/05 Population 63,515 64,584 65,657 66,680 67,656Urban 40,627 41,722 42,835 43,902 44,923Rural 22,887 22,862 22,822 22,778 22,733Male 32,216 32,749 33,283 33,822 34,310Female 31,299 31,835 32,374 32,858 33,3460–14 years 21,355 20,803 20,507 19,774 19,33715–54 years 36,515 37,994 39,216 40,900 42,16855+ years 5,661 5,787 5,934 6,006 6,151Active population 19,135 19,812 20,429 21,014 21,568Employment 16,437 16,900 17,937 18,639 18,906Unemployment 2,698 2,912 2,492 2,375 2,662Population growth rate % 1.6 1.7 1.7 1.6 1.5Active population % of total 29.2 29.6 30.2 31.5 31.9Unemployment rate 14.1 14.7 12.2 11.2 12.2 Sources: International Monetary Fund (2006) Islamic Republic of Iran: Statistical Appendix, Country Report No. 06/129, April 2006; See same for descriptions

48
The sectoral distribution of Afghan workers shows that the share of agriculture is low reflecting more or less its share in the overall economy. Manufacturing share is high at 30 per cent, but this will mostly reflect small and medium enterprises as shown later. Construction is also important as a source of employment for workers with low skills. The services sector may reflect largely informal sector activities.
Table 5.5. Afghans Currently Employed By Sex and Branch of Economic Activity (%)
Branch of economic activity Male Female Total
Agriculture 9.9 5.9 9.5 Manufacturing 26.2 58.9 29.6 Construction 28.6 1.2 25.8 Wholesale, retail & trade 25.1 2.8 22.8 Transport & Communication 2.9 0.0 2.6 Other services 7.2 31.2 9.5
Total % 100.0 100.0 100.0 Total number 2191 253 2444
Source: Household survey
The distribution of Afghan employees according to employment status shows that regular worker (39%), casual worker (28%) and self-employed (23%) are the most important categories. There are very few employers among the survey population, though there is a significant proportion of self-employed or own account workers among the total workers.
Table 5.6 Afghans Currently Employed by Sex and Employment Status (% of Total)
Employment status Male Female Total
Employer 1.7 0.0 1.5 Self employed 23.1 15.4 22.3 Unpaid family worker 3.4 7.5 3.8 Private regular worker 39.0 38.7 39.0 Seasonal worker 4.7 4.3 4.7 Private casual worker 28.1 34.0 28.7
Total % 100.0 100.0 100.0 Total number 2191 253 2444
Hours of work
The average working week for Afghan men is 51.3 hours per week, with women averaging 30 hours a week and the overall work week at 49 hours. In the youth group, women’s work hours are much higher, keeping in mind, however, that the number of total employed women is quite small. The average weekly work hours of both Afghan and Iranian men employees are similar, but the work hours for women in Iran are

49
much higher than for Afghan women (38.9 hours) because the majority of Iranian women work in the public sector13.
Source: based on Table A5.1
5.2 Conditions of Work: Remuneration, and Other Working Conditions 5.2.1 Earnings and remuneration14
The average weekly income of Afghan male employees is 33,400 tomans (1 toman=10 Rials) compared to 10,600 tomans for females. This translates to about $37 per week for males and $11.75 for females. According to the urban household survey of income and expenditure of the Statistical Centre of Iran in 2000, the employed Iranian men living in cities had approximately 2.2 times higher income than employed women. Some part of the difference between the men and women’s income is due to the difference in their work hours15, and the kind of work that they are doing. Women may be employed in lower paid jobs associated with lower or no responsibilities. In addition, males are generally better educated, which is positively associated with higher earnings.
The education level of Iranian employees (especially women employees) is much higher than that of Afghan employees and as the education level rises, the disparity in income decreases between the two sexes. Thus the gap between earnings of Iranian men and women is less than that for the Afghans.
13 Iran statistical centre, 2004. 14 For calculation of US dollar values, an exchange rate of 9003 Rials to one US dollar has been used. This is the average for 2005 Q1-Q3 (which coincides with the survey period) as given by the Central Bank of Iran. The income size group tables were originally based on Iranian currency, and later converted to US dollars as requested by UNHCR. 15 Ladan Noroozi: “Gender analysis of labor market in Iran”, Management and planning organization, 2004 (in Farsi)
0.0 5.0
10.0 15.0 20.0 25.0 30.0 35.0 40.0 45.0 50.0
% e
mpl
oyed
0-13 14-24 25-49 50-74 75-99 100+
Hours per week
Chart 5.2 Hours of work per week
MaleFemaleTotal

50
The weekly income classified by industrial sectors (Table 5.8) shows that the average weekly income of men in different sectors is not very different ranging between 30,000–36,000 tomans ($33-$40)16. Among sectors, the construction and the industry sectors have comparatively higher earnings than other sectors.
Given the small number of women employed in the survey population, the analysis of female wages should be considered with caution. The weekly income of Afghan woman employees varies from about 7,000 tomans ($7.80) in the industry sector to 26,000 tomans ($29) in the agriculture sector. The male/female wage ratio is generally above 200 indicating large discrimination in wages suffered by women. While the small number of females in each sector makes it difficult to make a clear conclusion, it is consistent with the general pattern.
Table 5.8 Average Earnings of Afghan Employed Per Week (US$) by Sex and Branch of Economic Activity
Branch of economic activity Male Female Total F/M
ratio
Agriculture $34.75
(217) $28.64
(15) $34.36
121.3
Manufacturing $39.95
(574) $7.64
(149) $33.25
522.7
Construction $38.22
(626) $18.88
(4) $38.16
202.4
Wholesale, retail & trade $34.98
(551) $15.71
(7) $34.73
222.7
Transport& communication $34.11
(64) - $34.11
Domestic servants $50.96
(4) - $50.96
Other services $33.38
(154) $16.01
(79) $27.56
208.5
Total $37.10
(2190) $11.74
(254) $34.45
315.9
The numbers in parentheses above refer to the number of persons in the particular branch of economic activity.
The majority of the women fall in the low-income categories with 92 per cent earning below 30,000 tomans ($33). The corresponding percentage for males is 43%.
16 This is except for house servants who have a weekly income of 46,000 Tomans ($51), but it is not considered significant since there were only four persons in this sample.

51
Table 5.9 Afghans Currently Employed by Sex and Average Earnings
per week (US$ and Cumulative %) Average earnings per week (in US$)
Male Female Total Male % cuml.
Female % cuml.
Total % cuml.
0-5.54 37 81 118 1.8 32.7 5.0 5.55-11.19 72 69 141 5.2 60.5 11.0 11.10-22.20 242 55 297 16.7 82.7 23.7 22.21-33.31 549 22 571 42.9 91.5 48.0 33.32-44.41 551 12 563 69.1 96.4 72.0 44.42-55.53 381 4 385 87.3 98.0 88.4 55.54-66.64 155 2 157 94.7 98.8 95.1 66.65-77.74 57 2 59 97.4 99.6 97.6 77.75-88.85 33 0 33 99.0 99.6 99.0 88.86-99.97 12 1 13 99.5 100.0 99.6 99.98+ 10 0 10 100.0 100.0 100.0 Total 2099 248 2347
One would expect that the earnings of workers would grow with the length of their stay in Iran, in keeping with the additional experience gained in the jobs. At first glance, that does not seem to be the case for the first few years of the duration of stay in Iran. In fact, the highest average income (if we discount the outliers) is for workers with less than one year of stay, and it continues to decline with the duration of stay in Iran until 6 years, when it flattens out until about 15 years of stay, and then gradually increases, with a positive correlation beyond a stay of 20 years or more (Table A5.2). The linear regression coefficient between the income and the residence in Iran for Afghan population is 0.40 and the R-square is 0.16. However, if we split the group into two separate subgroups (i.e., up to six years of stay in Iran and from 7 to 32 years of stay) the picture is much different. The correlation for the first group is high negative at -0.62 (with the R-square of 0.38), and for the second group, it is positive at 0.58 with the R-square at 0.33. The table below provides this information:
Table 5.10 Income per week by years lived in Iran appendix
Years lived
in Iran Correlation R-square
1-6 years -0.6198936 0.3842680 7-32 years 0.5752190 0.3308769 1-32 years 0.4013243 0.1610611
However, if we look at a similar table, using numbers of years worked in Iran (rather than the duration of residence), the overall correlation is much more as expected, i.e., the more experienced persons get jobs with higher income (Table A5.3). 5.2.2 Other conditions of work
Afghan workers in Iran seem to be prepared to undertake work without any pre-conditions. In this sample, less than 3% of the Afghan employees had written contracts, 77% had only an oral contract with the employer and the rest 20% had no clear defined contract with their employer.

52
Chart 5.3: Type of employment contract
Written contract, 2.8
Oral contract, 77.5
Unspecified, 19.7
In such circumstances, one can not expect much in the way of fringe or supplementary benefits, and more than 99% of Afghan employees did not have any type of work-related insurance (accident, unemployment and retirement insurance) and more than 95% of Afghan employees were not entitled to any paid annual or sick leave.
Table 5.11 Afghan Employed by Sex and Work Accident Insurance
Work accident insurance Male Female Total
Yes 12 0 12 No 2179 253 2432 Total 2191 253 2444
Other insurance Male Female Total Yes 16 5 21 No 2175 248 2423
Total 2191 253 2444
Movarekhi (2006) summarises from the case studies: “The benefit of working in Iran as a migrant was that at least Afghans could find a job. However, the usual rule was low salary, long working hours, no insurance and benefits, and no job stability and security. Afghans usually had to accept hard work in order to survive and the average number of working hours per day was 12-18 hours”. While most of these persons have reported having work permits or authorization for employment, they are not subject to labour laws and regulations of Iran. This is the major reason for employers to deny them such benefits, and can explain why Iranian employers may be more eager to employ Afghans instead of Iranians.
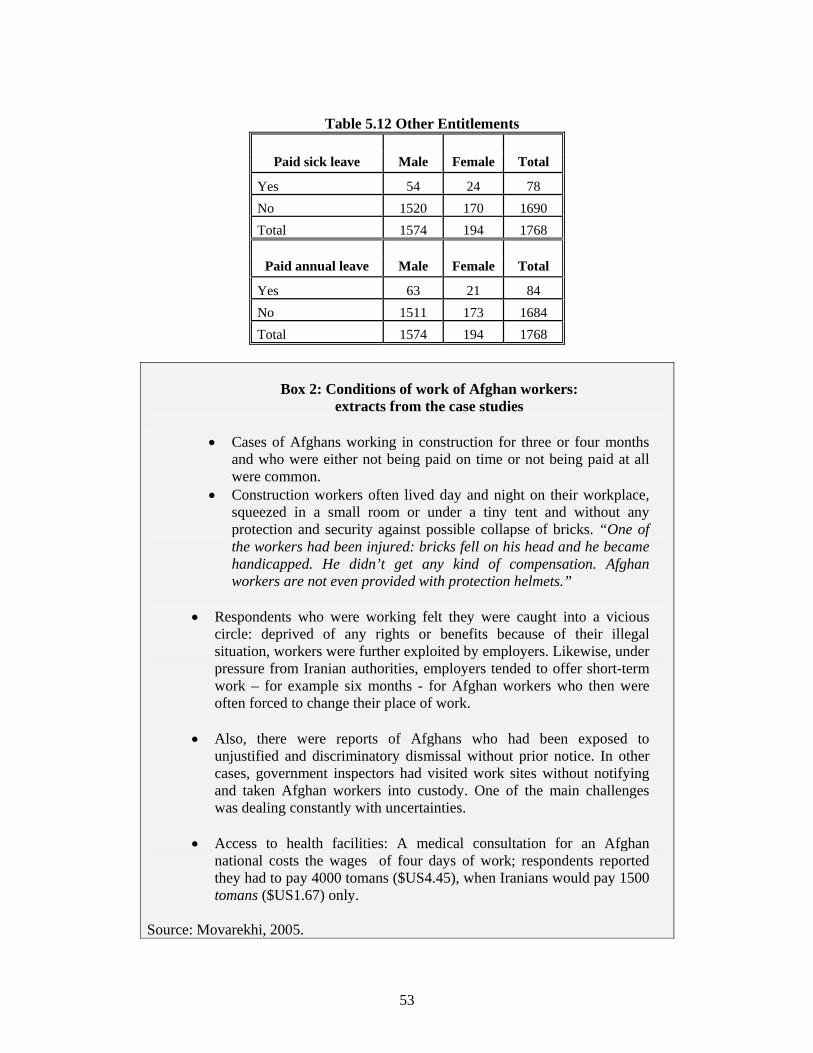
53
Table 5.12 Other Entitlements
Paid sick leave Male Female Total
Yes 54 24 78 No 1520 170 1690 Total 1574 194 1768
Paid annual leave Male Female Total
Yes 63 21 84 No 1511 173 1684 Total 1574 194 1768
Box 2: Conditions of work of Afghan workers: extracts from the case studies
• Cases of Afghans working in construction for three or four months
and who were either not being paid on time or not being paid at all were common.
• Construction workers often lived day and night on their workplace, squeezed in a small room or under a tiny tent and without any protection and security against possible collapse of bricks. “One of the workers had been injured: bricks fell on his head and he became handicapped. He didn’t get any kind of compensation. Afghan workers are not even provided with protection helmets.”
• Respondents who were working felt they were caught into a vicious
circle: deprived of any rights or benefits because of their illegal situation, workers were further exploited by employers. Likewise, under pressure from Iranian authorities, employers tended to offer short-term work – for example six months - for Afghan workers who then were often forced to change their place of work.
• Also, there were reports of Afghans who had been exposed to
unjustified and discriminatory dismissal without prior notice. In other cases, government inspectors had visited work sites without notifying and taken Afghan workers into custody. One of the main challenges was dealing constantly with uncertainties.
• Access to health facilities: A medical consultation for an Afghan
national costs the wages of four days of work; respondents reported they had to pay 4000 tomans ($US4.45), when Iranians would pay 1500 tomans ($US1.67) only.
Source: Movarekhi, 2005.

54
5.3 Unemployment among the Afghan Population In this survey, unemployment has been defined on the basis of the criterion of actively seeking work. Thus an unemployed person had no work during the reference period, and also he/she had been looking for work in the last four weeks.
Table 5.13 Currently inactive Afghan population by reason for not looking for work
Reason for not looking for work Male Female Total
Waiting to start job already found 79 65 144 Waiting to return to previous job 1 5 6 Discouraged in search 6 15 21 Waiting for seasonal work 5 0 5 No authorization for work 94 151 245 Student 455 423 878 Household work 12 1467 1479 Too old or invalid 133 204 337 Others 239 454 693 Total 1024 2784 3808
Only 159 persons were found to be unemployed in the sample. As mentioned earlier the unemployment rate for Afghan men in this sample is 3.9% and woman 21.4%, in spite of the low participation rate of Afghan women in the labour force. 43% of unemployed Afghans are in the 15-19 years age group; next comes the age group of 20-24 years with 21% unemployed.
According to the labour force survey of the Statistical Centre of Iran in 2001, about 40% of the unemployed are aged between 20-24 years17. In the case of Afghans, the incidence of unemployment is much higher among youth in the lower age brackets because they enter the labour market much earlier than the Iranians. At the same time, unemployment is concentrated among youth who have entered the labour market for the first time, with no experience.
17 - Noroozi, Ladan: “Investigation of changes in Iran’s women labour market during the years 1997-2001 and the future vision”, Management and planning organization, 2004 (in Farsi).

55
Table 5.14 Unemployed Afghan by Sex and Age Group
Age group Male Female Total 10-14 13 6 19 15-19 45 24 69
24-20 15 18 33 25-29 2 6 8 29-34 2 7 9 35-39 1 2 3 40-44 2 2 4 45-49 2 3 5 50-54 3 0 3 55-59 1 0 1 60-65 3 0 3 +65 1 1 2
Total 90 69 159
Most unemployed Afghans have had Iranian education with, primary school (21%), secondary school (19%) and high school (25%). The illiterate percentage was 17%. Similar to Afghan immigrants, those with high school level of education had the highest unemployment rate among unemployed Iranians. They are mostly young and are not very interested in unskilled jobs, with a resultant high unemployment.
Table 5.15 Unemployed Afghans by Sex and Education Level
Education Level Male Female Total Illiterate 14 13 27 IR-primary 23 10 33 IR-secondary 20 10 30 IR-high school 17 23 40 IR-vocational technical 0 1 1 IR- university 3 0 3 IR- relational educate 1 0 1 IR-informal 0 2 2 AF-primary 1 2 3 AF-secondary 1 0 1 AF- high school 2 3 5 AF-vocational technical 2 2 4 AF-university 1 0 1 AF-relational education 1 0 1 AF-informal 4 3 7
Total 90 69 159
The majority of unemployed Afghans search for jobs through friends (66%) and by direct contact with the labour market (18%). In comparison, in 2004 25% of unemployed Iranians searched for jobs through friends and 17% referred directly to

56
the labour market1. They used more varied methods for job searches, referring to employment agencies and responding to advertisement.
Table 5.16 Unemployed Afghans by Sex and Method of Job Search
Method of Job Search Male Female Total Contact the labour market 28 1 29
Through friends 51 54 105 Contact with employers 4 0 4
dSearch for self employment metho 1 2 3 By advertisement 0 2 2 Through emplyment agency 0 1 1 Unknown 2 4 6 Others 4 5 9
Total 90 69 159
For 50% of Afghans the job search period is less than six months. On the other hand, 58% of Iranians have been looking for more than one year for jobs. Although the job search period of Afghans is less than for the Iranians, the Iranian workers may be looking for better jobs.
Table 5.17 Unemployed Afghans by Sex and Duration
of Job Search %
Duration of Job Search Male Female Total< one month 19.0 9.4 14.9
1-3 months 22.6 20.3 21.6 3-6 months 16.7 14.1 15.5 6-12 months 21.4 25.0 23.0 +12 months 20.2 31.3 25.0 Total % 100.0 100.0 100.0Total number 84 64 148
5.4 Changes in employment status In the household survey, we identified 944 current workers who also had been employed in Afghanistan prior to immigration, and compared their current employment status with that in Afghanistan. Some of the salient features are almost complete absence of unpaid family worker status in Iran among these workers (compared to about 11 percent of total workers while in Afghanistan), a decrease in the number of own account workers, a substantial increase in the proportion of casual workers, which is not surprising given their need for gainful employment. It has already been noted earlier that there were very few employers among the surveyed Afghan population. It is possible that unpaid family workers improved their employment status from the previous level while some self-employed workers may have ended up as casual labourers. Given restrictions on type of employment and
1 See: Iran statistical centre, 2004

57
freedom of movement, the workers may not have much choice in regard to these options.
If we compare the branch of current economic activity with that in Afghanistan prior to their migration, just over one-third of the Afghan workers kept to the branch of the economic activity in which they were employed in Afghanistan, with the largest percentages in the construction and the mining and quarrying sectors keeping to their sectors. While 50 per cent were employed in agriculture in Afghanistan, they had moved to other sectors in Iran with only 13% remaining in the sector. The other marked change is in the construction sector which saw a change from 5% in Afghanistan to 30% in Iran. Among the Afghan workers in Iran, more than half including those whose current employment status was “unpaid family worker”, had gained new skills through some kind of training, either in a training centre or on-the-job. In a similar study in Pakistan, there was little training available in a training centre or on-the-job
Table 5.18 Training Skill Obtained in Iran
Current Employment Status Total Employer Own-
account worker
Unpaid family worker
Permanent employee
Seasonal employee
Casual employee
Yes, in training centre
12 101 63 325 31 212 744
Yes, on-the-job training
13 146 13 222 24 118 536 New
skill
s or
trai
ning
s in
Iran
No training 12 298 17 406 60 371 1,164Total 37 545 93 953 115 701 2,444
5.5 Linkages with Afghanistan The average period of residence in Iran for the Afghan-born persons is 15 years; more than 70% of them have been resident in Iran for over ten years. About half of the Afghans born in Afghanistan in this sample have visited Afghanistan during their stay in Iran.
5.5.1 Remittances and financial support to those left behind in Afghanistan
Only 101 households (less than 7%) of the 1505 households sampled have reported that they had some responsibility to financially support persons in Afghanistan. This may be because many have migrated with entire families. As seen from the table below, almost 93% of the heads of households have no dependents in Afghanistan, and any funds remitted by these would only be to their relatives.
In total, 561 persons remitted funds to those in Afghanistan. In addition to the absence of immediate dependents in Afghanistan, the low volume of remittances may also be due to the fact that the capacity to save out of their earnings is low in relation to household expenses including rents in Iran.

58
Table 5.19 Remittances to Afghanistan by Number of Dependents
Remittance to Afghanistan Number of
dependents in Afghanistan
Yes, usually transfer
remittances
No transfer of remittances
% of households
sending remittances
0 18 1386 1.28 1 9 2 81.82 2 13 1 92.86 3 9 2 81.82 4 10 0 100.00 5 10 1 90.91 6 10 1 90.91 7 7 0 100.00 8 9 0 100.00 9 2 1 66.67 10 5 1 83.33 12 3 0 100.00 13 2 0 100.00 14 2 0 100.00 15 2 0 100.00
In this sample, 167 persons during the past year have remitted funds to Afghanistan. The average amount of the remittance by these persons during the last year was 865,000 Tomans ($960).
Table 5.20 Afghan Labour Force and Last Year Remittances (US$)
Last year remittances (US$)
Number Total
0-111 14 14 112-277 28 28 278-555 34 34 556-833 25 25 834-1110 11 11 1111-1332 38 38 2221-5553 11 11 5554+ 6 6
Total 167 167

59
According to the findings of the AREU studies in Iran, the more recent undocumented migrants for employment appear to be sending more money back home than the long stayers. Since their motivation for migration into Iran is mainly economic and for temporary periods and they come in without families, their target is to save and remit money for families left behind. The household survey also found that those with shorter periods of stay were responsible for the larger share of remittances although it was not difficult to identify the above category separately.
Box 3: Savings and Remittances: results from the case studies
Out of the 25 households, only 8 respondents reported savings (in the form of cash or rental deposit). Savings were rarely possible, as Afghans had to spend the little they earned on house rental, food and education. A few respondents could save between 50,000 to 60,000 tomans ($55-66) monthly. But overall, savings were usually in the form of a deposit they had given for renting a house.
The majority of households (21 or 84%) had never sent remittances to
relatives in Afghanistan. Only 2 respondents used to submit regular remittances to relatives in Afghanistan. This is consistent with the findings of the household survey.
The majority were not able to send money back home owing to the lack of
sufficient income and savings. Only one respondent reported sending money to his father to buy property in Afghanistan.
Source: Movarekhi, 2005. 5.5.2 Visits to Afghanistan The respondents were asked whether they had visited Afghanistan since coming to Iran. Only 15 per cent had visited while 85 per cent had not returned. It is interesting that 92 per cent of women as compared to 78 per cent of males had not undertaken a visit. Since the question did not ask when they returned, the answers are not so useful. The AREU Transnational Networks project and the IOM cross border movements study have generated much more useful information on this aspect showing the dynamics of frequent movements back and forth. Of course, with tightening policy and enforcement in Iran, regular visits may no longer be feasible. The case studies revealed that some persons traveled back to Afghanistan to attend funerals of relatives or because they were once deported. Two respondents had returned to Afghanistan to find work but without any success.

60
The case studies found no clear positive correlation between the duration of residence in Iran and the economic situation. Out of 9 respondents resident in Iran for over 20 years, 4 tended to assess their economic situation as better, 3 as the same, and 2 as worse, as compared to Afghanistan. Out of 16 respondents resident in Iran for 20 years or less, 10 tended to assess their economic situation as better, 4 as same, and 2 as worse. While some respondents were content with being able to feed their family at the end of the day, others could hardly meet ends.
While we cannot generalise from the small number of case studies, it provides some qualitative insights into links with Afghanistan. Since they were residing in Iran, about half of the respondents in the case studies had had phone contacts with their relatives in Afghanistan, while 10 had had no direct contacts with their relatives in Afghanistan. Most respondents had family or relatives remaining in Afghanistan. Generally, contacts between respondents and their relatives or friends living in Afghanistan were made by phone or letter, and tended to decrease over time. Indeed, for the majority of the respondents, the high cost of phone communications prevented them from keeping in touch as much as they would have wished to. At the time of our visit in Iran, a call to Afghanistan cost reportedly 500 tomans per minute. Only a few respondents had either no contact with or information about relatives in Afghanistan, or only indirect contacts with them through friends who had travelled back and forth. Very few respondents had any kind of substantial assets in Afghanistan and even those who had no longer retained access to them.
5.5.3 Intentions in terms of return and reintegration and perceived barriers While the household survey did not probe into this issue, the case studies (which may not be representative of the overall situation) generated some interesting findings (Movarekhi 2005). First, there was a correlation between the duration of
0.0 10.0 20.0 30.0 40.0 50.0 60.0 70.0 80.0 90.0
100.0 Pe
rcen
t
Male Female Total
Return to Afghanistan
Yes No

61
residence in Iran and the intention to return. Respondents resident less than 20 years were more willing to return to Afghanistan than those resident for over 20 years. This is consistent with our observation about a hard core of Afghan households who have been integrated to the local economy for a long time.
Out of 25 respondents: • 8 respondents claimed that they had the intention to return. Out of those
8, 6 of them had been residing in Iran for less than 20 years • 17 respondents claimed they had no intention to return. Out of those 17,
9 of them had been residing in Iran for more than 20 years
The respondents mentioned a number of pre-conditions required for them to return to the homeland. The multiple responses are shown below.
Pre-conditions to return Frequency of
responses Employment and housing 25 Access to welfare and basic facilities, including education and health, water, electricity and gas
15
Improved security 9 National and international assistance to returnees 7 Accumulation of capital 6
Source: Movarekhi 2005.
Although the majority of respondents said that they were strongly attached to their home country, they were unwilling to return to Afghanistan. They cited a lack of work opportunities, of shelter and of basic infrastructure like schools and clinics, scarcity of food, physical insecurity combined with a lack of international and national assistance as the reasons for wanting to remain in Iran. Return and long-term reintegration to their communities of origin under such conditions was perceived as a big challenge and impossible without services designed to meet their specific needs. The experience of previous discouraged returnees who came back to Iran also influenced their decisions.
Likewise, some respondents considered return to be a more viable solution for those who had capital or assets, and education or valuable skills: “We don’t have any budget to survive even for five months without a job in Afghanistan. And we have no place to stay.” Accumulation of sufficient funds to purchase land or houses in Afghanistan is a major motivating factor to delay return.
The Altai Consulting (2006) household survey found that the monthly average household expenditure for a returnee family in Afghanistan was about $200. While this calculation was for a large family size (9 members), we can assume a range of $150-200 as a threshold for a family to manage. The Altai survey also noted that 80% had difficult or very difficult experience in finding a job although 90% found a job (of varying quality) within six months. We are not clear how

62
representative this small sample would be of the actual situation. Assuming a tide over period of 4 months to find a job, a returning household may need minimum savings of $600-800 to simply to manage living expenses during the initial period. Purchase of land or housing would require far higher savings. Despite the difficulties experienced in Iran, a number of respondents cited positive aspects of continuing to live there. The greater respect for women’s rights in Iran relative to Afghanistan was one positive factor. Most of the respondents recognised that they could be better off in Iran than in a country like Afghanistan where everything was uncertain and insecure. “Overall, respondents described Iran as a country providing much higher living standards, better welfare facilities, particularly health, sanitation and education, developed building and road infrastructures, and they perceived the economy as strong.” (Movarekhi 2005).

63
5.6 Female Headed Households 5.6.1 Female Headed Households
As in Afghanistan, it is rare for women to head households among Afghans in Iran. In the household survey conducted, there were only 66 Afghan female-headed households in the total sample population. Although this is not a large enough sample size to represent an accurate picture of Afghan women heading the households, it can still provide some indication of their living and working conditions and how they are struggling to sustain their livelihoods in Iran. Their situation is compared to male-headed households in this section. Detailed tabulations provided in Appendix tables A5.7 and A5.8. The female heads of households are concentrated in ages between 35 and 54 years, with 52 out of 66 women in these ages. The median age of these Afghan women is 46.33 years, whereas for Afghan men who are heads of households, the median age is 38.73 years. Afghan women heads of the households are, thus, much older than their male counterparts. The average size of the Afghan households is 4.77 for female headed and 5.64 for male-headed households.
Table 5.21 Marital Status of Afghans heading the households in Iran
Marital Status Number of Household Heads Female Male Never married 2 3.0% 66 0.1% Married 11 16.7% 1356 94.2% Divorced 2 3.0% 2 4.6% Widowed 51 77.3% 15 1.0% Total 66 100% 1439 100%
Their marital status reveals the primary reason why they have ended up as head of the households, which is normally a male role. The majority of them (77%) are widowed, while among the Afghan men who are heads of the households, over 94% are currently married. Most of the Afghan women became heads of the households following the deaths of their husbands. Literacy and educational attainment reflect the social realities of those women who are heading the households as well as the members of their households. Out of the 66 female heads, only 19 are literate, with only 6 having finished high school. This ratio for illiteracy is considerably higher compared to their male counterparts.

64
Table 5.22 Literacy level of Afghan heads of the households in Iran
Literacy Number of Household Heads
Female Male Illiterate 47 71.2% 515 35.8%
In School 0 0% 29 2.0% Literate, not in
school 19 28.8% 895 62.2%
Total 66 100% 1439 100% 5.6.2 Access to jobs Afghan women’s access to jobs is limited in Iran because of their gender and nationality. This situation puts the Afghan households headed by women in a vulnerable situation.
Table 5.23 Employment of Afghan heading the households in Iran Status Number of Household Heads
Female Male Employed 26 39.4% 1218 84.6%
Unemployed 3 4.5% 17 1.2% Inactive 37 56.1% 104 7.2%
Temporary Absent 0 0% 100 6.9% Total 66 100% 1439 100%
According to the household survey, out of 66 women heads of households, only 26 reported working in the previous week. Out of the rest, only three had conducted job searches during the last 4 weeks with the other 37 inactive. 5.6.3 Conditions of Work The average income is 12,685 Tomas ($14) per week among the 26 employed female heads, which is much less than the average income for their male counterparts, and average hours of work per week is 36.4 hours. None of them have occupational injury insurance and any other kinds of insurance or secondary jobs. 4 of them work on their own accounts. Only 3 have written contract and those are the only ones who have paid sick leave and paid annual leave.

65
Table 5.24 Levels of Income of Afghan heads of households in Iran
Income Level (US$ per
week) Female Head Male Head
0-5.55 2 3.0% 6 0.4% 5.56-11.10 10 15.2% 14 1.0%
11.11-22.21 8 12.1% 93 6.5% 22.22-33.32 3 4.5% 336 23.3% 33.33-44.42 1 1.5% 365 25.4% 44.43-55.53 1 1.5% 268 18.6% 55.54-66.64 1 1.5% 117 8.1%
66.65+ 0 0% 111 7.7% Missing 0 0% 4 0.3%
Have not worked last 7 days 40 60.6% 121 8.4% Total 66 100.0% 1439 100.0%
5.7 Concluding Remarks The analysis has shown that the workers are mostly male (with very low female labour force participation), and the male labour force participation rate is higher for the refugees than the Iran population. They have been employed in the lower paid jobs in the first place. Added to that has been the absence of any kind of social benefits such as medical and health insurance, annual or medical leave with pay, etc. However, even such employment conditions may be better than what they perceive awaits them if and when they return home to Afghanistan, given their long absence, adjustment problems and few links left. Iranian workers earn about 12 to 20 percent more than their counterpart Afghan workers with the same experience, even while their work hours were about 10 percent longer. In comparison, in the Pakistan survey of Afghan refugees, however, the refugees felt that, with some exceptions, their potential earnings would be higher in Afghanistan, were they to get a similar job back home. About one-third of the Afghan refugees in Pakistan felt that the wages that they receive were insufficient for a ‘decent’ living. The next chapter undertakes a comparative analysis of the Afghan and Iranian workers in the labour market in Iran. The refugees’ stay in Iran has not benefited the parent country much, in terms of remittances sent back home, both because of high daily expenditure, low wages (and low savings), and the fact they migrated with their family so there may not be many close relatives left back home to whom they would send these remittances.

66
CHAPTER 6: IRANIAN AND AFGHAN WORKERS IN THE LABOUR MARKET OF IRAN
6.1 Introduction The purpose of this chapter is to compare the labour market situation of Afghan and Iranian workers based mainly on the establishments survey data. The survey covered both employers and Afghan and Iranian workers as described earlier in Chapter 2 on methodology. The chapter first surveys the profile of establishments surveyed, and the role of Afghan and Iranian workers in the labour market. It highlights their employment and wage conditions. The reasons for reliance on Afghan labour and the possible impact of their withdrawal are then analyzed. The sample of workers was distributed among the four cities as follows:
Table 6.1: Distribution of sample of workers by city
Location Afghan workers Iranian workers Number % Number % Efsahan 392 18.6 368 29.2 Khorasan 435 20.7 248 19.7 Sistan 126 6.0 51 4.0 Tehran 1150 54.7 593 47.1 Total 2103 100.0 1260 100.0
As can be seen, the bulk of the sample of workers was from establishments in Tehran city. Between the two groups, Afghan workers formed 60-71% of the sample in all cities except Esfahan where it was more or less equal.
6.2 Major characteristics of establishments surveyed
As noted earlier, efforts were made to interview employers using both Iranian and Afghan workers in their establishment. Some establishments, however, used only one group of workers (44 establishments relied only on Afghan workers, while six establishments used only Iranian labour) during the survey period. In 999 establishments, both local and foreign workers were employed. Employers have used more local workers in this sample of establishments. There are, of course, many establishments and jobs in which only the local workers are used, but such establishments were not considered in this study given its objective of focusing on Afghan labour. A large proportion of visited establishments with large number of Afghan workers were those involving low skilled jobs.
The worker sample had 2103 Afghan workers (62.5%) and 1260 Iranian workers (37.5). In the employer survey, the establishments employed 9,396 workers out of

67
which 59% were Iranian and 41% Afghan18. Thus, the Iranian workers were well covered in the employer survey. Period of operation Two thirds of the total establishments are new, and have started within the last five years. Almost half of these have been three years or less in operation while 17 per cent have been operational for more than 10 years. Establishments with three or less years of operation account for 55-56% of total workers (Table A6.1).
Establishments by sector of industry
The bulk of the establishments are in the industrial and construction sector. There were only 17 agricultural establishments in the sample. Most of the establishments were in industry including construction; 70% of the establishments and 78 % of the workforce was in this sector. There were more Afghan workers in services with 25% of workers compared to 18% of Iranian workers.
Table 6.2: Establishments and workers by industrial sector
Establishments Total workers Type of establishment Number % Number % Services 296 28.4% 1971 21.0% Industrial 728 69.9% 7337 78.2% Agriculture 17 1.6% 74 .8% Total 1041 100.0% 9382 100.0%
Location (city)
Tehran dominates the location of establishments except for Khorasan which accounts for almost half of the services establishments as seen from Table 6.3.
Table 6.3: Distribution of establishments by location
Agriculture Industry &
construction Services
City No. estabs
% of estabs.
No. estabs
% of estabs.
No. estabs
% of estabs.
Tehran 3 17.6% 305 41.9% 117 39.5%Efsahan 287 39.4% 13 4.4%Khorasan 14 82.4% 115 15.8% 142 48.0%Sistan 21 2.9% 24 8.1%Total 17 100.0% 728 100.0% 296 100.0%
18 The total number and the composition may vary slightly in tables using different cross tabulations because of rounding and missing values. The totals may not add up exactly in the Afghan-Iranian breakdown for the same reason.

68
Size of establishments In addition to being new, most of the establishments surveyed are small in size. The study uses two measures to assess the size of the establishments: a) size of initial capital investment; b) number of workers employed. Normally the total value added also can be used but this information had not been collected in the survey. In terms of size of initial financial capital investment, about 50 % of the establishments have used less than 30 million Toman ($33,000). These also account for one third of the total workers. This does not show much variation between use of Afghan workers and Iranian workers regarding establishment size with a more or less uniform distribution. The survey did not collect information on whether the capital had been expanded since the initial investment. This is unlikely for establishments started recently.
Table 6.4: Distribution of establishments by initial capital
Initial capital (US$) Number of Iranian workers
Percent Number of Afghan workers
Percent
<= 444 177 18.8 192 20.0 445 - 1332 130 13.8 135 14.0 1333- 3330 160 17.0 161 16.7 3331 - 13320 161 17.1 161 16.7 13321 - 44430 173 18.4 173 18.0 44431+ 141 15.0 140 14.6 Total 942 100.0 962 100.0
Source: Establishments survey
In terms of size of employment, Iran defines those firms with 10 or less employees as small business or enterprises. (Ghanatabadi 2005). In terms of this criterion, 78 per cent of total establishments can be regarded as small enterprises. Table A6.2 shows the distribution by size of employees.
6.3 Profile of Afghan and Iranian workers
Table 6.5 provides a summary of characteristics of the two groups of workers. The most interesting aspect is the absence of substantive differences between the two groups as regards age, work experience, hours of work, and unemployment levels. But there are differences in education levels. As expected Iranians have higher education achievements, better wages, and insurance coverage. It is indeed surprising that almost two thirds of Iranian workers are in the construction sector, while only 50% of Afghan workers are in the same sector. Sengupta (2006) concludes: “… Afghan workers may cross-over from construction to the services sector after a few years of experience but it is more likely for Iranian workers to stay in the construction sector over much longer periods” (Sengupta 2006). This is not consistent with Karimi’s argument that the construction sector has become unattractive to Iranian workers

69
because of stagnating or declining wages over the years. It will be interesting to analyse the socioeconomic background of Iranian workers – whether they themselves are rural migrants with limited options as Karimi has argued (Karimi 2003)
Table 6.5: Summary profile of Afghan and Iranian workers
Afghan worker Iranian worker Characteristics
NumberMean or % Number
Mean or %
Total sampled workers 2103 1260 Female 48 2.3% 15 1.2% Married 1177 56% 756 60% Age in years 2,092 28.1 1,259 29.4 No education 958 45.6% 155 12.3% Educated: High school and above 130 6.2% 286 22.7%
Number years of education 877 5.5 630 6.8 Period of stay in Iran (years) 2,030 9.9 . Ability to speak Farsi – No 36 1.7% Total work experience (Years) 2,060 11.6 1,253 10.5 Experience in current job (Years) 2,083 6.0 1,254 7.1
Industry Division % % Agriculture 57 2.7 23 1.8 Industry & manufacturing 237 11.3 165 13.1 Services 750 35.7 269 21.3 Construction 1059 50.4 803 63.7 Total 2103 100.0 1260 100.0 Have another job 45 2.1 54 4.3 Training received for job 222 10.6 0 Wage per month in 1,000 Toman 2,096 155.2 1,253 179.7
Extra wage per month in 1,000 Toman 1,935 7.9 975 21.8
Hours of work per day 2,054 9.7 1,253 9.1 Insurance coverage –No 2086 99.2% 969 76.9% Number of days unemployed in month 1,993 5.4 1,207 5.6
Source: Worker survey The classification of education is unfortunately not detailed enough because 50-65% has been clustered below high school whereas this should have been broken down into a few more divisions (Table 6.6). But it is clear that Afghan workers have a lower standard in education. About 46% of Afghan workers are not educated while only 12 % of Iranian workers are in this category. Moreover, 48% of Afghan workers have been educated below high school level, and the corresponding proportion of Iranian workers is 65 %. At the same time, 20% of Iranians are high school graduates while only 5 % of Afghans are in this category.
Table 6.6: Distribution of workers by educational status
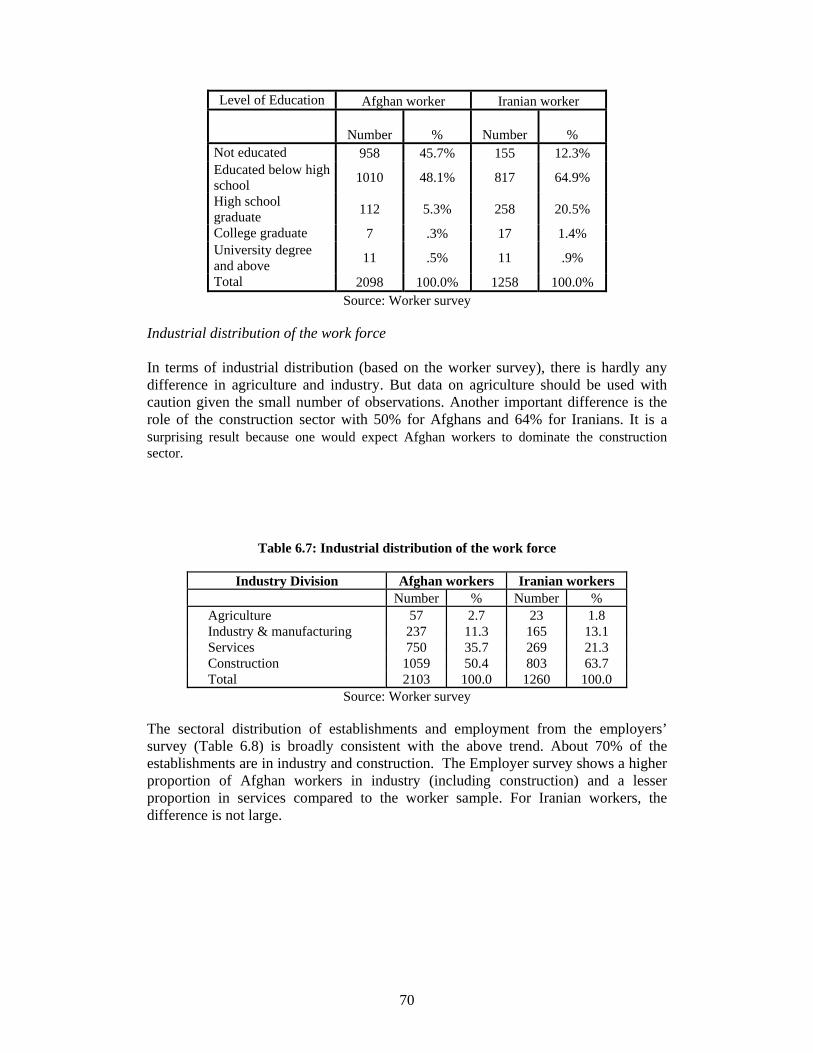
70
Level of Education Afghan worker Iranian worker
Number % Number % Not educated 958 45.7% 155 12.3% Educated below high school 1010 48.1% 817 64.9%
High school graduate 112 5.3% 258 20.5%
College graduate 7 .3% 17 1.4% University degree and above 11 .5% 11 .9%
Total 2098 100.0% 1258 100.0% Source: Worker survey
Industrial distribution of the work force In terms of industrial distribution (based on the worker survey), there is hardly any difference in agriculture and industry. But data on agriculture should be used with caution given the small number of observations. Another important difference is the role of the construction sector with 50% for Afghans and 64% for Iranians. It is a surprising result because one would expect Afghan workers to dominate the construction sector.
Table 6.7: Industrial distribution of the work force
Industry Division Afghan workers Iranian workers Number % Number % Agriculture 57 2.7 23 1.8 Industry & manufacturing 237 11.3 165 13.1 Services 750 35.7 269 21.3 Construction 1059 50.4 803 63.7 Total 2103 100.0 1260 100.0
Source: Worker survey
The sectoral distribution of establishments and employment from the employers’ survey (Table 6.8) is broadly consistent with the above trend. About 70% of the establishments are in industry and construction. The Employer survey shows a higher proportion of Afghan workers in industry (including construction) and a lesser proportion in services compared to the worker sample. For Iranian workers, the difference is not large.

71
Table 6.8: Industrial distribution by establishments and work force Industrial sector Establishments Total Workers Afghan workers Iranian workers Number % Number % Number % Number % Agriculture 17 1.6 74 0.8 32 0.8 42 0.8Industry & construction 728 69.9 7,337 78.2 2,839 73.9 4,480 81.2Services 296 28.4 1,971 21.0 970 25.3 998 18.1 Total 1,041 100 9,382 100 3,841 100 5,520 100 Source: Employer survey. Occupational distribution Another important aspect of employment is the occupational distribution. Table 6.9 shows the distribution in terms of the basic ISCO 88 categories. A more detailed classification is provided in the appendix. The bulk of the workers are crafts and related workers, clerks and in elementary occupations. Almost two thirds in both groups are in occupational group 5: Craft and related trades workers. A number of skilled construction workers may be in ISCO basic category 5. It is possible that the classification could have included some elementary occupations (labourers) in the crafts and related workers’ category. The share of Iranian workers is more in elementary occupations though not by much. The clustering of two thirds of workers in Category 5 does not permit much analysis of differences.
Table 6.9: Occupational distribution of workers surveyed
Afghan workers Iranian workers Major Occupation Number % Number %
1 Professionals 8 0.4 17 1.42 Clerks 305 14.7 114 9.1
3 Service workers and shop and market sales workers
60 2.9 40 3.2
4 Skilled agricultural and fishery workers
40 1.9 31 2.5
5 Craft and related trades workers 1,354 65.1 824 65.9
6 Plant and machine operators and assemblers
43 2.1 18 1.4
7 Elementary occupations 269 12.9 206 16.58 Total 2079 100.0 1250 100.0
Working conditions Both the worker and employer survey had not collected much information on this aspect. Wages and remuneration are one important aspect reviewed in the next section.

72
a. Training received 11% of Afghan workers (222) mentioned receiving special training for the job while no Iranian worker reported receiving training. It is unlikely that Iranian workers had no access to training, and one has to be cautious with this finding. b. Provision of insurance in the workplace Given the small size of establishments, another feature is the limited availability of social protection measures. For instance, less than one per cent of Afghan workers are covered by insurance. The lack of work permits may also be contributing to this situation. The employers have mentioned the lack of obligation to make other payments as a cause for the preference for Afghan workers. It is also disturbing that only 23 per cent of Iranian workers are also covered by insurance. This may be due to the informal nature of the establishments which make it easy to avoid such payments.
Table 6.10: coverage of workers by insurance
Number Percent Afghan worker
No insurance 2086 99.2
Yes, covered by insurance 17 .8
Total 2103 100.0 Iranian worker
No insurance 969 76.9
Yes, covered by insurance 291 23.1
Total 1260 100.0
6.4 Wage levels of workers Given the importance of this item it will be given more detailed attention. The worker survey as well as the survey on employers collected information on the monthly wage of workers. Both also solicited information on extra wage (worker survey) in the form of overtime, and non-wage payments (employer survey). Some extreme observations were present in both cases, which had to be ignored as distinct outliers. There is broad correspondence between wage rates reported by workers and employers respectively. Since most workers interviewed were from the same establishments, this suggests that there has been no under-reporting of wages by workers or over-reporting by the employers. According to the employer survey, the average wage of Iranian workers was $195 compared to $172 for Afghan workers, indicating about 13% difference. In both

73
cases, the highest wage rate was observed in industry. In services the wages ranged from $148 to $162. The total wages ranged from $224 to $182. In both cases, the wage difference was between 13-20%.
Table 6.11: Average wage of workers per month by industrial sector (US$)
Iranian workers Afghan workers Sector No.
establishments % of estabs.
Mean wage Std Deviation
Mean wage
Std Deviation
Agriculture 17 1.7 174 77.78 118 16.18Industry 728 72.2 208 67.25 184 46.88Services 296 26.1 163 55.60 148 62.49Group Total 1,041 100.0 195 66.99 172 53.84
The distribution of wages by occupation is shown in Table 6.12. The small cell frequencies for some groups should caution us about generalizations. As expected the professional group commands the highest wages. Crafts and related trades workers come next for Afghans while it is the elementary occupations which carry the second highest wages for Iranian workers. This confirms our reservations about possible misclassification.
Tables 6.12: Wage levels by occupation (US$ per month) Afghan workers Iranian workers Occupation Number Wage Number Wage Professionals 8 $253.38 17 $261.68 Clerks 305 $145.93 114 $154.30 Service and sales workers 60 $132.52 40 $175.30 Skilled agric. Workers 40 $145.00 31 $195.27 Crafts and related trades 1,354 $180.73 824 $203.00 Plant & machine operators 43 $135.09 18 $158.77 Elementary occupations 269 $177.08 206 $209.20 Total 2079 $172.41 1250 $198.66
Source: ILO Establishments survey, 2005 We have estimated the correlation of wages per month with selected variables hypothesized to influence wage levels (Table A6.4). The findings are summarized below. • As for wages by period of stay in Iran, in general there is no clear tendency for
wages to rise with the duration of stay. This is surprising because wages can be expected to rise with longer experience. This may be due to lowering of working conditions over the years or accepting other forms of employment at lower pay given difficult labour market conditions.
• Educational achievement (in terms of the level of education and the number of
years of education), work experience (total and current), hours of work (for Afghan workers) and marital status seem to be positively and significantly

74
correlated with the wage rate as expected. The correlation coefficient for current work experience is higher than for total work experience. The education variable is more significant in the case of Afghan workers. The variable, hours of work, is not significantly correlated to the wage rates of Iranian workers.
• The level of unemployment is negatively and significantly correlated to Afghan
workers’ wages. This is to be expected although the relationship is not significant for Iranian workers. The gender variable does not show a consistent trend because of the very small number of female workers.
• Extra earnings are also are negatively correlated with current earnings. This may
indicate some pressure on those with lower wages to seek other sources of income. Similarly having another job has a negative relationship with the monthly wage of Afghan workers. Earnings last year do not seem to be correlated with the current wage for either group of worker.
6.5 Utilization of local and Afghan workers The extent of reliance on Afghan workers in the labour market is an important issue for all stakeholders- the Iranian government, employers, national workers, and the migrants themselves. In this section, we analyze the situation and try to explain it in terms of selected variables. In view of the employer hiring decisions, the study analyses the composition of the work force in surveyed establishments in this section. • Overall Afghan workers formed 46 per cent of the total work force in the surveyed
establishments. • The four cities selected for the survey represented concentrations of Afghan
workers in the labour market. Sistan-Baluchistan presents the highest reliance on Afghan workers and Efsahan the lowest level. Still it is close to 50% for Khorasan and Tehran.
Table 6.13 Share of Afghan workers in total work force by city
Survey city No. of
establishments Per cent Afghan worker
share (%) Tehran 422 40.8 47.3 Efsahan 298 28.8 38.3 Khorasan 271 26.2 49.9 Sistan 44 4.3 61.6 Total 1035 100.0 46.0
• In terms of industrial sector, the highest share is in services at 55 %.
Table 6.14: Share of Afghan workers in total work force by industry

75
Industrial sector No. of establishments Per cent Share of
Afghans % Agriculture 17 1.6 45.2 Industry & construction 721 69.8 42.5
Services 295 28.6 54.9 Total 1033 100.0 46.1
This was confirmed by the question which asserted whether the establishment was related to construction or others. The construction sector share was 43% while others had 50%. • In terms of life of the establishment, again no clear correlation was observed.
• It was found that the reliance was highest in the smallest establishments in terms of
employee size and initial capital invested. The largest size group (employees) had the lowest reliance although in terms of investment, this was not consistent.
Table 6.15: Share of Afghan workers by size of establishment
Share of Afghan workers in total workers Total
worker size group
No. of establish
ments
% Share % Std Deviation
<= 1 26 2.5% 100.00 .00 2 - 2 68 6.5% 58.82 19.20 3 - 3 121 11.6% 43.98 21.67 4 - 4 108 10.4% 47.92 22.18 5 - 6 221 21.3% 45.93 20.74 7 - 10 267 25.7% 43.63 20.28 11+ 229 22.0% 39.42 22.63 Total 1040 100.0% 46.09 23.09
As in the case of wages, we attempted a simple correlation analysis of the share of Afghan workers in the total work force with selected relevant variables as reported in Table A6.4 The relationships are mostly weak. The Afghan wage is negatively correlated although not significant. The Iranian wage is also negatively correlated and significant which is not different from what is expected. A higher Iranian wage should lead to more reliance on Afghan workers leading to a positive correlation. Initial capital invested and the age of the establishment are positively correlated though not significant. The reasons given for reliance on Afghan workers were also assessed, and conform to expected relationship though non/significant. The response on possibility of continuation without Afghan workers is negatively correlated and significant.

76
6.6 Employer reasons for using Afghan workers The survey of employers attempted to assess reasons for reliance or preference for Afghan workers. The findings indicate that the following are the most important reasons (the percentages mentioned in the bullet points are based on the number of cases and not on total multiple responses).
Table 6.16: Employer reasons for using Afghan workers
Responses*
Number Percent
Percent of Cases
N=1031 Low wages 319 15.7 30.9 No need to pay other dues 61 3.0 5.9 Flexibility of Afghan workers 146 7.2 14.1 Responsibility of Afghan workers 754 37.1 73.1 Ready to do hard work 610 30.0 59.1 Difficulty in hiring national workers 130 6.4 12.6 Other reasons 15 0.7 1.5 Total 2035 100.0 197.2
* Multiple response question
• The most quoted reason is the high sense of responsibility and dedication toward work on the part of Afghan workers compared to Iranian workers in the same job - reported by 73% of employers.
• Ready for difficult and hazardous jobs: this is the second most important reason
repeated - 59% of employers believe this to be an important reason. The two factors/hard work and sense of responsibility/ combined account for 38% of employer responses.
• Low level of Afghan wages comparing to Iranians - this is not as important as often
believed because the above two factors seem to play a major role. Only 31 % of employers had mentioned this. Even if one added, the absence of non-wage payments to Afghans, this factor is not as important.
• Difficulty in hiring national workers was reported by only 13% of employers. This
indicates that local workers are available when Afghan workers are used. • The above responses were analyzed in relation to industrial sectors. The agricultural
sector can be disregarded given the small number of observations. For industry and construction and services, responsibility and hard work are the most important factors.
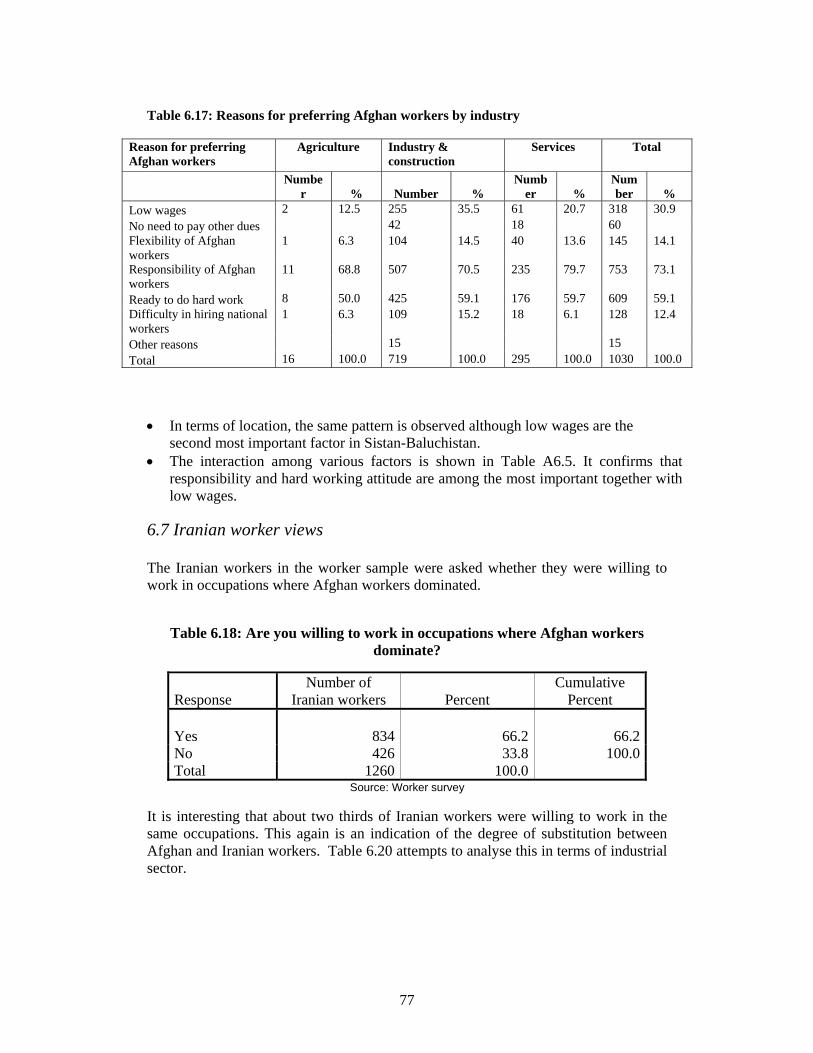
77
Table 6.17: Reasons for preferring Afghan workers by industry
Reason for preferring Afghan workers
Agriculture Industry & construction
Services Total
Numbe
r % Number % Numb
er % Number %
Low wages 2 12.5 255 35.5 61 20.7 318 30.9 No need to pay other dues 42 18 60 Flexibility of Afghan workers
1 6.3 104 14.5 40 13.6 145 14.1
Responsibility of Afghan workers
11 68.8 507 70.5 235 79.7 753 73.1
Ready to do hard work 8 50.0 425 59.1 176 59.7 609 59.1 Difficulty in hiring national workers
1 6.3 109 15.2 18 6.1 128 12.4
Other reasons 15 15 Total 16 100.0 719 100.0 295 100.0 1030 100.0
• In terms of location, the same pattern is observed although low wages are the
second most important factor in Sistan-Baluchistan. • The interaction among various factors is shown in Table A6.5. It confirms that
responsibility and hard working attitude are among the most important together with low wages.
6.7 Iranian worker views
The Iranian workers in the worker sample were asked whether they were willing to work in occupations where Afghan workers dominated.
Table 6.18: Are you willing to work in occupations where Afghan workers
dominate?
Response Number of
Iranian workers Percent Cumulative
Percent Yes 834 66.2 66.2 No 426 33.8 100.0 Total 1260 100.0
Source: Worker survey
It is interesting that about two thirds of Iranian workers were willing to work in the same occupations. This again is an indication of the degree of substitution between Afghan and Iranian workers. Table 6.20 attempts to analyse this in terms of industrial sector.
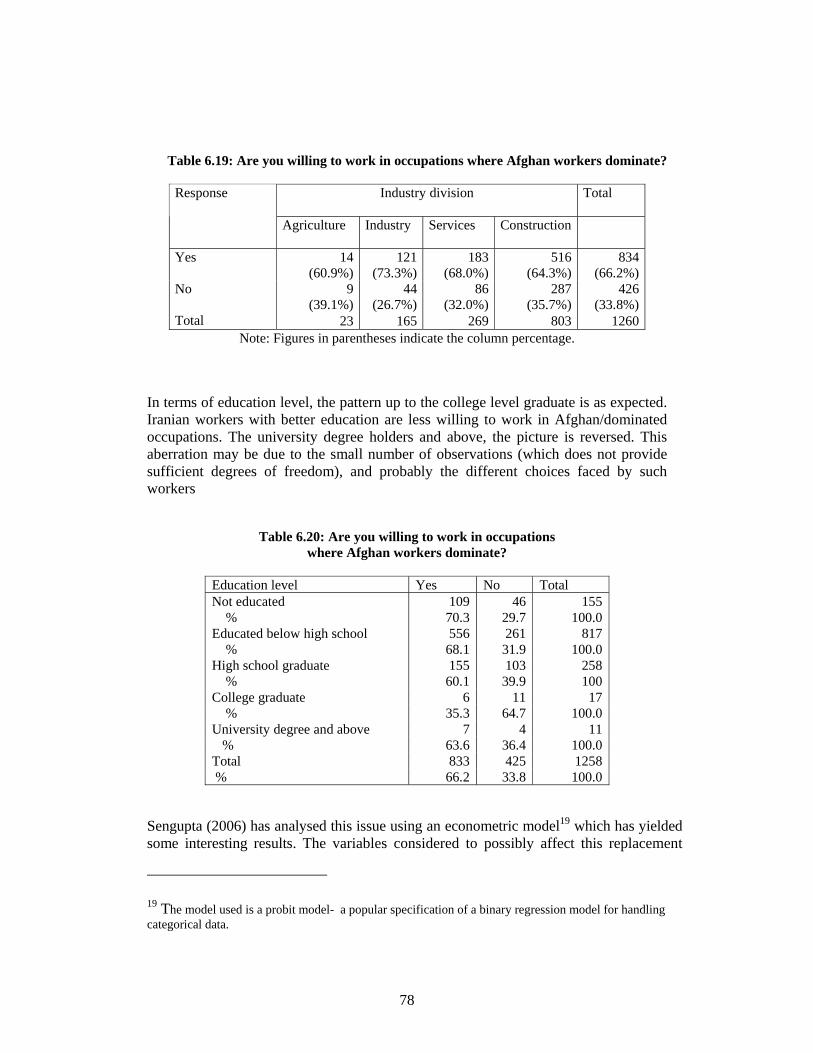
78
Table 6.19: Are you willing to work in occupations where Afghan workers dominate?
Industry division Total Response
Agriculture Industry Services Construction
Yes 14(60.9%)
121(73.3%)
183(68.0%)
516 (64.3%)
834 (66.2%)
No 9(39.1%)
44(26.7%)
86(32.0%)
287 (35.7%)
426 (33.8%)
Total 23 165 269 803 1260 Note: Figures in parentheses indicate the column percentage.
In terms of education level, the pattern up to the college level graduate is as expected. Iranian workers with better education are less willing to work in Afghan/dominated occupations. The university degree holders and above, the picture is reversed. This aberration may be due to the small number of observations (which does not provide sufficient degrees of freedom), and probably the different choices faced by such workers
Table 6.20: Are you willing to work in occupations where Afghan workers dominate?
Education level Yes No Total Not educated 109 46 155 % 70.3 29.7 100.0 Educated below high school 556 261 817 % 68.1 31.9 100.0 High school graduate 155 103 258 % 60.1 39.9 100 College graduate 6 11 17 % 35.3 64.7 100.0 University degree and above 7 4 11 % 63.6 36.4 100.0 Total 833 425 1258 % 66.2 33.8 100.0
Sengupta (2006) has analysed this issue using an econometric model19 which has yielded some interesting results. The variables considered to possibly affect this replacement
19 The model used is a probit model- a popular specification of a binary regression model for handling categorical data.

79
decision are: age, sex, whether the worker believes that Afghans work in more difficult jobs, marital status, years of education, wage, number of hours worked in a day and years of work experience. The estimates conducted indicate that females are less likely than males to take jobs currently held by Afghan workers. Workers who believe Afghans work in difficult jobs are much less likely to replace them. Married workers are more likely to take such jobs compared to single workers. Similarly, more educated workers and more experience workers are less likely to take opt for replacing Afghan workers. Holding experience and education constant, higher wages still imply a lower probability of filling these positions. Interestingly, workers who work more hours in a day are more likely to replace Afghan workers. The survey probed into the reasons for unwillingness to do Afghan jobs. But only 329 of those who said no (426) had responded to this question. Table 6.21: Reasons for unwillingness of Iranian worker to do Afghan/dominated jobs
Responses Percent of Cases
Number Percent of responses
Arduous nature of work 112 34.0 39.2Wages are too low 144 43.8 50.3Not willing to do the same work 44 13.4 15.4
Other reasons 29 8.8 10.1Total 329 100.0 115.0 Table 6.22 shows the interaction among the various reasons. 39 workers had indicated unwillingness to do Afghan work because of both the arduous nature and low wages.
Table 6.22: Reasons for not working in Afghan-dominated sectors: cross tabulation
Arduous nature of work
Wages are too low
Not willing to do the same work
Other reasons
Total
Arduous nature of work 112 39 1 1 112
Wages are too low 39 144 2 1 144
Not willing to do the same work
1 2 44 44
Other reasons 1 1 29 29 112 144 44 31 286
The survey also assessed how much extra wage would be needed to induce them to do Afghan/dominated work. The extra wage required ranges from 29 to 44% according to education level and 20/41 per cent according to industrial sector. The largest expected increase is for construction work confirming its unattractiveness.

80
Table 6.23: Extra wage needed by Iranian workers to do same job in percent
Number of workers
% Extra wage %
Maximum
Not educated 155 12.3% 29 100 Educated below high school 817 64.9% 44 250
High school graduate 258 20.5% 35 100
College graduate 17 1.4% 38 50 University degree and above 11 .9% 35 50
This should be contrasted with the wage increases employers are willing to provide.
6.8 Employer views on withdrawal of Afghan workers, and possible impacts
The employer survey queried on the issue whether they could use Iranian workers at same wage when Afghan workers are not available. 41 % of employers (429 employers) feel that the Iranian labour force is not willing to do the jobs with the level of wages paid to Afghans.
Table 6.24: Are Iranian workers willing to do same jobs at Afghan wages
No. of employers
Percent
Yes 614 58.9No 429 41.1Total 1043 100.0
Are Iranian employers willing to increase wages and salaries for hiring national workers instead? It is interesting that most employers including those who answered in the affirmative to the previous question responded to this. Almost 75 per cent of employers are willing to raise wages only by 10 per cent or less and 12 per cent are willing to increase wages by 20 per cent.

81
Table 6.25: To what extent are you ready to increase wages and salaries for hiring national workers instead
Total responding employers
% Only employers reporting difficulty in hiring
%
5 per cent 487 47.4 143 33.5 10 per cent 363 35.3 169 39.6 15 per cent 107 10.4 62 14.5 20 per cent 71 6.9 53 12.4 Total 1028 100.0 427 100.0
• Results by industrial sector.
Disregarding agriculture which has too limited cell frequencies, it is employers in the services sector who seem willing to increase wages most by 10 per cent and above.
Impact on consumer prices One advantage of having access to a cheap migrant work force is that it helps uncompetitive industries viable, and also helps to keep consumer prices down. This is a benefit to local consumers in general as observed in the Gulf with heavy reliance on an immigrant work force. If local employees are used, the wage costs will rise leading to product price increases. In the survey, employers were asked to assess the impact on their product prices if they had no access to Afghan labour. The survey data show that 54 % of employers (563 employer) believe that without Afghan labour the price of their final product will increase. They estimate in such a situation 35.7% will be add to the price of final product while 46% of employers (486 employer) believe that the final price of their products will not change without migrant labour force.
Table 6.27: Will the price of final products increase if no migrant worker is hired?
TABLE 6.26 : Percentage increase in wages offered to national workers by industrial sector
Industrial sector 5 per cent
10 per cent
15 per cent
20 per cent Total
Agriculture Number 2 1 0 0 3 (row %) 66.7 33.3 0.0 0.0 100.0Industry & construction Number 117 143 46 44 350 (row %) 33.4 40.9 13.1 12.6 100.0Services Number 24 25 16 8 73 (row %) 32.9 34.2 21.9 11.0 100.0Total Number 143 169 62 52 426 (row %) 33.6 39.7 14.6 12.2 100.0

82
Response Employers Percent No increase in price 482 46.2 Yes, price will increase 561 53.8 Total 1,043 100.0
The employers were asked to make an estimate of the probable increase in prices of their products in case there were no access to Afghan workers. The responses have been grouped in the table below.
Table 6.28: extent of price increase
Number of employers
Percent Cumulative Percent
1 to 5 % 109 21.3 21.3 6 to 10% 136 26.6 47.9 11 to 20% 170 33.3 81.2 21 to 30% 47 9.2 90.4 31 to 50% 29 5.7 96.1 More than 50% 20 3.9 100.0
Total 511 100.0 Close to 50% of the employers expect price increase to go up to 10% while an additional one third think they will be in the range of 11/20%. Only 4% expected price increases beyond 50%. The average increase estimated is 19.8% and the maximum 300%. In terms of industrial sectors, the situation is indicated below. The industry and construction sector expects an average increase of 20.5 % while services prices are expected to rise by 16%.
Table 6.29: Expected product price increase by industrial sector
Industrial sector
Number of
employers Per cent Mean
Std Deviation
Agriculture 4 .8% 12.5 5.0 Industry & construction 426 83.5% 20.5 30.5
Services 80 15.7% 16.1 19.8 Group Total 510 100.0% 19.7 29.0
6.9 Can Iranian establishments continue without Afghan workers?
The employers were asked whether their establishments could survive without access to Afghan workers. The result is the overwhelming majority (91%) believes that they can

83
continue. Only 97 employers (9%) believe that without migrant workers it is not possible to continue the establishment. This result however, is not very consistent with the previous responses by employers.
Table 6.30: Can you continue without Afghan workers?
Number of employers Percent Yes, can continue 946 90.7 No, cannot continue 97 9.3 Total 1,043 100.0
A small minority, approximately 9% of the establishments believed they would have to shut down in that contingency. The highest positive response rate was in the manufacturing sector (10%), and the lowest in the services sector (5.8%).
Table 6.31: Can you continue without Afghan workers_ by industry?
Industrial sector Yes No Total
Agriculture Number of employers 16 1 17
(row %) 94.1 5.9 100.0
Industry & construction Number of employers 655 73 728
(row %) 90.0 10.0 100.0
Services Number of employers 274 22 296
(row %) 92.6 7.4 100.0
Total Number of employers 945 96 1041
(row %) 90.8 9.2 100
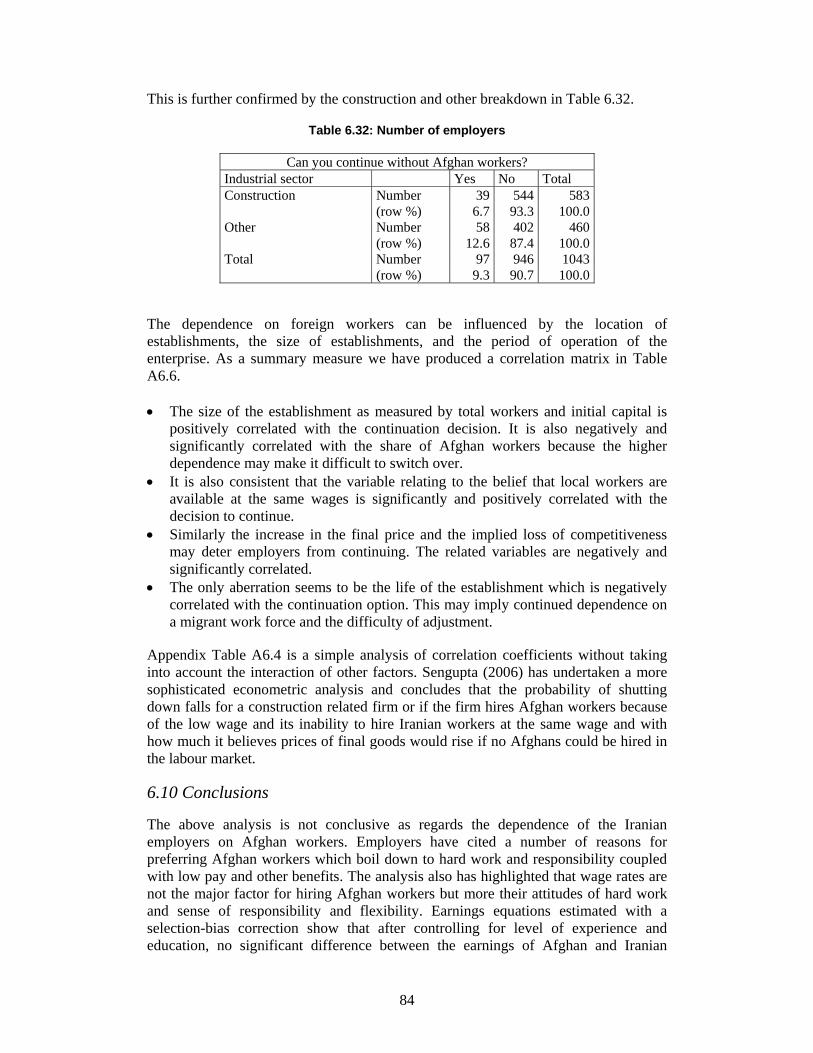
84
This is further confirmed by the construction and other breakdown in Table 6.32.
Table 6.32: Number of employers
Can you continue without Afghan workers? Industrial sector Yes No Total Construction Number 39 544 583 (row %) 6.7 93.3 100.0 Other Number 58 402 460 (row %) 12.6 87.4 100.0 Total Number 97 946 1043 (row %) 9.3 90.7 100.0
The dependence on foreign workers can be influenced by the location of establishments, the size of establishments, and the period of operation of the enterprise. As a summary measure we have produced a correlation matrix in Table A6.6. • The size of the establishment as measured by total workers and initial capital is
positively correlated with the continuation decision. It is also negatively and significantly correlated with the share of Afghan workers because the higher dependence may make it difficult to switch over.
• It is also consistent that the variable relating to the belief that local workers are available at the same wages is significantly and positively correlated with the decision to continue.
• Similarly the increase in the final price and the implied loss of competitiveness may deter employers from continuing. The related variables are negatively and significantly correlated.
• The only aberration seems to be the life of the establishment which is negatively correlated with the continuation option. This may imply continued dependence on a migrant work force and the difficulty of adjustment.
Appendix Table A6.4 is a simple analysis of correlation coefficients without taking into account the interaction of other factors. Sengupta (2006) has undertaken a more sophisticated econometric analysis and concludes that the probability of shutting down falls for a construction related firm or if the firm hires Afghan workers because of the low wage and its inability to hire Iranian workers at the same wage and with how much it believes prices of final goods would rise if no Afghans could be hired in the labour market.
6.10 Conclusions
The above analysis is not conclusive as regards the dependence of the Iranian employers on Afghan workers. Employers have cited a number of reasons for preferring Afghan workers which boil down to hard work and responsibility coupled with low pay and other benefits. The analysis also has highlighted that wage rates are not the major factor for hiring Afghan workers but more their attitudes of hard work and sense of responsibility and flexibility. Earnings equations estimated with a selection-bias correction show that after controlling for level of experience and education, no significant difference between the earnings of Afghan and Iranian

85
workers exists, neither is any significant difference found in the returns to education and experience for Afghan and Iranian workers. At the same time, many Iranian employers maintain that they can get Iranian workers for similar wages and that they can continue without Afghan workers. There seems to be some inconsistency in these employer responses. Karimi (2003) has argued that the presence of Afghan workers has depressed wages, particularly in the construction sector, and made it unattractive for local workers. She argues that during the past two decades, increases in wages in the construction sector, with the largest demand for Afghan workers compared to other economic sectors, have been low. The average income of unskilled workers in the construction sector has now reached a level even less than the minimum wage20. Yet wage indices provided by the Central Bank of Iran do not support a steady decline in construction wages as argued by Karimi. The daily wage index for construction labour has more than doubled between 2000 and 2004.
Table 6.34: Construction sector: Wage rate indices 1376 (1997-98) =100
1999-2000 2000-01 2001-02 2002-03 2003-04 Daily wage of brick layer 138.3 153.2 169.1 197 248.2Daily wage of unskilled construction worker
126 138.9 153.6 189.9 255.6
Wage paid for painting 126.1 138.7 154 175.5 206Wage paid for roof-asphalting 116.9 128.8 135.9 159 188.5Wage paid for well-digging 140.1 155.2 165.9 197.2 255.6Wage paid for cementing 131.1 143.6 156.5 177.8 215.4Wage paid for tile covering 119.2 135.8 155.8 184.6 217Wage paid for plaster working 130.2 144.2 158.2 190.7 231.3Source: Based on Table 51: Central Bank of Iran. Economic Report and Balance Sheet 2003/04, Part III- Statistical Appendix While the current survey data may not be representative of the macro situation, they in fact show a high share of Iranian workers in the same sectors. Analysis of the 44 establishments using only Afghan workers did not reveal major differences with other establishments. It is also difficult to support Karimi’s statement that Iranian wage rates are 15 times more than in Afghanistan, which acts as a strong pull factor. The AREU study of Mashshad also reports wage rates which are comparable to those of the current study (AREU 2005a). The data collected by Altai Consulting in the returnee survey show much smaller differences between Afghan and Iranian wages for 2005. It is however, possible that wages may rise if there is a major withdrawal of Afghan labour from Iran as Karimi has argued. One has to note that the wage increases expected by Iranian workers are much higher than those stated by Iranian employers.
20 See: Zahra Karimi, 2004.

86
The above analysis also has highlighted that wage rates are not the major factor for hiring Afghan workers but more their behavioural attitudes of hard work and sense of responsibility and flexibility. Earnings equations estimated with a selection-bias correction show that after controlling for level of experience and education, no significant difference between the earnings of Afghan and Iranian workers exists, neither is any significant difference found in the returns to education and experience for Afghan and Iranian workers. Sengupta (2006) has formally analysed the issue of sectoral choice among Iranian and Afghan workers. The estimation results indicate that Afghan workers may crossover from construction to the services sector after a few years of experience but it is more likely for Iranian workers to stay in the construction sector over much longer periods. The probability of joining the services sector also steadily rises with education for Afghan workers while the probability of being in construction falls. While similar results are found for Iranian workers, their probabilities of being in a particular sector are more “static” suggesting smaller inter-sectoral movements with more experience and or education. Combining the estimated probabilities with actual profiles of worker characteristics suggest that the construction and services sector may feel the principal effects of the repatriation program.
What is clear from the analysis is that there is a hard core of low skilled Iranian workers with limited mobility and options who face working conditions not very different from those faced by Afghan workers. The wage levels faced by both groups are much below the monthly minimum wages in Iran. A substantive section of both workers may form part of the vulnerable groups in the labour market. Obviously more research is called for assessing the profile of these workers. One possibility is that they are migrants from rural areas with little connections or networks in the urban setting. The analysis of the decision of Iranian workers to replace Afghan workers suggests that the workers most likely to fill jobs vacated by the repatriation of Afghans would be those who have lower levels of education and experience and typically work more hours per week at lower wages. The elasticity of substitution between Afghan and Iranian labour is estimated for different sectors of economic activity The results suggest very low levels of substitution among Afghan and Iranian workers and a slight degree of complementarity in the services sector, again pointing to the services sector as being the most adversely affected by the repatriation program.

87
CHAPTER 7: CONCLUSIONS AND POLICY IMPLICATIONS The above analysis of the Afghan population in Iran has highlighted the many ramifications of the issues involved. It is clear that a simple refugee perspective is unlikely to address the many aspects of this complex issue. One has to look at demographic issues, economic and labour market issues, and social aspects in dealing with the challenges. The analysis pointed out that the bulk of the remaining Afghan households are those who had stayed for a long period in Iran. A sizeable number have been born in Iran itself, and had never visited Afghanistan. Their repatriation is complicated by a number of economic and social impediments to return. Even after long years of stay, these households eke out a marginal existence and are not in a position to build up financial savings and resources for speedy return to the home country. Increasing restrictions and controls are likely to increase their marginalization without a perceptible impact on prospects for return. Hence it may be necessary to think of a different package of measures and incentives. Another issue for policy is to recognize the increasing transnational networks, and population movements motivated by economic considerations. There are increasing cross border movements for seasonal and short term employment, driven by economic considerations.
7.1 Demographic issues
• The bulk of the Afghan population consists of families living in households, and the number of single migrants is limited. The survey design which focused on households may have not adequately covered more recent undocumented migrants motivated by economic considerations.
• Afghan residents in Iran have a younger age structure, higher rate of fertility and bigger households compared to the Iranian population.
• The presence of a large second generation born in Iran needs special attention. About half of Afghan residents in Iran have been born in Iran. The average period of stay of Afghan immigrants born in Afghanistan is 15 years. Most of them have a good command of the Farsi language, and have had little or no contact with Afghanistan.
• A major concern is the long duration of stay of some Afghan groups in Iran spanning more than two decades or so.
• Women and children constitute a large proportion of the sampled Afghan population. Women form 48% of the population, and children up to the age of 14 constitute almost 40% of the total population. 51% of the sampled population consist of persons 18 years and below. This is similar to the situation in Pakistan where the proportion under 18 years among Afghan groups was 55 per cent (Gazdar 2006). Female-headed households however, constitute a small proportion of the total - only 66 out of 1505 households or 4.4% of the total.

88
7.2 Labour market issues
• The impact of the migrant population on the population size and composition in Iran is insignificant. While the absolute numbers of Afghan refugees are relatively large, they are less than 2 per cent of the total population for Iran, and even lower for Pakistan.
• At the macro level, the impact of Afghan population cannot be considered significant. They form less than two per cent of the total labour force of Iran, and are mostly also outside the formal labour market. The impact of Afghan workers on the Iran labour market is localised to some provinces and cities. It is mostly the male workers who enter the labour market. Given the high proportion of women and children who are not active in the labour market, the total impact is less than indicated by total numbers. The number of economically active Afghan population at end of 2005 was estimated at about 400,000, which is 44 per cent of the Afghan remaining population. The Afghan labour force is about 1.8% of the total Iranian labour force.
• The labour force participation rate of Afghan men aged ten and above is 1.5 times that of Iranian men, and their unemployment rate is about half that of the unemployment rate of Iranian men. Yet this may conceal the low incomes and high underemployment among the Afghan population since for them any form of work is needed for survival. It is a reflection of the struggle for livelihoods highlighted in AREU studies. The higher unemployment rate of Iranian men may also be due to their higher education level with relatively longer job search periods for qualified jobs. Therefore, it is not possible to generalize on the differences in unemployment levels. The AREU studies on Iran suggest that Afghans are usually out of employment about four months in a given year. The impact of seasonality on employment and unemployment is another factor that should be considered.
• About 80% of the sampled Afghan employees are active in three sectors - industry, construction, and trade and commerce. In these sectors also, the Afghan workers are concentrated in the low-end segment of the labour market in manual and 3-D (dirty, demanding and dangerous) jobs.
• It is difficult to establish whether Afghan workers are displacing Iranian labour. In the Establishment Survey, the Afghan share in the total work force is 47 per cent, and smaller enterprises in the informal sector may prefer to hire them. But overall they form less than two per cent of the total labour force in Iran as shown above, and are unlikely to displace national workers. They also may be concentrated in sub-sectors which are unattractive to national workers.
• There is virtually no social protection for Afghan workers. More than 95% of Afghan employees do not have written employment contract with the employer. Similarly hardly any have other benefits such as sick and annual leave, or any form of insurance. The lack of employment authorization and exclusion from the formal sector is largely responsible for the situation that benefits Iranian employers at the expense of Afghan workers. Restrictions imposed on employment of undocumented Afghan workers recently have further eroded their employment prospects. In this sense, they are a very vulnerable population.
• It is possible that the presence Afghan immigrants in the Iranian labour market has had an impact on wages of low skilled Iranian workers. Yet wage indices for the

89
construction have shown a large increase in the last few years as noted above.. The analysis of establishment survey data also has highlighted that wage rates are not the major factor for hiring Afghan workers but more their behavioural attitudes of hard work and sense of responsibility and flexibility. Earnings equations estimated with a selection-bias correction show that after controlling for level of experience and education, no significant difference between the earnings of Afghan and Iranian workers exists, neither is any significant difference found in the returns to education and experience for Afghan and Iranian workers.
• However, such employment conditions may still be better than what Afghans perceive awaits them if and when they return home to Afghanistan, given their long absence, adjustment problems and few links left.
7.3 Linkages with Afghanistan and return
• Linkages with Afghanistan, especially in the form of remittances and financial support, are rare. The refugees’ stay in Iran has not benefited the parent country much, in terms of remittances sent back home, both because of their low wages (and low savings) and the fact they migrated with their family, so there may not be many close relatives left back home to whom they would send these remittances.
• There are still many barriers to return and reintegration. The precarious socio-economic position of many households even with long stay in Iran is an important factor in this respect. The case studies have found this to be cross cutting through households with varying periods of stay. Intensified restrictions on remaining Afghan households will hardly have an impact on this situation, and in fact serve to increase their marginalisation and prospects for return. It may also lead to increased trafficking and smuggling of persons.
7.4 Policy implications • It is necessary to undertake further research and document the contribution of
Afghan workers to the Iranian economy, their impact on the labour market and specific economic sectors, their interaction with national workers and remaining impediments to return. One needs more information on the specific profile of national worker groups who may be affected by the presence of Afghan workers.
• Creating conditions for return and reintegration in Afghanistan is a high priority
for all stakeholders. But it has to be recognized that this is indeed a daunting and formidable task in the short to medium term. Continuing international cooperation and bilateral dialogue are essential to sort out the complex economic, social and political issues.
• While the principle of voluntary repatriation is accepted, it has to be
complemented by a range of other policies and measures in the short to medium term. AREU and IOM research have highlighted the complex character of population movements in the subregion and the growing transnational character of such movements (Stigter and Monsutti 2005). Uprooting long established communities can cause severe economic and social disruption for both Afghanistan and Iran if attempted with undue haste.

90
• The research has indicated that the withdrawal of the Afghan labour force would result in price increases of certain goods and services - directly and indirectly leading to consumer price increases. The employers have estimated an average price increase of 20% or so.
• Substitution of local workers for those repatriated is limited by the disparities
between wages expected by Iranian workers and what the employers are willing to offer. Construction, petty trade and commerce, and services sectors will be affected since these are the sectors where they are dominant. Employer preference for Afghan workers and the reluctance of Iranian workers for same jobs suggests a situation of continued reliance on the Afghan workforce, which needs to be recognised in official policy.
• While more sustainable medium term and long-term solutions are being sought, steps should be taken to create acceptable conditions for those who remain given their already marginal and precarious position. The lack of employment authorization has made a large number of Afghan workers vulnerable to exploitation and absence of any form of social protection. This also has affected the labour market position and employment opportunities of Iranian workers.
• Improving the protection of Afghan employee situation in Iran will mean that the Iranian and the Afghan workers can compete with each other in the labour market and accelerate the economic growth of Iran. A transparent work permit scheme will help both workers and employers as pointed out by both ARU and ILO research. Both employers’ and workers’ organizations should be involved in the formulation of policies in this area since both have a direct stake in the outcome.
• The position of children and their access to education should be given due consideration. This is a very sensitive issue which also affects the prospects employment on return to Afghanistan. The situation of the second generation and Iranians with marriage ties to Afghan persons needs to be given special attention. Those born in Iran should preferably be eligible for proper identity documents.
• The possibility of introducing temporary migration programmes for employment of foreign workers has been raised a few times both in Iran and Afghanistan. The most recent development in this respect is the Afghanistan Compact – the product of the 2006 London Conference - a framework for co-operation for the next five years (Government of Afghanistan 2006). One relevant aspect of the Compact is that by 2010, the Afghanistan, its neighbours and countries in the region will reach agreements to enable Afghanistan to bring in skilled labour, and to enable Afghans to seek work in the region and send remittances home.21 If such agreements can be reached, the concerns about informal movements across borders and associated protection issues also could be addressed. This means that Afghanistan should develop capacity and start to put in place policies, programmes, and infrastructure for labour migration schemes over this period.
21 Government of Afghanistan (2006). Building On Success: The Afghanistan Compact. The London Conference on Afghanistan, 31 January - 1 February 2006-, London. http://www.ands.gov.af/admin/ands/ands_docs/upload/UploadFolder/The%20Afghnistan%20Compact%20-%20Final%20English.pdf

91
REFERENCES
Ahmadi Movahed, M. (2003). Social, economic and population specialties of foreign immigrants with emphasis on afghan immigrants in Iran, thesis. Department of Demography. Tehran, University of Tehran. AREU (2005a). Return to Afghanistan? A Study of Afghans Living in Mashahd, Islamic Republic of Iran, Case Study Series. Kabul, by Mohammad Jalal Abbasi-Shavazi, Diana Glazebrook, Gholamreza Jamshidiha, Hossein Mahmoudian and Rasoul Sadeghi, Faculty of Social Sciences, University of Tehran, June 2005; Afghan Research and Evaluation Unit AREU (2005b). Return to Afghanistan? A Study of Afghans Living in Tehran, Case Study Series. Kabul, by Mohammad Jalal Abbasi-Shavazi, Diana Glazebrook, Gholamreza Jamshidiha, Hossein Mahmoudian and Rasoul Sadeghi, Faculty of Social Sciences, University of Tehran, June 2005; Afghan Research and Evaluation Unit AREU and CSSR (2006). Report: Conference on Afghan Population Movements: Afghans in neighbouring countries: issues, concerns and solutions, organised by the Afghan Research and Evaluation Unit and the Collective for Social Science Research, Holiday Inn, Islamabad, 14 February 2006. AREU (2006). Continued Protection, Sustainable Reintegration: Afghan Refugees and Migrants in Iran. Kabul, by Mohammad Jalal Abbasi-Shavazi, Diana Glazebrook, , May 2006, Briefing Paper, Afghan Research and Evaluation Unit. Central Bank of Iran. Economic Report and Balance Sheet 2003/04, Part III- Statistical Appendix. CMI and PRIO (2004). Afghan Refugees in Iran: From Refugee Emergency to Migration Management. Oslo, Christian Michelson Institute & Peace Research Institute, Oslo http://www.cmi.no/afghanistan/peacebuilding/docs/CMI-PRIO-
AfghanRefugeesInIran.pdf. Economist Intelligence Unit (2006). Islamic Republic of Iran: Country Report, London, 2006. Eisazedah, S. (2005). Preliminary results of the Establishments survey using Afghan workers, Report submitted to the International Labour Office, Geneva, Department of Economics, Bu-Ali-Sina University, Hamedan.

92
Ghanatabadi, F. (2005). Internationalization of Small and Medium-Sized Enterprises in Iran. Department of Business Administration and Social Science: Division of Industrial Marketing and e-Commerce, Luleå University of Technology, Sweden http://epubl.ltu.se/1402-1544/2005/01/LTU-DT-0501-SE.pdf. ILO (2004). A fair deal for migrant workers in the global economy, Report VI, International Labour Conference 2004, 92nd Session. Geneva, International Labour Office http://www.ilo.org/public/english/standards/relm/ilc/ilc92/pdf/rep-vi.pdf. IOM and Elca Stigter (2006). Population movements between Afghanistan and Pakistan: Powerpoint presentation. Conference on Afghan Population Movements: Afghans in neighbouring countries: issues, concerns and solutions, organised by the Afghan Research and Evaluation Unit and the Collective for Social Science Research, Holiday Inn, Islamabad, 14 February 2006 IMF (2006) Islamic Republic of Iran: Statistical Appendix, Country Report No. 06/129, International Monetary Fund, April 2006 Karimi, Z. M. (2003). The Effects of Afghanistan Civil War in the Iranian Labour Market, Mazandaran, University of Mazandaran, Iran. Mehran, F. (2005). ILO Study on the contributions of Afghans in Iran and Pakistan: Field surveys in Iran, Powerpoint presentation Geneva, International Labour Office. Movarekhi, N. (2005). Case Studies of Afghans Living in Tehran and Qazvin, Islamic Republic of Iran, Geneva, Report prepared for the International Migration programme, International Labour Office, November 2005. Nejatian, M., Hossein, (2005). Survey of Afghan Household in IRAN. Tehran, Shakhes-Negar, statistical consultancy firm affiliated to the Statistical Centre of Iran, Tehran Noroozi, L. and P. Wickrmasekara (2005). Survey Report on Afghan households in Iran (prepared for the UNHCR). Geneva, International Labour Office. Sengupta, B. (2006). An Empirical Investigation into Iranian Labour Markets with High Concentrations of Afghan Migrants: An Analysis of Various Employee and Employer Level Decisions. Geneva, Report prepared for the ILO-UNHCR Project on Comprehensive Solutions to Afghan Displacement, International Labour Office. Stigter, E., A. Monsutti, et al. (2005). Transnational Networks: Recognising a Regional Reality. Kabul, Briefing Paper No. 3, Afghan Research and Evaluation Unit, April 2005 UNHCR (2003a). Afghanistan at a Glance, United Nations High Commissioner for Refugees, Geneva http://www.unhcr.ch/cgi-bin/texis/vtx/afghan?page=facts (accessed 16 January 2006).

93
UNHCR (2003b). Towards a comprehensive solution for displacement from Afghanistan. Geneva, United Nations High Commissioner for Refugees, Geneva, Discussion Paper, July 2003 http://www.unhcr.ch/cgi-
bin/texis/vtx/home/opendoc.pdf?tbl=SUBSITES&page=SUBSITES&id=3f5d95b34 (accessed 21 December 2005).
UNHCR (2004a). Afghanistan: Challenges to Return, United Nations High Commissioner for Refugees, Geneva. UNHCR (2004b). Chronology of a crisis (1973-2002), United Nations High Commissioner for Refugees, Geneva http://www.unhcr.ch/cgi-bin/texis/vtx/afghan?page=chrono (accessed 21 December
2005). UNHCR (2006). Declarations and Reservations to the 1951 Convention relating to the Status of Refugees As of 1 October 2004. Geneva, United Nations High Commissioner for Refugees http://www.unhcr.org/cgi-
bin/texis/vtx/protect/opendoc.pdf?tbl=PROTECTION&id=3d9abe177 2006. Wickramasekara, P. (2006). ILO study on the Afghan population in the Islamic Republic of Iran: Powerpoint presentation. Conference on Afghan Population Movements: Afghans in neighbouring countries: issues, concerns and solutions, organised by the Afghan Research and Evaluation Unit and the Collective for Social Science Research, Holiday Inn, Islamabad, 14 February 2006. World Bank (2006a). Islamic Republic of Iran at a glance http://devdata.worldbank.org/AAG/irn_aag.pdf World Bank (2006b). Iran: country data profile http://devdata.worldbank.org/external/CPProfile.asp?CCODE=IRN&PTYPE=CP

94
AFGHAN HOUSEHOLDS IN IRAN:
PROFILE AND IMPACT Final Report
APPENDIX
STATISTICAL TABLES

95
Table A4.1: Percentage Distribution of Population by Age and Sex Survey Population Iran 2005 Afghanistan 2005
Age group Male Female Male Female Male Female 0-4 11.73 10.87 18.48 18.59 8.77 8.59 5-9 12.96 12.52 15.21 15.19 8.46 8.27
10_14 15.08 15.71 12.78 12.74 11.79 11.51 15-19 14.65 15.24 10.60 10.50 12.93 12.65 20-24 10.29 11.34 8.71 8.61 12.66 12.47 25-29 7.94 7.09 7.11 7.03 9.67 9.54 30-34 4.86 5.66 5.90 5.82 7.07 7.13 35-39 4.77 6.03 4.89 4.81 6.08 6.17 40-44 4.59 5.16 4.02 3.97 5.48 5.41 45-49 4.45 3.21 3.28 3.26 4.74 4.66 50-54 2.97 2.42 2.64 2.66 3.66 3.97 55-59 1.55 1.14 2.16 2.22 2.43 3.01 60-65 1.67 1.61 1.67 1.76 1.78 2.05 65-69 0.87 0.74 1.20 1.30 1.55 1.66 70-74 0.84 0.54 0.77 0.85 1.37 1.38 75-79 0.32 0.27 0.40 0.46 0.97 0.93 80-84 0.34 0.32 0.15 0.18 0.45 0.45 85+ 0.11 0.12 0.04 0.05 0.14 0.16
Total 100.00 100.00 100.00 100.00 100.00 100.00
Sources: (i) Survey data, (ii) UN Population Division, 2004
Table A4.2: Afghan Population by Age and Place of Birth
Place of Birth Age groups Iran Afghanistan Pakistan Other Total
% Born in Iran
934 20 0 0 954 97.90 893 177 5 0 1075 83.07 966 313 18 0 1297 74.48 786 466 6 1 1259 62.43 289 618 1 2 910 31.76 19 611 2 3 635 2.99 6 435 0 1 442 1.36 2 450 0 1 453 0.44 0 410 0 0 410 0.00 1 324 0 0 325 0.31 0 228 0 0 228 0.00 0 114 0 0 114 0.00 0 165 0 0 165 0.00
0-4 5-9
10-14 15-19 20-24 25-29 30-34 35-39 40-44 45-49 50-54 55-59 60-64 65+ 0 163 0 0 163 0.00
Total 3896 4494 32 8 8430 46.22 Source: Afghan Household survey

96
Table A4.3. Population by Sex, Age and place of Birth Age Total Iran Afghanistan Pakistan Others
Esfahan 8.1 5.6 10.3 3.1 0.0 Tehran 8.3 6.7 9.6 6.3 12.5 Rafsanjan 11.1 13.8 8.6 40.6 0.0 Rey 8.7 7.8 9.7 3.1 0.0 Zahedan 7.0 8.6 5.6 9.4 0.0 Qazvin 6.9 5.3 8.3 3.1 0.0 Qom 5.9 5.8 5.9 0.0 50.0 Kerman 10.3 11.6 9.2 9.4 0.0 Mashhad 16.3 17.0 15.8 12.5 37.5 NajafAbad 9.5 9.6 9.6 0.0 0.0 Varamin 7.9 8.4 7.4 12.5 0.0 Total % 100.0 100.0 100.0 100.0 100.0 Total number 8430 3896 4494 32 8
Source: Household survey
Table A4.4. Afghan Population by Age, Sex and Residence permit Travel or ID Documents % with Valid Documents
Sex Age Group
Male Female Total Male Female Total
10-14 134 147 281 87.6 92.5 90.1 15-19 217 201 418 88.2 91.4 89.7 20-24 269 282 551 87.3 91.0 89.2 25-29 304 258 562 91.3 92.8 92.0 30-34 196 212 408 92.9 95.1 94.0 35-39 196 233 429 93.8 96.7 95.3 40-44 192 202 394 95.5 96.7 96.1 45-49 186 125 311 95.4 96.9 96.0 50-54 127 94 221 97.7 95.9 96.9 55-59 67 45 112 98.5 97.8 98.3 60-64 81 73 154 93.1 93.6 93.3
65+ 86 63 149 90.5 92.7 91.4 Total 2055 1935 3,990 91.9 94.0 92.9
Source: Afghan Household survey

97
Table A4.5 Afghan Population by Age, Sex and by Reason for Migration
Males Females Reason for Migration*
1 2 3 4 5 Total 1 2 3 4 5 Total
0-4 5.6 0.6 2.3 36.6 0.0 15.1 12.0 7.7 0.0 17.7 0.0 16.1 5-9 7.8 0.6 2.3 32.5 0.0 15.1 15.6 0.0 8.3 17.3 3.6 16.6
10-14 10.8 15.8 16.3 19.0 0.0 13.9 13.2 15.4 0.0 13.8 10.7 13.6 15-19 17.0 34.2 27.9 7.6 66.7 15.5 15.3 15.4 41.7 14.6 60.7 15.6 20-24 12.9 22.2 16.3 2.0 0.0 10.1 11.8 23.1 25.0 10.5 17.9 11.0 25-29 14.0 7.0 7.0 1.0 0.0 9.2 7.2 15.4 8.3 8.3 7.1 8.1 30-34 9.5 3.2 16.3 0.3 0.0 6.2 7.4 7.7 0.0 5.5 0.0 5.8 35-39 6.7 4.4 2.3 0.0 33.3 4.3 6.0 0.0 8.3 4.1 0.0 4.5 40-44 5.5 4.4 4.7 0.1 0.0 3.7 2.9 7.7 0.0 3.1 0.0 3.0 45-49 3.5 3.2 0.0 0.0 0.0 2.3 3.6 0.0 0.0 1.6 0.0 2.0 50-54 2.8 1.3 0.0 0.0 0.0 1.8 2.2 0.0 0.0 1.1 0.0 1.3 55-59 1.8 1.3 2.3 0.4 0.0 1.3 1.2 0.0 0.0 0.9 0.0 0.9 60-64 1.1 0.6 0.0 0.3 0.0 0.8 0.5 7.7 8.3 0.6 0.0 0.7 65-69 0.8 0.6 0.0 0.1 0.0 0.5 0.7 0.0 0.0 0.6 0.0 0.6 70+ 0.2 0.6 2.3 0.1 0.0 0.3 0.5 0.0 0.0 0.1 0.0 0.2
No. of
persons 1308 158 43 714 3 2226 417 13 12 1571 28 2041
* Reason 1: Escaping war; 2: Better job; 3: Better social conditions; 4: Accompany other family members; 5: Marriage Source: Afghan household survey

98
Table A5.1: Hours worked per week: Afghan workers by gender Male Female All workers
Age group (years)
Number % Average work hours
Number % Average work hours
Number % Average work hours
10 - 14 661 20.0 42.3 636 20.5 27.1 1297 20.3 39.515 - 19 642 19.5 51.4 617 19.9 27.4 1259 19.7 48.120 - 24 451 13.7 52.8 459 14.8 32.2 910 14.2 49.925 - 29 348 10.5 51.8 287 9.3 28.5 635 9.9 50.230 - 34 213 6.5 53.3 229 7.4 32.2 442 6.9 51.235 - 39 209 6.3 49.8 244 7.9 39.4 453 7.1 48.840 - 44 201 6.1 51.8 209 6.7 28.3 410 6.4 50.245 - 49 195 5.9 51.5 130 4.2 25.7 325 5.1 49.550 - 54 130 3.9 51.6 98 3.2 42.0 228 3.6 51.155 - 59 68 2.1 51.1 46 1.5 38.7 114 1.8 50.460 - 64 73 2.2 51.9 65 2.1 42.0 138 2.2 51.765+ 109 3.3 38.1 81 2.6 19.5 190 3.0 37.0Group Total 3300 100.0 51.3 3101
100.0 30.7 6401 100.0 49.2
Source: Household survey
Table A5.2 Income per week by years lived in Iran
Years lived in
Iran
Average Income
Years lived in
Iran
Average Income
Years lived in
Iran
Average Income
1 39,091 12 43,105 23 32,9662 33,900 13 31,422 24 34,7383 37,906 14 32,133 25 38,8284 42,317 15 30,846 26 38,2975 32,675 16 28,241 27 50,6676 24,210 17 32,218 28 32,8577 30,586 18 28,453 29 20,0008 29,689 19 28,204 30 45,4009 30,694 20 31,706 32 50,00010 32,068 21 33,308 34 50,00011 32,786 22 34,467 35 50,000
Source: Household survey

99
Table A5.3 Income per week by years worked in Iran Years
worked in Iran
Average income
Years worked in
Iran
Average income
Years worked in
Iran
Average income
0 24,537 12 36,173 24 38,194 1 19,837 13 33,850 25 53,421 2 22,621 14 33,857 26 44,167 3 25,724 15 32,038 27 48,333 4 27,472 16 32,391 28 30,000 5 28,109 17 34,043 30 34,875 6 28,908 18 35,570 32 50,000 7 34,564 19 31,522 33 35,000 8 30,619 20 35,244 34 35,000 9 32,161 21 39,500 35 50,000 10 31,676 22 38,943 11 36,333 23 38,733
Correlation R-Square0-35 years 0.7462451 0.5568818 0-25 years 0.8411920 0.7076039
Table A5.4 Current vs. Last Employment Status
Current employment status in Iran Employer Own-
account worker
Unpaid family worker
Permanent employee
Seasonal employee
Casual employee
Total (%)
Employer 1 17 1 12 1 19 51 (5.4)
Own-account worker
7 143 2 100 13 117 382 (40.5)
Unpaid family worker
4 25 1 19 4 52 105 (11.1)
Permanent employee
4 71 1 150 9 35 270 (28.6)
Seasonal employee
1 12 0 27 16 10 66 (7.0)
Casual employee 1 8 0 7 0 54 70 (7.4) L
ast e
mpl
oym
ent s
tatu
s in
Afg
hani
stan
Total (%)
18 (1.9)
276 (29.2)
5 (0.5)
315 (33.4)
43 4.6)
287 (30.4)
944 (100.0)
Source: Afghan household survey

100
Table A5.5 Current vs. Last Activity Status
Last branch of economic activity in Afghanistan
Current branch of economic activity
Agriculture Industry Construction Trade, repairs, restaurants and hotels Trade and hotels
Transport, Storage and Communication
Other services
Total Agriculture 115 2 1 6 3 3 130
13.8% Industry 54 84 7 31 2 26 204
21.6% Construction 174 24 39 17 10 21 285
30.2% Trade, repairs, restaurants and hotels
74 22 2 69 9 33 209 22.1%
Transport, Storage and Communication
31 3 0 5 2 5 46 4.9%
Other services 26 8 0 5 0 31 70 7.4%
Total 474 50.2%
143 15.1%
49 5.2%
133 14.1%
26 2.8%
119 12.6%
944 100.0
Source: Afghan household survey
Table A5.6 Visits to Afghanistan
Numbers Percent Visited Afghanistan during stay in Iran Male Female Total Male Female Total Yes 481 158 639 21.5 7.7 14.9 No 1755 1901 3656 78.5 92.3 85.1 Total 2236 2059 4295 100.0 100.0 100.0
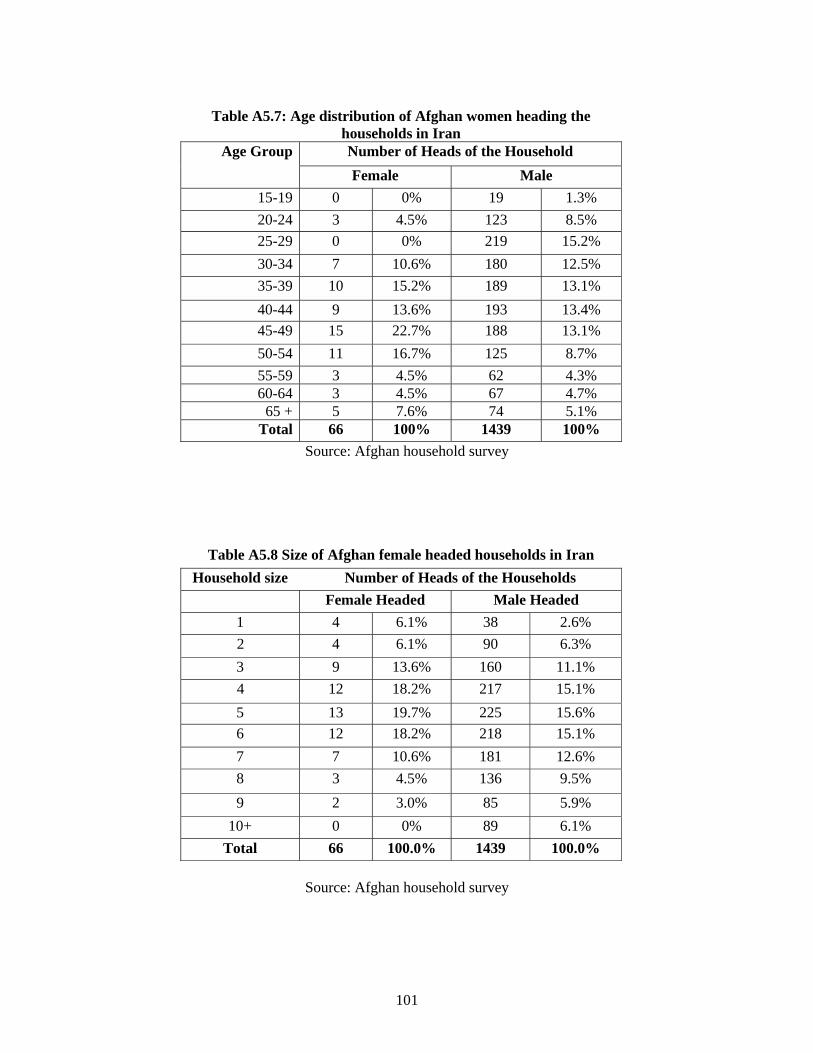
101
Table A5.7: Age distribution of Afghan women heading the
households in Iran Number of Heads of the Household Age Group Female Male
15-19 0 0% 19 1.3% 20-24 3 4.5% 123 8.5% 25-29 0 0% 219 15.2% 30-34 7 10.6% 180 12.5% 35-39 10 15.2% 189 13.1% 40-44 9 13.6% 193 13.4% 45-49 15 22.7% 188 13.1% 50-54 11 16.7% 125 8.7% 55-59 3 4.5% 62 4.3% 60-64 3 4.5% 67 4.7%
65 + 5 7.6% 74 5.1% Total 66 100% 1439 100%
Source: Afghan household survey
Table A5.8 Size of Afghan female headed households in Iran Household size Number of Heads of the Households
Female Headed Male Headed 1 4 6.1% 38 2.6% 2 4 6.1% 90 6.3% 3 9 13.6% 160 11.1% 4 12 18.2% 217 15.1% 5 13 19.7% 225 15.6% 6 12 18.2% 218 15.1% 7 7 10.6% 181 12.6% 8 3 4.5% 136 9.5% 9 2 3.0% 85 5.9%
10+ 0 0% 89 6.1% Total 66 100.0% 1439 100.0%
Source: Afghan household survey

102
Table A6.1: Distribution of workers by age of establishments
Total Number of Iranian
workers Number of Afghan
workers Age of
establsihment (years)
No. establishme-
nts
% of estabs.
Number of
workers
% of workers
Number of
workers
% of workers
Number of
workers
% of workers
<= 1.00 226 22.0 2251 24.2 1241 22.7 990 26.0 2.00 - 2.00 159 15.5 1849 19.9 1180 21.6 667 17.5 3.00 - 3.00 121 11.8 1058 11.4 563 10.3 495 13.0 4.00 - 4.00 103 10.0 863 9.3 476 8.7 386 10.1 5.00 - 5.00 86 8.4 566 6.1 310 5.7 256 6.7 6.00 - 6.00 62 6.0 413 4.4 257 4.7 156 4.1 7.00 - 9.00 96 9.4 908 9.8 607 11.1 303 7.9 10.00 - 14.00 91 8.9 713 7.7 428 7.8 285 7.5 15.00+ 82 8.0 671 7.2 397 7.3 274 7.2 Group Total 1026 100.0 9292 100.0 5459 100.0 3812 100.0
Source: Afghan establishments survey
Table A6.2 Establishments by size of total workers employed
Establishments
Workers
Worker size group Number percent Cumulative %
Number percent Cumulative %
Less than or equal to 1 26 2.5 2.5 26 0.3 0.3 2 – 2 68 6.5 9.0 136 1.4 1.7 3 – 3 121 11.6 20.7 363 3.9 5.6 4 – 4 108 10.4 31.1 432 4.6 10.2 5 – 6 221 21.3 52.3 1,197 12.7 22.9 7 – 10 267 25.7 78.0 2,249 23.9 46.9 11+ 229 22.0 100.0 4,993 53.1 100.0 Group Total 1,040 100.0 9,396 100.0 Source: Afghan establishments survey

103
Table A6.3: Correlation of wage per month with selected variables
Pearson Correlation coefficients
Sector Item Afghan
worker Iranian worker
Period of stay in Iran (years)
Pearson Correlation -0.018
Sig. (2-tailed) 0.42 N 2024 Hours of work per day Pearson
Correlation .136(**) 0.004 Sig. (2-tailed) 0 0.883 N 2048 1246 Total work experience (Years)
Pearson Correlation .124(**) .263(**)
Sig. (2-tailed) 0 0 N 2054 1247 Experience in current job (Years)
Pearson Correlation .195(**) .360(**)
Sig. (2-tailed) 0 0 N 2077 1249 Number of days unemployed in month
Pearson Correlation -.077(**) 0.002
Sig. (2-tailed) 0.001 0.944 N 1988 1201 Average monthly earning last year (Toman 1000)
Pearson Correlation
0.008 .891(**) Sig. (2-tailed) 0.726 0 N 2027 1210 Gender Pearson
Correlation 0.007 -0.054 Sig. (2-tailed) 0.732 0.055 N 2096 1253 Marital status Pearson
Correlation .114(**) .154(**) Sig. (2-tailed) 0 0 N 2096 1253 Education level Pearson
Correlation .104(**) .070(*) Sig. (2-tailed) 0 0.013 N 2091 1251 Number years of education
Pearson Correlation .117(**) 0.029
Sig. (2-tailed) 0.001 0.476 N 875 626 Extra wage per month in 1,000 Toman
Pearson Correlation -.071(**) -.082(*)
Sig. (2-tailed) 0.002 0.01 N 1931 972

104
anotherJob Pearson Correlation -.074(**) 0.02
Sig. (2-tailed) 0.001 0.482 N 2096
N= Number of observations
** Correlation is significant at the 0.01 level (2-tailed). * Correlation is significant at the 0.05 level (2-tailed).
Source: Based on worker survey data

105
Table A6.4: Correlation coefficients: Share of Afghan workers in total work force (%) with selected variables
Variables Item Pearson Correlation
Construction and other Pearson Correlation -.164(**) Sig. (2-tailed) .000 N 1035 Average wage of Iranian workers per month (in 10000 Rial).
Pearson Correlation -.101(**)
Sig. (2-tailed) .002 N 965 Average wage of Afghan workers per month (in 10000 Rial)
Pearson Correlation -.038
Sig. (2-tailed) .229 N 1026 Initial investment in establishment (in 10milion RIAL).
Pearson Correlation .003
Sig. (2-tailed) .924 N 961 estab_life Pearson Correlation .014 Sig. (2-tailed) .653 N 1019 Low wages Pearson Correlation -.008 Sig. (2-tailed) .807 N 1035 Responsibility of Afghan workers
Pearson Correlation .051
Sig. (2-tailed) .102 N 1035 Ready to do hard work Pearson Correlation .075(*) Sig. (2-tailed) .016 N 1035 Difficulty in hiring national workers
Pearson Correlation .037
Sig. (2-tailed) .230 N 1035 Are Iranian workers willing to do same jobs at Afghan wages
Pearson Correlation
-.073(*)
Sig. (2-tailed) .019 N 1035 Can you continue without Afghan workers?
Pearson Correlation -.139(**)
Sig. (2-tailed) .000 N 1035
** Correlation is significant at the 0.01 level (2-tailed). * Correlation is significant at the 0.05 level (2-tailed).

106
Table A6.5: Interaction among reasons for preferring Afghan workers
Reason for preferring Afghan workers
Low wages
No need
to pay
other dues
Flexibility of Afghan workers
Responsibility of Afghan workers
Ready to do hard work
Difficulty in hiring national workers
Other reasons
Total
Low wages 319 37 61 197 196 64 5 319No need to pay other dues
37 61 22 39 38 20 3 61
Flexibility of Afghan workers
61 22 146 95 83 30 1 146
Responsibility of Afghan workers
197 39 95 754 393 89 10 754
Ready to do hard work 196 38 83 393 610 84 9 610
Difficulty in hiring national workers
64 20 30 89 84 130 1 130
Other reasons 5 3 1 10 9 1 15 15 319 61 146 754 610 130 15 1032 Source: Afghan establishments survey

107
Table A6.6: Correlation coefficients: Variable “Can you continue
without Afghan workers” with selected variables
Variables Item Pearson Correlation
Coefficient
Total number of workers Pearson Correlation .019
Sig. (2-tailed) .531 N 1040 Initial investment in establishment (in 10milion RIAL).
Pearson Correlation .043
Sig. (2-tailed) .178 N
968
Can use Iranian workers at same wage when Afghan workers are not available
Pearson Correlation .174(**)
Sig. (2-tailed) .000 N 1043 Will the price of final products increase if no migrant worker is hired?
Pearson Correlation -.092(**)
Sig. (2-tailed) .003 N 1043 Comment on price increase Pearson
Correlation -.216(**)
Sig. (2-tailed) .000 N 893 Life of the establishment Pearson
Correlation -.076(*)
Sig. (2-tailed) .015 N 1026 Share of Afghan workers in total work force (%) Pearson
Correlation -.139(**)
Sig. (2-tailed) .000 N 1035
** Correlation is significant at the 0.01 level (2-tailed). * Correlation is significant at the 0.05 level (2-tailed