![Ill] · Ill]](https://static.fdocuments.in/doc/165x107/5f1dea4dfd32f01ae52b75ed/ill-ill.jpg)
illUWL!ill ffi[!u1WL!L!~ ~Ur!.~L!ill rn n Lb Lb n IDID rn® · illUWL!ill ffi[!u1WL!L!~ ~Ur!.~L!ill...
46
U~~Lb®W u1® uJlll [! b1~fil IB [! illUWL!ill ffi[!u1WL!L!~ ~Ur!.~L!ill rn n Lb Lb n IDID rn® fl • C
Transcript of illUWL!ill ffi[!u1WL!L!~ ~Ur!.~L!ill rn n Lb Lb n IDID rn® · illUWL!ill ffi[!u1WL!L!~ ~Ur!.~L!ill...
U~~Lb®W u1® uJlll [! b1~fil IB [!
illUWL!ill ffi[!u1WL!L!~ ~Ur!.~L!ill
rn n Lb Lb n IDID rn® fl • C

•
WATER INFORMATION BULIEI'IN NO. 9
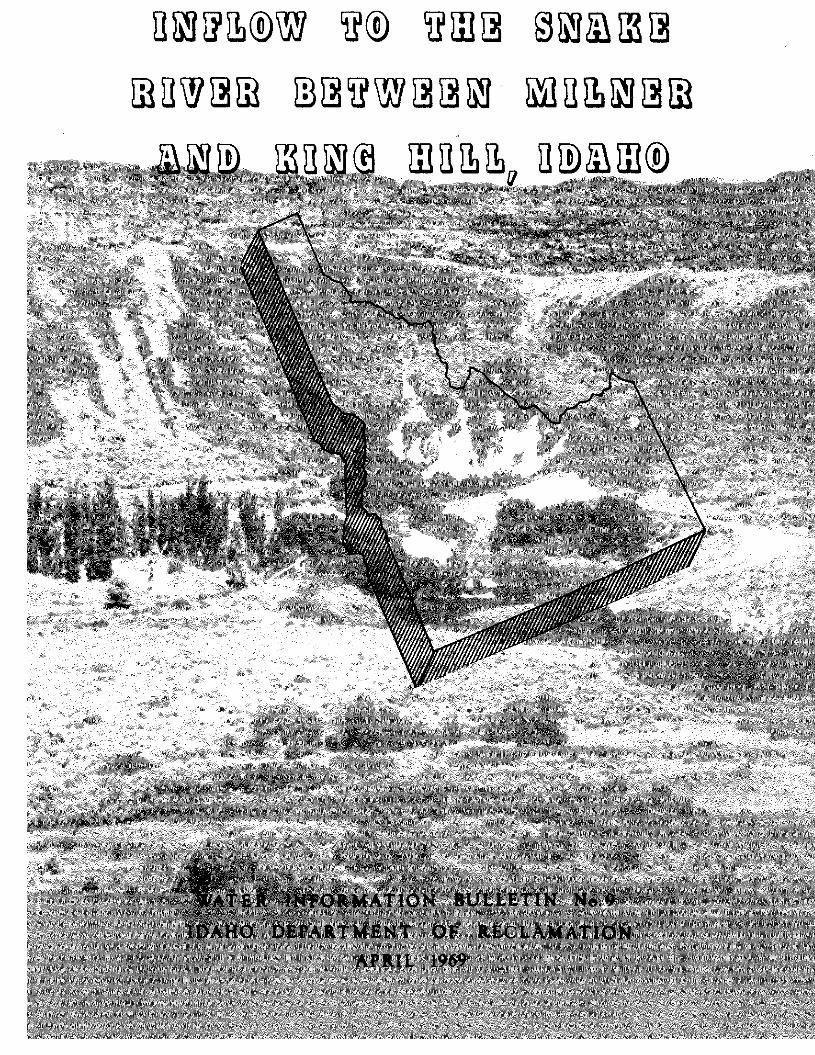
INFLOW TO SNAKE RIVER BETWEEN MILNER AND KING HILL, IDAHO
By
c. A. Thomas
United States Geological Survey
Prepared by the United States Geological Survey
in Cooperation with
Idaho Department of Reclamation
Published by
Idaho Department of Reclamation
R. Keith Higginson
State Reclamation Engineer
April 1969

Abstract ..
Introduction
Purpose and scope
Acknowledgements
Site-nurrbering system
CONTEi\lTS
Description of the hydrologic system
Characteristics of the inflow
Sources of the inflow
Inflow from the south side
Inflow from the north side
Spring inflow
Surface inflow
Factors affecting the inflow
Correlations of the inflow to the reach and the spring
a recharge index ............. .
Correlation with the inflow to the reach
Correlation with the spring flow
Quality of the water
References . . . . .
ILl.,USTRATIONS
flow with
Figure 1. Index map of southern Idaho showing the study reach and
Page
VI
1
2
3
3
3
13
23
23
25
25
28
29
30
31
32
37
39
the Snake River Plain . . . . . . . . . . . . . . . 4
2. Map showing the study reach and the locations of detailed
maps, selected gaging stations, and measuring sites . 7
III

ILLUSTRATIONS (Cont'd.)
Page
Figure 3, !V'iap showing topography and measuring sites, Devils
Washbowl Spring, 0895, to Warm Creek, M0917 9
4. Map showing topography and measuring sites, Ellison
Springs, M0933, to Snake River near Buhl, 0940 10
5. Map showing topography and measuring sites, Clear Lakes
Outlet, M0945, to Thousand Springs, Ml328 . 11
6. Map showing topography and measuring sites, Thousand
Springs, Ml328, to King Hill Canal, 1530 12
7, Graph showing increase of average inflow into the study
reach, during the period 1951-60, with distance
below Milner . . . 14
8. Hydrographs of the inflow to Snake River between main-
stem gaging stations at Milner and King Hill 15
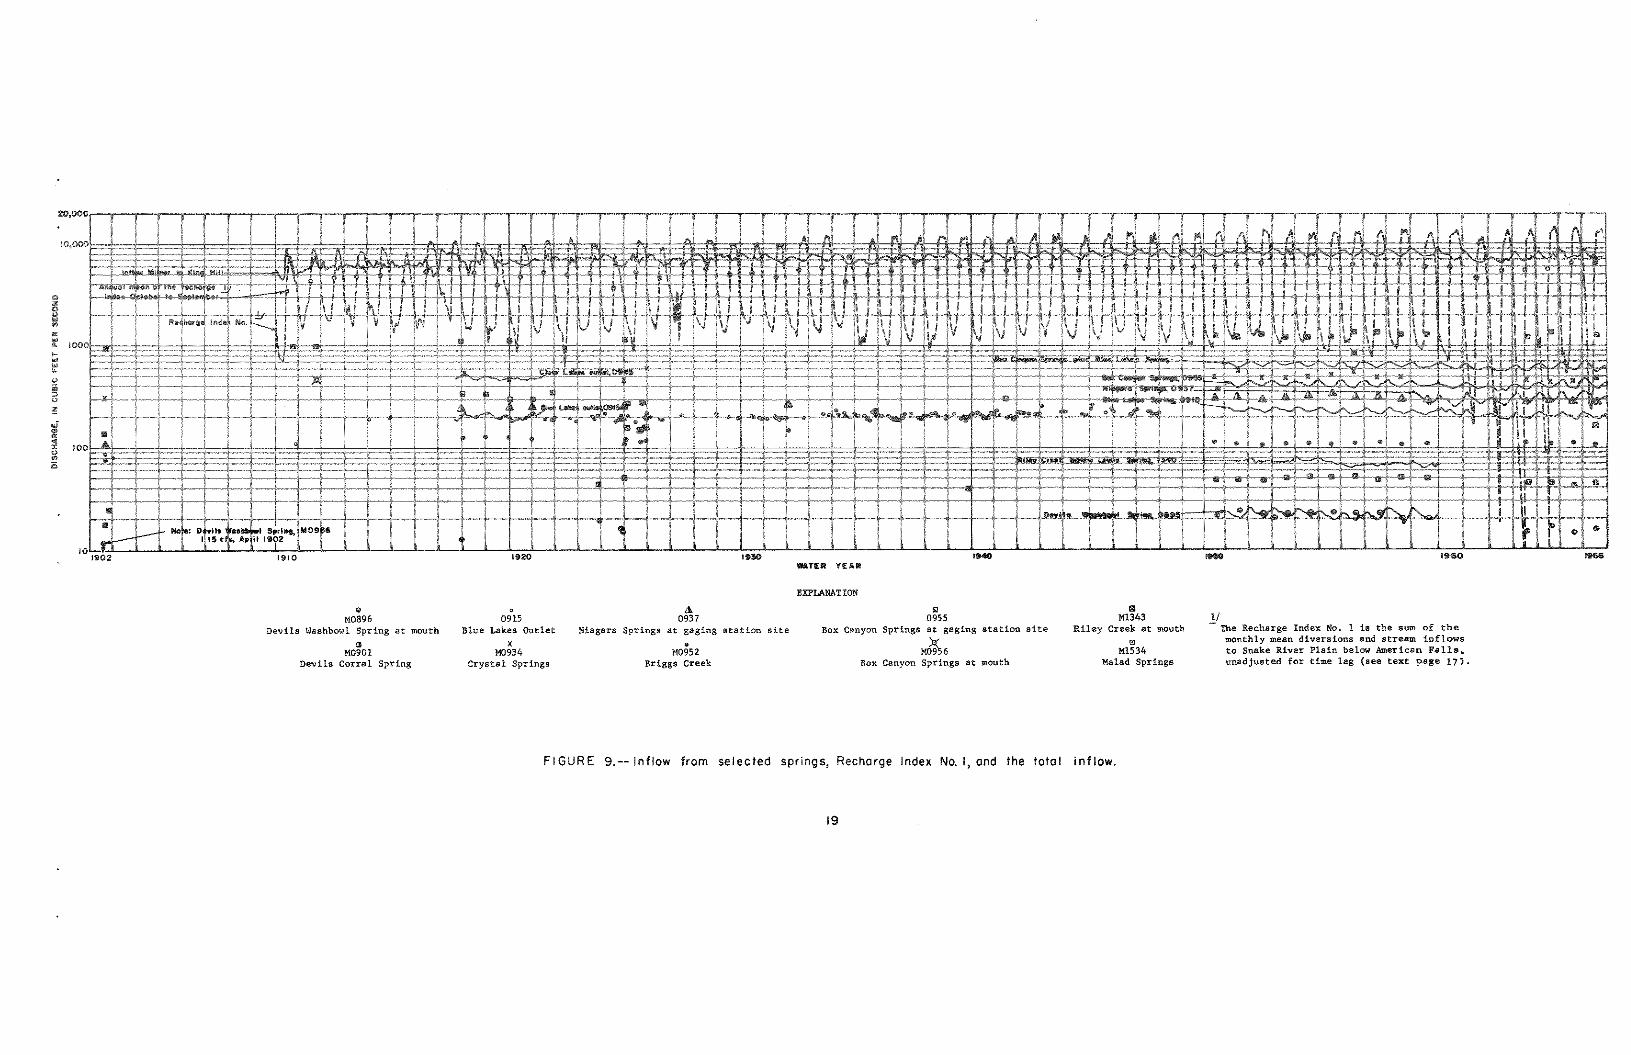
9. Hydrographs of inflow from selected springs, Recharge
Index No. 1, and the total inflow . . . . . . . 19
10. Hydrographs of inflow to Snake River from the south
side 21
11. Graphs showing inflow to the study reach, total spring
flow, and Recharge Index No. 2 . . . . . . . . 27
12. Graph showing relation of Recharge Index No. 2 to the
inflow to the study reach . . . . . . . 32
13, Graph showing relation between departures from the 1942-53
curve, figure 12, and the net pumpage in the Minidoka-
Shoshone area
IV
33

ILLUSTRATIONS (Cont'd.)
Page
Figure 14. Graph showing relation between Recharge Index No. 2
and the inflow from springs in the study reach 35
15. Graph showing relation between departures from the 1941-53
curve, figure 14, and the net pumpage in the Minidoka-
Shoshone area . .
V
36

INFIDW TO SNAKE RIVER BETWEEN MILNER AND KING HILL, IDAHO
By C. A. Thomas
ABSTRACT
Because of its size and location, the water supply entering the Snake
River between Milner and King Hill is a resource of considerable economic
value. The principal source of this supply is the springs along the north
bank of the river. The springs discharge water from the Snake Plain aquifer,
which underlies most of the Snake River Plain. The hydrologic and geographic
features of the supply are shown on maps and graphs and are described brief
ly. Stream and spring discharge records permit reasonably accurate estimates
of inflow to the Snake River from both north and south side sources. The
estimates are basic to studies assessing the impact of man's activities on
the supply and to predict the inflow for management purposes. Generally, in
flow to the study reach fluctuates in a comparatively narrow range compared
with other large uncontrolled surface-water supplies.
Total inflow during the water years 1910-66 averaged 7,400 cfs (cubic
feet per second) or 5.4 million acre-feet per year. An estimated 5,900 cfs
issued from the scores of springs along the north bank of the river while
about 1,500 cfs was contributed from all south-side sources and by surface
flow from the north side. Inflow to the reach increased from 5,500 cfs in
1910 to 8,300 cfs in 1953 as a result of increased irrigation diversions.
However, starting in 1953, pumping from the Snake Plain aquifer began to af
fect the inflow noticeably. Pwnping and a decrease in recharge reduced the
inflow to about 7,000 cfs in 1962. Subsequently, an increase in recharge
VI
raised the inflow to about 7,800 cfs in 1965.
The annual mean inflow to the reach and the total spring flow correlate
significantly with a recharge index which is the sum of flows diverted onto
the plain for irrigation plus tributary flows onto the plain. Pu'Tping from
the aquifer is the principal cause of departures from this correlation since
1953, The departures correlate well with the net pumpage (that part of the
pumped water which is used consumptively) from the aquifer. Using the cor
relations and snow survey data, excellent forecasts of the spring flows and
of the total inflow to the reach can be rra.de. Probable effects on the inflow
caused by changes in diversions for irrigation, artificial recharge of the
aquifer, pu'Tping from the aquifer, and variations in water use caD be approxi
mated from these relations.
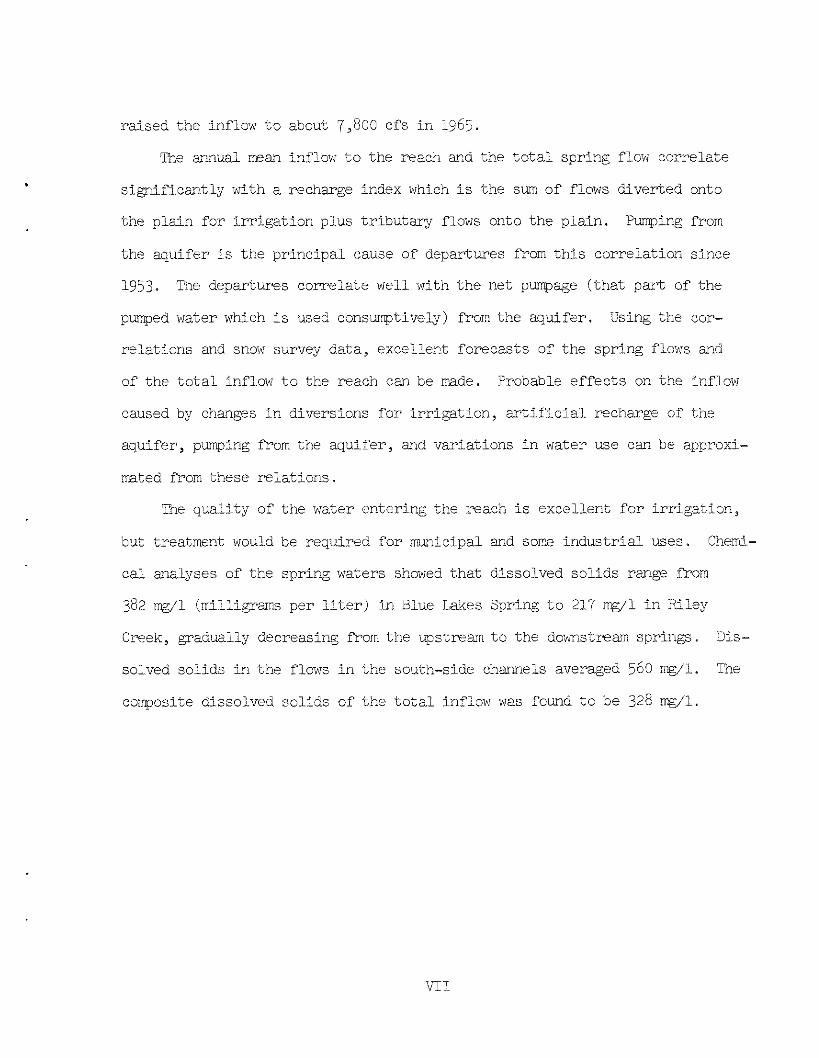
The quality of the water entering the reach is excellent for irrigation,
but treatment would be required for muDicipal and some industrial uses. CherrQ
cal analyses of the spring waters showed that dissolved solids range from
382 mg/1 (milligrams per liter) in Blue Lakes Spring to 217 mg/1 in Riley
Creek, gradually decreasing from the upstream to the downstream springs. Dis
solved solids in the flows in the south-side chal".nels averaged 560 mg/1. The
composite dissolved solids of the total inflow was found to be 328 mg/1.
VII

INTRODUCTION
'Ihe water supply entering the Snake River between the gages at !'flilner,
0880 (nLunbers are site identification numbers and conform with those in fig
ures 2-10), aDd at King Pill, 1545 (fig. 2), herein termed the study reach,
is unique. Inflow at the upper end of the reach is almost entirely controlled
by reservoirs and irrigation diversions. 'Ihe flow passing Milner Darn is very
small during rriany years and is less than 100 cfs for extended periods during
most irrigation seasons. However, the flov1 at Ydng Pill, 94 miles doimstream,
seldom is less than 7,000 cfs, the increase being derived largely from springs
and seepage entering below l'flilner.
The magnitude, location, and uniformity of the supply combine to make
this inflow a resource of considerable economic value for hydroelectric power,
irrigation, fish propagation, recreation, and other uses. Large acreages in
new irrigation projects above and below King Hill receive water by plm'lping
directly from the river, and applications for additional diversions that total
considerably more than the average flow of the Snake River at King Hill during
the irrigation season are on file with the Idaho State Reclarr.ation Engineer.
'Ihe expanding economies of Idaho and adjoining states continue to intensif\J
corrpetition for the use of the Snake River water. Flow in the Snal{e River
presently furnishes all or part of the energy for more thaD a score of hydro
electric power plants between l'flilner and the Pacific OceaD.
Inflow to the Snake River between main-stem gaging stations at !'flilner,
0880, and at King Hill, 1545, averaged 7,400 cfs (5,4 mlillion acre-feet per
year) during the water years 1910-66. This does not include the flow at
gaging station Big Wood River near Gooding, 1545, which has been deducted
from the inflow in the reach for the purposes of this study, nor does it
1

include the flow which bypasses the Snake River gage at King Hill through
the King Hill Ca~al. Of the inflow in the reach, an estimated average of
5,900 cfs (4.3 million acre-feet per year) issued from the scores of springs
along the north bank of the river, while about 1,500 cfs was contributed by
all south-side sources and by surface flow from the north side. Tne group
of springs along the north bank includes 11 of the 65 springs in the United
States that are classified as first magnitude and have an average discharge
in excess of 100 cfs (Meinzer, 1927, p. 44).
Purpose and Scope
Diversions for irrigation, reservoir storage, and other developments
along the Snake River, over an extended period, have progressively changed
the inflow to the study reach. Future developments will cause further
changes. Knowledge of the characteristics of the inflow and the effects of
works of man are vital for planning, proper management, and optirrn.un utili
zation of the resource. ME.ny standard statistical analyses of the records
of inflow are inappropriate because of the bias resulting from these changes.
For exarrple, magnitude and frequency of flows, flow duration, means, etc.,
for the period of record would be misleading. Inflow data for the reach
could be used properly for such statistical analyses only a~er involved
adjustments which are beyond the scope of this report.
This report identifies and quantifies changes that have occurred in the
inflow to the study reach and to several subreaches during periods of rapidly
increasing water-use development. Comparative changes in the subreaches are
illustrated by the use of hydrographs. Simple correlations are illustrated
which provide a basis for predicting inflow. The correlations also indicate
some of the effects on discharge from the Snake Plain aquifer that result
2

from purrping.
The available records of flow in the individual springs through water
year 1967 and detailed descriptions of the springs are included in other
reports (Nace and others, 1958; Thomas, 1968).
Acknowledgements
This report was prepared by the U.S. Geological Survey in cooperation
with the Idaho Department of Reclamation. Discharge data on which determin
ations made in this report are based were taken from surface-water records
published by the U. S, Geological Survey. The lengthy list of arnual re
ports a~d compilations from which these records were obtained is given in
other reports (Nace and others, 1958, p. 8-9; Thomas, 1968, p. 14-15; U.S.
Geological Survey, 1956, p. 10-11, and 1963, p. 5).
Site-Numbering System
All spring and stream measuring sites are identified with a nu.'Ilber,
1545, for example. The numbers increase in a downstream direction in con
formance with the system used in the annual surface-water reports of the
U. S. Geological Survey. Nwnbers bearing a prefix "M" denote a site where
miscellaneous measurements were made; those without the prefix are stations
where a continuous record was obtained. For convenience the part nwrber
(13), which designates a site as being in the Snake River basin, has been
omitted from all references to station numbers listed in this report.
DESCRIPTION OF THE h'YDRCLOGIC SYSTEM
Some major geographic features in the area covered by this report and
the location of the study reach are illustrated on the index map (fig. 1)
and on the map of the study reach (fig. 2). The detailed maps (figs. 3-6)
show local features within the area. Because detailed descriptions of the
3

) ,
r • •
8oist1 Ii'
~ '-z. v..,_
<"
EXPLANATION
E'"...zJ Study reoch
Approximate boundary of Snoke River Plain
1 0 IO 20 30 Mi
117° 116°
"' ~
0 0.. .,,
i ~ ;r
Lak6 lfl,/cofl
--Burley
To Son Jacmto ~ about 8 miles J
-ii 1-5° _ _,._ -i 114° _ _._ 113°
oils 1
'
I ----+-----~-l.~ 112°
FIGURE 1.--Index map of southern Idaho showing the study reach and the Snake River Plain.
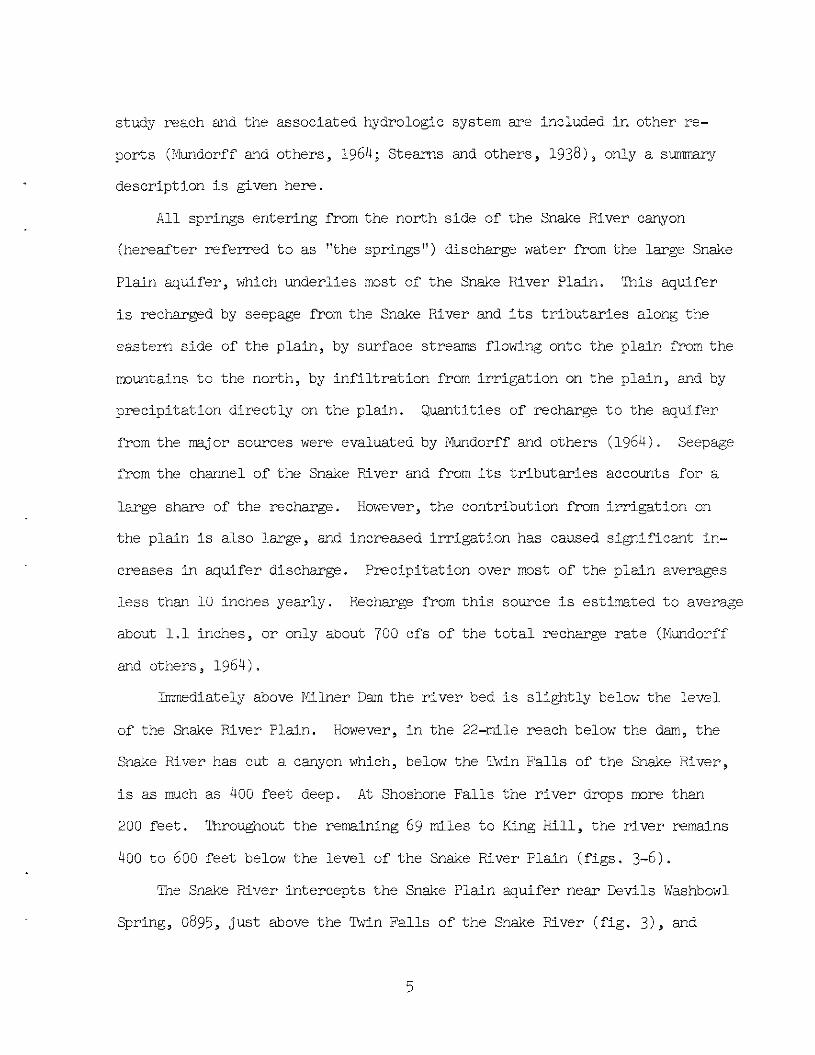
study reach and the associated hydrologic system are included in other re
ports (Mundorff and others, 1964; Stearns and others, 1938), only a summary
description is given here.
All springs entering from the north side of the Snake River canyon
(hereafter referred to as "the springs") discharge water from the large Snali:e
Plain aquifer, which underlies most of the Snake River Plain. This aquifer
is recharged by seepage from the Snake River and its tributaries along the
eastern side of the plain, by surface streams flowing onto the plain from the
mountains to the north, by infiltration from irrigation on the plain, and by
precipitation directly on the plain. Quantities of recharge to the aquifer
from the major sources were evaluated by Mundorff and others ( 1964) . Seepage
from the chaxmel of the Snake River and from its tributaries accounts for a
large share of the recharge. However, the contribution from irrigation on
the plain is also large, and increased irrigation has caused significant in
creases in aquifer discharge. Precipitation over most of the plain averages
less than 10 inches yearly. Recharge from this source is estimated to average
about 1.1 inches, or only about 700 cfs of the total recharge rate (Mundorff
and others, 1964).
Immediately above Milner Dam the river bed is slightly below the level
of the Snake River Plain. However, in the 22-IT'ile reach below the dam, the
Snake River has cut a cariyon which, below the Twin Falls of the Snake River,
is as much as 400 feet deep. At Shoshone Falls the river drops more than
200 feet. Throughout the remaining 69 miles to King Hill, the river reIT'ains
400 to 600 feet below the level of the Snake River Plain (figs. 3-6).
The Snake River intercepts the Snake Plain aquifer near Devils Washbowl
Spring, 0895, just above the Twin Falls of the Snake River (fig. 3), and
5

remains below the water table throughout the remainder of the study reach.
Tne river has direct contact with basalts of the Snake River Group along both
its banks for about 45 miles below rrct.lner. Approximately north of Buhl, the
Snake River Group ends along the southerly bank, and just upstream from King
Hill the river loses contact with the basalts. All of the springs discharge
from the basalts. Tne last discharge from the aquifer, Bancroft Spring,
Ml537. 8, enters about 7 miles above King Hill. 'me basalts along the river
terminate in fluvial and lacustrine deposits that effectively block the
ground-water flow parallel to the river channel, thus forcing all the ground
water discharged by the Snake Plain aquifer into the Snake River above King
Hill. Altitudes of spring openings, accessibility of springs, depth-of canyon
walls, location with respect to other topographic features, and other physical
details are shown on the expanded map sections (figs. 3-6).
Beginning in about 1946, ground water has been pumped to irrigate new
farmland on the Snake River Plain. Even though the quantity of surface water
diverted has not changed materially since about 1920, pumping of ground water
for irrigation in valleys along the margin of the plain has increased rapidly
in recent years. 'mus, pumping has become one of the principal discharges
from the aquifer. Although major natural discharge from the aquifer occurs
from springs in the vicinity of American Falls Reservoir, only the springs in
the reach Milner to King Hill are considered in this report.
Canals on both banks of the reservoir formed by Milner Dam divert water
for irrigation of more than 440,000 acres of land (fig. 2). 'me canals at
Milner are the farthest downstream of those which divert by gravity from Snake
River onto the plain. King Hill Canal diverts from Malad Springs near Hager
man (fig. 6), and it irrigates lands along the Snake River bottom, below the
6

"'
EXPLANATION
Miici!HJn@i;nJt measuring site and numb@r
Ar@@ for whlch detcH and topogr@phy i1a showrL
R@f@r to figJJr@t om !lit@d
~
!
Gooding, 1525
,,, '---~+-~+-\-+----1.-i--l.//f-f_;,.fJC.:;!'..)c"., • ll i!
R 15 E
1 !15
FIGURE 2, The reach and the locations of detailed maps, selected stations, and measur
7

This page is intentionally
blank

.• Ll'.i J,1-~·~ ~E::H~~~~~~ill1il:fil3::'.:JL!__ 4z•sa' 02.. · 114°30'
Bose from U.S. Geologicol Survey Twin Folls,1964 and Kimberly, 1964,
I: 24,000 Do tum is mean sea level Contour interval 10 feet
I Mile
Jf900
Gaging station and number
J0903
.: Miscellaneous measuring site ·i and number -, , ,,
_·"."t..______l JLL-~--------'----"-'' 42° 33'02" 114'20'
FIGURE 3. Topography and measuring sites, Devils Washbowl Spring, 0895, to Warm Creek, M0917.

EXPLANATION
Jf937
Gaging station and number
l0933
Miscel loneous measuring site and number
Bose from U.S. Geological Survey Jerome, 1950
SCALE 1 :62 500
0
Datum is m eon sea level Contour interval 20 feet
I Mile
FIGURE 4. Topography and measuring sites, Ellison Springs, M0933, to Snake River near Buhl, 0940.

FIGURE 5.
Datum is mean sea level Contour interval 40 feet, where dotted is 20 feet
Topography and measuring sites, Clear Lakes Outlet, M0945, to
Thousand Springs, Ml328.
11

42"45' 114"57'30" ~~----···-..
Base from U-S Geological Survey Hogermot\ 1950 and Tuttle, 195\ I :24,000
FIGURE 6.--Topography
SCALE l :62 500 0
Datum is mean seo level Contour interval 10 and 2 5 feet
I Mile
and measuring sites, Thousand
King Hill Canal, 1530.
12
T. 6 S.
Springs, Ml328, to

level of the Snake Plain aquifer. At Minidoka Dam, 35 miles above Milner
(fig. 1), canals divert water for irrigation of 118,000 acres. In all,
about 1,340,000 acres of land are irrigated by diversions from Snake River
or its tributaries above the gaging station at Milner. Reservoirs on the
Snake Fiver and its tributaries above Milner now impound about 4.7 million
acre-feet of water. About 0.4 million acre-feet more, including ~iackay Reser
voir (fig. 1), is stored on tributaries between Milner and King Hill. Tne
diversions and storage upstream from ~dlner, which have increased progress
ively since irrigation began, drastically deplete the river flow at Milner
to the extent that practically no flow passes Milner for long periods.
CHARACTERISTICS OF THE INFIDW
Excluding Big Wood River, overland runoff into the study reach of the
Sna~e River directly from snowmelt or precipitation is practically nil. About
three-fourths of the inflow is from springs fed by the Snake Plain aquifer.
Most of the remainder is return flow from irrigation along the south side.
The average magnitude of the major components of the inflow to the study
reach for the period 1951-60 and the order of entr<J are illustrated graphical
ly on figure 7. Tne quantities of inflow not measured in springs or return
flow channels were distributed uniformly between main-stem gaging stations
unless some reason for a different distribution was known.
During the period of record, the manifold changes in storage, diversion,
and pu'Tlping have strongly influenced the recharge to and the discharge from
the aquifer and the other inflows to the study reach. Nevertheless, compared
with most large unregulated surface-water supplies, the total inflow to the
reach varied in a comparatively narrow range (fig. 8). Annual mean inflow
was about 5,500 cfs in 1910, which was the lowest during the period 1910-66.
13

INFLOW, IN THOUSANOS OF CUBIC FEET PER SECOND
"" 0 a, ... N .,. "' I
0
............._Snoke River at Milner, 0880 "' C: ,; Inflow starts ,... ::, .....
00
... :,' to ...
::, "' "' (') 0 to ,; Snake River near Kimberly,0900 ,; to .... ., 0 ., 0.. to Snoke River near Twin Folls,0905 plus Blue Lakes Spring,0910 .... 0 Rock Creek, 0930 "' ..., V,
~ Cry~I Springs, M 0934 .... ., I <! ':l t Niagara Springs, 0937 "' to 0 ,; .. Snake River near Buhl, 0940 . ., z
f-' 00 " Mud Creek plus Clear Lakes Outlet, 0945 .i,. ~ to "' yon Spring,0954 plus Box Canyon ,... ... .... Spring, 0955 ::r ::, z Salmon Falls Creek, 1055 ...,
Thousand Springs, M 132 0.. .... 3C .... ~ - "' .. :;; 0 rt ., .... (/)
::, ::, Snake River Billingsley Creek,1348 (') rt below Lower Salmon Falls near Hogermon.1'350 to 0
O" rt Molad Springs, M1534 minus King Hi! I Canal, 1530 to ::r ..... to
~ ., Q)
rt 0 ~ C: .... 0.. .... ::I
'< to ,; ,; to Snake River at King Hill, 1545 .,
(')
"' ::r "' .

0 100,000,~~~~~~~~~~~~~~~~~~~~~~~~~~~~~~~~~~~~~~~~~~~~~~~~~~~~~~~~~~o~~~~~~~~~~~~~~~~~~~~~~~~~~~~~~ Z O • 8 ~-1~..+~--+~--+~~~~--~~+-~~~~~-!f---!~-!~-!~-!~-!~-l ~ ~
~ ~
" ...i Miln to ing ill
~ !0,000~~~~~~~~~~~~~~~~~~~~~~~~~~~~~~~~~~~~~~~~~~~~~~~~~~~~~~~~~~~~~~~~~~~~~~~--~-~-i+-~-~~~~~~~~~~~~~~~~~~~~~~ Ll
~ 0 Ll
z
IOO 1909 1920 1930 1940 1950
WATER YEAR
FIGURE 8. --The inflow lo Snake River between main -stem gaging stations at Milner and King Hil I.
•
1960 1966

This page is intentionally
blank

Inflow increased to an annual mean of about 8,300 cfs in 1953 when.pumping
from the Snake Plain aquifer began to affect the inflow noticeably. As a re
sult of ground-water withdrawals and a decrease in recharge, the inflow
decreased to about 7,000 cfs in 1962. Subsequently, an increase in recharge
raised the inflow to about 7,800 cfs in 1965. An annual cyclical variation
of the inflow is evident beginning in 1924 (fig. 8), with the lows typically
in the spring months and the highs in autumn. The regularity of this pattern
indicates that the changes are artificially imposed. The obvious causative
factor is the seasonal application of irrigation water on the plain and the
seasonal cyclical pattern of other flow which recharges the aquifer. An in
dex designated Recharge Index No. 1, has been computed to illustrate the
effect of recharge influences on the inflow and is plotted on figure 9 for
the period 1910-66. Tne index is the sum of monthly mean diversions onto
the plain from Snake River at Minidoka and at /I'd.Iner plus the flow from Big
Wood River and Goose, Salmon Falls, and Rock Creeks. This index is not ad
justed for the time lag occurring between a particular recharge event and the
corresponding cha~ge in inflow.
Tne inflow to the subreach between gaging stations Snake River at Milner,
0880, and Snake River near Kimberly, 0900, plotted on figures 8 and 10, enters
the river mostly as seepage from south bank. Less than 20 percent of this
segment of inflow appears as surface flow in measurable channels before reach
ing the river. In figure 10, the computed inflow for some months, see 1943
and 1957, are quite different from those for a month or two before and a~er.
The Snake River was high during most of these months~ and small inaccuracies
in large river discharges can result in fictitious figures for the computed
inflow. However, the river through much of this subreach is perched above
17

the regional water table and the apparent low inflow may result from seepage
away from the river when stages are above the low-water channel. The long
term trend of the flow in this subreach is downward (fig. 8), which contrasts
with the trend in the flow in the springs.
The correlation of the inflow to the subreach IV'd.lner to Kimberly with
the inflow to the subreach between gages Snake River at IV'd.lner, 0880, and
Snake River near Twin Falls, 0905, as shown in the hydrographs of figure 8
permits a reasonable estimation of discharge for the Milner to Kimberly sub
reach for the periods 1912-16 and 1920-23 (fig. 8). The relation of the
inflow Milner to Kimberly with the flow at the gaging station Rock Creek near
Twin Falls, 0930, is reasonably good as shown on figure 10. The pattern of
the total inflow from five sources (fig. 10) also corresponds reasonably with
that for the inflow ~lilner to Kimberly. Since these are major parts of the
total inflow from the south side for the entire study reach, and since they
all correlate with each other, it may be inferred that the inflow Milner to
Kimberly and the other large se@llents of the inflow that have been gaged are
reasonably good indices of the total south-side inflow.
The inflow between river gages near Kimberly, 0900, and near Buhl, 0940,
is more than 20 percent of the total inflow in the study reach (fig. 7),
About two-thirds of the flow in this subreach is spring flow from the north
side. The remainder is nearly all return flow from irrigation on the south
side. Measurements show sizable variations in the south-side inflow to the
subreach.
The subreach between the river gages near Buhl, 0940, and below Lower
Salmon Falls, near Hagerman, 1350, receives more than half the total inflow
to the study reach. About 10 percent of the inflow in this subreach is in
18
1910
• M0896
Devils Washbowl Spring at mouth
• M0901 Devils Corral Spring
0
0915 Blue Lakes Outlet
X M0934
Crystal Springs
& 0937
Niagara Springs at gaging station site
• M0952 Briggs Creek
\!MT£ft YEAIII
EXPLANATION
a 0955
Box Canyon Springs at gaging station site
M0\6 Box Canyon Springs at mouth
., Ml343
Riley Creek at mouth e
Ml534 Malad Springs
FIGURE 9.-- Inflow from selected springs, Recharge Index Na. I, and the total inflow.
19
- 1960
l) The Recharge Index No. 1 is the sum of the monthly mean diversions and stream inflows to Snake River Plain below American Falls• unadjusted for time lag (see text page 11,.

This page is intentionally
blank

0 z 0 0 0 @ u 0 • Cl 0 Cl Cl @I @ @ Cl w @ • • • • 0 • @ • 0 0 @ ® 4111 (/) Ii 0 0
a: 1000 w 11.
... w w "-I..)
"' 0 ::, u • z
w "' 100 a: .. ,: u (/)
0
ide year
IO 1922 1950 1960 1966 1940 WATER YEAR
1930
FIGURE 10. Inflow to Snake River from the south side.
21

This page is intentionally
blank

measurable wasteways from the south side, about two-thirds is from measured
springs along the north side in the subreach, and the remainder flows from
springs and seeps not measured, most of which are along the north side.
More than 80 percent of the inflow in the subreach between the river
gages below Lower Salmon Falls, near Hagerman, 1350, and at King Hill, 1545,
is from ~ialad Springs, Ml534. Flow at the gage Big Wood River near Gooding,
1525, is deducted from inflow in this subreach as noted in the introduction.
The hydrographs indicate that, while there is a definite upward trend
in the total inflow in the study reach until about 1953, an upward trend
did not occur in the extreme upper or lower subreaches. Most of the sizable
increase in the total inflow during the period of record developed in the
subreach between the river gages near Kimberly, 0900, and below Lower Salmon
Falls, near Hagerman, 1350.
SOURCES OF THE INFIDW
Analysis of the different sources of the total inflow in the study reach
aids in understanding the characteristics of the inflow, in assessing the im
pact of man's activities, and in predicting future performance of the hydro
logic system.
Inflow from the South Side
Most of the flow entering the study reach from the south side is return
flow from water that has previously been utilized for irrigation. The natural
surface flows of the southern tributaries are practically all diverted for
irrigation during the summer season and the flows are usually small during
the nonirrigation season. The South Side Twin Falls Canal (gaging station
0875, see fig. 2), is a major source of the south-side inflow. It diverts
about 6.2 acre-feet per acre annually to irrigate 203,000 acres south of the
23

Snake River. Because consumptive use probably does not exceed about 2.0
acre-feet per acre, it is assumed that most of the excess, about 4.2 acre-feet
per acre, or 850,000 acre-feet per year, returns to Snake River in the study
reach as subsurface or surface flow from this source.
Inflow in the Milner to Kimberly subreach is from seeps and springs
considered to be all south-side flow for purposes of this report even though
a few springs, including Devils Washbowl Spring, 0895, are on the north bank.
Errors resulting from this approximation are believed to be insignificant
compared with other inaccuracies in the estimates of various segments of the
inflow.
About two-thirds of the total return flow into the study reach from the
south side enters the Snake River in the lower channels of Rock Creek, Cedar
Draw, Deep Creek, and Salmon Falls Creek, and above the Kirrberly gage, 0900.
Records of the return flow in Rock Creek near Twin Falls, 0930, are available
from 1921 to 1947. Likewise, records for Cedar Draw, 0935, Deep Creek, 0950,
and Salmon Falls Creek, 1080, are available for about 3 years. Totals of the
flow into the Snake River from these five main contributors of south-side
inflow are shown graphically for water years 1956-58 in figure 10.
Inflow to the study reach from all measurable south-side surface flows,
including the channels mentioned, was determined by rounds of measurements
to be 1,650 cfs in September 1958, 1,160 cfs in March 1959, and 1,280 cfs in
August 1959, Unmeasured inflow from the south side through seeps or in
accessible channels is estirr,ated to be 150 cfs. Utilizing these data,
relations between various segments of the inflow previously established, and
all other available pertinent data, good estimates of inflow from the south
side can be wade. The estimated total inflow from the south side for the
24

period 1910-66 averaged about 1,400 cfs. Estirrated figures of annual mean
inflow from the south side for the period 1922-66 are plotted in figure 10.
Inflow from the North Side
Spring inflow
By far the largest inflow to Snake River in the study reach is from the
scores of springs that issue from the north side. The known data on the
flows of the springs were summarized through 1947 (Nace and others, 1958) and
for 1948-67 ('.Ihomas, 1968). Locations of the springs are shown on the maps
(figs. 3-6), and flows of representative springs are presented in figure 9.
The discharge of some of the springs has changed radically. For instance,
measurements of Devils Washbowl Spring at site M0896 increased from 1.15 cfs
in 1902 to 12.7 cfs in 1917; averaged 24.0 cfs during the highest 5 years,
1951-55; and decreased to an average of 15.6 cfs during the 4 years 1963-66.
Apparently the flow in the springs farthest upstream increased more rrarkedly
as a result of surface diversions onto the plain than those near the down
stream end of the study reach. Pumping from the Snake Plain aquifer appears
to be causing these same springs to recede more than the springs farther
downstream.
Tne total spring flow is considerably greater than the sum of the dis
charges of all of the individual springs that have been measured at various
times. Points of entry of large segments of the unmeasured flow are known.
Box Canyon Spring was flowing 480 cfs more at the mouth, site M0956, than
at the gaging station, site 0955, on April 6, 1956. Blue Springs, M0957,
which probably flows more than 60 cfs, cannot now be measured by regular
methods except when the forebay above Upper Salmon Falls Dam is very low.
Riley Creek, a.t the mouth, Ml343, is estimated to flow about 120 cfs more
25

than at the regular measuring site, Ml338. Concurrent records for the main
stem Snake River gaging stations near Hagerrr.an, 1345, and below Lower Salmon
Falls, near Hagerman, 1350, show nearly 400 cfs more inflow than in the
measured springs in that reach.
All of the unmeasured spring flow can be estimated closely at the times
of the three sets of measurements of the south-side inflow. The most import
ant elements of the total spring inflow are known then within close limits.
Computations show that the un~easured spring flow was 1,600 cfs in September
1958, 1,600 cfs in March 1959, a~d 1,400 cfs in August 1959. An.~ual means
of the total spring discharges have been computed and are shown on the bar
graph (fig. 11). Tnese figures are believed to be within a few percent of
the actual yearly mean discharge from the western end of the Snake Plain
aquifer. As shown by figure 11, total spring flow has ranged from about
4,100 cfs in 1904 and 1907 to about 6,900 cfs in 1953 and was about 6,200
cfs in 1966.
Major diversions from the lfialad Springs into the King Hill Canal began
in 1930. About 25 percent of the flow in the King Hill Canal returns to the
river as return flow from irrigation or from canal leakage and is measured at
the King Hill gage. However, about 75 percent of the flow in the King Hill
Canal bypasses the King Hill gage or is used consumptively upstream. To
reflect more accurately the total contribution from these springs, 75 percent
of the flow in the King Hill Canal is included in the total spring discharge
shown in figure 11. As previously noted, the flow in King Hill Canal was
not added to the inflow, lfdlner to King Hill, since the inflow in the study
reach was intended to represent the unobligated water supply entering the
reach. However, the total spring inflow represents the discharge from the
26

0 z 0 L)
w <J)
a: w 0..
I-.., "' IL
L)
"' ::, L)
IL 0
N Cl) --:i 0
z <I <I) :::, 0 :,:: I-
~
w
"' a:: <( :,:: L) Cl)
0
Recharge I dex No. 2 .!J
10
e -"- "--""----"f""lc""+"+
4
2
gaging stotio sat Milner and Knq Hill (less inflow of Big Wood River as measured ear Gooding}
I "'
spring inflow, computed
Total for 2 springs measured nnual ly about Apri (estimated 1960 62) --1---1
_-:"~::;~~:::.,,;:/tlf::so~~~:nt ~'"::" --- """"-------abovel Shelley and belo American Falls, djusted for ti/ne lag (see text, age 30).
I
WATER YEAR
0 <t
"' 0
"' "' 0 <D
"'
FIGURE 11. Inflow to the study reach, total spring flow, and Recharge Index No. 2.
"' "' "'

Snake Plain aquifer, of which the King Hill Canal water is a part.
Total discharge of the north-side springs as estimated for the period
1910-66 averaged 5,900 cfs.
Surface Inflow
Most of the surface return flow from irrigation on the north side spills
over the rimrock into the deep box canyons, coves, or channels associated with
the major springs (J. R. Spofford, U. S. Geological Survey, Boise, Idaho, 1968,
oral commun. ) . At the times of the annual spring measurements, this surface
return flow was also measured. The average of 13 sets of measurements of re
turn flow made during the periods 1950-59 and 1963-65 was 63 cfs. Practically
no flow was reported in 1956 and 1964, but nearly 200 cfs was measured in 1965.
Data from the North Side Canal Co. , Ltd. , showed that surface return flow from
the north side averaged 100 cfs during 1958, An average of 100 cfs has been
used in this report and is believed to be reasonable.
The hydrograph of the total inflow, Milner to King Hill (fig. 8), shows
irregularities during years prior to 1925 that are not characteristic of later
years. For example, high apparent inflows for some months in 1910, 1916, and
1919 were evidently caused by unusual local runoff or by large winter diversions
in the canals above Milner. These unusual flows have been lowered to figures
more characteristic of flows occurring in the spring of the year in estimating
the discharge from springs for those years.
Big Wood River and Clover Creek are the only surface streams that flow
directly into the Snake River from the north bank in the study reach. Tne
Big Wood River has been gaged for long periods at the station near Gooding,
1525, Since this flow is someti.mes rather large and is unrelated to the
other inflow in the study reach, it has been subtracted from the figures of
28

total inflow as noted in the introduction to this report. Flow in Clover
Creek, 1540, averages only about 30 cfs and has been treated as unmeasured
inflow in computations for this study.
FACTORS AFFECTING THE INFI.DW
The spreading of water on the Snake River Plain for irrigation has re
sulted in a net increase in recharge to the aquifer, and thus increased return
flow to Snake River. Diversions per acre of land irrigated on the Snake River
Plain are comparatively high, and much of the water diverted returns to the
Snake River in the study reach. The bar graph (fig. 11) shows inflow to the
study reach and estL'Tlated total flows of the springs. Irrigation on the plain
began near Idaho Falls in 1870. By 1900, more than 0.4 million acres were
reclaimed, and by 1960, about 2.1 million acres were being irrigated by sur
face water diversions and ground-water withdrawals.
Pumping from the Snake Plain aquifer onto the Snake River Plain began
in 1946 and has increased progressively. The consumptive part of this pu'Tlp
age is another discharge from the aquifer.
In addition to the increasing the inflow to the Snake River in the
study reach, the diversions onto the plain and other recharge sources cause
a cyclical variation in the spring flows and in the total inflow. Recharge
Index No. 1, described earlier in the report, has been used in figure 9 to
portray graphically some of the relations between recharge factors and inflow
to the river.
Figure 9 indicates that the annual cycles of inflow to the study reach
are related to the cycles of the recharge supply. The recession of the annual
cycle each year is arrested soon a~er the irrigation season begins. The in
flow hydrograph begins to rise noticeably about a month a~er heavy irrigation
29

diversions begin, and the decline resumes about a month after the heavy irri
gation season ends. It should be noted that the high runoff from natural
streams, which is a part of the recharge index, is approximately coincident
with the start of the irrigation season; hence, the effects are additive ex
cept as they are affected by tLme lags.
Following years of low diversions such as 1934 and 1961, inflow to Snake
River, and the amplitude of the cyclical changes are lower than during aver
age years. Likewise, increased recharge results in corresponding increases
in the inflow and in the amplitude of the cyclical changes.
CORRELATIONS OF THE INFLOW TO THE REACH AND THE SPRING
FLOW WITH A REC'rlARGE INDEX
A second recharge index was derived, designated Recharge Index No. 2,
which is the sum of diversions from the main stem of Snake River below Neeley
(fig. 1) and above Shelley, diversions from Henrys Fork and tributaries,
streams on the north side from !Viud Lake to Big Wood River, and streams on the
south side below Neeley.
Before combining the elements of recharge below Neeley and those above
Shelley for the correlation, the flows were adjusted somewhat arbitrarily be
cause there is a lag in time between a recognizable recharge event and a corre
sponding inflow to the study reach. Also, the lag time would vary with the
distance of the recharge event from the studY reach. Consequently, the figures
used for elements above Shelley are the averages for the current year and the
previous year. The figures used for elements below Neeley are the averages for
the 12 months from July of the previous year until June of the current year.
Figure 11 illustrates how this recharge index follows the trends of
the inflow to the study reach.
30

Correlation with the Inflow to the Reach
Empirical relations between this recharge index and the inflow to Snake
River in the study reach are shown on figure 12. All points on figure 12 are
within about 8 percent of the average regression line for the period 1920 to
1966. The standard error is less than 5 percent. Plotting positions in the
figure appear to group by years. For instance, the points for the period
1920-41 are all within 3 percent of a regression line drawn through those
points. Similarly, points for three other periods are all within 3 percent
of their respective regression lines except 1966, which indicates a continu
ation of the trend in recent years for the plotting positions to move fa:.rther
to the right.
Changes in regimen in the Snake Plain aquifer appear to explain these
groupings. During the period 1920-41, the aquifer was filling as a result of
diversions onto the Plain. During the same period, consumptive use on newly
irrigated lands reduced recharge from the tributaries bordering the Snake
River Plain. During the period 1942-53, the aquifer was approximately in
equilibrium, di versions were large, and effects of pumping ground water from
the aquifer were minor. Pumping from the aquifer affected the gradients,
elevations, and the discharge from the aquifer during the periods 1954-59
and 1960-66. During the period 1960-66, pumping apparently reduced the in
flow in the study reach 600-700 cfs from the rate reached during 1942-53,
Tne plotting positions from 1965 and 1966 indicate that a new curve to the
right of that shown for 1960-66 may now be applicable (fig. 12).
Figure 13 shows the relation between departure of inflow from the
1942-53 curve of figure 12 and net ground-water pumpage in the Minidoka
Shoshone area for the years 1954-66. Net ground-water pumpage, that part of
31

0
Average curve, 1942 -53
r=0.85 "'--5~,:;o~
4, 04§. ::.---" -- i!Ss-450 '1~9430 --%=,'5456~9
Average curve, 1920-66 ~,0--,(z" %ago~ 29 8 ..--o 39 0
r = Coefficient of correlation
>- <)
0: II) w:) z <)
.J u.
r: 0.87 ~ _,,----0
64 60 65o
Average curve, 1920-41 30 o f J3s - -- 0 \ 01966
74 ,, 0.80 y36 -- q 40 63
\
320 31,..r4 &:.C - -;;;;31° 28
:ii O 70
31: ~ gw u. 0: zo _z
:) :i:
250 ;rio 022 026 Average curve, 1954-59 _-"' 024 r: 0.65
~ - - Average curve, 1960-66 r: 0.87
76 80 84 88 92 96 100 104 108 112 116 120
RECHARGE INDEX NO. 2, IN HUNDREDS OF CUBIC FEET PER SECONO
FIGURE 12. Relation of Recharge Index No. 2
to the inflow tc the study reach.
32

(/) 0 Zz 10 <! 0 w <.) ::;; w ...J (/) <! a:: 8 1966 ::, w z a.. 0 z I-<! w .w 6 ~ "-
062 065 <( <.) 064 a. -0 °61 ::;; a,
::, ::, 4 58 059 0
60 63 a.. <.)
57 ° "- 19540 a:: 0 56 w I- (/) 55 <! 0 2 ;: w I 0:: oo zZ ::, ::, 0 :,; 00 2 4 6 8 10 12 a:: z (!) - DEPARTURE FROM 1942-53 CURVE, IN
HUNDREDS OF CUBIC FEET PER SECOND
FIGURE 13. Relation between departures from
the 1942-53 curve, figure 12, and the net
pumpage in the Minidoka-Shoshone area.
33

the pumped water that is used consumptively, was estimated for each year
from data on crop requirements and miscellaneous losses for nearby projects
adjusted for rainfall ( unpub. data). The correlation in figure 13 indicates
that most of the departure for the 13 years from the 1942-53 curve of figure
12 results from the pumpage or a related effect. A statistical test of the
significance shows that 95 percent of the time points on figure 12 would
plot within about 3 percent of the 1942-53 curve after adjusting for the net
pumpage.
Correlation with the Spring Flow
The spring inflow as well as the total inflow into the reach correlates
significantly with Recharge Index No. 2. The plotting of the points on fig
ure 14 suggests that for the period 1920 to 1940 the aquifer was filling and
the springs reacted to changes in recharge to the aquifer to a lesser degree
than during the period 1941 to 1953. Pumping from the aquifer began about
1946 and became significant by about 1954.
Net ground-water pumpage from the aquifer in the Minidoka-Shoshone
area and departure from the curve of relation for 1941 to 1953 of figure
14 are compared on figure 15. Because the degree of correlation is high,
as shown by the plotted points, the effect of pu.rripage on the spring dis
charge can be predicted with considerable assurance.
From figure 12, it can be seen that if a recharge index can be fore
cast, then inflow can also be forecast by use of the appropriate curve.
Estimates of streamflow and diversions onto the plain based on snow surveys
and reservoir storage for April 1 can be made with considerable confidence.
From these, forecasts of the inflow to the reach for the next 12 months can
be made ('Ihomas, 1967). 'Ihe ability to forecast the magnitude and major
34

C z 0 u 70
zW - "'
" 0:: "' w 66 "' Q. z .... 0:: w ~ ~ 62
::I! u o-~ B sa ~,... oO .J u, 54 ,... 0 Zw
0::
Average curve1 1941-53 Coeff1c1ent of correlat1on (r): 0.91 51
5~ 48 ........ 57
45 JO ~3 52° is • "46 •°-"'- Q..
44 •050 55 ~4 •42 64o •so
39 -.. :--Average, curve 36 o~ --63
1927-40 ° _;-1.- •61 '-..,. 32 34 _ 4 0 28° • 33
"-..... _2---;-;21 S29 os2 035 ..- ---- 31 026 -- - -- -..--- ---- -Average curve,
025 -~1.-.22 °23 1920-26
------- 0 21 -oj'i2ci'
196fi,
C z 50l-..J......L.......JI......J......J......J.~.1..-...L.....L.......JI......J......J..---1~.I..-.J...-1.~L-..l--1..---1~.I..-...L....J 108 112 116 ~ 72 76 80 84 88 92 96 100 104
RECHARGE INOEX NO. 2, IN HUNDREDS OF CUBIC FEET PER SECOND
FIGURE 14. Relation between Recharge Index No. 2 and the
inflow from springs in the study reach.
35

,.,; 0 zz 10 "' 0 "'u :I: w ..J (/)
"' 0: 8 19660 ::, w z Q.
z .... "' w •W 6 w u.
"' 640 6 %62 "' u a. -
:I: co 600 630 61 ::, ::,
4 58/59 Q. u u. 570
056 0: 0 w .... (/) 0 "' 0 2 55 0
1954 :I: w I 0: 00 zZ ::, ::,
00 0:,:: 2 4 6 8 10 12 0: z
<!) - DEPARTURE FROM 1941 -53 CURVE, IN HUNDREDS OF CUBIC FEET PER SECOND
FIGURE 15. Relation between departures from
the 1941-53 curve, figure 14, and the net
pumpage in the Minidoka-Shoshone area.
36

variations in this inflow is of considerable value for water management
purposes. By using a computerized approach, a relation which would give
better estimates of the inflow to the reach using different assumptions to
take care of the time lag could no doubt be found.
In addition to their value for predicting the flows into the study
reach, figures 12-15 are useful in evaluating effects on the flow from
changes in irrigation, artificial recharge, pumping, and other water-use
practices. For exaJnple, the relations indicate that spring flow decreases
the sarre year that pumping from the aquifer is increased. Likewise, a~er
allowing for a relatively short time lag, both the spring inflow and the
total inflow to the reach rise and fall with the recharge index.
QUALITY OF THE WATER
Chemical analyses of water from various springs on file in the Boise,
Idaho, office of the U.S. Geological Survey indicate that the dissolved
solids in water entering the Snake River from springs between Milner Dam
and King Hill averages about 260 mg/1 (milligrams per liter and parts per
million are n1.unerically equivalent in the ranges of concentration found in
these waters). The analyses show that the concentrations in the water of
the springs decrease approximately in downstream order; that is, the highest
concentrations are in springs farthest upstream and the lowest concentra
tions are in the springs farthest downstream. The dissolved solids in the
discharge from the larger springs range from 382 mg/1 in Blue Lakes Springs
(0910) to 217 mg/1 in Riley Creek (1343), Chemical analyses of water from
four of the larger drainage channels from the south side, most of which is
return flow from irrigation, show that the concentrations of dissolved solids
were considerably higher than in the springs and averaged about 560 mg/1.
37

These higher concentrations may be due to prior use of this water for irri
gation, to differing geologic environments, or to causes unknown. No con
sistent pattern of change in dissolved-solids content with respect to
location was noted for the south-side inflows.
On the basis of weighted averages, the inflow to the reach was deter
mined to contain 328 mg/1 of dissolved solids. This figure is substantiated
by the observation that the dissolved-solids content of the flow in Snake
River at King Hill, 1545, for the 1961 water year averaged 326 mg/1. During
that year, about 97 percent of the flow at King Hill was derived from inflow
to the study reach.
In all samples, the sodium percentage is relatively low indicating
a low sodiu.rn hazard with regard to use of this water for irrigation. The
water from all sou.rces generally is excellent for irrigation. Treatment
for hardness may be necessary for some industrial uses. The water, even
from the springs, requires treatment for biological hazards if used for
municipal supplies. Although the flow from the springs is crystal clear,
flow off the irrigated lands, industrial wastes, high flows past lflilner,
and aquatic growths contribute to turbidity and to varying amou.nts of pol
lution in the river.
38

REFERENCES
Meinzer, 0. E., 1927, Large springs in the United States: U.S. Geol.
Survey Water-Supply Paper 557, 94 p.
Mundorff, M. J., Crosthwaite, E.G., and Kilburn, Chabot, 1964, Ground
water for irrigation in the Snake River basin in Idaho: U. S.
Geol. Survey Water-Supply Paper 1654, 224 p.
Nace, R. L., McQueen, I. S., and Van't Hul, Arthur, 1958, Records of
springs in the Snake River valley, Jerome and Gooding Counties,
Idaho, 1899-1947: U.S. Geol. Survey Water-Supply Paper 1463, 62 p.
Stearns, H. T. , Crandall, Lynn, and Steward, W. G. , 19 38 , Geology and
ground-water resources of the Snake River Plain in southeastern
Idaho: U.S. Geol. Survey Water-Supply Paper 774, 268 p.
Thomas, C. A., 1967, Use of snow surveys to forecast inflow to Snake
River between Milner and King Hill, Idaho: Proceedings of the
35th annual meeting of the Western Snow Conference, Boise, Idaho
April 18-20, 1967, p. 1-5,
__ 1968, Records of north-side springs and other inflow to Snake
River between Milner and King Hill, Idaho, 1948-67: Idaho Dept.
of Reclamation Water Information Bulletin No. 6, 65 p.
U.S. Geological Survey, 1956, Compilation of records of surface water
of the United States through September 1950, pt. 13, Snake River
basin: U. S. Geol. Survey Water-Supply Paper 1317, 566 p.
U.S. Geological Survey, 1963, Compilation of records of surface waters of
the United States, October 1950 to September 1960, pt. 13, Snake
River basin: U. S. Geol. Survey Water-Supply Paper 1737, 282 p.
39


![Industrial Sewing Machine Parts Catalog Model LT2-220MOB...Industrial Sewing Machine Parts Catalog Model LT2-220MOB LT2-220BOB [}] rn lil [!] []] [ill [I] [ID [[] [ill [] IJ1I lU 11]](https://static.fdocuments.in/doc/165x107/5aaa52f57f8b9a86188de993/industrial-sewing-machine-parts-catalog-lt2-220mobindustrial-sewing-machine-parts.jpg)
![-L 10 O l Ill tht! Ill [(41 Q o p 1.6 Q 0 15 Ð6 bJ 01K 81 ...10596,c,html/... · 11 {K - 1k Ill Ill (Ill IR' Å? @ co o o rn Ill -H AJ I [11] fiì cn 011 0 1-0 AJ Il 39 '10 16 -RI-I](https://static.fdocuments.in/doc/165x107/5ec437870c8d8f1c6957d5ae/l-10-o-l-ill-tht-ill-41-q-o-p-16-q-0-15-6-bj-01k-81-10596chtml.jpg)