IlluminaIllumina s’s GWAS Roadmap · IlluminaIllumina s’s GWAS Roadmap: next-generation ......
23
Illumina’s GWAS Illumina s GWAS Roadmap: next-generation next generation genotyping studies in the post-1KGP era Alex Helm Product Manager Genotyping Applications © 2010 Illumina, Inc. All rights reserved. Illumina, illuminaDx, Solexa, Making Sense Out of Life, Oligator, Sentrix, GoldenGate, GoldenGate Indexing, DASL, BeadArray, Array of Arrays, Infinium, BeadXpress, VeraCode, IntelliHyb, iSelect, CSPro, and GenomeStudio are registered trademarks or trademarks of Illumina, Inc. All other brands and names contained herein are the property of their respective owners.
Transcript of IlluminaIllumina s’s GWAS Roadmap · IlluminaIllumina s’s GWAS Roadmap: next-generation ......
Illumina’s GWASIllumina s GWAS Roadmap:
next-generationnext generation genotyping studies in
the post-1KGP erap
Alex HelmProduct Manager
Genotyping Applications
© 2010 Illumina, Inc. All rights reserved.Illumina, illuminaDx, Solexa, Making Sense Out of Life, Oligator, Sentrix, GoldenGate, GoldenGate Indexing, DASL, BeadArray, Array of Arrays, Infinium, BeadXpress, VeraCode, IntelliHyb,iSelect, CSPro, and GenomeStudio are registered trademarks or trademarks of Illumina, Inc. All other brands and names contained herein are the property of their respective owners.
Overview
First-gen GWAS vs. Next-gen GWAS
Next-gen Sequencing and the 1kGP RevolutionNext-gen Sequencing and the 1kGP Revolution
2010 – 2011 GWAS Roadmap
2
First-gen GWAS vs Next-gen GWASFirst-gen GWAS vs. Next-gen GWAS
3
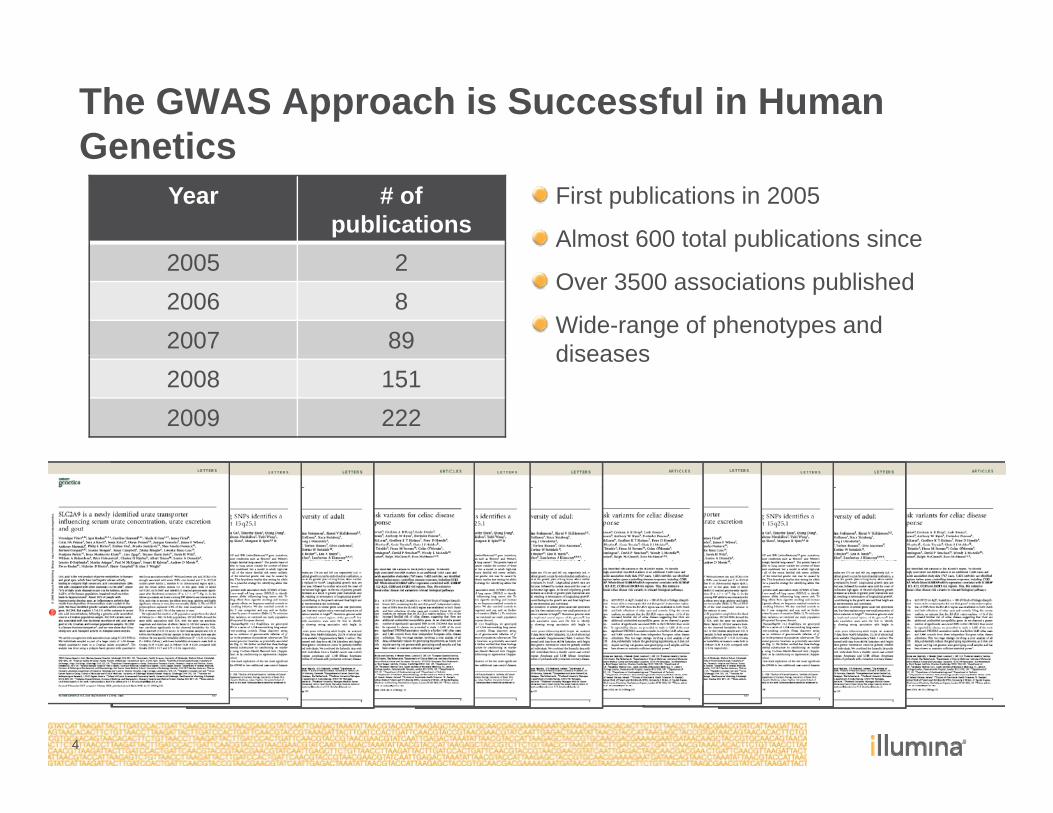
The GWAS Approach is Successful in Human GeneticsGenetics
Year # of publications
First publications in 2005
Almost 600 total publications since2005 22006 82007 89
Over 3500 associations published
Wide-range of phenotypes and diseases
2008 1512009 222
diseases
4
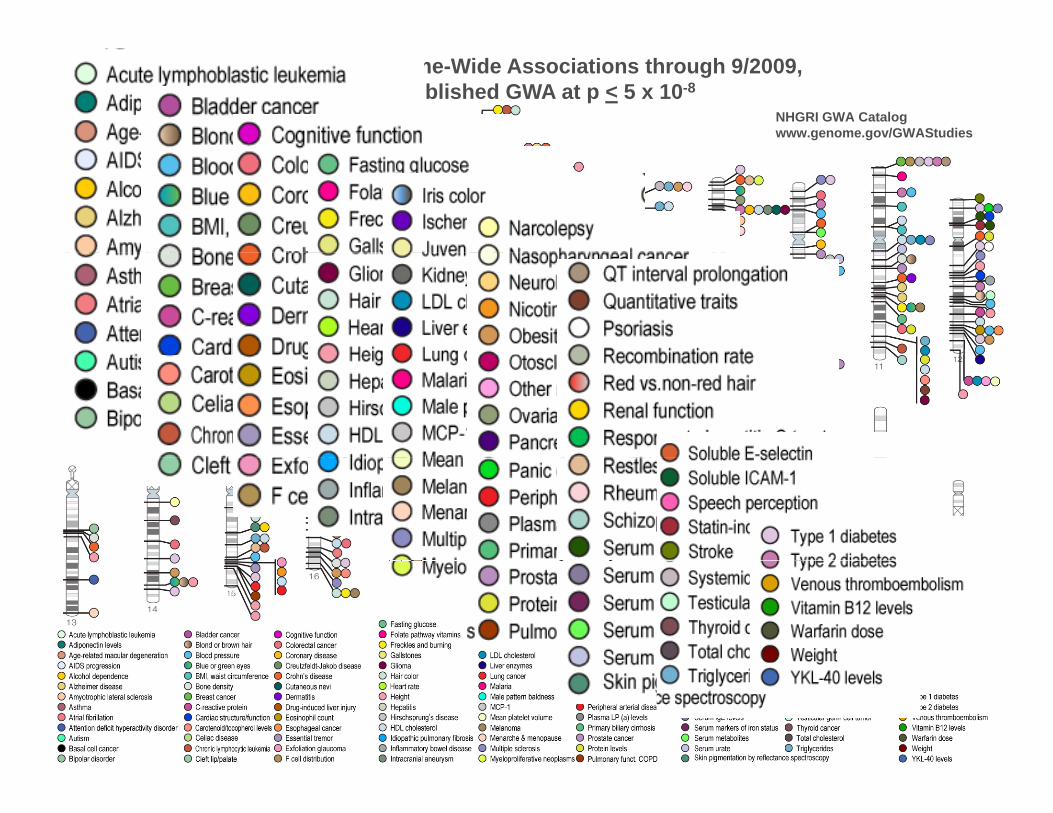
Published Genome-Wide Associations through 9/2009, 536 published GWA at p < 5 x 10⁻⁸
NHGRI GWA Catalogwww.genome.gov/GWAStudies
5
For most common diseases the sum of individual effects found so far
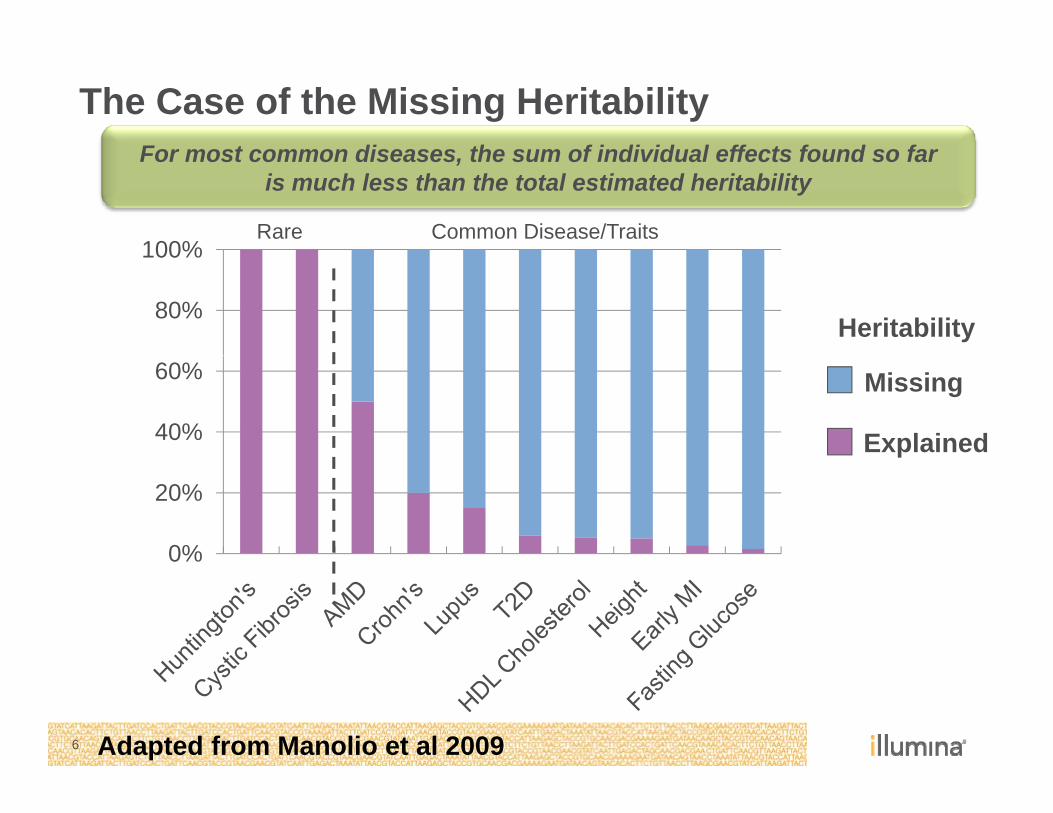
The Case of the Missing Heritability
100%Rare Common Disease/Traits
For most common diseases, the sum of individual effects found so faris much less than the total estimated heritability
80%
100%
Heritability
40%
60% Missing
Explained
0%
20%
0%
6 Adapted from Manolio et al 2009
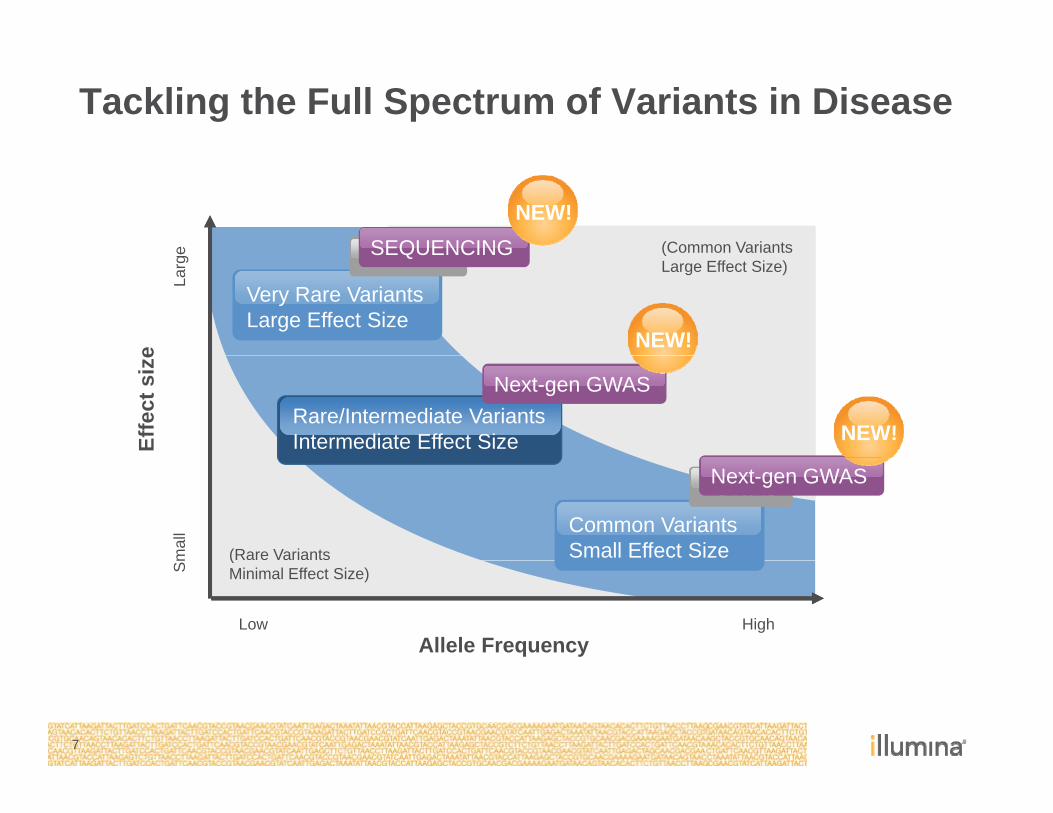
Tackling the Full Spectrum of Variants in Disease
e LINKAGESEQUENCINGNEW!
(Common Variants
eLa
rge
Very Rare VariantsLarge Effect Size
LINKAGESEQUENCING
NEW!
(Large Effect Size)
Effe
ct s
ize
Rare/Intermediate VariantsIntermediate Effect Size
Next-gen GWAS
NEW!
mal
l Common VariantsSmall Effect Size
GWAS
(Rare Variants
Next-gen GWAS
Sm
Allele FrequencyLow High
(Minimal Effect Size)
7
Next-gen Sequencing and the 1kGPNext-gen Sequencing and the 1kGP Revolutiona new era beyond the HapMap Projecta new era beyond the HapMap Project
8
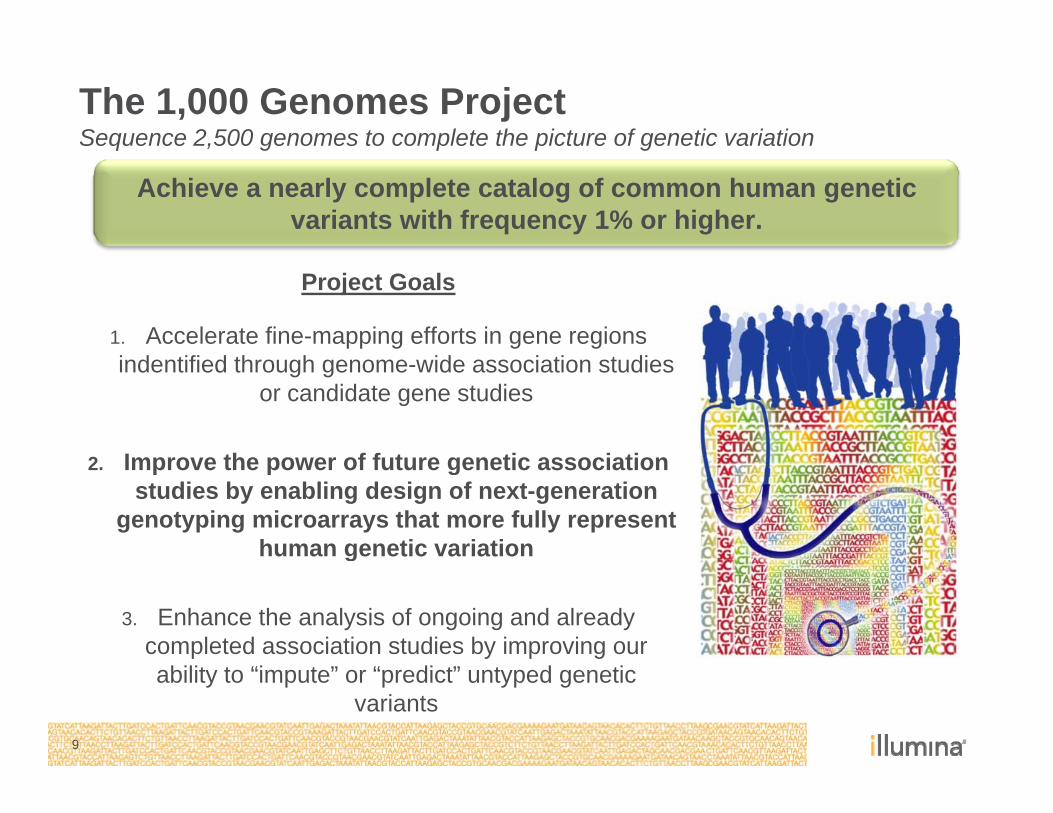
The 1,000 Genomes ProjectSequence 2,500 genomes to complete the picture of genetic variationq g p p g
Achieve a nearly complete catalog of common human genetic variants with frequency 1% or higher.
Project Goals
1. Accelerate fine-mapping efforts in gene regions i d ifi d h h id i i diindentified through genome-wide association studies
or candidate gene studies
2 Improve the power of future genetic association2. Improve the power of future genetic association studies by enabling design of next-generation
genotyping microarrays that more fully represent human genetic variationg
3. Enhance the analysis of ongoing and already completed association studies by improving our
9
ability to “impute” or “predict” untyped genetic variants
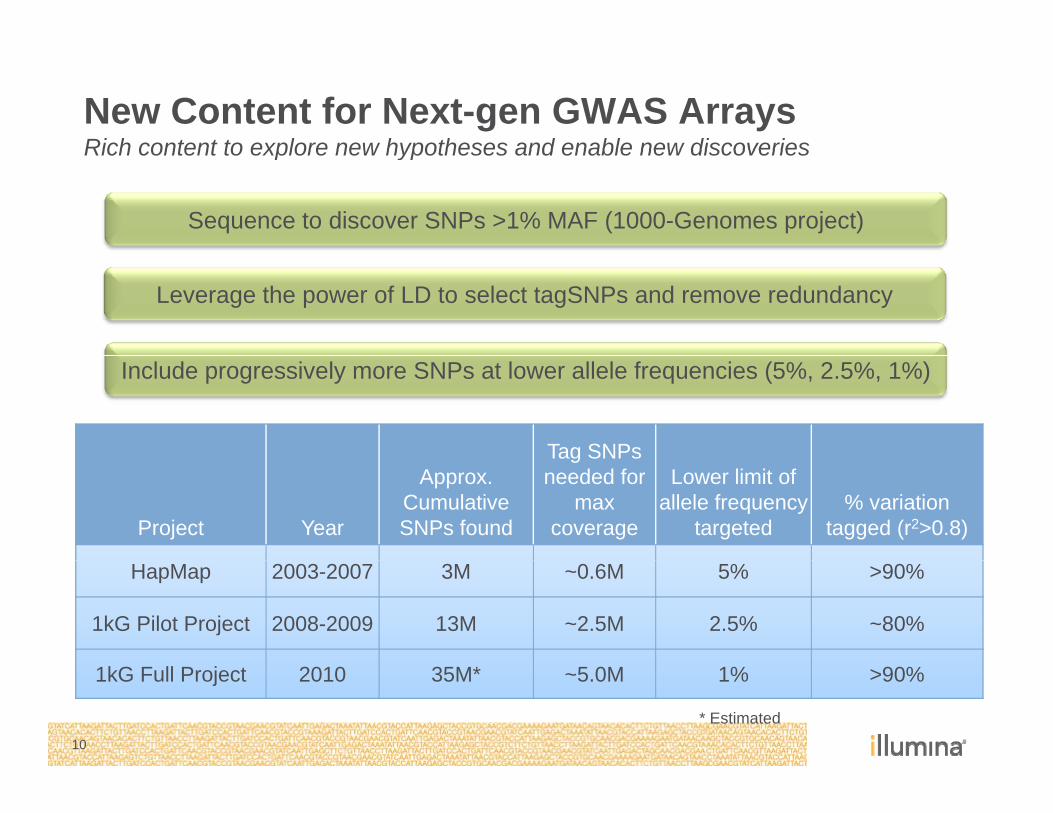
New Content for Next-gen GWAS ArraysRich content to explore new hypotheses and enable new discoveriesRich content to explore new hypotheses and enable new discoveries
Sequence to discover SNPs >1% MAF (1000-Genomes project)
Leverage the power of LD to select tagSNPs and remove redundancy
Tag SNPs
Include progressively more SNPs at lower allele frequencies (5%, 2.5%, 1%)
Project Year
Approx. Cumulative SNPs found
Tag SNPs needed for
max coverage
Lower limit of allele frequency
targeted% variation
tagged (r2>0.8)
HapMap 2003-2007 3M ~0.6M 5% >90%
1kG Pilot Project 2008-2009 13M ~2.5M 2.5% ~80%
10
1kG Full Project 2010 35M* ~5.0M 1% >90%
* Estimated
Illumina’s GWAS RoadmapIllumina s GWAS Roadmap
11
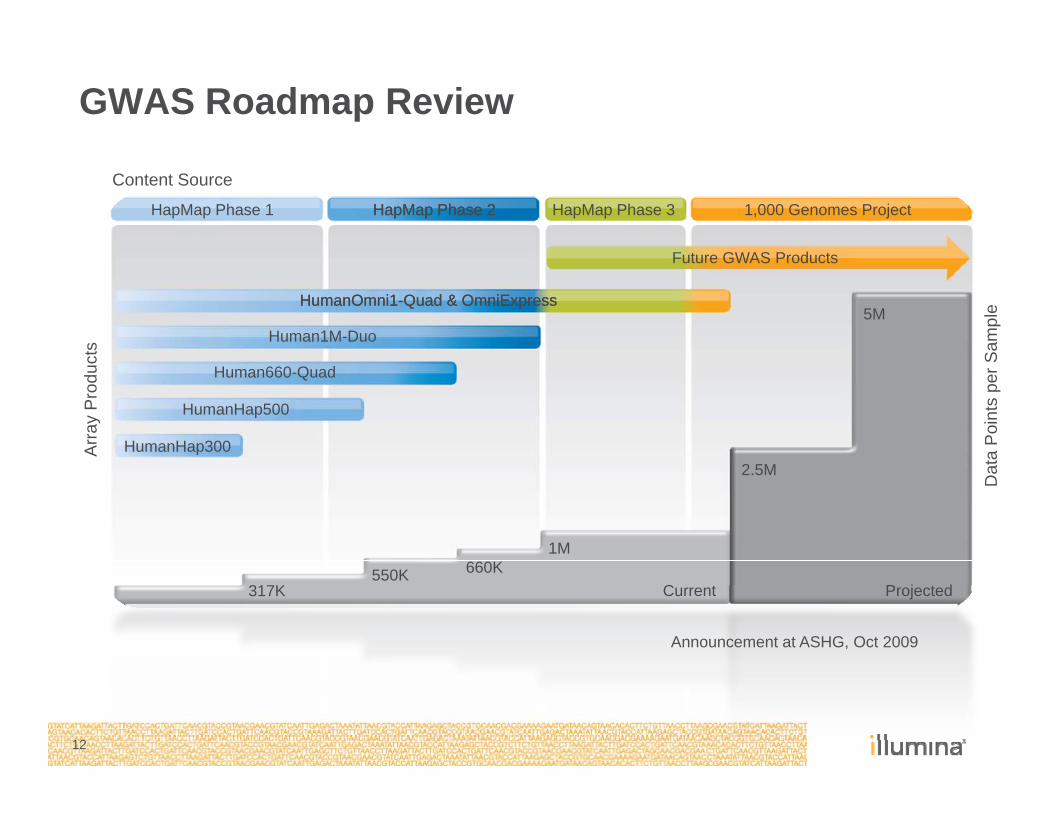
GWAS Roadmap Review
HapMap Phase 1 HapMap Phase 3HapMapHapMap Phase 2Phase 2 1,000 Genomes Project
F t GWAS P d t
Content Source
Future GWAS Products
HumanOmni1HumanOmni1--Quad & Quad & OmniExpressOmniExpress
Human1M-Duo5M
ts Sam
ple
Human660-Quad
HumanHap500
HumanHap300Arr
ay P
rodu
c
a P
oint
s pe
r S
2.5M
1M
Dat
a
660K550K317K Current Projected
Announcement at ASHG, Oct 2009
12
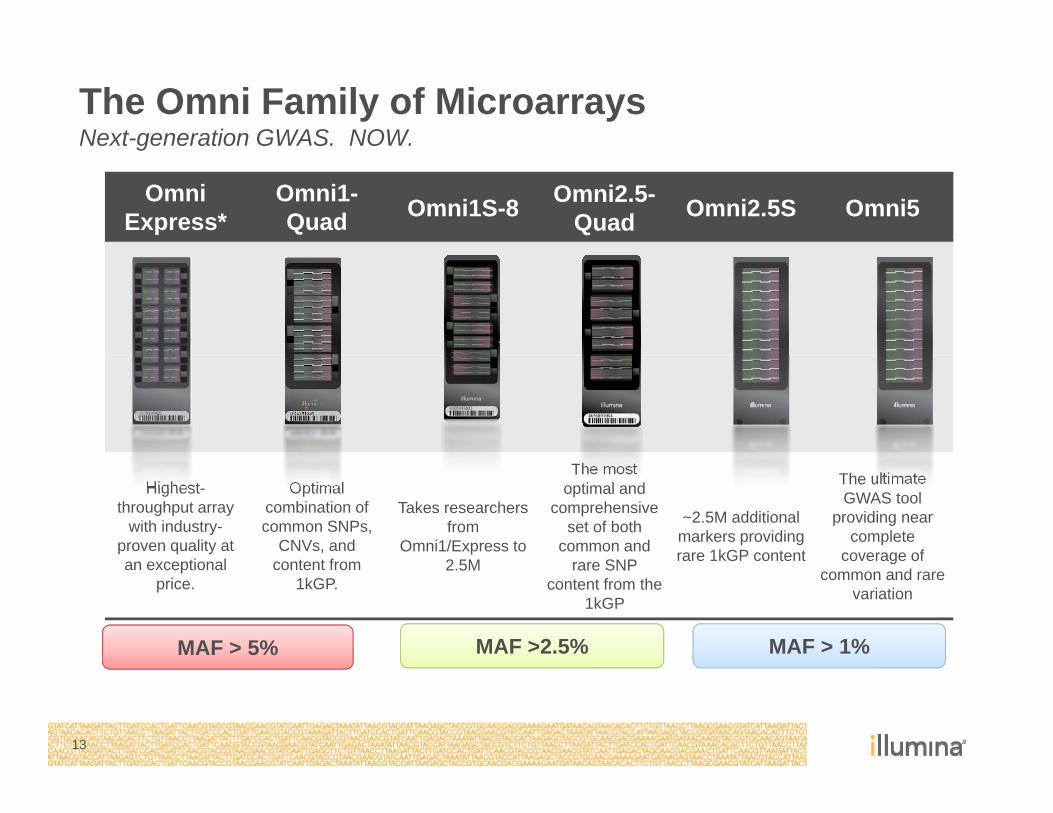
The Omni Family of MicroarraysNext-generation GWAS. NOW. g
Omni Express*
Omni1-Quad Omni1S-8 Omni2.5-
Quad Omni2.5S Omni5
Highest-throughput array
with industry-proven quality at
ti l
Optimal combination of common SNPs,
CNVs, and t t f
Takes researchers from
Omni1/Express to 2 5M
The most optimal and
comprehensive set of both
common and SNP
~2.5M additional markers providing rare 1kGP content
The ultimate GWAS tool
providing near complete
coverage ofan exceptional price.
content from 1kGP.
2.5M rare SNP content from the
1kGP
rare 1kGP content coverage of common and rare
variation
MAF > 5% MAF >2.5% MAF > 1%
13
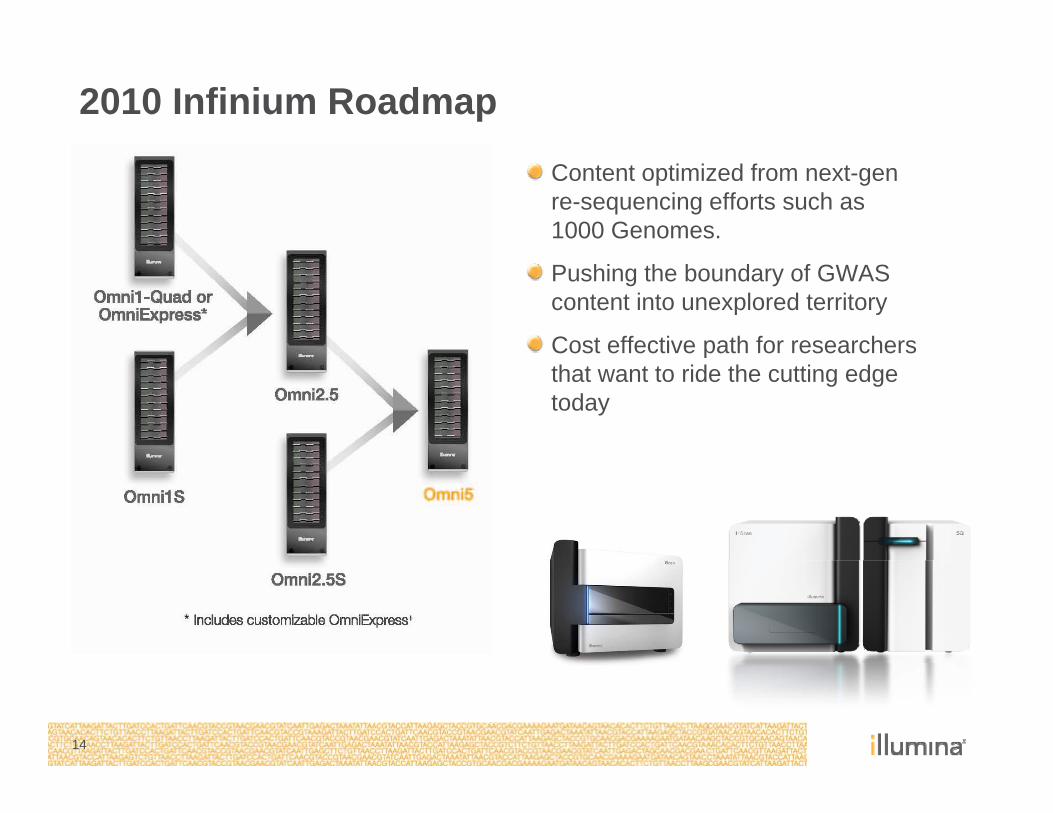
2010 Infinium Roadmap
Content optimized from next-gen re-sequencing efforts such as 1000 Genomes.
Pushing the boundary of GWAS content into unexplored territory
Cost effective path for researchers pthat want to ride the cutting edge today
14
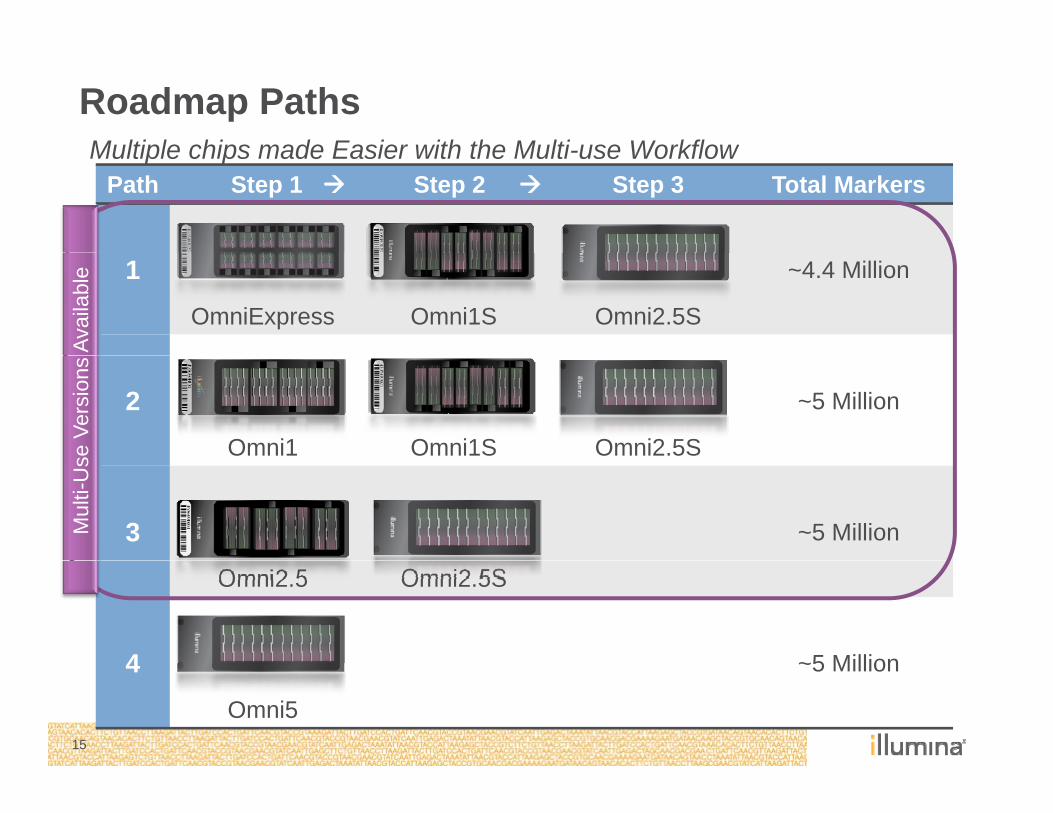
Roadmap PathsMultiple chips made Easier with the Multi use Workflow
Path Step 1 Step 2 Step 3 Total MarkersMultiple chips made Easier with the Multi-use Workflow
1OmniExpress Omni1S Omni2.5S
~4.4 Million
Avai
labl
e
2Omni1 Omni1S Omni2.5S
~5 Million
se V
ersi
ons
3 ~5 MillionMul
ti-U
s
Omni2.5 Omni2.5S
4 ~5 Million
15
4Omni5
~5 Million
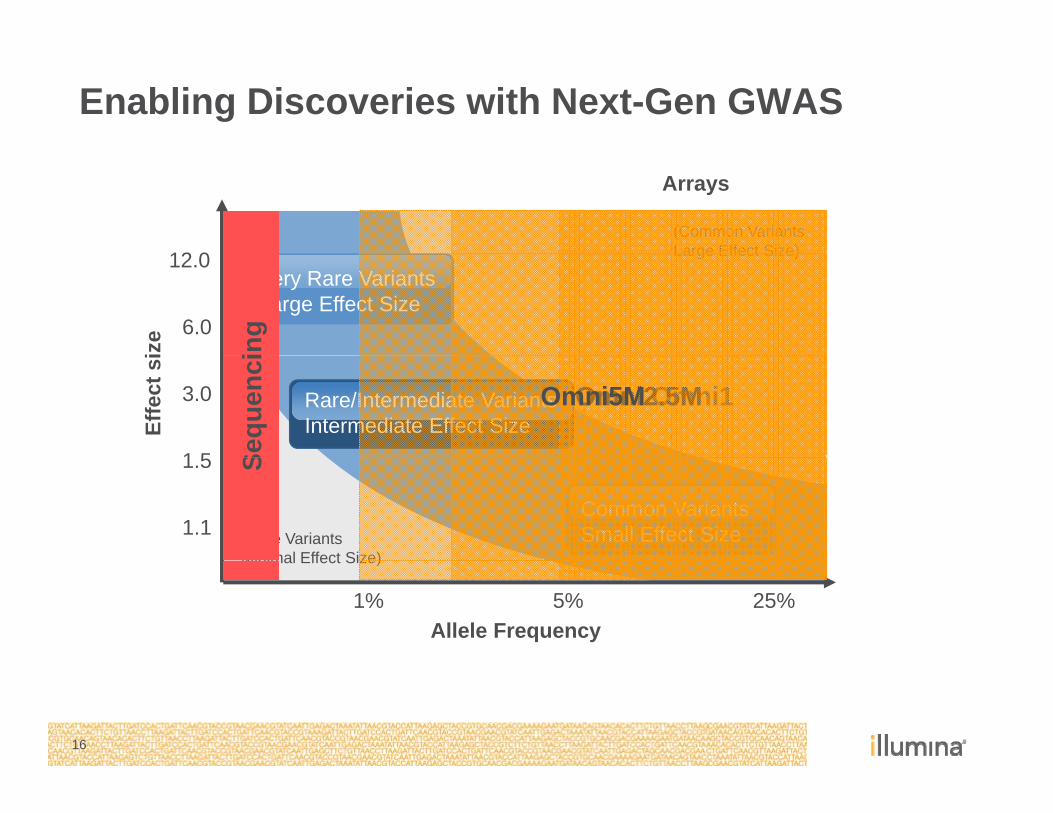
Enabling Discoveries with Next-Gen GWAS
(Common VariantsLarge Effect Size)12 0
Arraysiz
e
Very Rare VariantsLarge Effect Size
Large Effect Size)12.0
6.0
ing
Effe
ct s
i
Rare/Intermediate VariantsIntermediate Effect Size
1 5
3.0
Sequ
enci
Omni1Omni2.5MOmni5M
Common VariantsSmall Effect Size(Rare Variants
Minimal Effect Size)
1.1
1.5 S
Allele Frequency
Minimal Effect Size)
25%1% 5%
16
Omni2 5 DetailsOmni2.5 Details
17
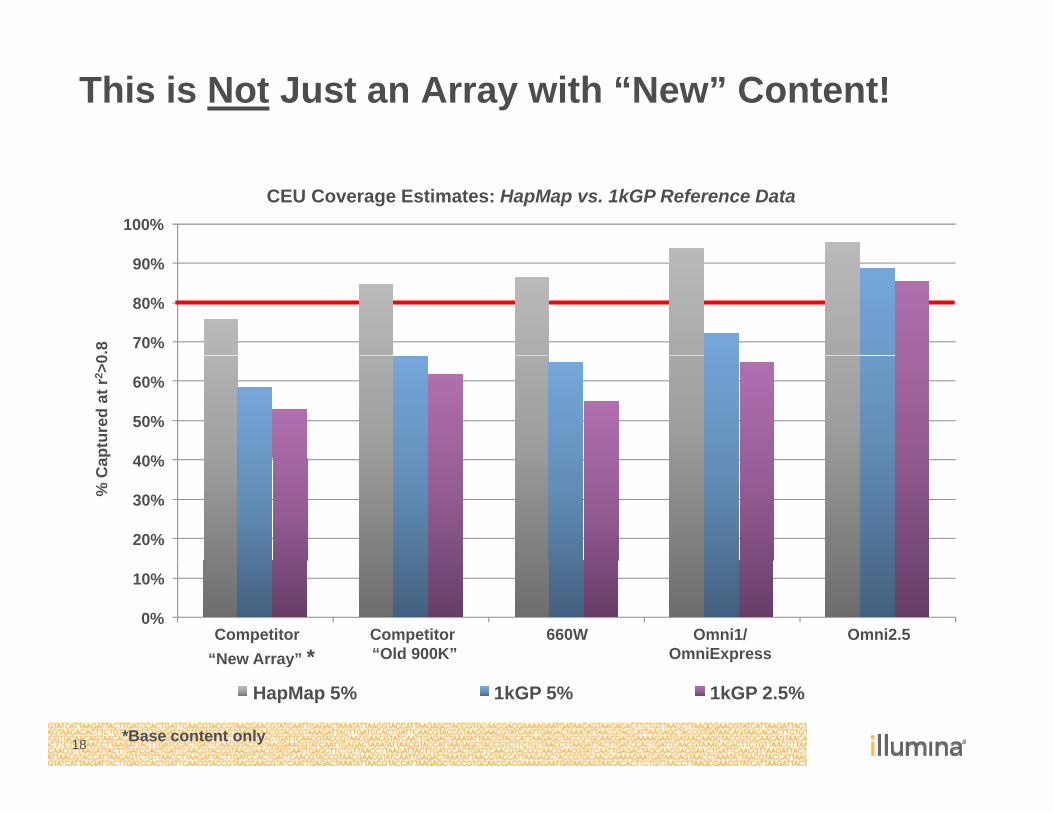
This is Not Just an Array with “New” Content!
100%CEU Coverage Estimates: HapMap vs. 1kGP Reference Data
70%
80%
90%
0.8
40%
50%
60%
ptur
ed a
t r2 >
0
20%
30%
40%
% C
a
0%
10%
Competitor“New Array” *
Competitor “Old 900K”
660W Omni1/OmniExpress
Omni2.5
18
New Array
HapMap 5% 1kGP 5% 1kGP 2.5%
*Base content only
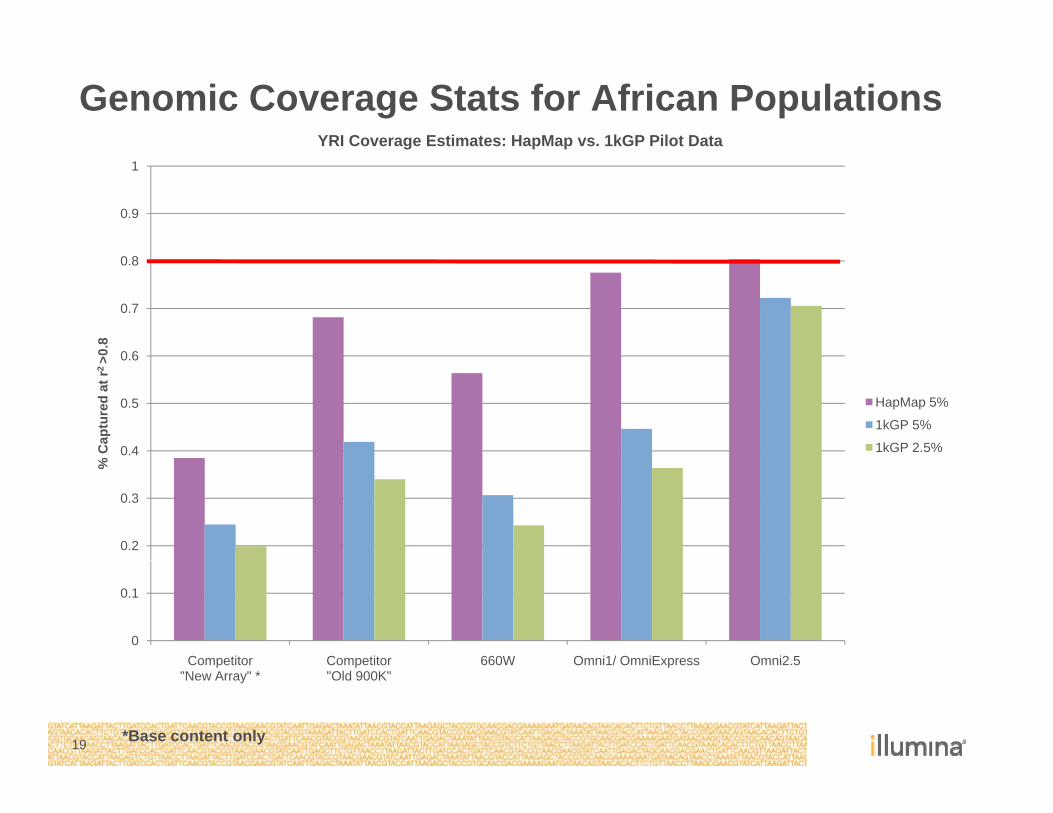
YRI Coverage Estimates: HapMap vs. 1kGP Pilot Data
Genomic Coverage Stats for African Populations
0.9
1
0 6
0.7
0.8
0.8
0.4
0.5
0.6
Cap
ture
d at
r2 >
HapMap 5%
1kGP 5%
1kGP 2.5%
0.2
0.3
%
0
0.1
Competitor Competitor 660W Omni1/ OmniExpress Omni2 5
19
Competitor "New Array" *
Competitor "Old 900K"
660W Omni1/ OmniExpress Omni2.5
*Base content only
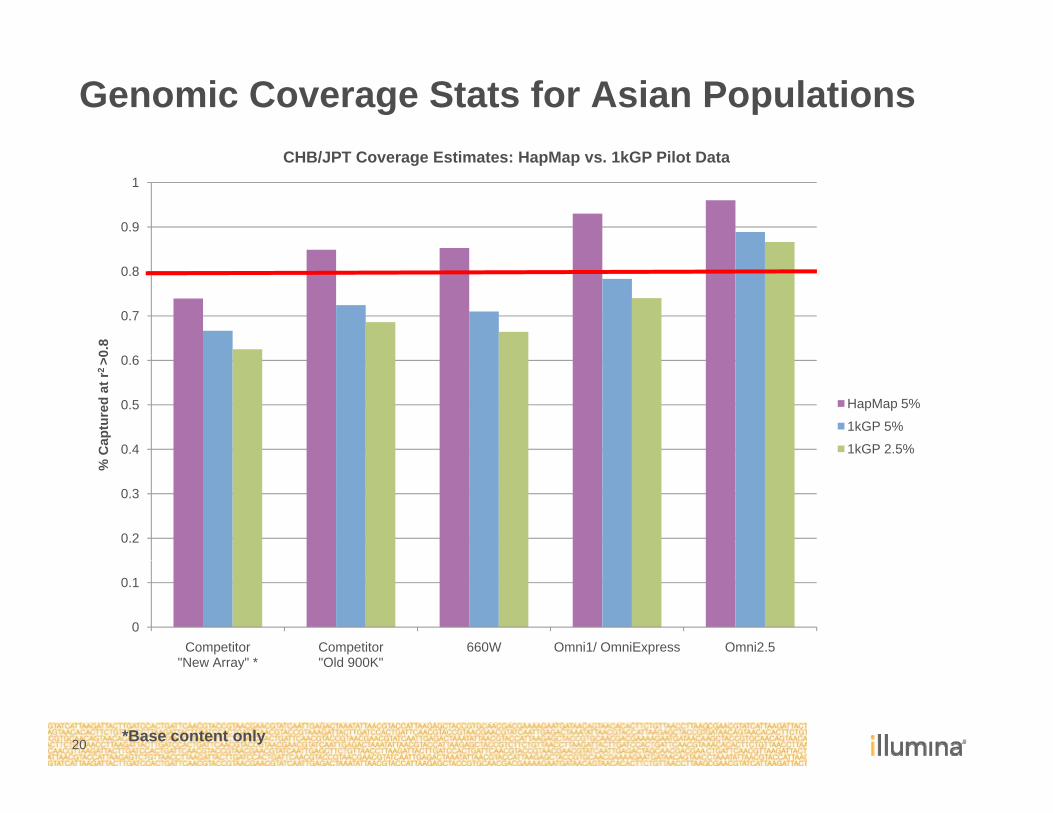
Genomic Coverage Stats for Asian Populations
0.9
1
CHB/JPT Coverage Estimates: HapMap vs. 1kGP Pilot Data
0 6
0.7
0.8
0.8
0.4
0.5
0.6
Cap
ture
d at
r2 >
0
HapMap 5%
1kGP 5%
1kGP 2.5%
0.2
0.3
%
0
0.1
Competitor "New Array" *
Competitor "Old 900K"
660W Omni1/ OmniExpress Omni2.5
20
New Array Old 900K
*Base content only
SummaryFirst-generation GWAS has provided a foundation for beginning to understand the genetic architecture of many diseases and traits.
However, first-generation GWAS was limited by the extent of knowledge about the spectrum of variation in humans in the HapMap era.
NGS re-sequencing efforts, such as 1kGP, are providing a much more comprehensive catalog of common variation (>1% MAF) in diversecomprehensive catalog of common variation (>1% MAF) in diverse populations
Next-gen GWAS tools are leveraging this expanded catalog of variation to drive a new wave of genetic discovery by enabling exploration of the rare-variant hypothesis and higher resolution CNV research in a cost-
21
effective tools.
Thank You!Thank You!
22
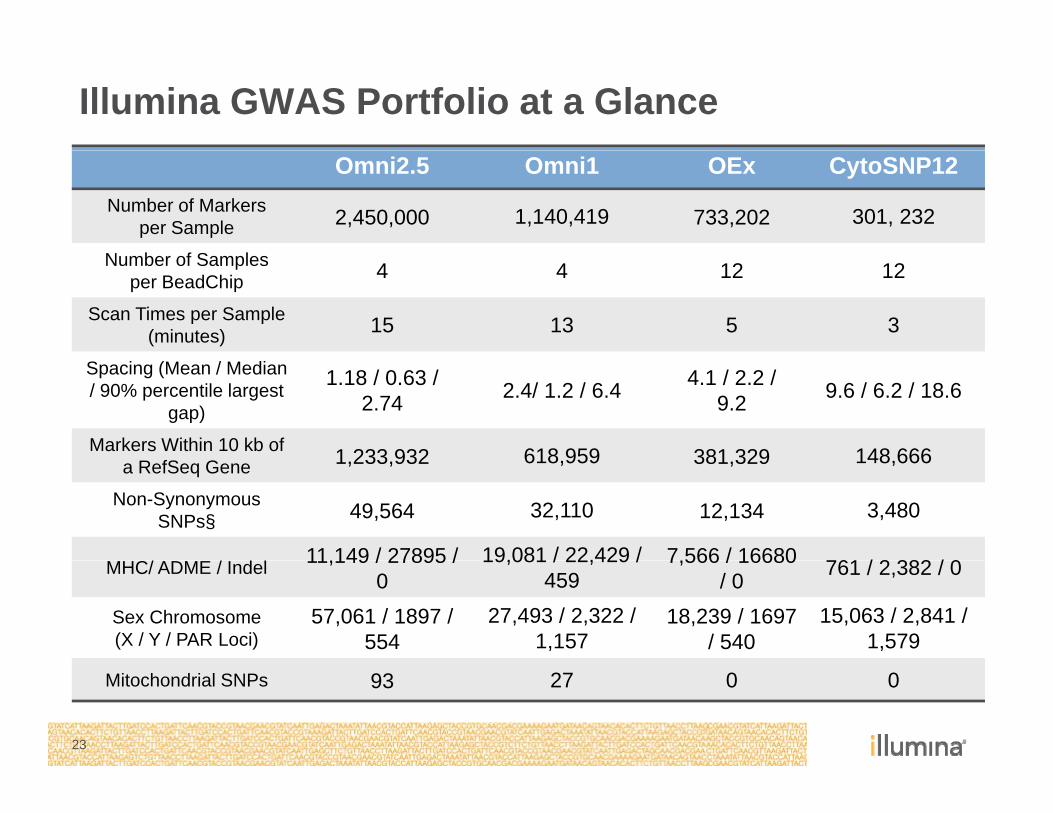
Illumina GWAS Portfolio at a GlanceOmni2.5 Omni1 OEx CytoSNP12
Number of Markersper Sample 2,450,000 1,140,419 733,202 301, 232
N b f S lNumber of Samplesper BeadChip 4 4 12 12
Scan Times per Sample(minutes) 15 13 5 3
Spacing (Mean / Median / 90% percentile largest
gap)
1.18 / 0.63 / 2.74 2.4/ 1.2 / 6.4 4.1 / 2.2 /
9.2 9.6 / 6.2 / 18.6
Markers Within 10 kb of 1 233 932 618 959 381 329 148 666a RefSeq Gene 1,233,932 618,959 381,329 148,666
Non-Synonymous SNPs§ 49,564 32,110 12,134 3,480
C/ / 11 149 / 27895 / 19,081 / 22,429 / 7 566 / 16680 761 / 2 382 / 0MHC/ ADME / Indel 11,149 / 27895 / 0
19,081 / 22,429 / 459
7,566 / 16680 / 0 761 / 2,382 / 0
Sex Chromosome(X / Y / PAR Loci)
57,061 / 1897 / 554
27,493 / 2,322 / 1,157
18,239 / 1697 / 540
15,063 / 2,841 / 1,579
23
Mitochondrial SNPs 93 27 0 0