Illinois Voters Age 50+ and the 2014 Election – AARP · Attitudes among Likely Illinois Voters...
31
Illinois Voters Age 50+ and the 2014 Election Key Findings from a Survey among Likely Voters Age 50/over Conducted June 2014 for
Transcript of Illinois Voters Age 50+ and the 2014 Election – AARP · Attitudes among Likely Illinois Voters...

Illinois Voters Age 50+ and the 2014 Election
Key Findings from a Survey among Likely Voters Age 50/over Conducted June 2014
for

Attitudes among Likely Illinois Voters Age 50+ – July 2014 – Hart/North Star Opinion Research for AARP
Methodology
Statewide telephone survey among 802 likely 2014 voters age 50/over (margin of error ±3.5 percentage points), conducted July 3-10, 2014, including:
• 432 retirees (margin of error ±4.7 percentage points)
• 370 non-retirees (margin of error ±5.1 percentage points)
Respondents were selected at random from a list of registered voters and were reached either on a landline or mobile phone.
2
Attitudes among Likely Illinois Voters Age 50+ – July 2014 – Hart/North Star Opinion Research for AARP
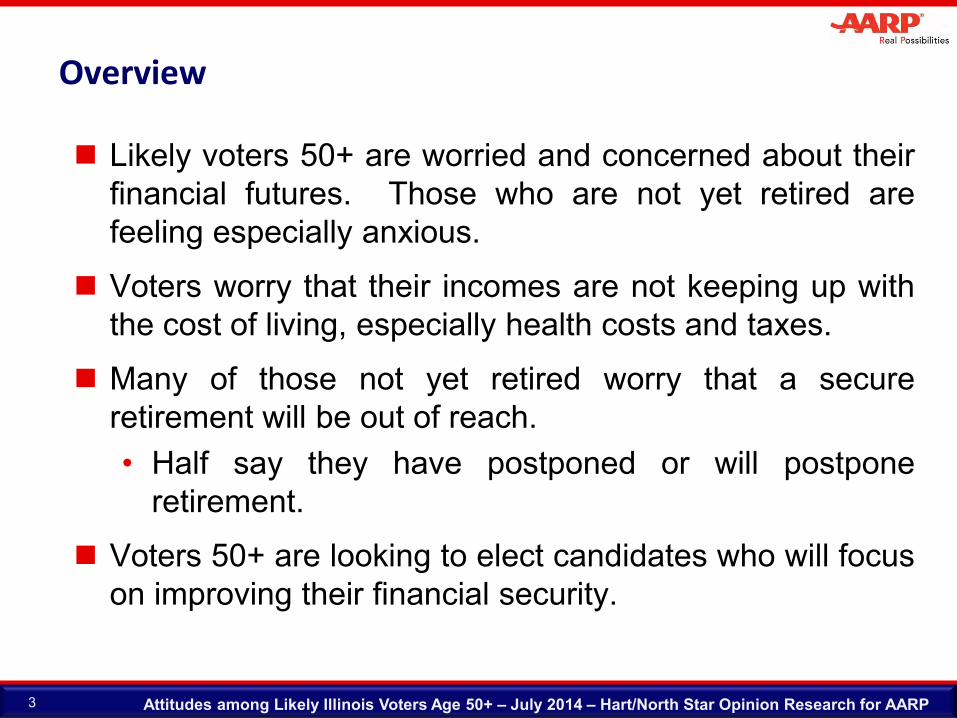
Overview
Likely voters 50+ are worried and concerned about their financial futures. Those who are not yet retired are feeling especially anxious.
Voters worry that their incomes are not keeping up with the cost of living, especially health costs and taxes.
Many of those not yet retired worry that a secure retirement will be out of reach. • Half say they have postponed or will postpone
retirement.
Voters 50+ are looking to elect candidates who will focus on improving their financial security.
3

Attitudes among Likely Illinois Voters Age 50+ – July 2014 – Hart/North Star Opinion Research for AARP
Overview
Challenger Bruce Rauner holds a nine-point lead in the gubernatorial race, with an additional 13% of 50+ voters still undecided.
Voters say it is hard to get good information about the candidates, and they want candidates to tell them more about their plans for key issues like independent living and financial security.
Voters want more support for caregiving so that the elderly and people with disabilities can live independently. The majority of 50+ voters say they either are providing, or have provided, unpaid care, representing an important emerging constituency.
The majority of voters also believe it is important for the next governor to preserve access to affordable landline telephone service.
4

Attitudes among Likely Illinois Voters Age 50+ – July 2014 – Hart/North Star Opinion Research for AARP
Profile of Likely Voters Age 50/over
5
Men Women
Age 50 to 64 Age 65 to 74 Age 75/over
High school grad/less education Some college College graduate
Whites African Americans
Household income under $30K Household income $30 to $50K Household income over $50K
Democrats Independents Republicans
Receive Social Security benefits Health insurance through Medicare Employed (part time or full time)
Non-retirees
47% 53%
88% 9% 2%
23% 32% 45%
81% 12%
15% 11% 57%
38% 21% 41%
17% 16% 82%
Retirees
46% 54%
25% 42% 32%
40% 30% 30%
81% 12%
27% 22% 33%
46% 21% 34%
78% 73% 14%
Gender
Age
Education
Household Income
Party Identification
Other
Race
Attitudes among Likely Illinois Voters Age 50+ – July 2014 – Hart/North Star Opinion Research for AARP
ECONOMIC SECURITY
6
Attitudes among Likely Illinois Voters Age 50+ – July 2014 – Hart/North Star Opinion Research for AARP
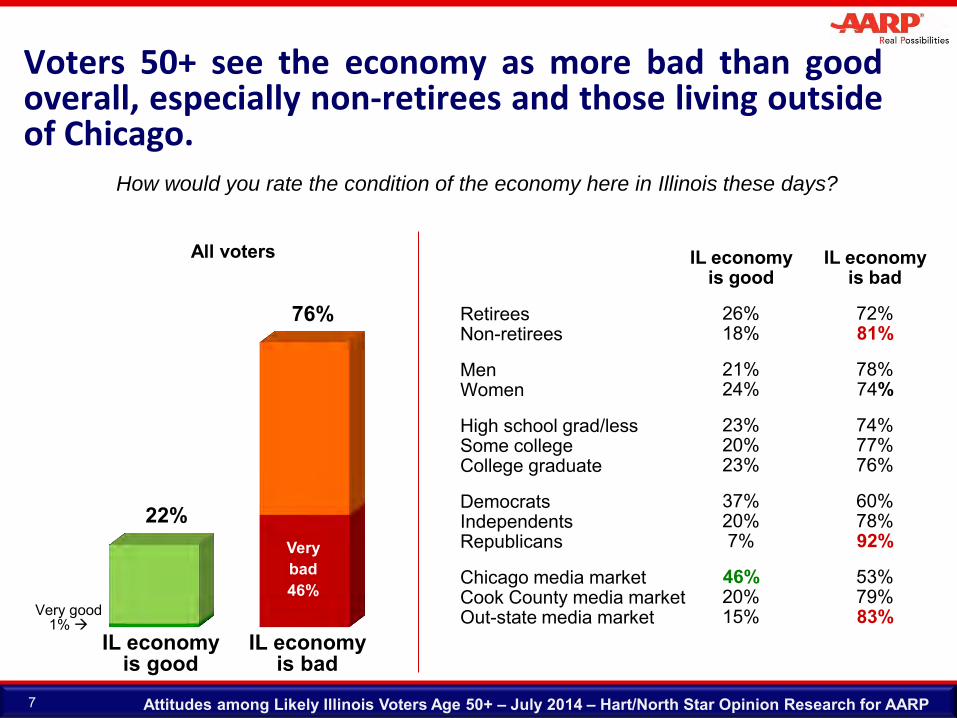
Voters 50+ see the economy as more bad than good overall, especially non-retirees and those living outside of Chicago.
7
How would you rate the condition of the economy here in Illinois these days?
IL economy is good
IL economy is bad
Very good 1%
22% Very bad 46%
76%
All voters IL economy is good
26% 18%
21% 24%
23% 20% 23%
37% 20% 7%
46% 20% 15%
IL economy is bad
72% 81%
78% 74%
74% 77% 76%
60% 78% 92%
53% 79% 83%
Retirees Non-retirees
Men Women
High school grad/less Some college College graduate
Democrats Independents Republicans
Chicago media market Cook County media market Out-state media market

Attitudes among Likely Illinois Voters Age 50+ – July 2014 – Hart/North Star Opinion Research for AARP
30% 21%
10% 15%
Strongly satisfied Somewhat satisfiedStrongly dissatisfied Somewhat dissatisfied
A third of non-retired voters are dissatisfied with their financial situation.
8
Satisfaction with Own Financial Situation Today
64%
35%
Dissatisfied (non-retirees)
33% 36%
34% 35%
52% 20%
Men Women
Age 50 to 59 Age 60/over
Income under $75K Income over $75K
Retirees Non-retirees
78%
20%

Attitudes among Likely Illinois Voters Age 50+ – July 2014 – Hart/North Star Opinion Research for AARP
28%
5%
A large majority say that their income is falling behind the cost of living.
9
Assessment of Income vs. Cost of Living
All voters
My income is staying about even with cost
of living
My income is going up faster
than cost of living
MY INCOME IS FALLING
BEHIND THE COST OF
LIVING 65%
65% 65%
73% 70% 54%
80% 76% 52%
Retirees Non-retirees
High school grad/less Some college College graduates
Income under $30K Income $30K to $50K Income over $50K
Income Is Falling Behind
Attitudes among Likely Illinois Voters Age 50+ – July 2014 – Hart/North Star Opinion Research for AARP
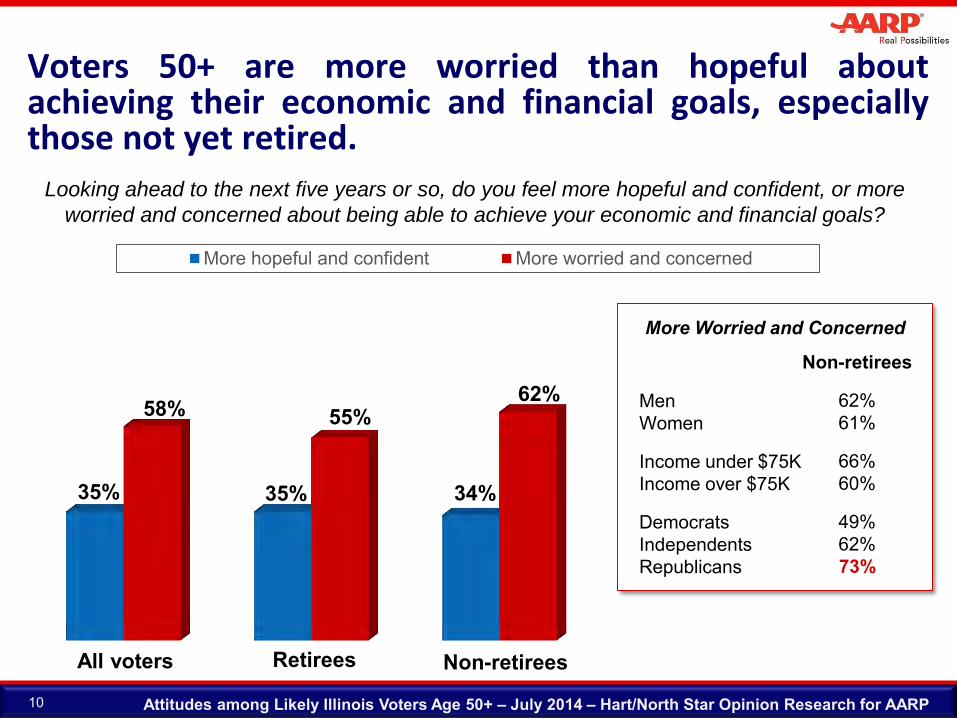
35% 35% 34%
58% 55% 62%
More hopeful and confident More worried and concerned
Voters 50+ are more worried than hopeful about achieving their economic and financial goals, especially those not yet retired.
10
Looking ahead to the next five years or so, do you feel more hopeful and confident, or more
worried and concerned about being able to achieve your economic and financial goals?
All voters Retirees Non-retirees
Non-retirees
62% 61%
66% 60%
49% 62% 73%
Men Women
Income under $75K Income over $75K
Democrats Independents Republicans
More Worried and Concerned

Attitudes among Likely Illinois Voters Age 50+ – July 2014 – Hart/North Star Opinion Research for AARP
The Economic Anxiety Index
Voters are assigned 20 points for each of five economic concerns about which they say they worry very or somewhat often. A minimum score of 0 reflects no economic anxiety, while a maximum score of 100 indicates a great deal of economic anxiety.
The five component concerns of the anxiety index are:
• Having to pay too much in taxes
• Income not keeping up with the cost of living
• Having health expenses they cannot afford
• Not having financial security in retirement
• Not having enough to pay for home care or a nursing home when they or their spouse get older
11

Attitudes among Likely Illinois Voters Age 50+ – July 2014 – Hart/North Star Opinion Research for AARP
Components of the Economic Anxiety Index
12
46%
47%
50%
56%
64%
Proportions Who Say They Worry Very or Somewhat Often
about Each Economic Concern
Having to pay too much in taxes
Income not keeping up with cost of living
Not having financial security in retirement
Not having enough to pay for home care or
nursing home for myself or my spouse
Having health expenses I cannot
afford
Retirees
59%
51%
44%
45%
44%
Non- retirees
70%
60%
57%
49%
49%

Attitudes among Likely Illinois Voters Age 50+ – July 2014 – Hart/North Star Opinion Research for AARP
0
10
20
30
40
50
60
70
80
90
100
49
57
Economic Anxiety Index Scores
13
Maximum score
Minimum score
ANXI
ETY
IND
EX
Retirees Non-retirees
55 59
59 57
61 53
63 51
52 58 62
63 49
Men Women
Unmarried Married
Non-college grads College graduates
Income under $75K Income over $75K
Democrats Independents Republicans
Caregiver/past caregiver Non-caregivers
Key Subgroups of Non-retirees
Mean scores

Attitudes among Likely Illinois Voters Age 50+ – July 2014 – Hart/North Star Opinion Research for AARP
While most retirees are satisfied with their retirement savings, almost half of non-retirees are dissatisfied.
22% 25% 17% 22% 18%
27%
Strongly satisfied Somewhat satisfiedStrongly dissatisfied Somewhat dissatisfied
14
Satisfaction with Amount of Money Saving/Saved for Retirement
All voters
60%
36%
Retirees
64%
31%
Non-retirees
55%
42%
Dissatisfied (non-retirees)
39% 45%
61% 27%
Men Women
Income under $75K Income over $75K

Attitudes among Likely Illinois Voters Age 50+ – July 2014 – Hart/North Star Opinion Research for AARP
A majority of non-retirees say they have or will delay their retirement for financial reasons.
61% 59% 64% 62% 60% 63% 59%
15
Proportions Saying They Have Delayed or Expect to Delay Retirement in Order to
Save More Money to Live Comfortably in Retirement
Married Unmarried Age 50 to 59
Age 60/over
Income under $75K
All non- retirees
Income over $75K

Attitudes among Likely Illinois Voters Age 50+ – July 2014 – Hart/North Star Opinion Research for AARP
Other Financial Concerns of Non-Retirees
49%
49%
49%
57%
60%
70%
16
Proportions Who Say They Worry Very or Somewhat Often about Each
Having to pay too much in taxes
My income not keeping up with the cost of living
Not having financial security in retirement
Not making enough money at my job
Not having enough to pay for home care or nursing
home for myself or my spouse
Having health expenses I cannot afford
* Asked only of voters who are employed
All non-retirees

Attitudes among Likely Illinois Voters Age 50+ – July 2014 – Hart/North Star Opinion Research for AARP
THE 2014 ELECTION
17
Attitudes among Likely Illinois Voters Age 50+ – July 2014 – Hart/North Star Opinion Research for AARP
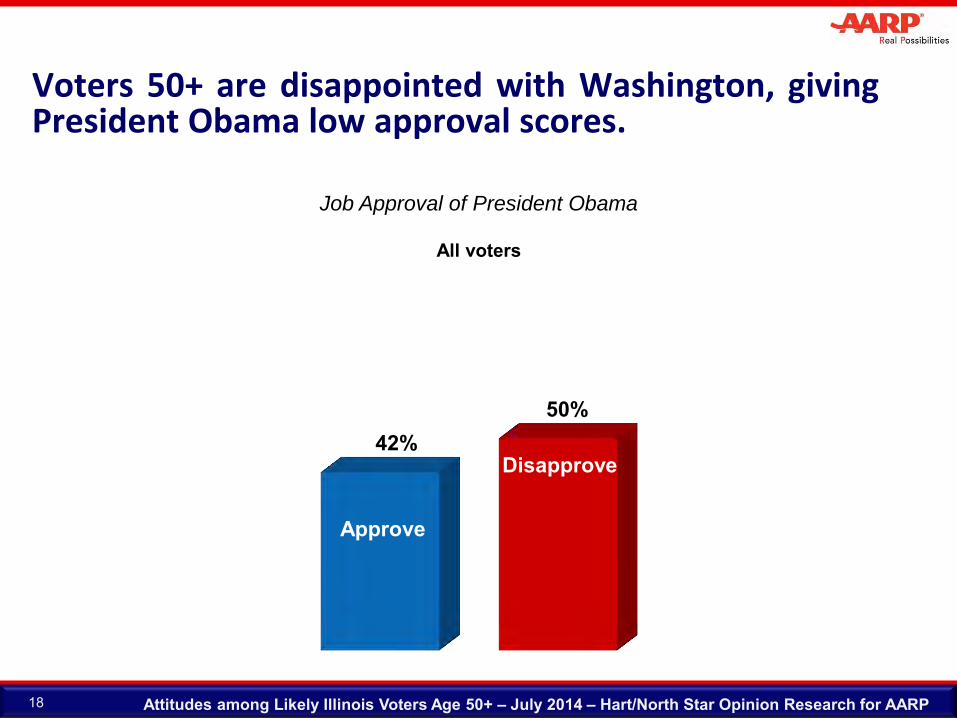
Voters 50+ are disappointed with Washington, giving President Obama low approval scores.
42% 50%
18
Job Approval of President Obama
Approve
Disapprove
All voters

Attitudes among Likely Illinois Voters Age 50+ – July 2014 – Hart/North Star Opinion Research for AARP
In the gubernatorial election, Bruce Rauner holds the lead with voters 50+, but a large minority remain unsure about their vote.
19
Trial Heat for Illinois Governor
Undecided Pat Quinn
13%
Bruce Rauner
Definitely vote for
21%
Definitely vote for
30%
Pat Quinn
35% 42%
55% 35%
39% 37% 45%
33% 74%
77% 27% 3%
48%
39%
All voters Men Women
Unmarried women Married women
Age 50 to 64 Age 65 to 74 Age 75/over
Whites African Americans
Democrats Independents Republicans
Bruce Rauner
54% 42%
30% 49%
49% 50% 42%
55% 13%
12% 50% 87%

Attitudes among Likely Illinois Voters Age 50+ – July 2014 – Hart/North Star Opinion Research for AARP
Nearly half of voters say it is hard to find objective and reliable information about the record and positions of candidates running for office this November.
19% 12%
22% 28%
Very easy Somewhat easyVery hard Somewhat hard
20
Is it easy or hard to find objective and reliable information about the record and
positions of candidates running for office this November?
All voters
46% 46%
Undecided in Gubernatorial Race
34%
56%
Attitudes among Likely Illinois Voters Age 50+ – July 2014 – Hart/North Star Opinion Research for AARP
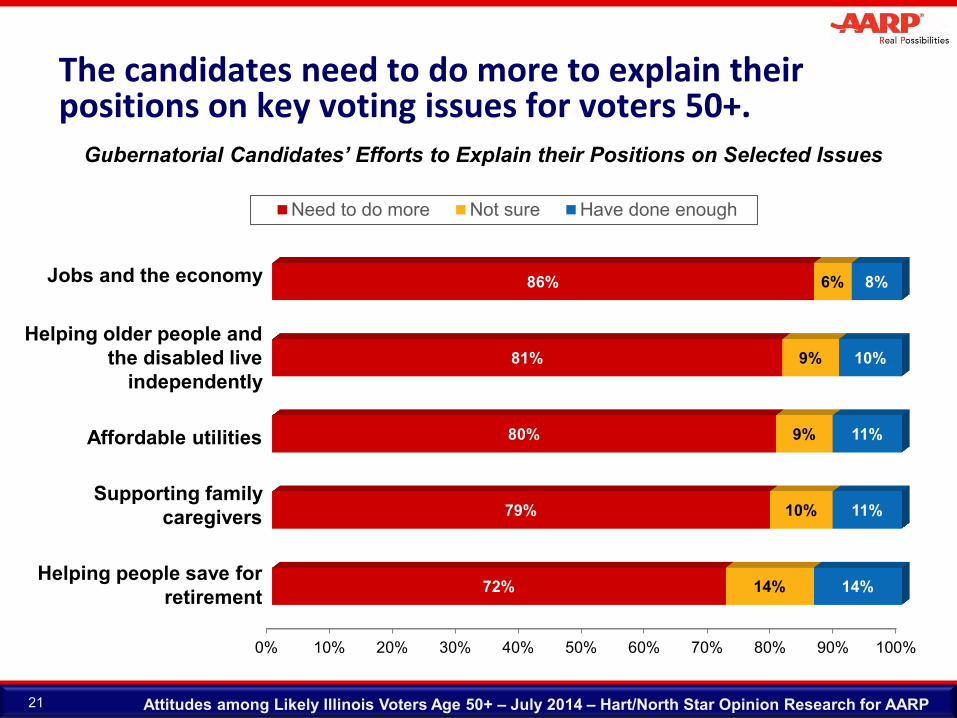
The candidates need to do more to explain their positions on key voting issues for voters 50+.
0% 10% 20% 30% 40% 50% 60% 70% 80% 90% 100%
72%
79%
80%
81%
86%
14%
10%
9%
9%
6%
14%
11%
11%
10%
8%
Need to do more Not sure Have done enough
21
Gubernatorial Candidates’ Efforts to Explain their Positions on Selected Issues
Jobs and the economy
Helping older people and the disabled live
independently
Affordable utilities
Supporting family caregivers
Helping people save for retirement
Attitudes among Likely Illinois Voters Age 50+ – July 2014 – Hart/North Star Opinion Research for AARP
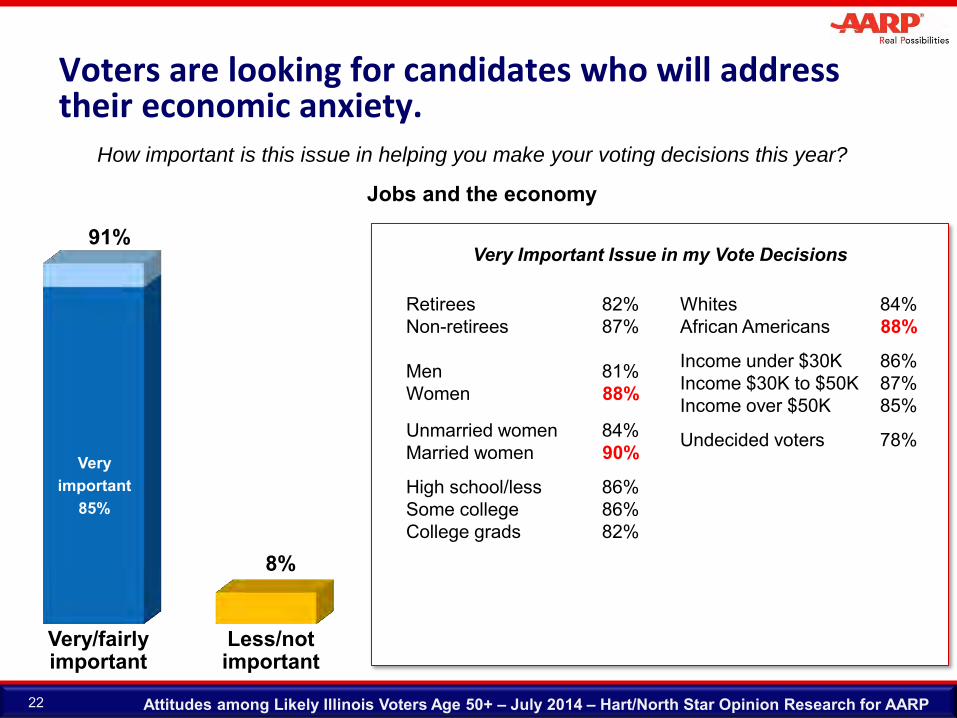
Voters are looking for candidates who will address their economic anxiety.
8%
22
How important is this issue in helping you make your voting decisions this year?
Very/fairly important
Less/not important
Very important
85%
91%
Jobs and the economy
Very Important Issue in my Vote Decisions
Retirees Non-retirees Men Women
Unmarried women Married women
High school/less Some college College grads
82% 87%
81% 88%
84% 90%
86% 86% 82%
Whites African Americans
Income under $30K Income $30K to $50K Income over $50K
Undecided voters
84% 88%
86% 87% 85%
78%

Attitudes among Likely Illinois Voters Age 50+ – July 2014 – Hart/North Star Opinion Research for AARP
The majority of 50+ voters use landline phone service nearly always or most of the time, and two in three believe the next governor should preserve this access.
33%
23
64% All voters
Men Women
Age 50 to 64 Age 65 to 74 Age 75/over
Income under $30K Income $30K to $50K Income over $50K
Proportions who use landline nearly always or most of the time
48%
42% 54%
38% 53% 71%
59% 57% 36%
How important is it that the next governor preserve access to reliable, affordable landline
service in Illinois?
Very important
50%
Very/fairly important
Less/not important
All voters

Attitudes among Likely Illinois Voters Age 50+ – July 2014 – Hart/North Star Opinion Research for AARP
CAREGIVING
24
Attitudes among Likely Illinois Voters Age 50+ – July 2014 – Hart/North Star Opinion Research for AARP
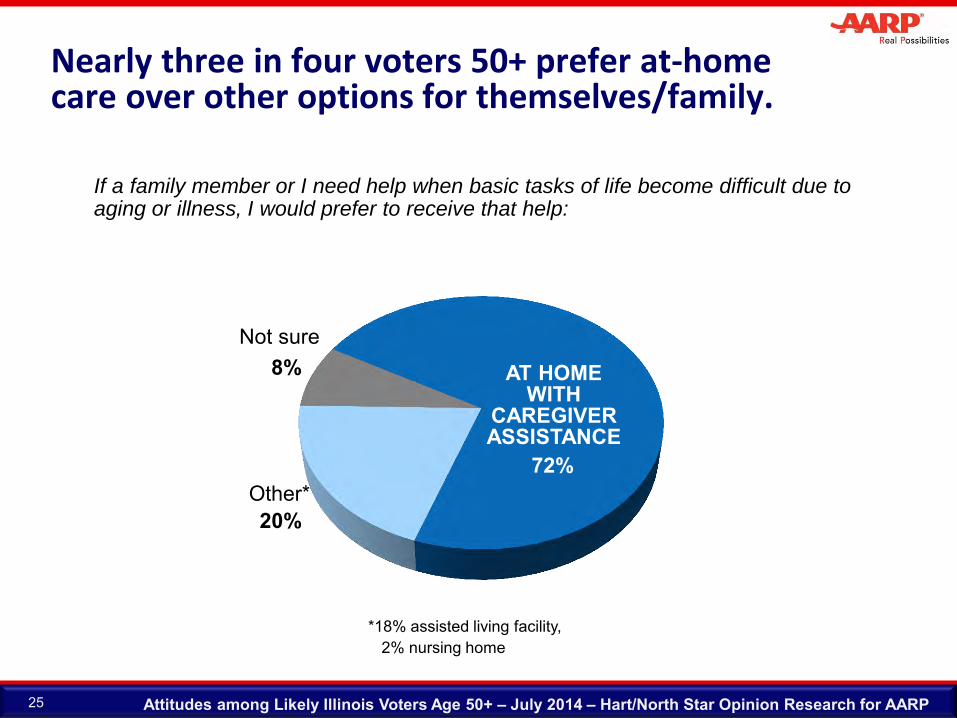
72%
20%
8%
Nearly three in four voters 50+ prefer at-home care over other options for themselves/family.
25
If a family member or I need help when basic tasks of life become difficult due to aging or illness, I would prefer to receive that help:
Other*
AT HOME WITH
CAREGIVER ASSISTANCE
*18% assisted living facility, 2% nursing home
Not sure
Attitudes among Likely Illinois Voters Age 50+ – July 2014 – Hart/North Star Opinion Research for AARP
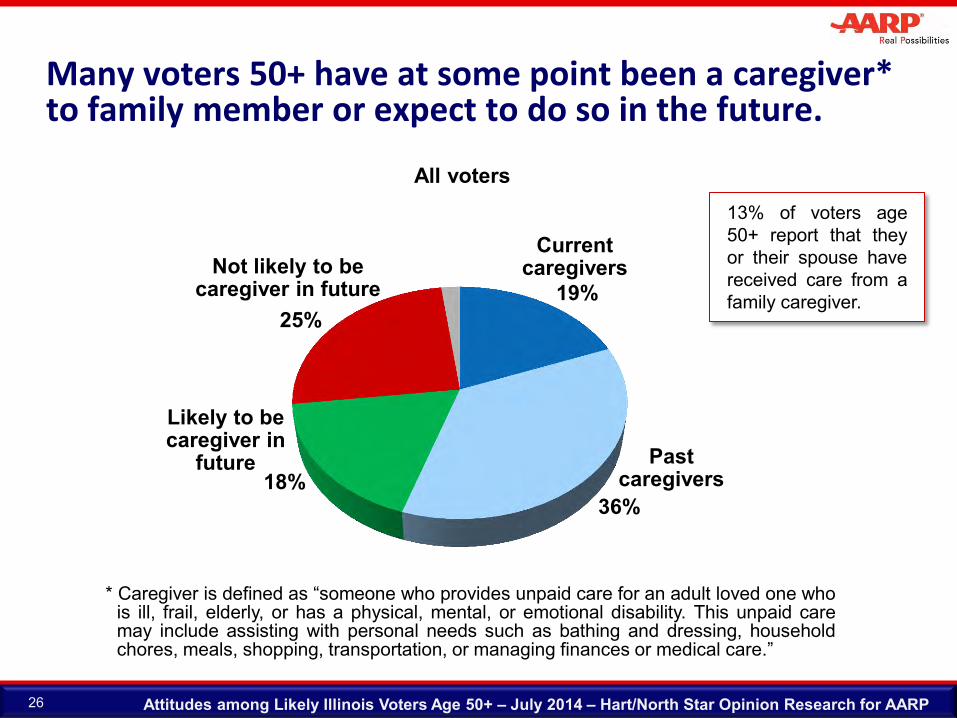
Many voters 50+ have at some point been a caregiver* to family member or expect to do so in the future.
19%
36% 18%
25%
26
Current caregivers
Likely to be caregiver in
future
Not likely to be caregiver in future
All voters
* Caregiver is defined as “someone who provides unpaid care for an adult loved one who is ill, frail, elderly, or has a physical, mental, or emotional disability. This unpaid care may include assisting with personal needs such as bathing and dressing, household chores, meals, shopping, transportation, or managing finances or medical care.”
Past caregivers
13% of voters age 50+ report that they or their spouse have received care from a family caregiver.
Attitudes among Likely Illinois Voters Age 50+ – July 2014 – Hart/North Star Opinion Research for AARP
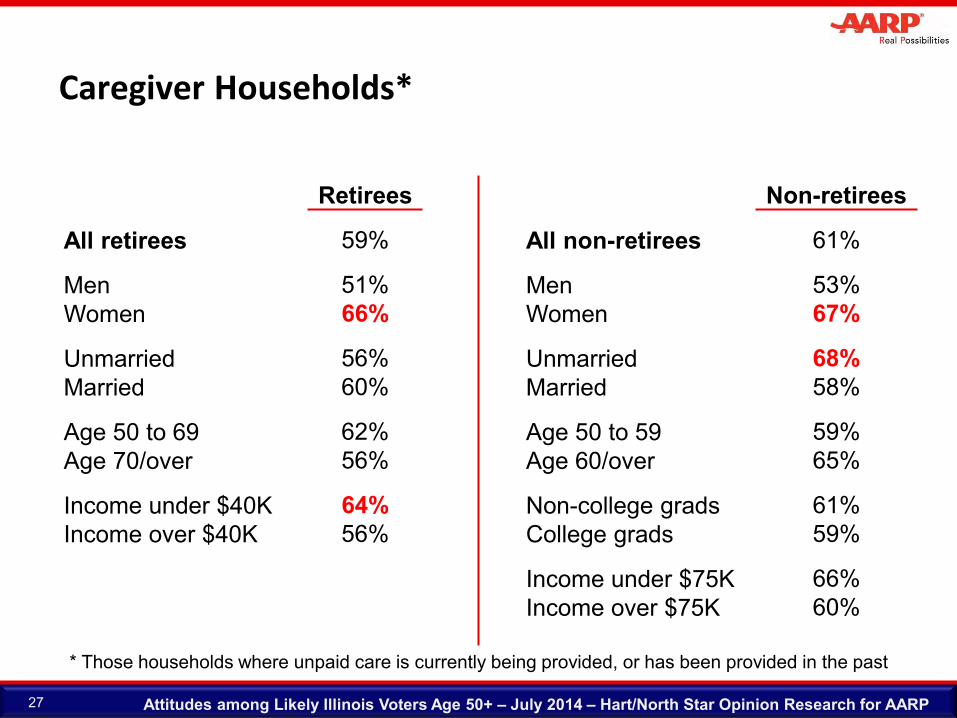
Caregiver Households*
27
All non-retirees
Men Women
Unmarried Married
Age 50 to 59 Age 60/over
Non-college grads College grads
Income under $75K Income over $75K
Non-retirees
61%
53% 67%
68% 58%
59% 65%
61% 59%
66% 60%
All retirees
Men Women
Unmarried Married
Age 50 to 69 Age 70/over
Income under $40K Income over $40K
Retirees
59%
51% 66%
56% 60%
62% 56%
64% 56%
* Those households where unpaid care is currently being provided, or has been provided in the past
Attitudes among Likely Illinois Voters Age 50+ – July 2014 – Hart/North Star Opinion Research for AARP
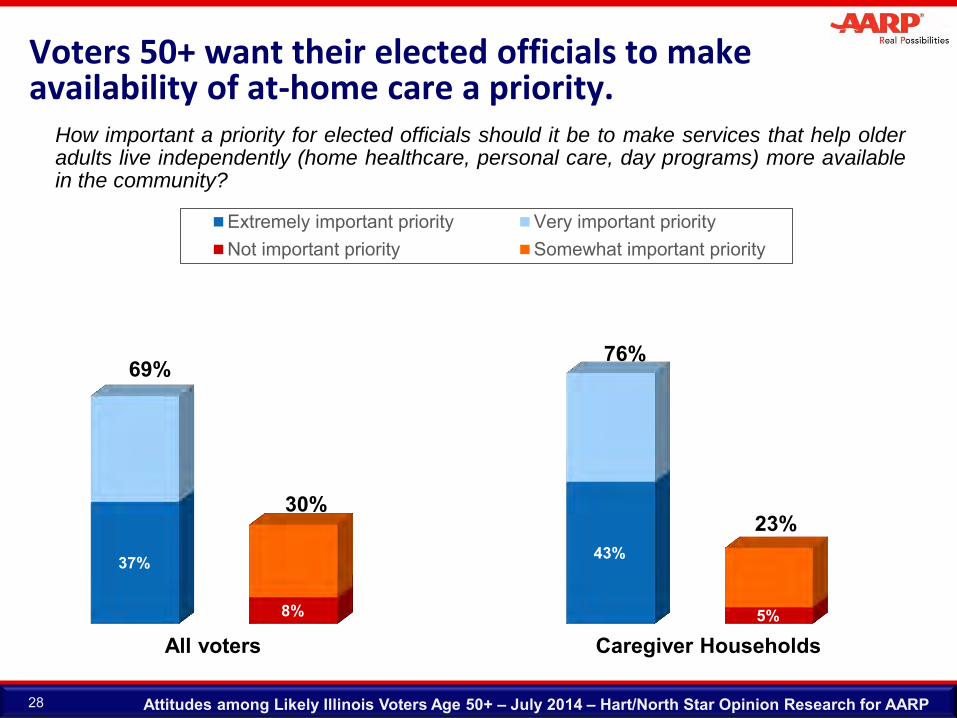
Voters 50+ want their elected officials to make availability of at-home care a priority.
28
How important a priority for elected officials should it be to make services that help older adults live independently (home healthcare, personal care, day programs) more available in the community?
37% 43%
8% 5%
Extremely important priority Very important priorityNot important priority Somewhat important priority
69%
All voters
30%
Caregiver Households
76%
23%

Attitudes among Likely Illinois Voters Age 50+ – July 2014 – Hart/North Star Opinion Research for AARP
Helping people live independently is a powerful poten-tial issue for candidates, especially among women and lower-income voters.
21%
29
How important is this issue in helping you make your voting decisions this year?
Very/fairly important
Less/not important
Very important
65%
79%
Helping older people and the disabled live independently
Very Important Issue in my Vote Decisions
Men Women
Age 50 to 64 Age 65/over
High school/less Some college College grads
Income under $30K Income $30K to $50K Income over $50K
55% 73%
61% 70%
76% 70% 52%
77% 63% 60%
Whites African Americans
Undecided voters
Caregiver HH
60% 86%
69%
68%

Attitudes among Likely Illinois Voters Age 50+ – July 2014 – Hart/North Star Opinion Research for AARP
There is near universal support to shift additional federal funding from nursing home to home-based care.
8%
30
* Information before question: “Currently, states receive federal funds to help low income seniors and people with disabilities when the basic tasks of life become difficult due to aging or illness. At present, states are required to spend the majority of these funds on nursing home care. Illinois has asked the federal government for the flexibility to shift existing funding from nursing homes to care provided at a person’s home.” Support Oppose
Support strongly
70%
80%
Do you support or oppose the federal government giving states like Illinois more
flexibility with this funding so that seniors can receive services in their homes if that
is their preference?*
Men Women
Age 50 to 64 Age 65 to 74 Age 75/over
69% 81%
78% 73% 70%
Strongly support shifting funding All voters
Illinois Voters Age 50+ and the 2014 Election
Key Findings from a Survey among Likely Voters age 50/over Conducted June 2014
for