Illinois Morbidity and Mortality...
33
Illinois Morbidity and Mortality Bulletin January 2015 Vol. 1, Issue 1 Page 1 Assessing Prevalence of Multiple Chronic Conditions Among Illinois Adults: Estimates From the Behavioral Risk Factor Surveillance System, 2013 The prevalence of chronic conditions in Illinois and the nation are increasing and many adults are suffering from multiple chronic conditions (MCC). The objective of this study was to present the prevalence of MCC and the most common MCC dyads in Illinois…read more An Assessment of the Appropriateness of Rabies Post- exposure Prophylaxis Use and Administration of Rabies Post-exposure Prophylaxis in Illinois 2013. Health care providers and public health authorities must assess each reported animal rabies exposure and make a determination of whether rabies post- exposure prophylaxis (PEP) is needed for the exposed individual. To evaluate how well PEP is taking place in Illinois, rabies potential human exposures reported in 2013 were reviewed….read more Life Expectancies for Illinois, Chicago and Illinois Counties for 1989-1991 and 2009-2011. Life expectancy, a widely used summary indicator of human health and development, measures longevity of a population over time. This report provides life expectancy estimates by age and sex for Illinois, Chicago and, for the first time, Illinois counties for 1989-1991 and 2009-2011….read more Message from Director Hasbrouck Welcome to Volume 1, Issue 1 of the Illinois Morbidity and Mortality Bulletin. We are pleased to begin publication of this bulletin featuring articles from various programs at the Illinois Department of Public Health. In this issue, Nancy Amerson's team from the Division of Chronic Disease Prevention and Control writes about the prevalence of multiple chronic conditions among Illinois adults using data from the Illinois Behavioral Risk Factor Surveillance System. In the second article, Dr. Connie Austin assesses the appropriateness of use and administration of rabies post-exposure prophylaxis in Illinois. In the third article, Dr. Mohammed Shahidullah and Nelson Agboda estimate life expectancies using population data from the U.S. Census and death data from the Illinois Vital Records System. We hope you find these articles interesting and we look forward to continued dissemination of health data and information from the Illinois Department of Public Health. LaMar Hasbrouck, MD, MPH Director In this issue Assessing Prevalence of Multiple Chronic Conditions among Illinois Adults: Estimates from the Behavioral Risk Factor Surveillance System, 2013 Page 2 An Assessment of the Appropriateness of Rabies Post-exposure Prophylaxis Use and Administration of Rabies Post-exposure Prophylaxis in Illinois 2013 Page 13 Life expectancies for Illinois, Chicago and Illinois counties for 1989-1991 and 2009-2011 Page 23
Transcript of Illinois Morbidity and Mortality...
Illinois Morbidity and Mortality Bulletin January 2015 Vol. 1, Issue 1 Page 1
Assessing Prevalence of Multiple Chronic Conditions Among Illinois Adults: Estimates From the Behavioral Risk Factor Surveillance System, 2013 The prevalence of chronic conditions in Illinois and the nation are increasing and many adults are suffering from multiple chronic conditions (MCC). The objective of this study was to present the prevalence of MCC and the most common MCC dyads in Illinois…read more
An Assessment of the Appropriateness of Rabies Post-exposure Prophylaxis Use and Administration of Rabies Post-exposure Prophylaxis in Illinois 2013. Health care providers and public health authorities must assess each reported animal rabies exposure and make a determination of whether rabies post-exposure prophylaxis (PEP) is needed for the exposed individual. To evaluate how well PEP is taking place in Illinois, rabies potential human exposures reported in 2013 were reviewed….read more
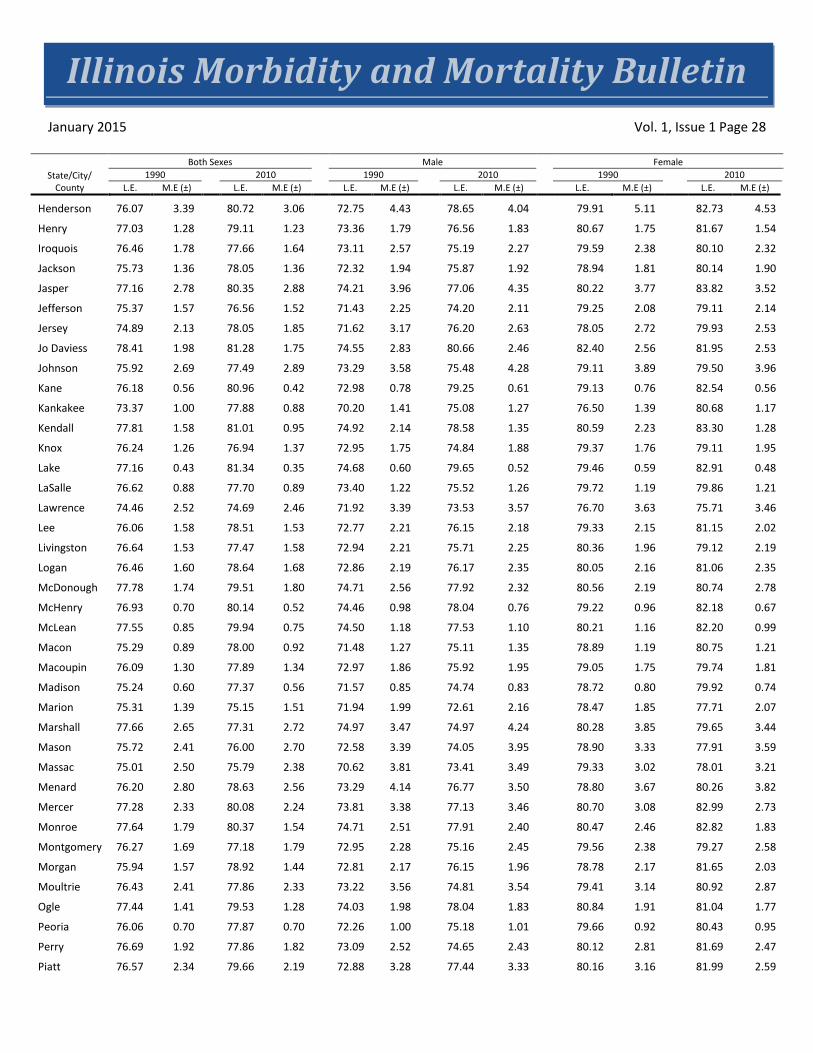
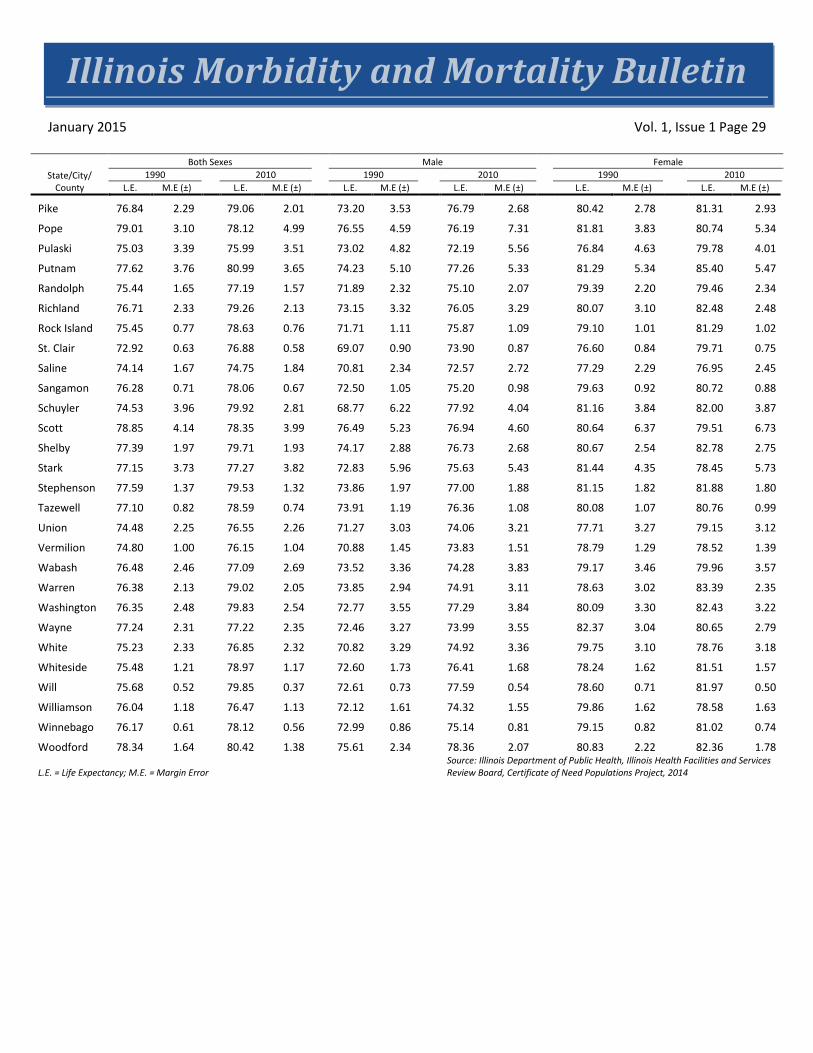
Life Expectancies for Illinois, Chicago and Illinois Counties for 1989-1991 and 2009-2011. Life expectancy, a widely used summary indicator of human health and development, measures longevity of a population over time. This report provides life expectancy estimates by age and sex for Illinois, Chicago and, for the first time, Illinois counties for 1989-1991 and 2009-2011….read more
Message from Director Hasbrouck
Welcome to Volume 1, Issue 1 of the Illinois Morbidity and Mortality Bulletin. We are pleased to begin publication of this bulletin featuring articles from various programs at the Illinois Department of Public Health.
In this issue, Nancy Amerson's team from the Division of Chronic Disease Prevention and Control writes about the prevalence of multiple chronic conditions among Illinois adults using data from the Illinois Behavioral Risk Factor Surveillance System.
In the second article, Dr. Connie Austin assesses the appropriateness of use and administration of rabies post-exposure prophylaxis in Illinois.
In the third article, Dr. Mohammed Shahidullah and Nelson Agboda estimate life expectancies using population data from the U.S. Census and death data from the Illinois Vital Records System.
We hope you find these articles interesting and we look forward to continued dissemination of health data and information from the Illinois Department of Public Health.
LaMar Hasbrouck, MD, MPH Director
In this issue
Assessing Prevalence of Multiple Chronic Conditions among Illinois Adults: Estimates from the Behavioral Risk Factor Surveillance System, 2013 Page 2 An Assessment of the Appropriateness of Rabies Post-exposure Prophylaxis Use and Administration of Rabies Post-exposure Prophylaxis in Illinois 2013 Page 13 Life expectancies for Illinois, Chicago and Illinois counties for 1989-1991 and 2009-2011 Page 23
Illinois Morbidity and Mortality Bulletin January 2015 Vol. 1, Issue 1 Page 2
Assessing Prevalence of Multiple Chronic Conditions Among Illinois Adults: Estimates From the Behavioral Risk Factor Surveillance System, 2013
Nancy L. Amerson, MPH1
Nora K. Kelly, MPH1
Benjamin S. Arbise, MPH, CHES1
Lizette O. Durand, PhD, VMD1
Abstract The prevalence of chronic conditions in Illinois and the nation are increasing and many adults are suffering from multiple chronic conditions (MCC). The objective of this study was to present the prevalence of MCC and the most common MCC dyads in Illinois. We used respondent-reported data from the 2013 Illinois Behavioral Risk Factor Surveillance System to study the adult population of Illinois. We categorized adults as having 0 to 1, or 2 or more of the following chronic conditions: arthritis, cancer (other than skin), chronic obstructive pulmonary disease (COPD), angina or coronary heart disease, a depressive disorder, diabetes, kidney disease, stroke, high blood pressure, high cholesterol, Alzheimer’s/dementia, or currently have asthma. Forty-four percent of Illinois adults have MCC. Multiple chronic conditions are more prevalent among Illinois adult females, white and black adults, older adults, veterans, and adults with health insurance. The most common dyad identified was high blood pressure and high cholesterol. Introduction Nearly half of adults throughout the nation suffer from a chronic condition, and many of them have multiple chronic conditions (MCC). 1 The effects of chronic disease are felt by the afflicted individual, throughout the health care system and society at large. Trends in population growth, increased life expectancy, advances in diagnostics of conditions and changes in lifestyle, such as diet and physical activity, has contributed to a higher prevalence of people with MCC. Traditionally, prevention and treatment has been specific to individual chronic conditions, however the rising number of individuals with multiple chronic conditions has shown the need for a multi-level approach with consideration of all present chronic conditions.2 In 2010, the U.S. Department of Health and Human Services (HHS) introduced a strategic framework as a national response to issues related to MCC.3,4 The vision for the HHS MCC strategic framework is optimal health and quality of life for individuals with MCC.3,4 Strategies of the framework include the stimulation of epidemiologic research to determine the most common MCC dyads and triads and to explain more clearly the differences in MCC.4 The results from the framework resulted in HHS identifying 20 chronic conditions for a standard classification scheme in five HHS data systems.5 The conditions were selected based on subject matter expert review of existing schemes.5 Current national efforts are focusing on the similarities between the different risk factors. There are numerous data sources available to assess MCC. In 2012, the Center for Medicaid and Medicare Services (CMS) released their Chartbook on Multiple Chronic Conditions, which looked at 15 chronic
Illinois Morbidity and Mortality Bulletin January 2015 Vol. 1, Issue 1 Page 3
conditions: high blood pressure, high cholesterol, ischemic heart disease, arthritis, diabetes, heart failure, chronic kidney disease, depression, COPD, Alzheimer’s, atrial fibrillation, cancer, osteoporosis, asthma and stroke.5,6 Nationally, among the Medicaid and Medicare population, 67.3 percent had two or more chronic conditions and 14 percent had six or more.6
National Health Interview Survey (NHIS) is conducted continuously throughout the year by using computer-assisted personal interviews of the U.S. civilian, non-institutionalized population.1 NHIS was used to assess the following chronic conditions: hypertension, coronary heart disease, stroke, diabetes, cancer, arthritis, hepatitis, weak or failing kidneys, chronic obstructive pulmonary disease or current asthma. The analysis found the prevalence of MCC has increased from 21.8 percent in 2001 to 26.0 percent in 2010.1
The Behavioral Risk Factor Surveillance System (BRFSS) is a questionnaire for adults 18 years of age or older created by the U.S. Centers for Disease Control and Prevention and administered nationally. In Illinois, the BRFSS is administered annually at the state level and every three-to-five years at the local level. It is used to estimate the prevalence of health indicators, risk behaviors and chronic disease.7 The objective of this study was to analyze 2013 BRFSS data to examine the prevalence of MCC, prevalence of MCC dyads and the disparities by socio-demographic groups in Illinois. Data and Methods Data source BRFSS is a national health-related telephone survey that collects state data about U.S. residents regarding their health-related risk behaviors, chronic health conditions and use of preventive services. BRFSS completes more than 400,000 adult interviews nationally each year, making it the largest continuously conducted health survey system in the world.7 The survey is conducted using Random Digit Dialing (RDD) techniques on both landlines and cell phones. Cell phone survey data collection began in 2008 and, when BRFSS revised its weighting methodology in 2011, included telephone ownership as a variable.7 Illinois contracts with Northern Illinois University to administer the BRFSS surveys continuously throughout the year and aims for a sample size of 5,000. The states use a standardized core questionnaire, optional modules and state-added questions. The adult who completes the questionnaire self-reports sex, age, race/ethnicity, income, education, health insurance, veteran’s status and disability in the core questionnaire. Health condition statuses are reported primarily in the core questionnaire or in optional modules (diabetes, cognitive impairment).8 The 2013 Illinois adult sample contained 5,609 adults.8 Descriptive estimates of select socio-demographic characteristics for the 2013 adult population are in Table 1. MCC definition The 2013 Illinois BRFSS included questions on 12 of the 20 chronic conditions captured in the HHS workgroup definition, including whether adults had ever been told by a doctor or other health professional they had arthritis; cancer (other than skin); COPD; angina or coronary heart disease; a depressive disorder, including depression, major depression, dysthymia, or minor depression; diabetes; kidney disease; stroke; high blood

Illinois Morbidity and Mortality Bulletin January 2015 Vol. 1, Issue 1 Page 4
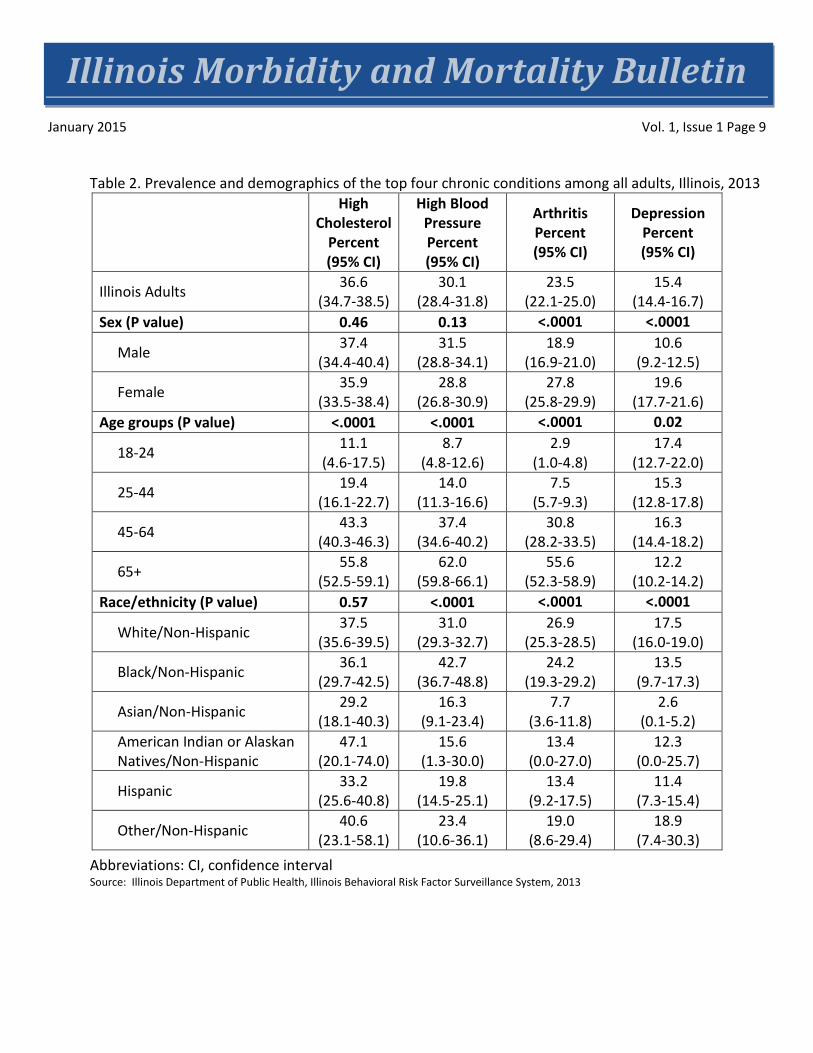
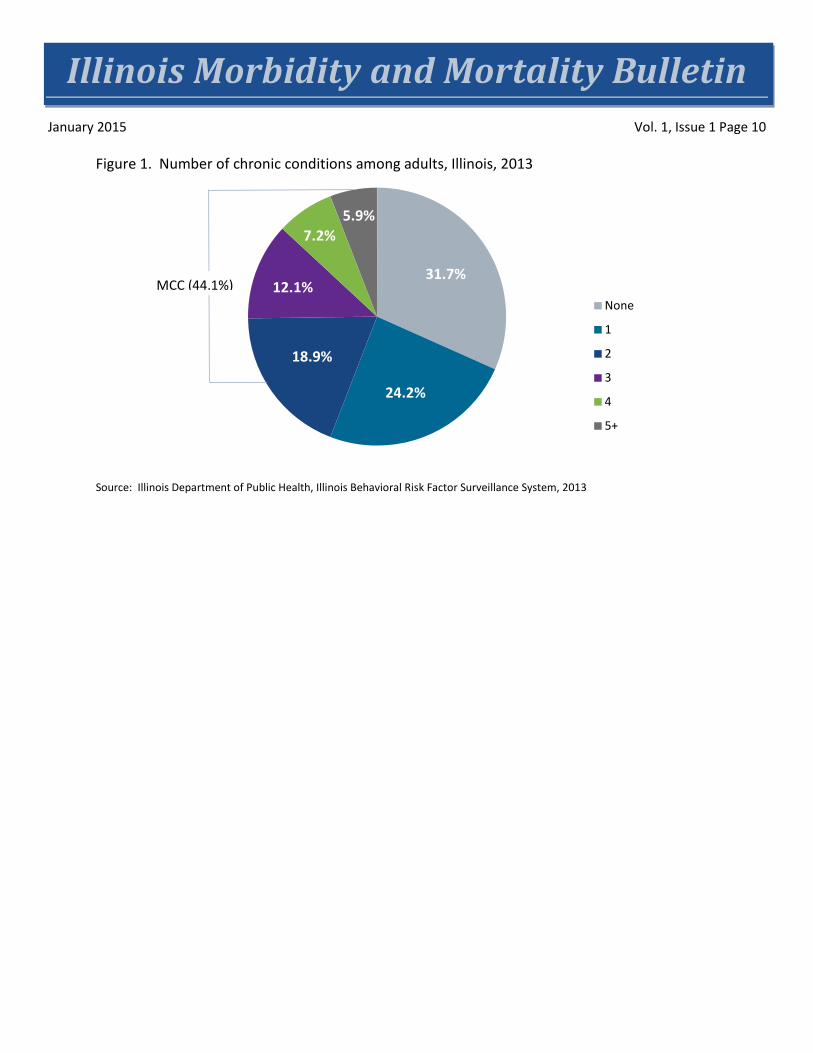
pressure; high cholesterol; Alzheimer’s/dementia; or currently have asthma. We counted the presence of each of these 12 conditions and combined them into two categories: 0 to 1 condition, 2 or more conditions. We also generated estimates for the most common MCC dyad combinations by age group, and we estimated weighted prevalence for the most common combinations. The MCC dyad combinations were not mutually exclusive; an adult could have more than one dyad. Methods The BRFSS data are weighted by CDC to correct for the differences in probability of selection. In 2011, the post-stratification weighting methodology was discontinued and raking was adopted. Raking, which does not rely on information on smaller geographic areas, allows for the incorporation of a crucial variable, telephone ownership (households with landline or cellular telephones) in the weighting methodology of BRFSS.9 Analysis was conducted by using SAS version 9.3 (SAS Institute, Inc., Cary, North Carolina). Direct prevalence estimates were calculated by using weighted 2013 BRFSS data. Chi square analyses were calculated between each of the four most prevalent chronic conditions and sex, age groups and race/ethnic group, and between those having MCC and all demographics. The top five dyads for each age group were calculated. Results Prevalence of Chronic Conditions High cholesterol is the most prevalent chronic condition among Illinois adults (36.6%, CI: 34.7-38.5). Also, just under one-third of Illinois adults have high blood pressure (30.1%, CI: 28.4-31.8). Nearly one-quarter of Illinois adults have arthritis (23.5%, CI: 22.1-25.0), and slightly more than 15 percent of Illinois adults have depression (15.4%, CI: 14.1-16.7) (Table 2). Prevalence of the eight other chronic conditions include diabetes at 9.9 percent (CI: 8.8-10.9), asthma at 7.6 percent (CI:6.6-8.5), cancer at 6.3 percent (CI:5.5-7.0), COPD at 5 percent (CI:4.3-5.7), heart disease at 3.9 percent (CI:3.3-4.5), stroke at 2.8 percent (CI:2.2-3.4), kidney disease at 2.4 percent (CI:1.9-2.8) and dementia at 0.2 percent (CI:0.0-0.3). Of the top four chronic conditions, high cholesterol (37.4%, CI: 34.4-40.4) and high blood pressure (31.5%, CI: 28.8-34.1) were more prevalent among men than women, though this difference is not significant (Table 2). Arthritis (27.8%, CI: 25.8-29.9) and depression (19.6%, CI: 17.7-21.6) were more prevalent among women (p<0.0001). High cholesterol (55.8%, CI: 52.5-59.1), blood pressure (62.0%, CI: 59.8-66.1) and arthritis (55.6%, CI: 52.3-58.9) were more prevalent among adults 65 and older (p<0.0001), while depression (17.4%, CI: 12.7-22.0) was most prevalent among younger adults (p=0.02). When comparing the top four chronic conditions across race/ethnicity, high cholesterol (47.1%, CI: 20.1-74.0) was more prevalent in Native Americans, though this difference is not significant (Table 2); high blood pressure was most prevalent among African Americans, non-Hispanics (42.7%, CI: 36.7-48.8); and arthritis (26.9%, CI: 25.3-28.5) and depression (17.5%, CI: 16.0-19.0) were more common among white, non-Hispanics. Prevalence of MCC In Illinois, 44.1 percent of adults are living with two or more chronic conditions, and 31.7 percent of adults do not have any chronic conditions (Figure 1).
Illinois Morbidity and Mortality Bulletin January 2015 Vol. 1, Issue 1 Page 5
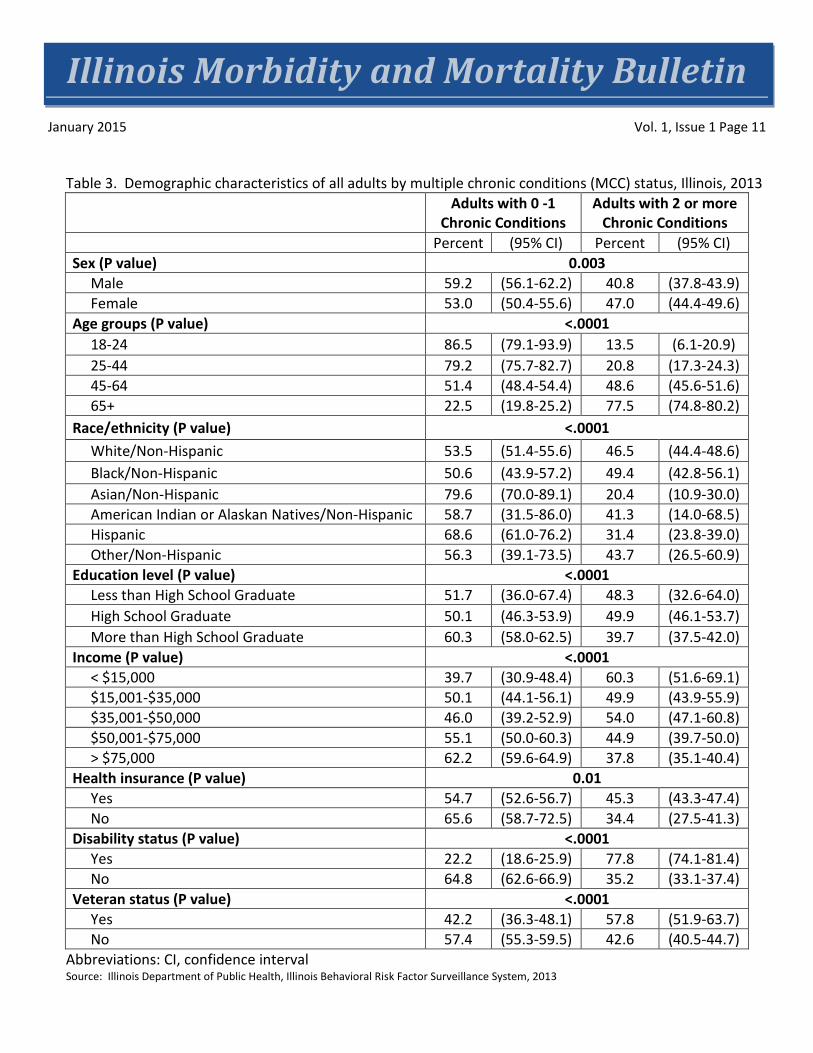
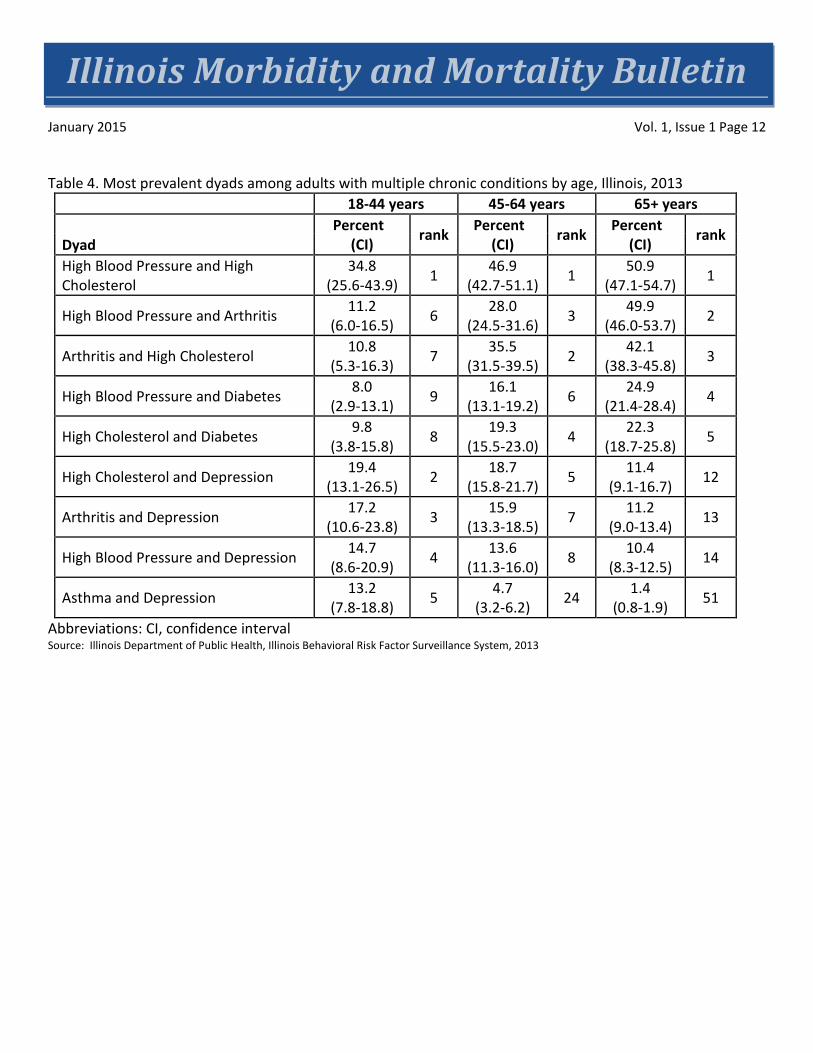
Prevalence of MCC by demographics Females had a higher prevalence of having MCC than males (47.0%, CI: 44.4-49.6 to 40.8%, CI: 37.8-43.9)(Table 3). The prevalence of having MCC increases with age. Prevalence of MCC increases from 13.5 percent (CI: 6.1-20.9) among adults 18 to 24 years of age, to 77.5 percent (CI: 74.8-80.2) among adults 65 years of age or older. The prevalence of having MCC is highest among black and white adults (49.4%, CI: 42.8-56.1 and 46.5%, CI: 44.4-48.6). Compared to other race/ethnicity groups, Asian adults in Illinois are among the lowest in having MCC (20.4%, CI: 10.9-30.0). The prevalence of having MCC is highest among high school graduates (49.9%, CI: 37.5-42.0). The prevalence of adults with MCC is higher among adults making less than $15,000 a year (60.3%, CI: 51.6-69.1). The prevalence of having MCC is higher among individuals that have health insurance (45.3%, CI: 43.3-47.4) than those that do not have health insurance (34.4%, CI: 27.5-41.3). The prevalence of having MCC is higher among people with a disability (77.8%, CI: 74.1-81.4) than those without a disability (35.2%, CI: 33.1-37.4). All these results had a p<0.0001.The prevalence of having MCC is higher among veterans (57.8%, CI: 51.9-63.7) than non-veterans (42.6%, CI: 40.5-44.7) at p<0.01. Prevalence of MCC Dyads For adults in Illinois in all three age groups, the dyad with the highest prevalence was high blood pressure and high cholesterol and increased with age from 34.8 percent (CI: 25.6-43.9) in the 18-44 year age group to 50.9 percent (CI: 47.1-54.7) in adults age 65 years or older (Table 4). Although adults 45-64 years of age and those 65 years of age or older had the same top three dyads, the orders varied: for adults 45-64, high cholesterol and arthritis (35.5%; CI: 31.5-39.5) was the second most common dyad, while high blood pressure and arthritis (28%; CI: 24.5-31.6) was third. These two dyads were swapped in adults greater than 65 years of age, with high blood pressure and arthritis (49.9%; CI: 46.0-53.7) being second, followed by high cholesterol and arthritis (42.1%; CI: 38.3-45.8). Among adults 18 to 44 years of age, the second most common dyad was high cholesterol and depression (19.4%; CI: 13.1-26.5) followed by arthritis and depression (17.2%; CI: 10.6-23.8). Discussion Illinois adult females, white and black adults, older adults, veterans and adults with health insurance had the highest prevalence of MCC. The higher prevalence among insured adults over uninsured adults may be a result of chronic conditions going undiagnosed among individuals without insurance who are less likely to visit a doctor in the past year. The top four chronic diseases in Illinois (high cholesterol, high blood pressure, arthritis and depression) are the chronic diseases most included in the top five dyads by age group. It is notable that in adults 18 to 44 years of age, depression was part of four of the five most prevalent dyads and only included in one out of the five dyads most common dyads for adults 45 to 64 years of age and not included in the top five for adults 65 years of age or older. Multiple analyses of MCC in the United States have been conducted. These studies used a variety of data sources derived from various population groups. The use of different data sources makes it difficult to
Illinois Morbidity and Mortality Bulletin January 2015 Vol. 1, Issue 1 Page 6
compare the various studies. In our analysis, we used 2013 Illinois BRFSS data and found 44.1 percent of the Illinois adult population (>18) have two or more MCC. Our results fall in between those described by the NHIS analysis (26%), which surveys national adults 18 and older, and the CMS analysis (44.1%), which surveys Medicare and Medicaid patients. This is the first study in Illinois to examine MCC. The use of BRFSS for our analysis has some inherent limitations. BRFSS data are self-reported and reflect the perceptions of respondents. A disadvantage of self-report data is respondents may have difficulty recalling events, understanding or interpreting questions or responding truthfully to questions, such as about compliance with advice.10 This limitation may contribute to lower prevalence estimates. Additionally, preliminary assessments indicate the inclusion of cellular telephone respondents and the move to a new method of weighting in 2011 might increase prevalence estimates for health risk behaviors and chronic disease in many states.9 Author Affiliations 1 Illinois Department of Public Health, Office of Health Promotion, Division of Chronic Disease Prevention and Control References
1. Ward BW, Schiller JS. Prevalence of Multiple Chronic Conditions Among US Adults: Estimates From the National Health Interview Survey, 2010. Prev Chronic Dis 2013;10:120203. http://www.cdc.gov/pcd/issues/2013/12_0203.htm.
2. Barnett SW, Mercer MN, Graham Watt, Sally Wyke, Bruce Guthrie. Epidemiology Of Multimorbidity
and Implications for Health Care, Research, and Medical Education: A Cross-Sectional Study. The Lancet 2012; 380(9836):37-43. http://www.thelancet.com/journals/lancet/article/PIIS0140-6736(12)60240-2/abstract
3. U.S. Department of Health and Human Services. Optimum Health and Quality of Life for Individuals with Multiple Chronic Conditions. December 2010. Multiple Chronic Conditions—A Strategic Framework: Washington, DC.
4. Parekh AK, Goodman RA, Gordon C, Koh HK; HHS Interagency Workgroup on Multiple Chronic Conditions. Managing Multiple Chronic Conditions: A Strategic Framework for Improving Health Outcomes and Quality of Life. Public Health Rep. 2011 126(4): 460-471. http://www.ncbi.nlm.nih.gov/pmc/articles/PMC3115206/
5. Goodman RA, Posner SF, Huang ES, Parekh AK, Koh HK. Defining and Measuring Chronic Conditions: Imperatives for Research, Policy, Program, and Practice. Prev Chronic Dis 2013;10:120239. http://www.cdc.gov/pcd/issues/2013/12_0239.htm.
Illinois Morbidity and Mortality Bulletin January 2015 Vol. 1, Issue 1 Page 7
6. Centers for Medicare and Medicaid Services. Chronic Conditions among Medicare Beneficiaries,
Chartbook, 2012 Edition. Baltimore, MD. http://www.cms.gov/Research-Statistics-Data-and-Systems/Statistics-Trends-and-Reports/Chronic-Conditions/Downloads/2012Chartbook.pdf
7. Behavioral Risk Factor Surveillance System. U.S. Centers for Disease Control and Prevention. March 2013. http://www.cdc.gov/brfss/about/about_brfss.htm Accessed 9/16/14.
8. Illinois Behavioral Risk Factor Surveillance System, 2013 data. Illinois Department of Public Health. http://app.idph.state.il.us/brfss Accessed 9/16/14.
9. U.S. Centers for Disease Control and Prevention (CDC). Methodologic Changes in the Behavioral Risk
Factor Surveillance System in 2011 and Potential Effects on Prevalence Estimates. MMWR Morb Mortal Wkly Rep. 2012;61(22):410-413. http://www.cdc.gov/mmwr/preview/mmwrhtml/mm6122a3.htm.
10. Appendix E: BRFSS Measures, Data and Benchmarks: Asthma Care Quality Improvement: A Resource Guide for State Action. September 2009. Agency for Healthcare Research and Quality, Rockville, MD. http://www.ahrq.gov/professionals/quality-patient-safety/quality-resources/tools/asthmaqual/asthmacare/appendix-e.html. Accessed 9/16/14.
Illinois Morbidity and Mortality Bulletin January 2015 Vol. 1, Issue 1 Page 8
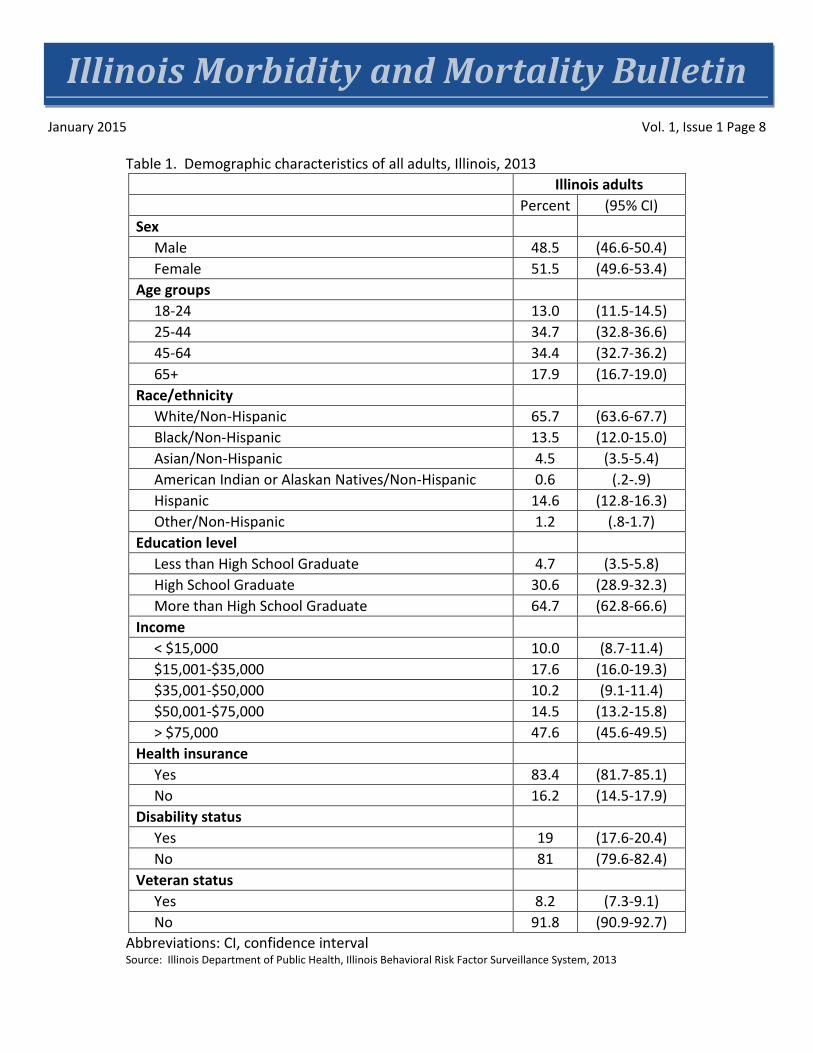
Table 1. Demographic characteristics of all adults, Illinois, 2013
Abbreviations: CI, confidence interval Source: Illinois Department of Public Health, Illinois Behavioral Risk Factor Surveillance System, 2013
Illinois adults Percent (95% CI) Sex Male 48.5 (46.6-50.4) Female 51.5 (49.6-53.4) Age groups 18-24 13.0 (11.5-14.5) 25-44 34.7 (32.8-36.6) 45-64 34.4 (32.7-36.2) 65+ 17.9 (16.7-19.0) Race/ethnicity White/Non-Hispanic 65.7 (63.6-67.7) Black/Non-Hispanic 13.5 (12.0-15.0) Asian/Non-Hispanic 4.5 (3.5-5.4) American Indian or Alaskan Natives/Non-Hispanic 0.6 (.2-.9) Hispanic 14.6 (12.8-16.3) Other/Non-Hispanic 1.2 (.8-1.7) Education level Less than High School Graduate 4.7 (3.5-5.8) High School Graduate 30.6 (28.9-32.3) More than High School Graduate 64.7 (62.8-66.6) Income < $15,000 10.0 (8.7-11.4) $15,001-$35,000 17.6 (16.0-19.3) $35,001-$50,000 10.2 (9.1-11.4) $50,001-$75,000 14.5 (13.2-15.8) > $75,000 47.6 (45.6-49.5) Health insurance Yes 83.4 (81.7-85.1) No 16.2 (14.5-17.9) Disability status Yes 19 (17.6-20.4) No 81 (79.6-82.4) Veteran status Yes 8.2 (7.3-9.1) No 91.8 (90.9-92.7)
Illinois Morbidity and Mortality Bulletin January 2015 Vol. 1, Issue 1 Page 9
Table 2. Prevalence and demographics of the top four chronic conditions among all adults, Illinois, 2013
Abbreviations: CI, confidence interval Source: Illinois Department of Public Health, Illinois Behavioral Risk Factor Surveillance System, 2013
High Cholesterol
Percent (95% CI)
High Blood Pressure Percent (95% CI)
Arthritis Percent (95% CI)
Depression Percent (95% CI)
Illinois Adults 36.6 (34.7-38.5)
30.1 (28.4-31.8)
23.5 (22.1-25.0)
15.4 (14.4-16.7)
Sex (P value) 0.46 0.13 <.0001 <.0001
Male 37.4 (34.4-40.4)
31.5 (28.8-34.1)
18.9 (16.9-21.0)
10.6 (9.2-12.5)
Female 35.9 (33.5-38.4)
28.8 (26.8-30.9)
27.8 (25.8-29.9)
19.6 (17.7-21.6)
Age groups (P value) <.0001 <.0001 <.0001 0.02
18-24 11.1 (4.6-17.5)
8.7 (4.8-12.6)
2.9 (1.0-4.8)
17.4 (12.7-22.0)
25-44 19.4 (16.1-22.7)
14.0 (11.3-16.6)
7.5 (5.7-9.3)
15.3 (12.8-17.8)
45-64 43.3 (40.3-46.3)
37.4 (34.6-40.2)
30.8 (28.2-33.5)
16.3 (14.4-18.2)
65+ 55.8 (52.5-59.1)
62.0 (59.8-66.1)
55.6 (52.3-58.9)
12.2 (10.2-14.2)
Race/ethnicity (P value) 0.57 <.0001 <.0001 <.0001
White/Non-Hispanic 37.5 (35.6-39.5)
31.0 (29.3-32.7)
26.9 (25.3-28.5)
17.5 (16.0-19.0)
Black/Non-Hispanic 36.1 (29.7-42.5)
42.7 (36.7-48.8)
24.2 (19.3-29.2)
13.5 (9.7-17.3)
Asian/Non-Hispanic 29.2 (18.1-40.3)
16.3 (9.1-23.4)
7.7 (3.6-11.8)
2.6 (0.1-5.2)
American Indian or Alaskan Natives/Non-Hispanic
47.1 (20.1-74.0)
15.6 (1.3-30.0)
13.4 (0.0-27.0)
12.3 (0.0-25.7)
Hispanic 33.2 (25.6-40.8)
19.8 (14.5-25.1)
13.4 (9.2-17.5)
11.4 (7.3-15.4)
Other/Non-Hispanic 40.6 (23.1-58.1)
23.4 (10.6-36.1)
19.0 (8.6-29.4)
18.9 (7.4-30.3)
Illinois Morbidity and Mortality Bulletin January 2015 Vol. 1, Issue 1 Page 10
Figure 1. Number of chronic conditions among adults, Illinois, 2013
Source: Illinois Department of Public Health, Illinois Behavioral Risk Factor Surveillance System, 2013
31.7%
24.2%
18.9%
12.1%
7.2% 5.9%
None
1
2
3
4
5+
MCC (44.1%)
Illinois Morbidity and Mortality Bulletin January 2015 Vol. 1, Issue 1 Page 11
Table 3. Demographic characteristics of all adults by multiple chronic conditions (MCC) status, Illinois, 2013 Adults with 0 -1
Chronic Conditions Adults with 2 or more
Chronic Conditions Percent (95% CI) Percent (95% CI) Sex (P value) 0.003 Male 59.2 (56.1-62.2) 40.8 (37.8-43.9) Female 53.0 (50.4-55.6) 47.0 (44.4-49.6) Age groups (P value) <.0001 18-24 86.5 (79.1-93.9) 13.5 (6.1-20.9) 25-44 79.2 (75.7-82.7) 20.8 (17.3-24.3) 45-64 51.4 (48.4-54.4) 48.6 (45.6-51.6) 65+ 22.5 (19.8-25.2) 77.5 (74.8-80.2) Race/ethnicity (P value) <.0001 White/Non-Hispanic 53.5 (51.4-55.6) 46.5 (44.4-48.6) Black/Non-Hispanic 50.6 (43.9-57.2) 49.4 (42.8-56.1) Asian/Non-Hispanic 79.6 (70.0-89.1) 20.4 (10.9-30.0) American Indian or Alaskan Natives/Non-Hispanic 58.7 (31.5-86.0) 41.3 (14.0-68.5) Hispanic 68.6 (61.0-76.2) 31.4 (23.8-39.0) Other/Non-Hispanic 56.3 (39.1-73.5) 43.7 (26.5-60.9) Education level (P value) <.0001 Less than High School Graduate 51.7 (36.0-67.4) 48.3 (32.6-64.0) High School Graduate 50.1 (46.3-53.9) 49.9 (46.1-53.7) More than High School Graduate 60.3 (58.0-62.5) 39.7 (37.5-42.0) Income (P value) <.0001 < $15,000 39.7 (30.9-48.4) 60.3 (51.6-69.1) $15,001-$35,000 50.1 (44.1-56.1) 49.9 (43.9-55.9) $35,001-$50,000 46.0 (39.2-52.9) 54.0 (47.1-60.8) $50,001-$75,000 55.1 (50.0-60.3) 44.9 (39.7-50.0) > $75,000 62.2 (59.6-64.9) 37.8 (35.1-40.4) Health insurance (P value) 0.01 Yes 54.7 (52.6-56.7) 45.3 (43.3-47.4) No 65.6 (58.7-72.5) 34.4 (27.5-41.3) Disability status (P value) <.0001 Yes 22.2 (18.6-25.9) 77.8 (74.1-81.4) No 64.8 (62.6-66.9) 35.2 (33.1-37.4) Veteran status (P value) <.0001 Yes 42.2 (36.3-48.1) 57.8 (51.9-63.7) No 57.4 (55.3-59.5) 42.6 (40.5-44.7)
Abbreviations: CI, confidence interval Source: Illinois Department of Public Health, Illinois Behavioral Risk Factor Surveillance System, 2013
Illinois Morbidity and Mortality Bulletin January 2015 Vol. 1, Issue 1 Page 12
Table 4. Most prevalent dyads among adults with multiple chronic conditions by age, Illinois, 2013
18-44 years 45-64 years 65+ years
Dyad Percent
(CI) rank Percent (CI) rank Percent
(CI) rank
High Blood Pressure and High Cholesterol
34.8 (25.6-43.9) 1 46.9
(42.7-51.1) 1 50.9 (47.1-54.7) 1
High Blood Pressure and Arthritis 11.2 (6.0-16.5) 6 28.0
(24.5-31.6) 3 49.9 (46.0-53.7) 2
Arthritis and High Cholesterol 10.8 (5.3-16.3) 7 35.5
(31.5-39.5) 2 42.1 (38.3-45.8) 3
High Blood Pressure and Diabetes 8.0 (2.9-13.1) 9 16.1
(13.1-19.2) 6 24.9 (21.4-28.4) 4
High Cholesterol and Diabetes 9.8 (3.8-15.8) 8 19.3
(15.5-23.0) 4 22.3 (18.7-25.8) 5
High Cholesterol and Depression 19.4 (13.1-26.5) 2 18.7
(15.8-21.7) 5 11.4 (9.1-16.7) 12
Arthritis and Depression 17.2 (10.6-23.8) 3 15.9
(13.3-18.5) 7 11.2 (9.0-13.4) 13
High Blood Pressure and Depression 14.7 (8.6-20.9) 4 13.6
(11.3-16.0) 8 10.4 (8.3-12.5) 14
Asthma and Depression 13.2 (7.8-18.8) 5 4.7
(3.2-6.2) 24 1.4 (0.8-1.9) 51
Abbreviations: CI, confidence interval Source: Illinois Department of Public Health, Illinois Behavioral Risk Factor Surveillance System, 2013
Illinois Morbidity and Mortality Bulletin January 2015 Vol. 1, Issue 1 Page 13
An Assessment of the Appropriateness of Rabies Post-exposure Prophylaxis Use and Administration of Rabies PEP in Illinois, 2013
Connie Austin, DVM, MPH, PhD1
Abstract Health care providers and public health authorities must assess each reported animal rabies exposure and make a determination of whether rabies post-exposure prophylaxis (PEP) is needed for the exposed individual. If a decision is made to provide rabies PEP, health care providers must correctly administer the rabies biologics at the correct time intervals. To evaluate how well this is taking place in Illinois, rabies potential human exposures (RPHE) reported in 2013 were reviewed. There were 531 RPHE reported and 466 persons (3.63 per 100,000 population) started on rabies PEP. Thirty percent of the recommendations to receive rabies PEP did not meet the Advisory Committee on Immunization Practices (ACIP) criteria for a person to receive a recommendation for rabies PEP. Most of these inappropriate recommendations were due to insignificant bat exposures in homes or provoked bites from healthy dogs or cats. There were 152 people who received rabies PEP and whose schedule or site of administration of rabies biologics did not follow ACIP guidance. Incorrect timing of injections was found in 44 percent and incorrect site of administration was identified in 34 percent of these situations. This evaluation points out the need for additional education of health care providers and public health professionals on risk assessment for animal exposures and on correct administration of rabies PEP. Education of health care providers and public health professionals could decrease the unnecessary administration of rabies PEP and improve correct administration of rabies PEP when it is given. Introduction Rabies is a zoonosis that has one of the highest case fatality rates for any infectious disease. Transmission of rabies typically occurs after a bite from an infected animal. Other rare modes of transmission include transplant associated rabies. Rabies potential human exposure (RPHE) have been reportable since 2004, in the state of Illinois, to allow for assessments of the number of exposures and administration of rabies post-exposure prophylaxis (PEP). Exposures to possible or known rabid animals are not uncommon in Illinois. After an exposure to a rabid or potentially rabid animal, a person can be given rabies PEP to prevent development of rabies. A risk assessment specific to the geographic area where the exposure took place is needed for each exposure to determine if rabies PEP should be recommended for the exposed person. The federal Advisory Committee on Immunization Practices (ACIP) guidelines on rabies with information from local animal rabies epidemiology should be used for this assessment,1,2 and the assessment is best provided by health care providers in consultation with public health authorities. Rabies PEP is expensive and it is important to administer rabies PEP when necessary but reduce its unnecessary use. One way to reduce rabies PEP is to test high-risk animals that have exposed a person. Rabies PEP administration can be averted if exposing high-risk animals are tested negative. However, rabies testing of animals also is expensive and should be used only when needed to prevent unnecessary rabies PEP
Illinois Morbidity and Mortality Bulletin January 2015 Vol. 1, Issue 1 Page 14
administration and for specific animal surveillance activities. There were 4,027 animals tested for rabies in Illinois in 2013 and 55 rabid bats were identified. After the 1999 release of the ACIP rabies guidelines, which recommended rabies post-exposure prophylaxis for some non-bite bat exposures, an increase was noted in bat testing in Massachusetts.3
Overall, information critical to decision making on the need for rabies PEP administration includes:
• Exposing species • Geographic location of the exposure • Availability of animal for confinement (dog, cat or ferret), or rabies testing, if warranted. • Type of exposure (bite, non-bite or non-exposure) • For domestic animals, the health status of the animal and a description of the exposure, if bite
(provoked or unprovoked). Rabies vaccination status also can be helpful.
Classifying animal exposures into risk categories is essential in reducing unnecessary rabies testing yet ensuring that persons needing rabies PEP receive needed prophylaxis. Examples of low risk exposures include bites from rodents or rabbits, or provoked bites from healthy dogs, cats or ferrets. Animals in this situation can be confined and observed for 10 days. If they survive a 10-day confinement period, they could not have had rabies virus in their saliva at the time of the bite. In Illinois, since it has been 21 years since a dog or cat has tested positive for rabies makes dogs and cats in Illinois very low risk for rabies transmission. However, dogs and cats can be imported from overseas and can be bitten by the most commonly rabid species in the state, the bat. High-risk exposures include bites from neurologic animals; unprovoked bites from dogs, cats or ferrets; or bites from high-risk wild animal species, including bats, raccoons, skunks, fox or coyote, bites occurring in countries with high levels of domestic animal rabies and persons with a significant non-bite exposure to a bat. Once a determination is made that rabies PEP is needed, it is important to correctly administer rabies biologics. The schedule for rabies PEP administration for someone not previously vaccinated is complicated and involves rabies immune globulin and multiple rabies vaccinations at specified times and injected at specific sites in the body.1,2 The degree to which errors in administration occur and the common errors in administration have not been previously reported. To reduce unnecessary rabies PEP administration in Illinois and to determine the extent to which rabies PEP is administered correctly in the state, it is necessary to review rabies PHE reports. This type of analysis has not been previously reported in Illinois. The purpose of this study was to use Illinois RPHE data from 2013 to evaluate the extent of rabies PEP administered and how closely rabies exposure risk assessors followed the ACIP guidance. In addition, the correctness of rabies PEP administration also was evaluated.
Illinois Morbidity and Mortality Bulletin January 2015 Vol. 1, Issue 1 Page 15
Methods All RPHE reported to Illinois public health authorities in 2013 and entered in the Illinois-National Electronic Disease Surveillance System (I-NEDSS) were included in the analysis. Reportable exposures included:
1) Any contact (bite, non-bite or non-exposure) with a bat. 2) Any contact (bite or non-bite) from a rabies positive animal to a person. 3) Anyone who was started on rabies PEP. 4) Exposure to saliva from a bite, or contact of any abrasion or mucus membrane with brain tissue, saliva
or cerebrospinal fluid from a suspect rabid person or animal. Exposure to healthy rabbits, small rodents, indoor-only domestic pets or rabies vaccinated dogs, cats or ferrets was excluded, unless the exposure complied with (1) through (3), or the animal displayed signs consistent with rabies.
5) Any bite from a wild mammal, not including small rodents or rabbits. 6) Anyone who was in the same room as a bat and who might be unaware that a bite or direct contact
had occurred (e.g., a sleeping person awakened to find a bat in the room or an adult witnessed a bat in the room with a previously unattended child, mentally disabled person or intoxicated person) and rabies could not be ruled out by testing the bat.
7) Anyone bitten by a non-human primate.
The types of exposures were defined as:
1) Bite – A break in the skin from the teeth. 2) Non-bite – Saliva into a mucus membrane or cut, bat in room with a sleeping person, physical contact
with bat to bare skin, a person in a room with a live bat and unable to express if they had a significant exposure.
3) Non-exposure – No exposure meeting ACIP criteria for an exposure is identified. 4) Unknown
Bites from dogs and cats were classified as provoked or unprovoked. Provoked bites are ones in which an animal feels threatened; is defending its property, food, young or other resources; is being approached by a strange person; is being manipulated for veterinary care or handled when hurt; when someone is trying to separate two fighting animals; or other situations where a dog or cat may be expected to bite given the circumstances. Unprovoked bites are those in which there is not an adequate explanation for why the dog or cat would bite. Persons with RPHE are reported through Illinois Department of Public Health (IDPH) I-NEDSS. Authorized local and state health department personnel and health care providers have access to I-NEDSS. The reporting system for I-NEDSS is called Business Objects. This software was used to obtain frequencies presented in this report. Multiple rabies PHE may occur due to a single animal. Therefore, the number of rabies PHE reports does not equal the number of exposing animals.
Illinois Morbidity and Mortality Bulletin January 2015 Vol. 1, Issue 1 Page 16
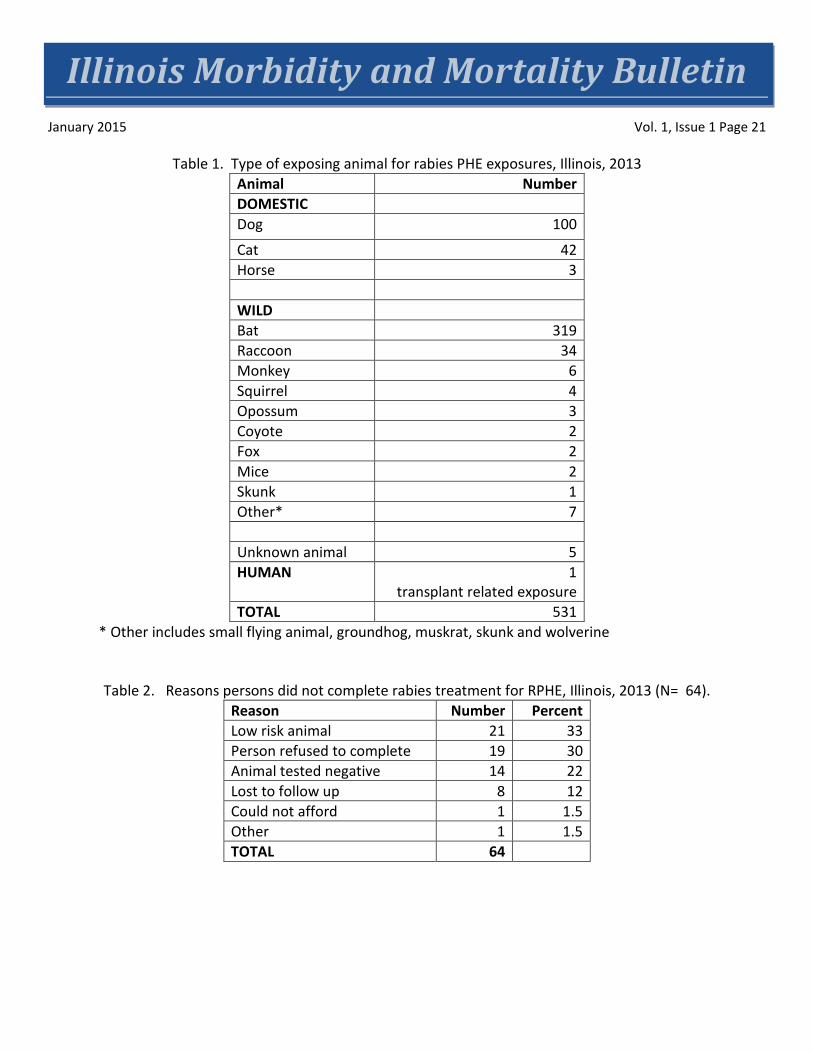
Results General There were 531 RPHE reported in 2013 with 466 persons started on rabies PEP. The incidence of reported rabies PEP in Illinois was 3.63 per 100,000. Fifty-seven percent of the RPHE reports were in females. Ages ranged from younger than 1 year to 89 years of age (mean = 34 years). Most exposures (71%) took place between May and September. Persons with RPHE were reported from 50 Illinois counties. There were 393 animals that exposed the 531 people (mean number of people exposed per animal = 1.35; range 1 person to 10 persons). Types of exposures The types of exposures reported included bite (230, 44%), non-bite (224, 42%), non-exposure (73, 14%) and insufficient information to classify (4). The type of exposing animal was wild (380, 72%), domestic (145, 27%), unknown type of animal (5, 0.9%) and one person was exposed through receipt of a transplant from a rabies infected person (Table 1). The most common wild animals exposing people were bats and raccoons. Dogs, followed by cats, were the most common exposing domestic animal species. Of the 108 bite exposures from dogs and cats with type of bite identified, 77 (69%) were provoked and 31 (29%) were unprovoked. Disposition of exposing animals Animals were unavailable for confinement or testing in 68 percent of domestic animal exposures and for testing in 70 percent of wild animal exposures. Bats were captured but released rather than being tested in 43 situations. Twenty-nine percent of exposing wild animals and 8 percent of exposing domestic animals were tested for rabies. In 53 exposure situations, the animal exposing a person was rabies positive. Multiple people may have been exposed to the same rabid animal. Rabies PEP Administration of rabies PEP in the state took place mainly in hospital emergency departments or associated areas in the hospital (64% of administrations). Rabies PEP was completed in 382 (86%) of 466 people who started on rabies PEP. In 64 persons (14%) rabies PEP was not completed. Reasons for not completing rabies PEP are shown in Table 2. The three primary reasons for non-completion of rabies PEP were low-risk animal exposures, person refused completion or the exposing animal tested negative. Thirty persons recommended for rabies PEP refused to be treated. None developed rabies. Fifteen decliners had woken up to a bat in the room.
Illinois Morbidity and Mortality Bulletin January 2015 Vol. 1, Issue 1 Page 17
The rabies PEP recommendation was made by:
• Both public health and health care provider; 142 (38%) • Health care provider; 142 (38%) • Public health personnel; 72 (19%) • Other; 11 (3%)
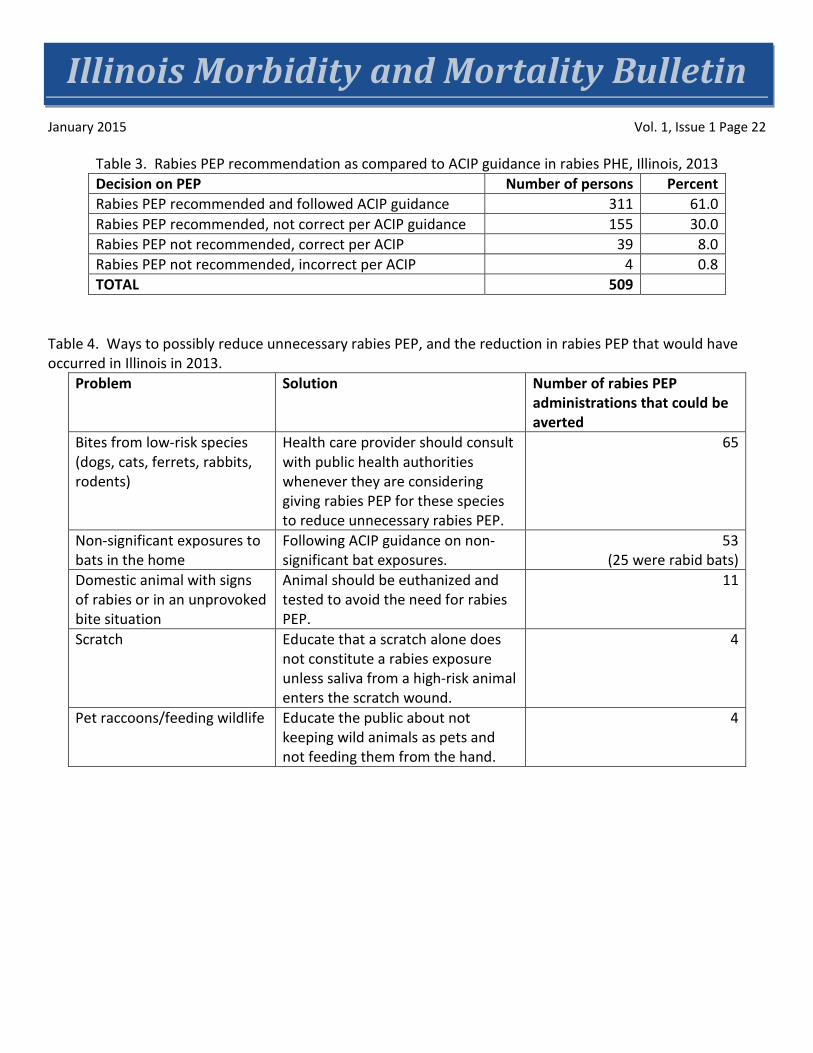
For 509 of 531 (96%) of exposed persons, it was possible to determine if the rabies PEP recommendation followed ACIP guidelines (Table 3). For 61 percent of individuals, PEP was recommended and this followed ACIP guidelines. Exposures were due to wild animals (256), domestic animals (45), unknown animal type (9) and a human due to a transplant (1). Most wild animal exposures were due to bats (210), followed by raccoons (30). The most common bat exposures were due to someone waking to a bat in the room (136), bite (38), physical contact (27), unable to say whether bitten (8) and possible bite mark (1). For 30 percent of individuals, rabies PEP was recommended, but did not meet ACIP guidelines. The four most common situations for this incorrect recommendation was a provoked bite from a healthy domestic animal (63), untested bat in a building with no significant exposures (28), rabid bat in building with no significant exposures requiring rabies PEP (25) and animal tested negative for rabies (22). When public health authorities were involved, 66 percent of recommendations for rabies PEP were correct as compared to 48 percent of the time when health care providers made the recommendation without public health input. For four individuals, rabies PEP should have been recommended, but was not. Three individuals woke up to a bat in the room and one was bitten in an unprovoked manner by a dog. None of the four individuals developed rabies. Rabies PEP Completeness and Administration Of the 466 persons who started rabies PEP, 382 of 446 (86%) completed rabies PEP. For 91 of 243 (37%) persons completing rabies PEP and with information available, the ACIP rabies administration protocol was followed exactly. Of the rabies PEP completers, there were 152 people who had incorrect administration of rabies PEP. Types of incorrect administration were incorrect timing of injections (67, 44%), incorrect site of administration of injections (52, 34%), multiple problems (26, 17%), no RIG given (5, 3%), and other issues (3, 2%). The most common incorrect site for vaccination and RIG administration was the gluteus.
Illinois Morbidity and Mortality Bulletin January 2015 Vol. 1, Issue 1 Page 18
Discussion General The incidence of reported rabies PEP in Illinois (3.63 per 100,000) was far lower than in South Carolina (10.6 per 100,000) or New York (27 per 100,000).4,5 The lower incidence in Illinois is probably related to the lack of terrestrial animal rabies in Illinois as compared to New York or South Carolina, which both have terrestrial animal rabies. Rabies is a disease with one of the highest fatality rates, so prevention of exposures and initiation of appropriate rabies PEP, when needed, is critical. The goals for animal exposures should be to:
• Educate the public to avoid contact with wild or unfamiliar animals. • If an exposure takes place, obtain animal for confinement or testing, as appropriate for the species
involved. • Ensure appropriate recommendations are made to the exposed person about whether rabies PEP is
needed. • Provide appropriate administration of rabies PEP, when necessary.
Types of exposures Both bite and non-bite exposures are common with animal exposures. Wild animals, especially bats and raccoons cause the majority of the exposures. Most dog and cats bites reported as RPHE are low risk provoked bites. Disposition of exposing animals It is important that members of the public know to cover a bat in the home with a container until they can contact animal control and public health to determine if the bat needs to be tested for rabies. Bats are a protected species, but can be submitted for rabies testing when a human or domestic animal exposure is known to have occurred. In 2013, 43 persons in Illinois received rabies PEP because, although they had captured the bat, they released it without testing. Ninety-three to 97 percent of bats captured will test negative for rabies. Therefore, it is important to submit exposing bats for rabies testing to reduce unnecessary rabies PEP administration. Rabies PEP If an exposure to a suspect or confirmed rabid animal occurs, rabies PEP can be administered to exposed persons to prevent the development of rabies. Some exposures reflect a clear need for rabies PEP (e.g., bite from a rabid animal). Some exposures clearly do not signal the need for rabies PEP (provoked bite from a healthy dog, cat or ferret, or bite from a small rodent). Most dog and cat bites are provoked bites from healthy animals. In addition, the last time a dog or cat tested positive for rabies in the state was 21 years ago. These types of bites should not result in a rabies PEP recommendation.

Illinois Morbidity and Mortality Bulletin January 2015 Vol. 1, Issue 1 Page 19
However, the challenge in rabies risk assessment is in determining whether rabies PEP is recommended for intermediate situations. Many risk assessors do not feel completely comfortable with the non-significant bat exposure recommendations in the ACIP. There is an overuse of rabies PEP due to bites from low-risk animals, in situations where the exposing animal tests negative and from lack of comfort with bat exposures that do not meet the ACIP criteria for a recommendation for rabies PEP. Both public health authorities and health care providers experience discomfort when following ACIP guidance on non-significant bat exposures, especially when the bat is rabid. Examples of these non-significant exposures include when:
• A bat is found in a home, but no one is bitten, no one has physical contact with the bat and there were no persons who would not be able to say if they were exposed.
• Person(s) woke up to a bat in the room, other bedroom doors were open, but there is concern for these persons asleep in other rooms.
• A bat is seen in the house, but no exposures. Later, a person reports a “mark” on the body. • A bat is found in a bedroom, but not when someone is asleep.
Ways to reduce unnecessary rabies PEP are illustrated in Table 4. Education of health care providers on risk assessments for animal exposures should be focused on emergency department personnel since that is where most rabies PEP is administered. Another way to reduce unnecessary rabies PEP is getting high-risk animals in for rabies testing. If the animal tests negative, no rabies PEP would be recommended. ACIP guidance may need to be clarified to better explain what bat exposures are considered significant. Rabies PEP Completeness and Administration When rabies PEP is necessary per ACIP guidelines, all persons should be encouraged to complete the series. The specific reasons why 19 persons refused to complete PEP were not known. If possible, health care providers and health department personnel should establish why the person does not want to complete and remind the person why it is important to complete rabies PEP. Rabies PEP administration is complicated for persons who have not been previously treated for rabies or pre-exposure vaccinated due to the schedule (rabies immune globulin (RIG) and vaccine on Day 0; subsequent vaccinations on Days 3, 7 and 14; and a 5th dose on day 28, if the person is immunosuppressed). The appropriate site for vaccine administration is the deltoid (or the thigh in small children). The site of RIG administration should be at the site of the bite, if a bite occurred and if it is possible to give the volume at that site, and the rest of the RIG in the deltoid, opposite arm from where vaccine was given. The most common incorrect site for administration of RIG and vaccine is the gluteus. Administration in the gluteus is not recommended due to possible injury to the sciatic nerves and the possibility of delivery to fat deposits rather than intramuscular delivery. There may be a diminished response to vaccination if it is not given intramuscularly. A repeat rabies vaccination can be given when the vaccine has been incorrectly administered in the gluteus. Because these are not commonly administered products, errors in times and site of administration occur. Health care providers should consult with vaccine or RIG manufacturer labels and the ACIP for administration guidance. These should be readily available in emergency departments where most rabies PEP is administered. It can be difficult to follow the vaccination intervals exactly due to scheduling
Illinois Morbidity and Mortality Bulletin January 2015 Vol. 1, Issue 1 Page 20
difficulties. Although health care providers should follow the correct schedule, a few days deviation from the vaccination schedule should probably not affect the protection from rabies vaccine. This study illustrates that improvements can be made in the state to reduce unnecessary rabies PEP and to improve correct administration of rabies PEP. Ways to reduce unnecessary rabies PEP could include education to health care providers and public health professionals on correctly identifying when rabies PEP should be recommended for animal exposures. Changes to the language in the ACIP might assist health care providers and public health authorities in the interpretation of non-significant bat exposures which are an area of particular concern and constitute the majority of the unnecessary administration of rabies PEP.6,7 Health care providers in the state should also be aware of the very low risk associated with provoked bites from healthy dogs and cats in the state and that it has been 21 years since a dog or cat has tested positive for rabies in Illinois. Author Affiliations 1Illinois Department of Public Health, Office of Health Protection, Division of Infectious Diseases Acknowledgements I would like to acknowledge the hard work health care workers in hospitals and local health departments put in to report possible rabies exposures in Illinois. References
1. Manning, S.E. et. al. Human Rabies Prevention – United States, 2008. Recommendations of the Advisory Committee on Immunization Practices. MMWR 2008; 57:1-26,28.
2. Rupprecht, C.S., et. al. Use of a reduced (4-dose) vaccine schedule for post-exposure prophylaxis to prevent human rabies. Recommendations of the Advisory Committee on Immunization Practices. MMWR 2010; 59(RR-2). 1-9.
3. Wang, X., Et. al. Bat rabies in Massachusetts, USA, 1985-2009. Emerg Inf Dis 2010; 16(8): 1285-88.
4. O’Bell, S.A., et. al. Human rabies exposures and post-exposure prophylaxis in South Carolina, 1993-2002. Pub Health Reports. 2006;121: 197-202.
5. Blanton, J.D. et. al. Rabies post-exposure prophylaxis, New York, 1995-2000. EID 2005; 11(12):1-14.
6. Hudt, C., et. al. the cost of preventing rabies at any cost: Post-exposure prophylaxis for occult bat contact. Vaccine 2008; 26:4446-4450.
7. DeSerres, G. , et. al. Bats in the bedroom, bats in the belfry: Reanalysis of the rationale for rabies post exposure prophylaxis. CID 2009; 48:1493-9.
Illinois Morbidity and Mortality Bulletin January 2015 Vol. 1, Issue 1 Page 21
Table 1. Type of exposing animal for rabies PHE exposures, Illinois, 2013 Animal Number DOMESTIC Dog 100
Cat 42 Horse 3 WILD Bat 319 Raccoon 34 Monkey 6 Squirrel 4 Opossum 3 Coyote 2 Fox 2 Mice 2 Skunk 1 Other* 7 Unknown animal 5 HUMAN 1
transplant related exposure TOTAL 531
* Other includes small flying animal, groundhog, muskrat, skunk and wolverine
Table 2. Reasons persons did not complete rabies treatment for RPHE, Illinois, 2013 (N= 64). Reason Number Percent Low risk animal 21 33 Person refused to complete 19 30 Animal tested negative 14 22 Lost to follow up 8 12 Could not afford 1 1.5 Other 1 1.5 TOTAL 64
Illinois Morbidity and Mortality Bulletin January 2015 Vol. 1, Issue 1 Page 22
Table 3. Rabies PEP recommendation as compared to ACIP guidance in rabies PHE, Illinois, 2013 Decision on PEP Number of persons Percent Rabies PEP recommended and followed ACIP guidance 311 61.0 Rabies PEP recommended, not correct per ACIP guidance 155 30.0 Rabies PEP not recommended, correct per ACIP 39 8.0 Rabies PEP not recommended, incorrect per ACIP 4 0.8 TOTAL 509
Table 4. Ways to possibly reduce unnecessary rabies PEP, and the reduction in rabies PEP that would have occurred in Illinois in 2013.
Problem Solution Number of rabies PEP administrations that could be averted
Bites from low-risk species (dogs, cats, ferrets, rabbits, rodents)
Health care provider should consult with public health authorities whenever they are considering giving rabies PEP for these species to reduce unnecessary rabies PEP.
65
Non-significant exposures to bats in the home
Following ACIP guidance on non-significant bat exposures.
53 (25 were rabid bats)
Domestic animal with signs of rabies or in an unprovoked bite situation
Animal should be euthanized and tested to avoid the need for rabies PEP.
11
Scratch Educate that a scratch alone does not constitute a rabies exposure unless saliva from a high-risk animal enters the scratch wound.
4
Pet raccoons/feeding wildlife Educate the public about not keeping wild animals as pets and not feeding them from the hand.
4
Illinois Morbidity and Mortality Bulletin January 2015 Vol. 1, Issue 1 Page 23
Life Expectancies for Illinois, Chicago and Illinois Counties for 1989-1991 and 2009-2011
Mohammed Shahidullah, PhD, MPH1
Nelson Agbodo, MS, MPH2
Abstract Life expectancy, a widely used summary indicator of human health and development, measures longevity of a population over time. This report provides life expectancy estimates by age and sex for Illinois, Chicago and, for the first time, Illinois counties for 1989-1991 and 2009-2011. In Illinois, life expectancy at birth has significantly improved for males and females at the state level, going from 71.37 years in 1990 to 76.64 years in 2010 for males and 78.37 years to 81.64 years for females. Over the same period, life expectancy at birth has improved in 94 out of 102 counties and in the city of Chicago. In Chicago, the number of years added were 7.26 for both sexes, 8.61 for males and 5.70 years for females. Among counties, the minimum years added was 0.12 years and the maximum was 5.73 years. The maximum years of life expectancy at birth for both sexes was observed in Cook County where males gained 6.73 and females gained 4.63 additional years. Introduction Life expectancy, as a measure of longevity of a population over time, is used for many purposes, including measuring the overall health of a community, evaluating health disparity and program performance, setting health objectives for a community, and estimating single mortality indexes for countries, states and communities.1 Survivorships can be computed from life tables and be used to produce population projections. This report presents life expectancies computed for the state of Illinois, its counties and the city of Chicago for the periods 1989-1991 and 2009-2011.
Data and Methods There are two types of life tables – cohort/generational and current/period life tables. Cohort life tables are constructed using mortality experience of the cohort and may not be useful for the cohort itself because every member of the cohort has to die before such a table can be constructed. A current or period life table uses current mortality experience applied to a cohort of births to compute the life table. On the basis of age intervals, life tables can also be classified as a complete or an abridged life table. A complete life table uses exact single years and an abridged life table uses age intervals. Five-year age interval abridged current life tables were used in this report. Computation of an abridged life table from which life expectancy is derived requires mainly population and death data. In this report, population data consist of the 1990 and 2010 U.S. Census counts of residents of each Illinois county and the city of Chicago. These data were aggregated into five-year age groups and by sex, and were used as denominators in computing mortality rates. The death data were received from the Illinois Vital Records System (IVRS). The number of deaths by sex and specific age for each county were obtained from 1989 to 2011 and aggregated at county level by five-year age groups for each sex. Three-year averages were then computed for the periods 1989-1991 and 2009-2011 and were used as numerators in computing mortality rates.
Illinois Morbidity and Mortality Bulletin January 2015 Vol. 1, Issue 1 Page 24
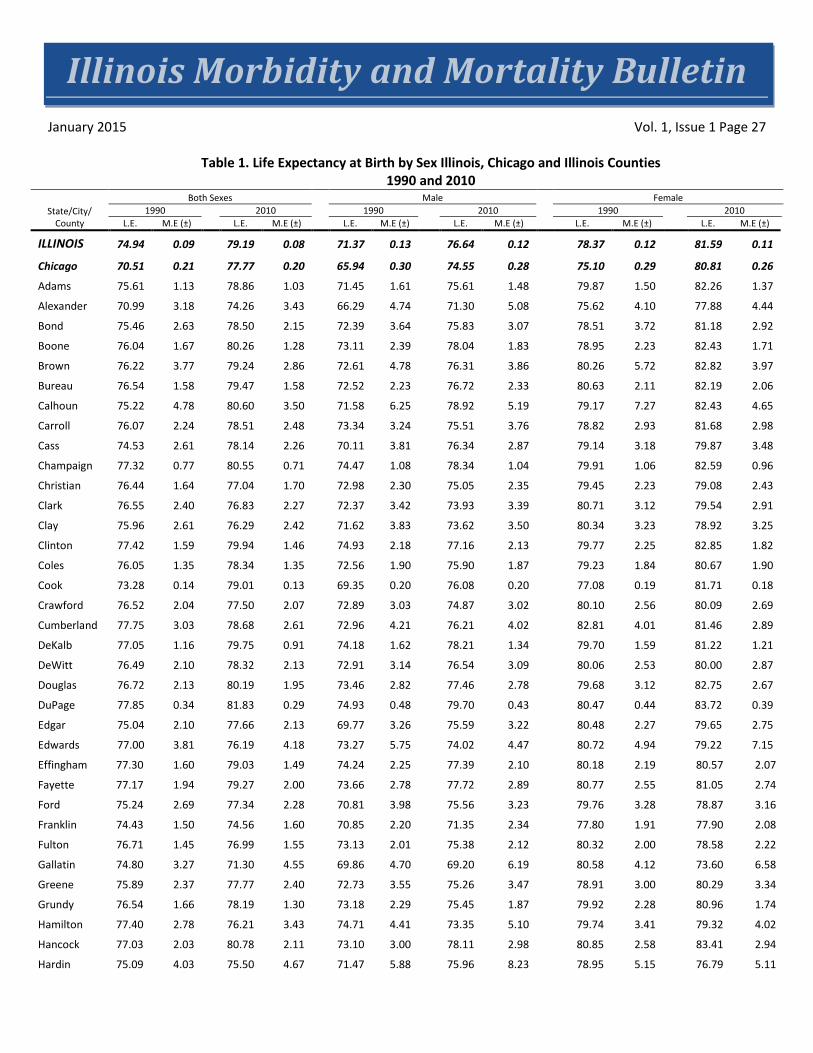
Chiang’s Method II was used to construct life tables.2 The method assumes a homogeneous population in which all individuals are subjected to the same force of mortality, and in which survival of an individual is independent of the survival of any other individual in the group. Margin of errors were computed to provide a basis for evaluating the precision of the estimated life expectancies. Under the assumption that populations in each life expectancy estimate year were near stationary, we investigated the question of the significance of differences between estimated life expectancies by using a Z-test. Results Life Expectancy at Birth Life expectancy at birth is the average number of years a newborn could expect to live. In Illinois, the expectation of life at birth (Table 1) for the general population (𝐿𝐸0
𝑝) was 74.94 years in 1990, and 79.19 years in 2010. By sex, males’ life expectancy at birth (𝐿𝐸0𝑚) was 71.37 years in 1990, and 76.64 years in 2010. As expected, females’ life expectancy (𝐿𝐸0
𝑓) was higher than that of males, with life expectancy (𝐿𝐸0𝑓) being 78.37 years in
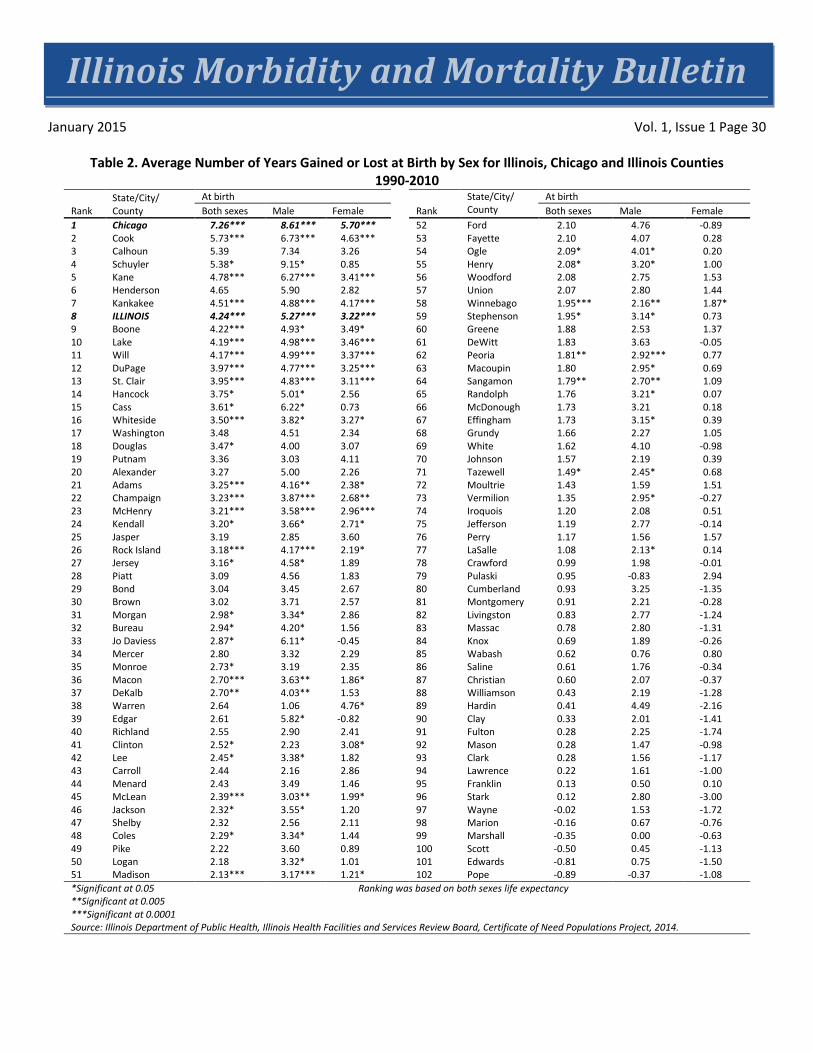
1990 and 81.59 years in 2010. For Chicago, overall life expectancy was lower than that of the state as a whole, with 70.51 years in 1990 and 77.77 in 2010 for both sexes. The difference, however, shrunk over the two decades from 4.43 years in 1990 to 1.42 years in 2010. Similar differences and changes over time also were observed for males and females in Chicago. Among counties, a wide range of variations in life expectancy existed in 1990 and 2010. For both sexes, 13 counties had a life expectancy at birth lower than 75 years in 1990 and this number decreased to five counties in 2010 (Figure 1). In 1990, 58 counties had males' life expectancy at birth lower than 73 years and that number of counties reduced to six by 2010 (Figure 2). In 1990, nine counties had life expectancy at birth for females lower than 78 years; in 2010, this number decreased to eight (Figure 3). Changes in Life Expectancy Over Time Over the period 1990 to 2010, the state, Chicago and 94 out of 102 counties increased their residents’ life expectancy at birth. At the state level, 4.24 years were added to life expectancy for both sexes, 5.27 years for males and 3.22 years for females. In Chicago, the numbers of years added were 7.26 for both sexes, 8.61 for males and 5.70 years for females. The number of years gained were statistically significant (Table 2). At the county level, the minimum years added was 0.12 years (about 1.5 months) and the maximum was 5.73 years (about 5 years, 8 months). The maximum years of life expectancy at birth for both sexes was observed in Cook County where males gained 6.73 and females gained 4.63 additional years. More counties added years to life expectancy for males than females, 97 counties versus 71. In term of number of years added, males have gained more years (9.2 years with a minimum of 0.5 years) than females (4.8 years with a minimum of 25 days).
Illinois Morbidity and Mortality Bulletin January 2015 Vol. 1, Issue 1 Page 25
Discussion and Limitations Life expectancy at birth is a commonly used and meaningful indicator for evaluating the health status and improvement of population health. This report shows improvement of this indicator for the state of Illinois, in 92 percent of its counties, and for the city of Chicago. Although not presented, the report provides life expectancies for every five years of age from age 0 to age 85 for the state, the city of Chicago and all the 102 counties, which could be useful for setting or evaluating health improvement programs for specific age and gender groups.
There are three key findings from this report regarding life expectancies at birth:
• Overall improvement for both males and females. • Existence of regional disparities in life expectancy . • Greater improvement in life expectancy among males than among females from 1990 to 2010.
These findings were consistent to those revealed by life tables of the U.S., North Carolina and its counties.3,4
This report has limitations. Deaths and population data used have been verified and found to be of reasonable quality; however, as it is possible, these data may still contain biases and errors inherent to data collections (undercount, reporting errors, missing data, data entry errors, etc.). Also, death data for 2011 were preliminary; so minor discrepancies in data used for this report and data published later by the Illinois Department of Public Health's Division of Vital Records may be expected.
Chiang’s method is recommended for population size of 10,000 or greater.5 Methodologies were evaluated for the estimation of small area life expectancy in the United Kingdom (UK).6,7,8 Eayres and Williams, on the basis of their research on Monte Carlo simulations in estimating small area life expectancies for England, recommended the use of a minimum population size of 5,000 with reasonable confidence intervals.8 They also found life expectancy estimates of small population were normally distributed and the standard error estimates were normally distributed for large population, but became increasingly skewed as the population size decreased and few or no deaths in some age groups occurred. A small number of Illinois counties (i.e., Pope, Hardin, Calhoun, Scott, Putnam, Brown, Stark, Gallatin, Edwards, Schuyler, Pulaski, Henderson and Hamilton) had small sizes of population ranging from 4,373 to 8,499 in 1990 and 4,320 to 8,457 in 2010. As a result, the estimated life expectancies for these counties have wide confidence intervals. Reliabilities of the life expectancy estimates should always be considered before their use for health planning or program evaluation.
Author Affiliations 1 Illinois Department of Public Health, Office of Health Informatics, Illinois Center for Health Statistics 2 Illinois Department of Public Health, Office of Policy, Planning and Statistics, Illinois Health Facilities and Services Review Board
Illinois Morbidity and Mortality Bulletin January 2015 Vol. 1, Issue 1 Page 26
Acknowledgments Bill Dart and Mike Mitchell, Office of Health Policy and Planning; Courtney Avery, Health Facilities and Services Review Board; John Tharp, Tiefu Shen and Tom Szpyrka, Office of Health Informatics.
References 1. Shryock Henry S and Siegeel JS. 1976. Chapter 5: The Life Table. In Edward G. Stockwell (Condensed
Edition), The Methods and Materials of Demography, New York: Academic Press.
2. Chiang CL. The life table and its applications. Malabar, Florida: Robert E. Krieger Publishing Company: 1984.
3. Wei Rong, Anderson RN, Curtin LR and Arias E. U.S. decennial life tables for 1999-2001: state life tables. National Vital Statistics Report 2012;60:1-68.
4. North Carolina Center for Health Statistics, 2013 State of North Carolina and 2001-2013 county life expectancy at birth, 2014. Available at http://www.schs.state.nc.us/data/lifexpectancy/2001-2013/2013%20State%20and%202011-2013%20County%20Life%20Expectancies%20at%20birth.html.
5. Scherbob S and Ediev D. 2011. Significance of life table estimates for small populations: simulation–based study of standard errors. Demographic Research, 24(22):527-550 downloaded from http:www.demographic-research.org/Volumes/Vol24/22/.
6. Silcocks PBS, Jenner DA and Reza R. 2001. Life expectancy as a summary of mortality in a population: statistical considerations and suitability for use by health authorities. Journal of Epidemiology and Community Health, 55:38-43.
7. Toson B, Baker A and the Office of National Statistics. 2003. Life expectancies at birth: Methodological Series, 33:1-27. Downloaded from http://statistics.gov.uk/downloads/theme_ other/GSSMethodology_No_33.pdf.
8. Eayres D and Williams ES. 2004. Evaluation of methodologies for small area life expectancy evaluation. Journal of Epidemiology and Community Health, 58:243-249.
Illinois Morbidity and Mortality Bulletin January 2015 Vol. 1, Issue 1 Page 27
Table 1. Life Expectancy at Birth by Sex Illinois, Chicago and Illinois Counties 1990 and 2010
State/City/ County
Both Sexes Male Female 1990
2010
1990
2010
1990
2010
L.E. M.E (±) L.E. M.E (±) L.E. M.E (±) L.E. M.E (±) L.E. M.E (±) L.E. M.E (±)
ILLINOIS 74.94 0.09
79.19 0.08
71.37 0.13
76.64 0.12
78.37 0.12
81.59 0.11
Chicago 70.51 0.21
77.77 0.20
65.94 0.30
74.55 0.28
75.10 0.29
80.81 0.26
Adams 75.61 1.13
78.86 1.03
71.45 1.61
75.61 1.48
79.87 1.50
82.26 1.37
Alexander 70.99 3.18
74.26 3.43
66.29 4.74
71.30 5.08
75.62 4.10
77.88 4.44
Bond 75.46 2.63
78.50 2.15
72.39 3.64
75.83 3.07
78.51 3.72
81.18 2.92
Boone 76.04 1.67
80.26 1.28
73.11 2.39
78.04 1.83
78.95 2.23
82.43 1.71
Brown 76.22 3.77
79.24 2.86
72.61 4.78
76.31 3.86
80.26 5.72
82.82 3.97
Bureau 76.54 1.58
79.47 1.58
72.52 2.23
76.72 2.33
80.63 2.11
82.19 2.06
Calhoun 75.22 4.78
80.60 3.50
71.58 6.25
78.92 5.19
79.17 7.27
82.43 4.65
Carroll 76.07 2.24
78.51 2.48
73.34 3.24
75.51 3.76
78.82 2.93
81.68 2.98
Cass 74.53 2.61
78.14 2.26
70.11 3.81
76.34 2.87
79.14 3.18
79.87 3.48
Champaign 77.32 0.77
80.55 0.71
74.47 1.08
78.34 1.04
79.91 1.06
82.59 0.96
Christian 76.44 1.64
77.04 1.70
72.98 2.30
75.05 2.35
79.45 2.23
79.08 2.43
Clark 76.55 2.40
76.83 2.27
72.37 3.42
73.93 3.39
80.71 3.12
79.54 2.91
Clay 75.96 2.61
76.29 2.42
71.62 3.83
73.62 3.50
80.34 3.23
78.92 3.25
Clinton 77.42 1.59
79.94 1.46
74.93 2.18
77.16 2.13
79.77 2.25
82.85 1.82
Coles 76.05 1.35
78.34 1.35
72.56 1.90
75.90 1.87
79.23 1.84
80.67 1.90
Cook 73.28 0.14
79.01 0.13
69.35 0.20
76.08 0.20
77.08 0.19
81.71 0.18
Crawford 76.52 2.04
77.50 2.07
72.89 3.03
74.87 3.02
80.10 2.56
80.09 2.69
Cumberland 77.75 3.03
78.68 2.61
72.96 4.21
76.21 4.02
82.81 4.01
81.46 2.89
DeKalb 77.05 1.16
79.75 0.91
74.18 1.62
78.21 1.34
79.70 1.59
81.22 1.21
DeWitt 76.49 2.10
78.32 2.13
72.91 3.14
76.54 3.09
80.06 2.53
80.00 2.87
Douglas 76.72 2.13
80.19 1.95
73.46 2.82
77.46 2.78
79.68 3.12
82.75 2.67
DuPage 77.85 0.34
81.83 0.29
74.93 0.48
79.70 0.43
80.47 0.44
83.72 0.39
Edgar 75.04 2.10
77.66 2.13
69.77 3.26
75.59 3.22
80.48 2.27
79.65 2.75
Edwards 77.00 3.81
76.19 4.18
73.27 5.75
74.02 4.47
80.72 4.94
79.22 7.15
Effingham 77.30 1.60
79.03 1.49
74.24 2.25
77.39 2.10
80.18 2.19
80.57 2.07
Fayette 77.17 1.94 79.27 2.00 73.66 2.78 77.72 2.89 80.77 2.55 81.05 2.74
Ford 75.24 2.69 77.34 2.28 70.81 3.98 75.56 3.23 79.76 3.28 78.87 3.16
Franklin 74.43 1.50 74.56 1.60 70.85 2.20 71.35 2.34 77.80 1.91 77.90 2.08
Fulton 76.71 1.45 76.99 1.55 73.13 2.01 75.38 2.12 80.32 2.00 78.58 2.22
Gallatin 74.80 3.27 71.30 4.55 69.86 4.70 69.20 6.19 80.58 4.12 73.60 6.58
Greene 75.89 2.37 77.77 2.40 72.73 3.55 75.26 3.47 78.91 3.00 80.29 3.34
Grundy 76.54 1.66 78.19 1.30 73.18 2.29 75.45 1.87 79.92 2.28 80.96 1.74
Hamilton 77.40 2.78 76.21 3.43 74.71 4.41 73.35 5.10 79.74 3.41 79.32 4.02
Hancock 77.03 2.03 80.78 2.11 73.10 3.00 78.11 2.98 80.85 2.58 83.41 2.94
Hardin 75.09 4.03 75.50 4.67 71.47 5.88 75.96 8.23 78.95 5.15 76.79 5.11
Illinois Morbidity and Mortality Bulletin January 2015 Vol. 1, Issue 1 Page 28
State/City/ County
Both Sexes Male Female 1990
2010
1990
2010
1990
2010
L.E. M.E (±) L.E. M.E (±) L.E. M.E (±) L.E. M.E (±) L.E. M.E (±) L.E. M.E (±)
Henderson 76.07 3.39 80.72 3.06 72.75 4.43 78.65 4.04 79.91 5.11 82.73 4.53
Henry 77.03 1.28 79.11 1.23 73.36 1.79 76.56 1.83 80.67 1.75 81.67 1.54
Iroquois 76.46 1.78 77.66 1.64 73.11 2.57 75.19 2.27 79.59 2.38 80.10 2.32
Jackson 75.73 1.36 78.05 1.36 72.32 1.94 75.87 1.92 78.94 1.81 80.14 1.90
Jasper 77.16 2.78 80.35 2.88 74.21 3.96 77.06 4.35 80.22 3.77 83.82 3.52
Jefferson 75.37 1.57 76.56 1.52 71.43 2.25 74.20 2.11 79.25 2.08 79.11 2.14
Jersey 74.89 2.13 78.05 1.85 71.62 3.17 76.20 2.63 78.05 2.72 79.93 2.53
Jo Daviess 78.41 1.98 81.28 1.75 74.55 2.83 80.66 2.46 82.40 2.56 81.95 2.53
Johnson 75.92 2.69 77.49 2.89 73.29 3.58 75.48 4.28 79.11 3.89 79.50 3.96
Kane 76.18 0.56 80.96 0.42 72.98 0.78 79.25 0.61 79.13 0.76 82.54 0.56
Kankakee 73.37 1.00 77.88 0.88 70.20 1.41 75.08 1.27 76.50 1.39 80.68 1.17
Kendall 77.81 1.58 81.01 0.95 74.92 2.14 78.58 1.35 80.59 2.23 83.30 1.28
Knox 76.24 1.26 76.94 1.37 72.95 1.75 74.84 1.88 79.37 1.76 79.11 1.95
Lake 77.16 0.43 81.34 0.35 74.68 0.60 79.65 0.52 79.46 0.59 82.91 0.48
LaSalle 76.62 0.88 77.70 0.89 73.40 1.22 75.52 1.26 79.72 1.19 79.86 1.21
Lawrence 74.46 2.52 74.69 2.46 71.92 3.39 73.53 3.57 76.70 3.63 75.71 3.46
Lee 76.06 1.58 78.51 1.53 72.77 2.21 76.15 2.18 79.33 2.15 81.15 2.02
Livingston 76.64 1.53 77.47 1.58 72.94 2.21 75.71 2.25 80.36 1.96 79.12 2.19
Logan 76.46 1.60 78.64 1.68 72.86 2.19 76.17 2.35 80.05 2.16 81.06 2.35
McDonough 77.78 1.74 79.51 1.80 74.71 2.56 77.92 2.32 80.56 2.19 80.74 2.78
McHenry 76.93 0.70 80.14 0.52 74.46 0.98 78.04 0.76 79.22 0.96 82.18 0.67
McLean 77.55 0.85 79.94 0.75 74.50 1.18 77.53 1.10 80.21 1.16 82.20 0.99
Macon 75.29 0.89 78.00 0.92 71.48 1.27 75.11 1.35 78.89 1.19 80.75 1.21
Macoupin 76.09 1.30 77.89 1.34 72.97 1.86 75.92 1.95 79.05 1.75 79.74 1.81
Madison 75.24 0.60 77.37 0.56 71.57 0.85 74.74 0.83 78.72 0.80 79.92 0.74
Marion 75.31 1.39 75.15 1.51 71.94 1.99 72.61 2.16 78.47 1.85 77.71 2.07
Marshall 77.66 2.65 77.31 2.72 74.97 3.47 74.97 4.24 80.28 3.85 79.65 3.44
Mason 75.72 2.41 76.00 2.70 72.58 3.39 74.05 3.95 78.90 3.33 77.91 3.59
Massac 75.01 2.50 75.79 2.38 70.62 3.81 73.41 3.49 79.33 3.02 78.01 3.21
Menard 76.20 2.80 78.63 2.56 73.29 4.14 76.77 3.50 78.80 3.67 80.26 3.82
Mercer 77.28 2.33 80.08 2.24 73.81 3.38 77.13 3.46 80.70 3.08 82.99 2.73
Monroe 77.64 1.79 80.37 1.54 74.71 2.51 77.91 2.40 80.47 2.46 82.82 1.83
Montgomery 76.27 1.69 77.18 1.79 72.95 2.28 75.16 2.45 79.56 2.38 79.27 2.58
Morgan 75.94 1.57 78.92 1.44 72.81 2.17 76.15 1.96 78.78 2.17 81.65 2.03
Moultrie 76.43 2.41 77.86 2.33 73.22 3.56 74.81 3.54 79.41 3.14 80.92 2.87
Ogle 77.44 1.41 79.53 1.28 74.03 1.98 78.04 1.83 80.84 1.91 81.04 1.77
Peoria 76.06 0.70 77.87 0.70 72.26 1.00 75.18 1.01 79.66 0.92 80.43 0.95
Perry 76.69 1.92 77.86 1.82 73.09 2.52 74.65 2.43 80.12 2.81 81.69 2.47
Piatt 76.57 2.34 79.66 2.19 72.88 3.28 77.44 3.33 80.16 3.16 81.99 2.59
Illinois Morbidity and Mortality Bulletin January 2015 Vol. 1, Issue 1 Page 29
State/City/ County
Both Sexes Male Female 1990
2010
1990
2010
1990
2010
L.E. M.E (±) L.E. M.E (±) L.E. M.E (±) L.E. M.E (±) L.E. M.E (±) L.E. M.E (±)
Pike 76.84 2.29 79.06 2.01 73.20 3.53 76.79 2.68 80.42 2.78 81.31 2.93
Pope 79.01 3.10 78.12 4.99 76.55 4.59 76.19 7.31 81.81 3.83 80.74 5.34
Pulaski 75.03 3.39 75.99 3.51 73.02 4.82 72.19 5.56 76.84 4.63 79.78 4.01
Putnam 77.62 3.76 80.99 3.65 74.23 5.10 77.26 5.33 81.29 5.34 85.40 5.47
Randolph 75.44 1.65 77.19 1.57 71.89 2.32 75.10 2.07 79.39 2.20 79.46 2.34
Richland 76.71 2.33 79.26 2.13 73.15 3.32 76.05 3.29 80.07 3.10 82.48 2.48
Rock Island 75.45 0.77 78.63 0.76 71.71 1.11 75.87 1.09 79.10 1.01 81.29 1.02
St. Clair 72.92 0.63 76.88 0.58 69.07 0.90 73.90 0.87 76.60 0.84 79.71 0.75
Saline 74.14 1.67 74.75 1.84 70.81 2.34 72.57 2.72 77.29 2.29 76.95 2.45
Sangamon 76.28 0.71 78.06 0.67 72.50 1.05 75.20 0.98 79.63 0.92 80.72 0.88
Schuyler 74.53 3.96 79.92 2.81 68.77 6.22 77.92 4.04 81.16 3.84 82.00 3.87
Scott 78.85 4.14 78.35 3.99 76.49 5.23 76.94 4.60 80.64 6.37 79.51 6.73
Shelby 77.39 1.97 79.71 1.93 74.17 2.88 76.73 2.68 80.67 2.54 82.78 2.75
Stark 77.15 3.73 77.27 3.82 72.83 5.96 75.63 5.43 81.44 4.35 78.45 5.73
Stephenson 77.59 1.37 79.53 1.32 73.86 1.97 77.00 1.88 81.15 1.82 81.88 1.80
Tazewell 77.10 0.82 78.59 0.74 73.91 1.19 76.36 1.08 80.08 1.07 80.76 0.99
Union 74.48 2.25 76.55 2.26 71.27 3.03 74.06 3.21 77.71 3.27 79.15 3.12
Vermilion 74.80 1.00 76.15 1.04 70.88 1.45 73.83 1.51 78.79 1.29 78.52 1.39
Wabash 76.48 2.46 77.09 2.69 73.52 3.36 74.28 3.83 79.17 3.46 79.96 3.57
Warren 76.38 2.13 79.02 2.05 73.85 2.94 74.91 3.11 78.63 3.02 83.39 2.35
Washington 76.35 2.48 79.83 2.54 72.77 3.55 77.29 3.84 80.09 3.30 82.43 3.22
Wayne 77.24 2.31 77.22 2.35 72.46 3.27 73.99 3.55 82.37 3.04 80.65 2.79
White 75.23 2.33 76.85 2.32 70.82 3.29 74.92 3.36 79.75 3.10 78.76 3.18
Whiteside 75.48 1.21 78.97 1.17 72.60 1.73 76.41 1.68 78.24 1.62 81.51 1.57
Will 75.68 0.52 79.85 0.37 72.61 0.73 77.59 0.54 78.60 0.71 81.97 0.50
Williamson 76.04 1.18 76.47 1.13 72.12 1.61 74.32 1.55 79.86 1.62 78.58 1.63
Winnebago 76.17 0.61 78.12 0.56 72.99 0.86 75.14 0.81 79.15 0.82 81.02 0.74
Woodford 78.34 1.64 80.42 1.38 75.61 2.34 78.36 2.07 80.83 2.22 82.36 1.78
L.E. = Life Expectancy; M.E. = Margin Error Source: Illinois Department of Public Health, Illinois Health Facilities and Services Review Board, Certificate of Need Populations Project, 2014
Illinois Morbidity and Mortality Bulletin January 2015 Vol. 1, Issue 1 Page 30
Table 2. Average Number of Years Gained or Lost at Birth by Sex for Illinois, Chicago and Illinois Counties 1990-2010
Rank State/City/ County
At birth State/City/ County
At birth Both sexes Male Female Rank Both sexes Male Female
1 Chicago 7.26*** 8.61*** 5.70***
52 Ford 2.10 4.76 -0.89 2 Cook 5.73*** 6.73*** 4.63***
53 Fayette 2.10 4.07 0.28
3 Calhoun 5.39 7.34 3.26
54 Ogle 2.09* 4.01* 0.20 4 Schuyler 5.38* 9.15* 0.85
55 Henry 2.08* 3.20* 1.00
5 Kane 4.78*** 6.27*** 3.41***
56 Woodford 2.08 2.75 1.53 6 Henderson 4.65 5.90 2.82
57 Union 2.07 2.80 1.44
7 Kankakee 4.51*** 4.88*** 4.17***
58 Winnebago 1.95*** 2.16** 1.87* 8 ILLINOIS 4.24*** 5.27*** 3.22***
59 Stephenson 1.95* 3.14* 0.73
9 Boone 4.22*** 4.93* 3.49*
60 Greene 1.88 2.53 1.37 10 Lake 4.19*** 4.98*** 3.46***
61 DeWitt 1.83 3.63 -0.05
11 Will 4.17*** 4.99*** 3.37***
62 Peoria 1.81** 2.92*** 0.77 12 DuPage 3.97*** 4.77*** 3.25***
63 Macoupin 1.80 2.95* 0.69
13 St. Clair 3.95*** 4.83*** 3.11***
64 Sangamon 1.79** 2.70** 1.09 14 Hancock 3.75* 5.01* 2.56
65 Randolph 1.76 3.21* 0.07
15 Cass 3.61* 6.22* 0.73
66 McDonough 1.73 3.21 0.18 16 Whiteside 3.50*** 3.82* 3.27*
67 Effingham 1.73 3.15* 0.39
17 Washington 3.48 4.51 2.34
68 Grundy 1.66 2.27 1.05 18 Douglas 3.47* 4.00 3.07
69 White 1.62 4.10 -0.98
19 Putnam 3.36 3.03 4.11
70 Johnson 1.57 2.19 0.39 20 Alexander 3.27 5.00 2.26
71 Tazewell 1.49* 2.45* 0.68
21 Adams 3.25*** 4.16** 2.38*
72 Moultrie 1.43 1.59 1.51 22 Champaign 3.23*** 3.87*** 2.68**
73 Vermilion 1.35 2.95* -0.27
23 McHenry 3.21*** 3.58*** 2.96***
74 Iroquois 1.20 2.08 0.51 24 Kendall 3.20* 3.66* 2.71*
75 Jefferson 1.19 2.77 -0.14
25 Jasper 3.19 2.85 3.60
76 Perry 1.17 1.56 1.57 26 Rock Island 3.18*** 4.17*** 2.19*
77 LaSalle 1.08 2.13* 0.14
27 Jersey 3.16* 4.58* 1.89
78 Crawford 0.99 1.98 -0.01 28 Piatt 3.09 4.56 1.83
79 Pulaski 0.95 -0.83 2.94
29 Bond 3.04 3.45 2.67
80 Cumberland 0.93 3.25 -1.35 30 Brown 3.02 3.71 2.57
81 Montgomery 0.91 2.21 -0.28
31 Morgan 2.98* 3.34* 2.86
82 Livingston 0.83 2.77 -1.24 32 Bureau 2.94* 4.20* 1.56
83 Massac 0.78 2.80 -1.31
33 Jo Daviess 2.87* 6.11* -0.45
84 Knox 0.69 1.89 -0.26 34 Mercer 2.80 3.32 2.29
85 Wabash 0.62 0.76 0.80
35 Monroe 2.73* 3.19 2.35
86 Saline 0.61 1.76 -0.34 36 Macon 2.70*** 3.63** 1.86*
87 Christian 0.60 2.07 -0.37
37 DeKalb 2.70** 4.03** 1.53
88 Williamson 0.43 2.19 -1.28 38 Warren 2.64 1.06 4.76*
89 Hardin 0.41 4.49 -2.16
39 Edgar 2.61 5.82* -0.82
90 Clay 0.33 2.01 -1.41 40 Richland 2.55 2.90 2.41
91 Fulton 0.28 2.25 -1.74
41 Clinton 2.52* 2.23 3.08*
92 Mason 0.28 1.47 -0.98 42 Lee 2.45* 3.38* 1.82
93 Clark 0.28 1.56 -1.17
43 Carroll 2.44 2.16 2.86
94 Lawrence 0.22 1.61 -1.00 44 Menard 2.43 3.49 1.46
95 Franklin 0.13 0.50 0.10
45 McLean 2.39*** 3.03** 1.99*
96 Stark 0.12 2.80 -3.00 46 Jackson 2.32* 3.55* 1.20
97 Wayne -0.02 1.53 -1.72
47 Shelby 2.32 2.56 2.11
98 Marion -0.16 0.67 -0.76 48 Coles 2.29* 3.34* 1.44
99 Marshall -0.35 0.00 -0.63
49 Pike 2.22 3.60 0.89
100 Scott -0.50 0.45 -1.13 50 Logan 2.18 3.32* 1.01
101 Edwards -0.81 0.75 -1.50
51 Madison 2.13*** 3.17*** 1.21*
102 Pope -0.89 -0.37 -1.08 *Significant at 0.05 Ranking was based on both sexes life expectancy **Significant at 0.005 ***Significant at 0.0001 Source: Illinois Department of Public Health, Illinois Health Facilities and Services Review Board, Certificate of Need Populations Project, 2014.
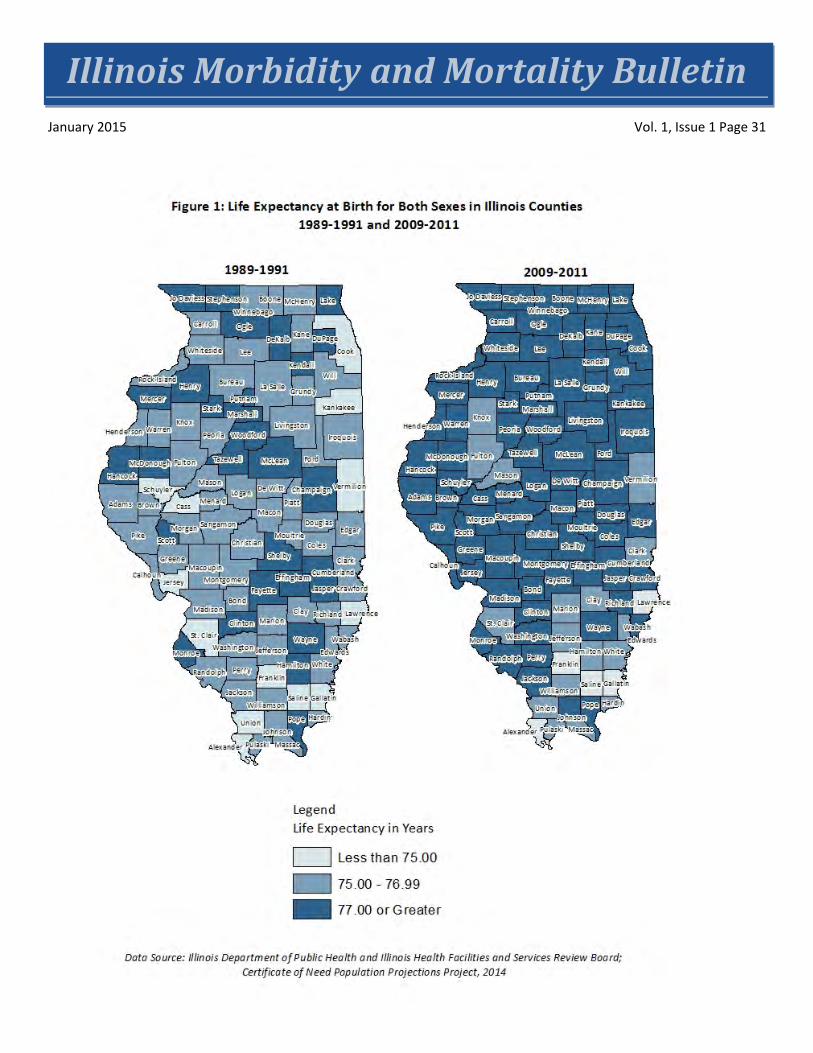
Illinois Morbidity and Mortality Bulletin January 2015 Vol. 1, Issue 1 Page 31
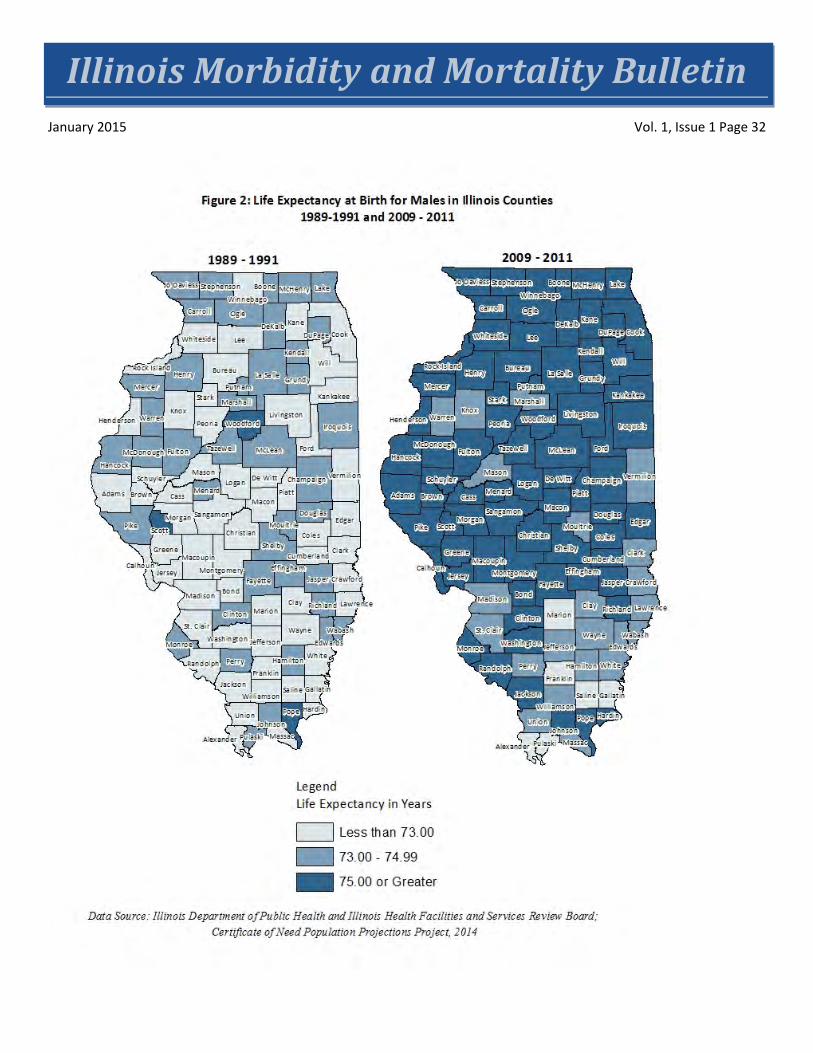
Illinois Morbidity and Mortality Bulletin January 2015 Vol. 1, Issue 1 Page 32
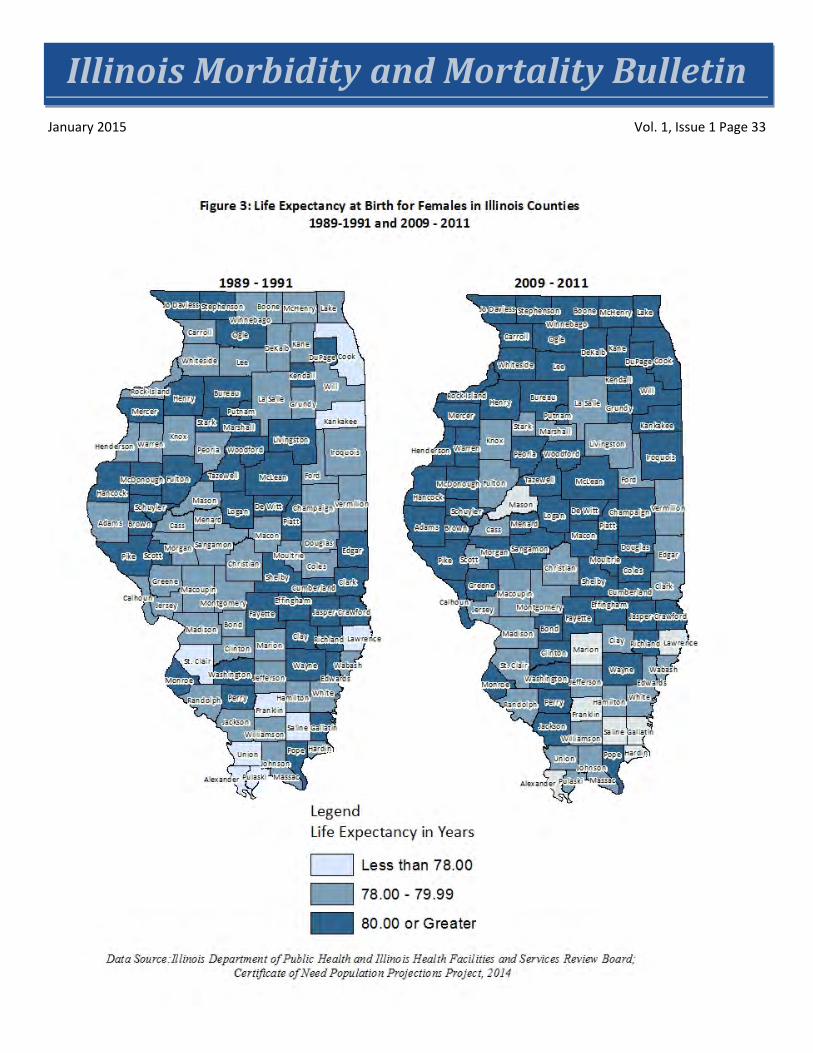
Illinois Morbidity and Mortality Bulletin January 2015 Vol. 1, Issue 1 Page 33