ILLINOIS INFANT MORTALITY DATA REPORT · 2 EXECUTIVE SUMMARY This report presents Illinois data on...
18
ILLINOIS INFANT MORTALITY DATA REPORT Illinois Department of Public Health Office of Women’s Health and Family Services Published: January 2018
Transcript of ILLINOIS INFANT MORTALITY DATA REPORT · 2 EXECUTIVE SUMMARY This report presents Illinois data on...

ILLINOIS INFANT MORTALITY DATA REPORT
Illinois Department of Public Health Office of Women’s Health and Family Services
Published: January 2018

2
EXECUTIVE SUMMARY
This report presents Illinois data on infant mortality, including trends and at-risk populations. The purpose of
this report is to inform prevention efforts and guide the development of strategies for infant mortality
reduction.
Major Findings
In 2014, Illinois ranked 36th out of 50 states and Washington D.C. in infant mortality.
The infant mortality rate in Illinois has decreased over time to meet the Healthy People 2020 objective of
6.0 deaths per 1,000 live births.
However, major racial/ethnic disparities persist. The infant mortality rate for infants born to Non-Hispanic
black women is consistently at least two to three times as high as the infant mortality rate of infants born
to Non-Hispanic white women.
Infants at higher risk for infant mortality include those born to: Non-Hispanic black women, younger
mothers, unmarried women, women with a high school education or less, U.S.-born women (vs. foreign-
born), women covered by Medicaid, women with three or more previous births, residents of the city of
Chicago, women with pregnancy-related hypertension (high blood pressure) or eclampsia, or women who
did not receive any prenatal care.
The leading causes of infant deaths are prematurity, congenital anomalies (birth defects), and Sudden
Unexplained Infant Deaths (SUID), which includes deaths related to accidental suffocation and Sudden
Infant Death Syndrome (SIDS).
Based on a special kind of analysis called “Perinatal Periods of Risk,” the feto-infant mortality rate for
infants of non-Hispanic black women was nearly three times higher than that for infants born to the low-
risk “reference” group (non-Hispanic white women at least 20 years of age and who had more than a high
school education).
The “excess” feto-infant mortality rate refers to the difference between the rates in the target (non-
Hispanic black women) and reference populations. During 2014-2015, there was an excess of 7.98 deaths
per 1,000 births in the target population compared to the reference population. This translates to 418
excess fetal and infant deaths among non-Hispanic black infants.
Because most of the excess feto-infant deaths among non-Hispanic black infants occurred in the
“Maternal Health/ Prematurity” and the “Infant Health” periods of risk, interventions could target
preconception health, prenatal behaviors, perinatal care, social determinants, sleep position, postpartum
behaviors, and injury prevention.
More than half of the excess feto-infant mortality in the target population were related to prematurity,
due to increased prematurity rates overall and lower survival rates for premature babies.
3
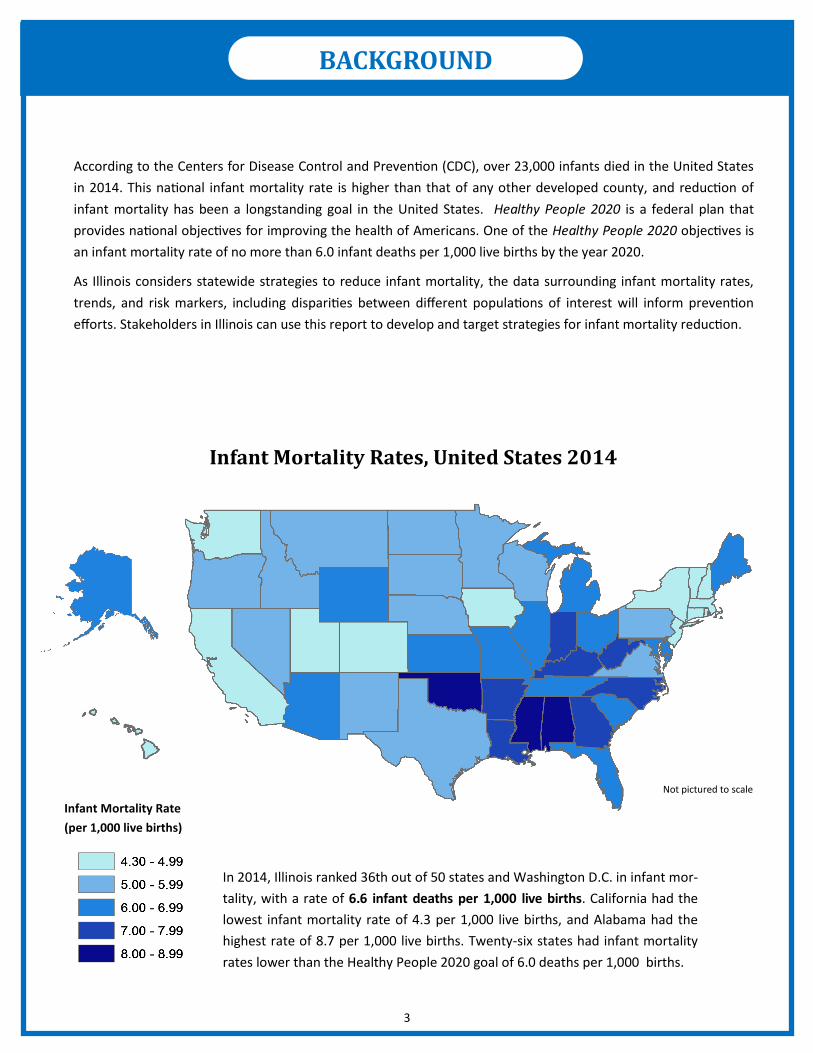
According to the Centers for Disease Control and Prevention (CDC), over 23,000 infants died in the United States
in 2014. This national infant mortality rate is higher than that of any other developed county, and reduction of
infant mortality has been a longstanding goal in the United States. Healthy People 2020 is a federal plan that
provides national objectives for improving the health of Americans. One of the Healthy People 2020 objectives is
an infant mortality rate of no more than 6.0 infant deaths per 1,000 live births by the year 2020.
As Illinois considers statewide strategies to reduce infant mortality, the data surrounding infant mortality rates,
trends, and risk markers, including disparities between different populations of interest will inform prevention
efforts. Stakeholders in Illinois can use this report to develop and target strategies for infant mortality reduction.
Infant Mortality Rates, United States 2014
Infant Mortality Rate
(per 1,000 live births)
Not pictured to scale
In 2014, Illinois ranked 36th out of 50 states and Washington D.C. in infant mor-
tality, with a rate of 6.6 infant deaths per 1,000 live births. California had the
lowest infant mortality rate of 4.3 per 1,000 live births, and Alabama had the
highest rate of 8.7 per 1,000 live births. Twenty-six states had infant mortality
rates lower than the Healthy People 2020 goal of 6.0 deaths per 1,000 births.
BACKGROUND

4
Data for this report came from birth, death, and fetal death certificates (IDPH
Division of Vital Records). Analyses were limited to births and deaths of Illinois
residents. The 2010-14 American Community Survey (ACS) provided the socioeconomic data by county.
DATA SOURCE
Two different calculation methods were used to describe infant mortality:
Cross-sectional analyses compare the number of infant deaths in a year to the number of babies born in
that year. These analyses do not require a linkage between infants’ birth and death certificates. This
method was used for the time trend analyses.
Trend analysis: Joinpoint regression was used to assess trends over time and to estimate the
average annual percent change in infant mortality.
Cohort analyses require matched infant birth and death records and provide more information about the
difference between babies who died and those who did not die. This method was used to do in-depth
analyses of the risk markers associated with infant mortality. Matched infant records were not available
prior to 2014.
ANALYSIS
The race/ethnicity groups used are: Non-Hispanic White, Non-Hispanic
Black, Hispanic, and Asian/Pacific Islander. All other groups were excluded due to small numbers.
RACE/ETHNICITY
Illinois was divided into five regions: Chicago, suburban Cook County, collar
counties (Lake, McHenry, Kane, DuPage, and Will Counties), other urban counties (Winnebago, DeKalb,
Kendall, Kankakee, Rock Island, Peoria, Tazewell, McLean, Champaign, Macon, Sangamon, Madison, and
St. Clair Counties), and rural counties (all others).
GEOGRAPHY
International Classification of Disease (ICD) codes for underlying cause
of death were classified into 30 categories of infant death, as defined by CDC. The top three causes that
will be discussed in this report are: 1) disorders related to length of gestation and fetal malnutrition, 2)
congenital malformations, deformations, and chromosomal abnormalities, and 3) symptoms, signs,
findings not elsewhere classified. In this report, these categories are simplified to: 1) disorders related to
prematurity, 2)congenital and chromosomal abnormalities, and 3) SIDS and other unknown causes.
CAUSES OF DEATH
METHODS
Term: Gestational age ≥ 37 weeks
Preterm: Gestational age < 37 weeks
Very Preterm: Gestational age < 32 weeks
DEFINITIONS
Fetal Death: Death of a fetus (≥ 20 weeks gestation)
prior to delivery
Infant Death: Death of an infant before first birthday
Neonatal Death: Death during days 0-27 of life
Post-Neonatal Death: Death during days 28-364 of life
METHODS

5
There are substantial differences in the infant mortality rates for Illinois babies of different racial/ethnic groups. The
IMR for non-Hispanic Black infants is consistently more than double that of the other three racial/ethnic groups. On
average, between 2000 and 2015, the infant mortality rate decreased about 1.9% per year for Non-Hispanic White
infants, 1.6% per year for Non-Hispanic Black infants, and 0.8% per year for Hispanic infants, with no significant
change over time for Asian infants. The significantly higher IM rate in Non-Hispanic Black infants highlights the need
for targeted interventions.
x 1,000
# of infant deaths in year A
total # of live births in year A
RESULTS
In cross-sectional analyses, the Infant mortality rate (IMR) was defined as:
The Illinois infant mortality rate
decreased from 8.3 per 1,000 in
2000 to 6.0 per 1,000 in 2015 —
a total average decrease of 28%
and an average annual decrease
of 1.6%. The neonatal mortality
rate was 4.3 per 1,000 in 2015,
with an average annual decrease
of 1.3% since 2000. The post-
neonatal mortality rate was 1.8
per 1,000 in 2015, with an aver-
age annual decrease of 2.3%
since 2000.
0
2
4
6
8
10
2000 2003 2006 2009 2012 2015
Ra
te (
pe
r 1
,00
0 li
ve
Bir
ths)
Year
Infant Mortality Rate, Illinois 2000-2015
HP2020 Objective Infant Mortality
Neonatal Mortality Post-Neonatal Mortality
0
2
4
6
8
10
12
14
16
18
2000 2003 2006 2009 2012 2015
Rat
e (p
er
1000
live
bir
ths)
Year
Infant Mortality Rate by Race/Ethnicity,Illinois 2000-2015
NH White NH Black Hispanic Asian/Pacific Islander
RESULTS: CROSS-SECTIONAL ANALYSIS

6
On average, the infant mor-
tality rates between 2000
and 2015 decreased 2.0%
per year for Chicago resi-
dents, 1.9% per year for sub-
urban Cook Co. residents,
1.3% per year for collar
county residents, 1.9% per
year for other urban county
residents, and 0.9% per year
for rural county residents.
The top three causes of infant mortality in Illinois between 2000 and 2015 were disorders related to prematurity, con-
genital and chromosomal abnormalities, and SIDS and other unknown causes. Together, these three causes accounted
for about half of infant deaths. On average, the rate of deaths due to a congenital or chromosomal abnormality de-
creased 2% per year during 2000-2015. The rate of SIDS and other unknown deaths decreased an average 3% per year
between 2000 and 2015. There was no significant change over time for the rate of deaths due to disorders related to
prematurity. The rate of deaths due to all other causes decreased an average 1.7% per year between 2000 and 2015.
0.0
0.2
0.4
0.6
0.8
1.0
1.2
1.4
1.6
1.8
2.0
2000 2003 2006 2009 2012 2015
IMR
(p
er
1000
liv
e b
irth
s)
Year
Top 4 Causes of Infant Mortality, Illinois 2000-2015
Disorders related to prematurity Congenital anomalies
SIDS and other unknown causes Other perinatal condition
0
2
4
6
8
10
12
2000 2003 2006 2009 2012 2015
IMR
(p
er
1000
liv
e b
irth
s)
Year
Infant Mortality by Area of Residence, Illinois 2000-2015
Chicago Suburban Cook County Collar Counties
Other Urban Counties Rural Counties
RESULTS: CROSS-SECTIONAL ANALYSIS
7
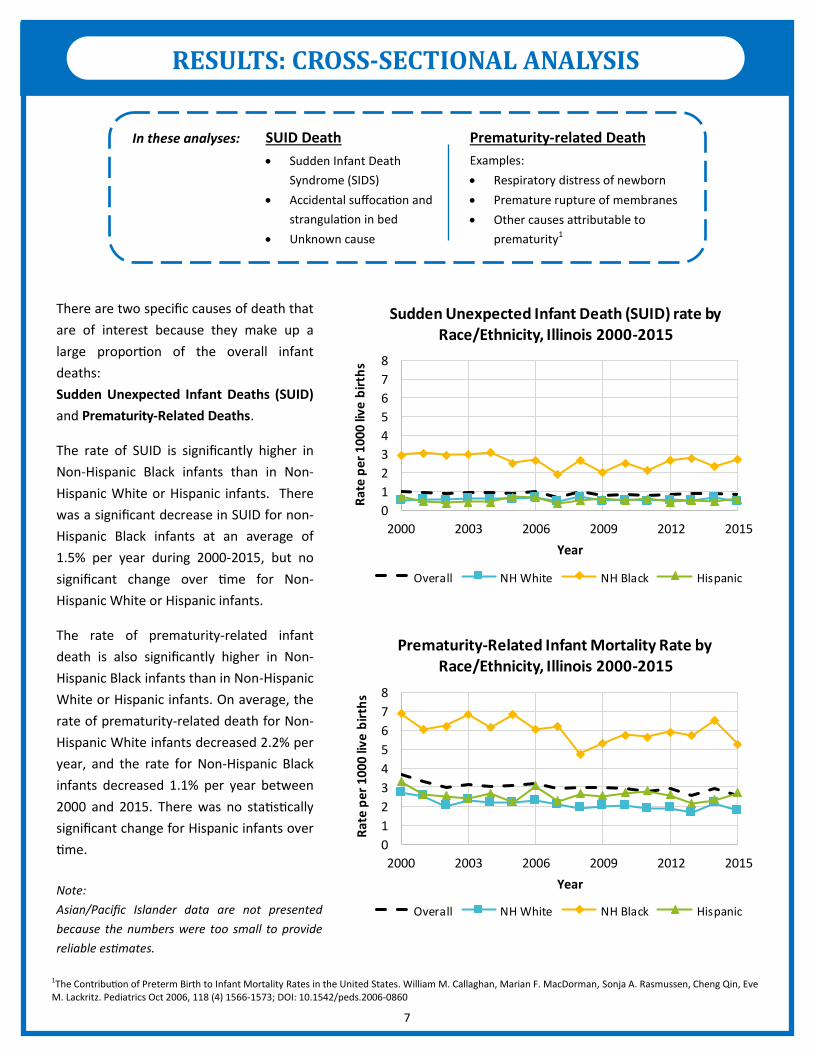
There are two specific causes of death that
are of interest because they make up a
large proportion of the overall infant
deaths:
Sudden Unexpected Infant Deaths (SUID)
and Prematurity-Related Deaths.
The rate of SUID is significantly higher in
Non-Hispanic Black infants than in Non-
Hispanic White or Hispanic infants. There
was a significant decrease in SUID for non-
Hispanic Black infants at an average of
1.5% per year during 2000-2015, but no
significant change over time for Non-
Hispanic White or Hispanic infants.
The rate of prematurity-related infant
death is also significantly higher in Non-
Hispanic Black infants than in Non-Hispanic
White or Hispanic infants. On average, the
rate of prematurity-related death for Non-
Hispanic White infants decreased 2.2% per
year, and the rate for Non-Hispanic Black
infants decreased 1.1% per year between
2000 and 2015. There was no statistically
significant change for Hispanic infants over
time.
Note:
Asian/Pacific Islander data are not presented
because the numbers were too small to provide
reliable estimates.
In these analyses:
Sudden Infant Death
Syndrome (SIDS)
Accidental suffocation and
strangulation in bed
Unknown cause
SUID Death Prematurity-related Death
Examples:
Respiratory distress of newborn
Premature rupture of membranes
Other causes attributable to
prematurity1
1The Contribution of Preterm Birth to Infant Mortality Rates in the United States. William M. Callaghan, Marian F. MacDorman, Sonja A. Rasmussen, Cheng Qin, Eve M. Lackritz. Pediatrics Oct 2006, 118 (4) 1566-1573; DOI: 10.1542/peds.2006-0860
0
1
2
3
4
5
6
7
8
2000 2003 2006 2009 2012 2015
Rat
e p
er 1
000
live
bir
ths
Year
Sudden Unexpected Infant Death (SUID) rate by Race/Ethnicity, Illinois 2000-2015
Overall NH White NH Black Hispanic
0
1
2
3
4
5
6
7
8
2000 2003 2006 2009 2012 2015
Rat
e p
er 1
000
live
bir
ths
Year
Prematurity-Related Infant Mortality Rate by Race/Ethnicity, Illinois 2000-2015
Overall NH White NH Black Hispanic
RESULTS: CROSS-SECTIONAL ANALYSIS
8
RESULTS
The following data are from a cohort of birth certificates for infants born in Illinois in 2014 or 2015. These
births were linked to their corresponding death certificates, where infant mortality is defined as:
By having the matched birth record for each of the death records, we can analyze more detailed maternal
and infant characteristics associated with infant mortality.
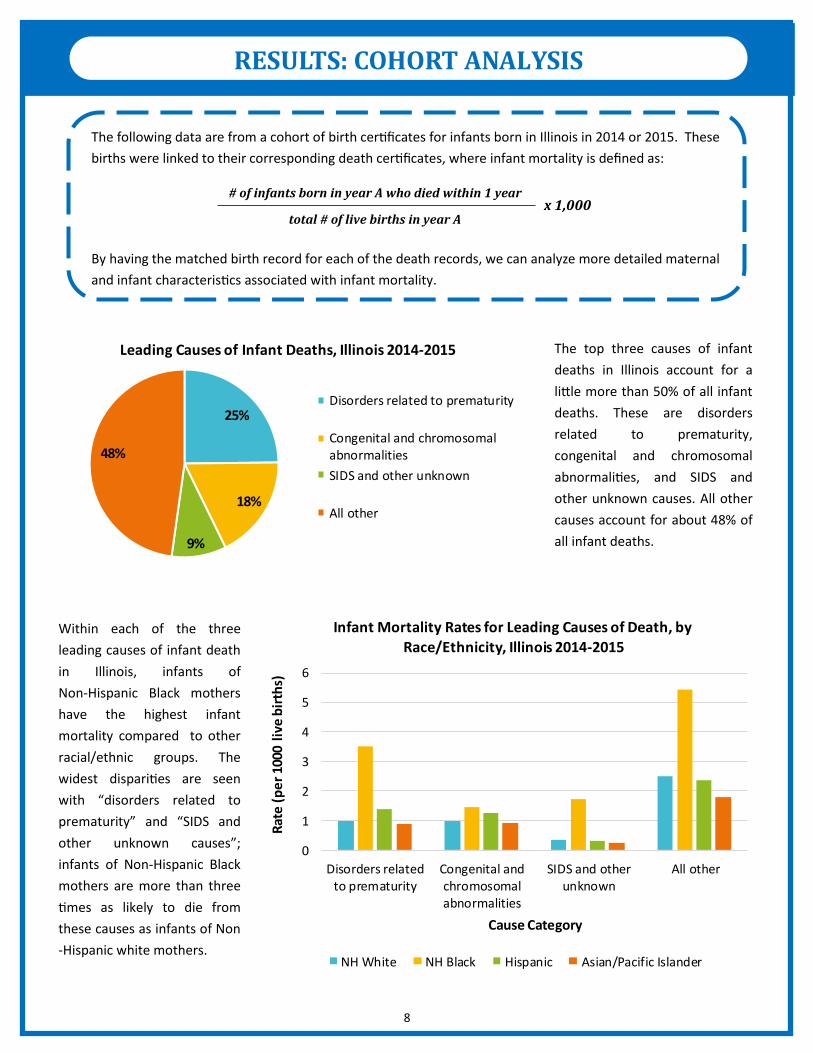
The top three causes of infant
deaths in Illinois account for a
little more than 50% of all infant
deaths. These are disorders
related to prematurity,
congenital and chromosomal
abnormalities, and SIDS and
other unknown causes. All other
causes account for about 48% of
all infant deaths.
Within each of the three
leading causes of infant death
in Illinois, infants of
Non-Hispanic Black mothers
have the highest infant
mortality compared to other
racial/ethnic groups. The
widest disparities are seen
with “disorders related to
prematurity” and “SIDS and
other unknown causes”;
infants of Non-Hispanic Black
mothers are more than three
times as likely to die from
these causes as infants of Non
-Hispanic white mothers.
x 1,000 # of infants born in year A who died within 1 year
total # of live births in year A
25%
18%
9%
48%
Leading Causes of Infant Deaths, Illinois 2014-2015
Disorders related to prematurity
Congenital and chromosomalabnormalities
SIDS and other unknown
All other
0
1
2
3
4
5
6
Disorders relatedto prematurity
Congenital andchromosomalabnormalities
SIDS and otherunknown
All other
Rat
e (
pe
r 10
00 l
ive
bir
ths)
Cause Category
Infant Mortality Rates for Leading Causes of Death, by
Race/Ethnicity, Illinois 2014-2015
NH White NH Black Hispanic Asian/Pacific Islander
RESULTS: COHORT ANALYSIS

9
RACE/ETHNICITY: Infants born
to Non-Hispanic Black women
have the highest rate of infant
mortality.
AGE: Infants born to younger
women generally have higher
infant mortality rates than those
born to older women.
MARITAL STATUS: Infants
born to unmarried women have
a higher mortality rate than
those born to married women.
PLACE OF MOTHER’S BIRTH:
Infants of women who were
born in the U.S. have an infant
mortality rate twice as high as
infants of foreign-born women.
GEOGRAPHIC REGION:
Residents of Chicago have a
higher infant mortality rate than
other areas of the state
EDUCATION: The rate of infant
mortality generally decreases as
the mother’s education
increases.
PAYER FOR DELIVERY: Infants
of privately-insured women have
a lower infant mortality rate
than infants of women covered
by Medicaid or other types of
insurance.
PARITY: Infants of women with
three or more previous live
births have higher infant
mortality rates than infants of
women with fewer previous live
births.
INFANT GENDER: Male infants
have a higher infant mortality
rate than female infants.
0 2 4 6 8 10 12 14
Female infant
Male infant
3+ previous live births
1-2 previous live births
0 previous live births
Self-Pay or Other Insurance
Private Insurance
Medicaid
Bachelor's or higher
Some college, but no Bachelor's
High school diploma
Less than high school education
Rural
Other Urban
Collar Counties
Suburban Cook
Chicago
Mother born in U.S.
Mother not born in U.S.
Married
Unmarried
35+ years
30-34 years
25-29 years
20-24 years
<20 years
Asian/Pacific Islander
Hispanic
NH Black
NH White
Rate (per 1,000 live births)
Illinois Infant Mortality Rate by Maternal and Infant
Demographics, 2014-2015
RESULTS: COHORT ANALYSIS

10
DIABETES: Infants born to women who had diabetes before
pregnancy have a higher mortality rate than infants born to
women who had diabetes during pregnancy or no diabetes.
HYPERTENSION: Infants born to women with eclampsia and
gestational hypertension have higher infant mortality rates
than infants of women with chronic hypertension or no
hypertension at all.
SMOKING: Infants born to women who smoke during preg-
nancy have a higher mortality rate than infants born to
women who do not smoke during pregnancy. *Prenatal care was measured on the Adequacy of Prenatal Care Utilization Index (“Kotelchuck” index), which classifies prenatal care utilization into adequacy categories based on the time of prenatal care initiation
0 5 10 15 20 25 30 35
Twin birth
Singleton birth
Adequate Plus PNC
Adequate PNC
Intermediate PNC
Inadequate PNC
No PNC
Smoking during pregnancy
No smoking during pregnancy
Eclampsia
Gestational hypertension
Chronic hypertension
No hypertension
Diabetes before pregnancy
Diabetes during pregnancy
No diabetes
Rate (per 1,000 live birth)
Illinois Infant Mortality Rate by Maternal and Infant Medical and Healthcare Factors, 2014-2015
PRENATAL CARE (PNC)*: Infants of women with no
prenatal care have higher rates of infant mortality than
women with any prenatal care. Infants of women with
“adequate plus” prenatal care have the second highest
mortality rate — this group of women likely had higher-risk
pregnancies that prompted them to receive more prenatal
care than is typical.
PLURALITY: Twin births have an infant mortality rate more
than four times that of singleton births.
RESULTS: COHORT ANALYSIS

11
RESULTS
A Perinatal Periods of Risk (PPOR) approach identifies opportunities to reduce fetal and infant death.
PPOR is an analytical framework developed by CityMatCH that was developed to investigate the disparity
in fetal and infant death between a reference population and a target population. The “reference” popula-
tion is typically the subgroup of women with the best birth outcomes, and the “target” population is typi-
cally the subgroup of women with the worst birth outcomes.
Maternal Health /
Prematurity Maternal Care Newborn Care Infant Health Period of Risk
Preconception health
Prenatal behaviors
Perinatal care
Social determinants
Prenatal care
High risk referral
Obstetric care
Social determinants
Perinatal management
Neonatal care
Pediatric surgery
Sleep position
Postpartum behaviors
Injury prevention
Targets for
Action
Periods
of
Risk Very low birthweight;
any fetal or infant
deaths occurring 24
weeks gestation or later
Low and normal
birthweight; infant
deaths occurring
during days 28-364
of life
Low and normal
birthweight; infant
deaths during days
0-27 of life
Low and normal
birthweight; fetal
deaths occurring 24
weeks gestation or
later
500—1499 g
(1 lb 1 oz—
3 lbs 4 oz)
≥1500 g
(3 lbs 5 oz
or more)
Bir
thw
eigh
t
Age at death
Fetal death Neonatal death Post-neonatal death
Maternal Care Newborn Care Infant Health
Maternal Health / Prematurity
RESULTS: PERINATAL PERIODS OF RISK

12
RESULTS
PPOR Analyses were limited to Illinois resident women,
with an infant/fetus at least 24 weeks gestation and at
least 500 grams at delivery
Maternal Health /
Prematurity Maternal Care Newborn Care Infant Health Period of Risk
3.06 per 1,000 2.03 per 1,000 0.56 per 1,000 2.34 per 1,000 “Excess” Rate in
Target Population
“Excess” # Deaths in
Target Population 160 106 29 123
During 2014-2015, there was an excess of 7.98 deaths per 1,000 births in the target population compared to the refer-
ence population. This translates to 418 excess fetal and infant deaths that could have been prevented if the feto-infant
mortality rate for the target population was the same as the rate for the reference population.
The “excess” feto-infant mortality rate refers to the difference between the rates in the target and reference populations.
Bir
thw
eigh
t
Age at death
Fetal death Neonatal death Post-neonatal death
(134 / 130,861) * 1,000
= 1.02 deaths per 1,000
(130 / 130,861) * 1,000
= 0.99 deaths per 1,000
(99 / 130,861) * 1,000
= 0.76 deaths per 1,000
Reference
Population
(Low Infant Mortality)
(187 deaths / 130,861 births) * 1,000
= 1.43 deaths per 1,000
Total mortality rate = 4.20 deaths per 1,000
Non-Hispanic white
≥ 20 years old
Education ≥ 13 years
500—1499 g
(1 lb 1 oz—
3 lbs 4 oz)
≥1500 g
(3 lbs 5 oz
or more)
Age at death
Bir
thw
eigh
t
Fetal death Neonatal death Post-neonatal death
(160 / 52,378) * 1,000
= 3.05 deaths per 1,000
(81 / 52,378) * 1,000
= 1.55 deaths per 1,000
(162 / 52,378) * 1,000
= 3.09 deaths per 1,000
(235 deaths / 52,378 births) * 1,000
= 4.49 deaths per 1,000
Total mortality rate = 12.18 deaths per 1,000
Target
Population
(High Infant Mortality)
Non-Hispanic black
500—1499 g
(1 lb 1 oz—
3 lbs 4 oz)
≥1500 g
(3 lbs 5 oz
or more)
RESULTS: PERINATAL PERIODS OF RISK

13
Of the 418 total number of excess deaths in the target population, about two-thirds occurred in the maternal health/
prematurity and infant health periods of risk. Therefore, targets of action in Illinois could include preconception health,
prenatal behaviors, perinatal care, and social determinants (to address the maternal health/ prematurity period), or
sleep position, postpartum behaviors, and injury prevention (to address the infant health period).
Examples of these factors are:
Preconception health: maintenance of a healthy weight and diet before pregnancy
Prenatal behaviors: alcohol, smoking, or drug use before delivery
Perinatal care: receipt of care at appropriate facility
Social determinants: income, education, neighborhood safety
Sleep position: infants sleeping alone, on their backs, and in cribs
Postpartum behaviors: breastfeeding, smoking in house with infant
Injury prevention: cribs for safe sleep, car seats
Two possible explanations for the large number of excess deaths in the ma-
ternal health/prematurity period of risk may be: a higher number of preterm live births and fetal deaths
(different gestational age distributions), or lower survival rates regardless of gestational age distribution
(higher birthweight-specific mortality rate) in the target population. The Kitagawa approach allows us to
determine the contribution of each explanation to the overall excess. The causes, risk factors, and interven-
tions for preterm births are generally different than those for gestational age-specific mortality rate.
KITAGAWA ANALYSIS
Explanation General Pathway for Intervention
More Preterm Births
(gestational age distribution)
Lower Survival Rates
(higher gestational age-specific mortality rate)
Behavioral, social, health, and economic disparities of the mothers
Perinatal care provided to the mother and infant
Period of Risk Maternal Health /
Prematurity Maternal Care Newborn Care Infant Health
Excess Deaths in
Target Population 160 106 29 123
Targets for
Action
Preconception health
Prenatal behaviors
Perinatal care
Social determinants
Sleep position
Postpartum behaviors
Injury prevention
Prenatal Care
High risk referral
Obstetric care
Social determinants
Perinatal management
Neonatal care
Pediatric surgery
Note: This is
not an all-
inclusive list.
RESULTS: PERINATAL PERIODS OF RISK
14
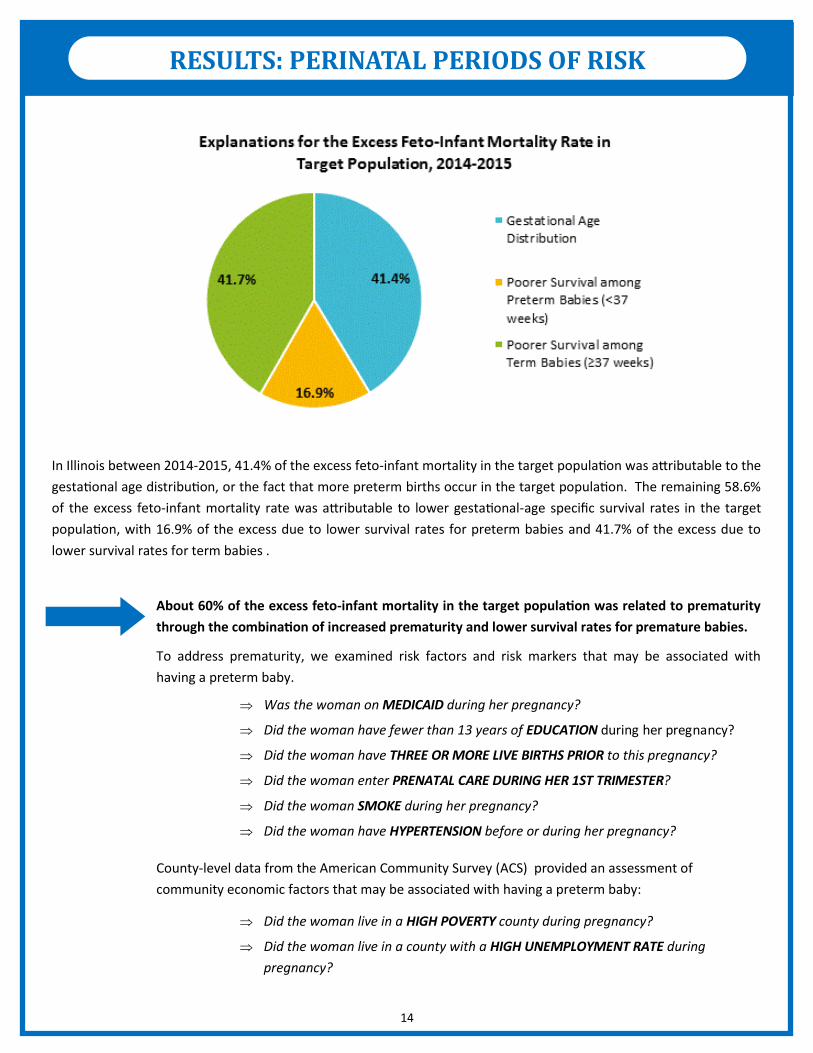
In Illinois between 2014-2015, 41.4% of the excess feto-infant mortality in the target population was attributable to the
gestational age distribution, or the fact that more preterm births occur in the target population. The remaining 58.6%
of the excess feto-infant mortality rate was attributable to lower gestational-age specific survival rates in the target
population, with 16.9% of the excess due to lower survival rates for preterm babies and 41.7% of the excess due to
lower survival rates for term babies .
Was the woman on MEDICAID during her pregnancy?
Did the woman have fewer than 13 years of EDUCATION during her pregnancy?
Did the woman have THREE OR MORE LIVE BIRTHS PRIOR to this pregnancy?
Did the woman enter PRENATAL CARE DURING HER 1ST TRIMESTER?
Did the woman SMOKE during her pregnancy?
Did the woman have HYPERTENSION before or during her pregnancy?
About 60% of the excess feto-infant mortality in the target population was related to prematurity
through the combination of increased prematurity and lower survival rates for premature babies.
To address prematurity, we examined risk factors and risk markers that may be associated with
having a preterm baby.
Did the woman live in a HIGH POVERTY county during pregnancy?
Did the woman live in a county with a HIGH UNEMPLOYMENT RATE during
pregnancy?
County-level data from the American Community Survey (ACS) provided an assessment of
community economic factors that may be associated with having a preterm baby:
RESULTS: PERINATAL PERIODS OF RISK
15
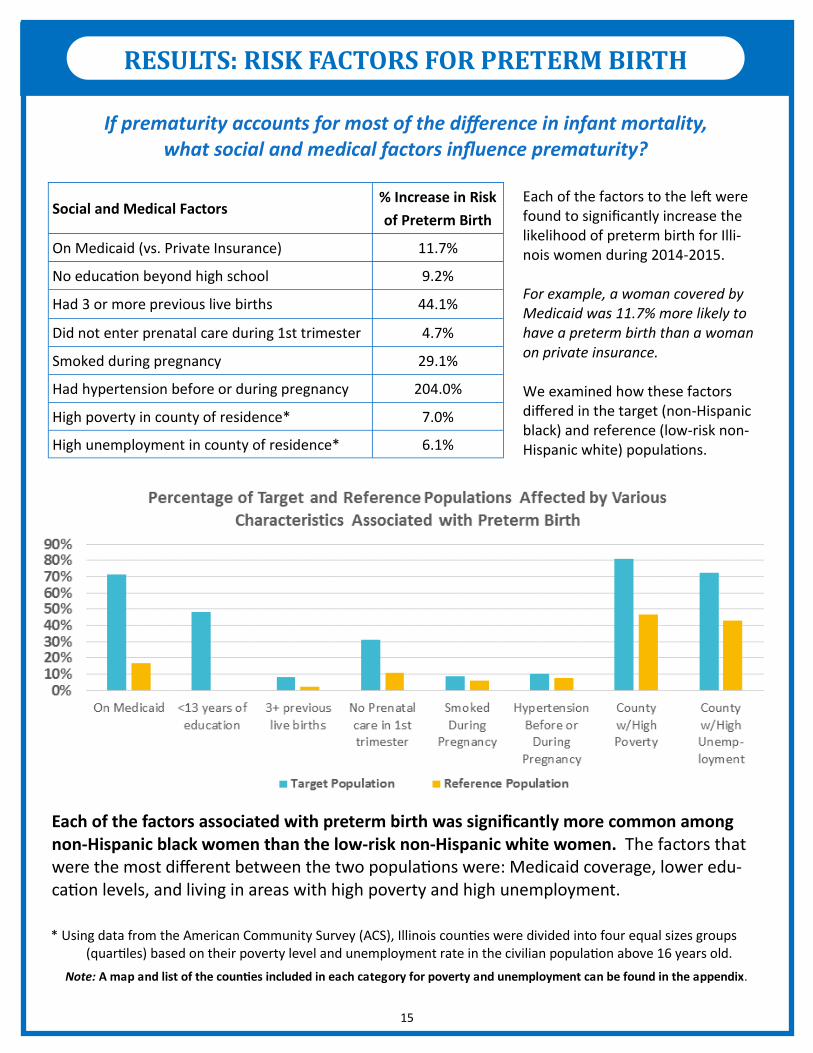
Social and Medical Factors % Increase in Risk
of Preterm Birth
On Medicaid (vs. Private Insurance) 11.7%
No education beyond high school 9.2%
Had 3 or more previous live births 44.1%
Did not enter prenatal care during 1st trimester 4.7%
Smoked during pregnancy 29.1%
Had hypertension before or during pregnancy 204.0%
High poverty in county of residence* 7.0%
High unemployment in county of residence* 6.1%
* Using data from the American Community Survey (ACS), Illinois counties were divided into four equal sizes groups (quartiles) based on their poverty level and unemployment rate in the civilian population above 16 years old.
Note: A map and list of the counties included in each category for poverty and unemployment can be found in the appendix.
RESULTS: RISK FACTORS FOR PRETERM BIRTH
If prematurity accounts for most of the difference in infant mortality, what social and medical factors influence prematurity?
Each of the factors to the left were found to significantly increase the likelihood of preterm birth for Illi-nois women during 2014-2015. For example, a woman covered by Medicaid was 11.7% more likely to have a preterm birth than a woman on private insurance. We examined how these factors differed in the target (non-Hispanic black) and reference (low-risk non-Hispanic white) populations.
Each of the factors associated with preterm birth was significantly more common among non-Hispanic black women than the low-risk non-Hispanic white women. The factors that were the most different between the two populations were: Medicaid coverage, lower edu-cation levels, and living in areas with high poverty and high unemployment.

16
SUMMARY
OVERALL INFANT MORTALITY
The infant mortality rate in Illinois has decreased over time to meet the Healthy People 2020 goal. However, major
racial/ethnic disparities persist. The infant mortality rate for infants born to Non-Hispanic black women is consistently
at least two to three times as high as the infant mortality rate of infants born to Non-Hispanic white women.
CAUSES OF DEATH
The leading cause of infant death is any disorder related to prematurity, so if we can reduce the incidence of prema-
ture births, we can help to reduce infant mortality. Another leading cause of infant death is Sudden Unexplained Infant
Deaths (SUID), which includes Sudden Infant Death Syndrome (SIDS) and other sleep-related deaths. Targeted
interventions to address infant sleep patterns should also be a focus.
PERINATAL PERIODS OF RISK (PPOR) ANALYSIS
The feto-infant mortality rate for infants of non-Hispanic black women (the target population) was nearly three times
higher than that for infants born to non-Hispanic white women at least 20 years of age and who had at least 13 years
of education (the reference population). If the feto-infant mortality rate in the target population had been the same as
that of the reference population, 418 deaths would have been prevented in 2014-2015. Most of the excess feto-infant
deaths in the target population occurred in the “Maternal Health/ Prematurity” and the “Infant Health” periods of risk.
These periods of risk suggest preconception health, prenatal behaviors, perinatal care, social determinants, sleep posi-
tion, postpartum behaviors, and injury prevention as potential target for action.
More than half of the excess feto-infant mortality in the target population was related to prematurity through the
combination of increased prematurity and lower survival rates for premature babies. Being on Medicaid, having fewer
than 13 years of education, having three or more previous live births, not entering prenatal care during the 1st tri-
mester, smoking during pregnancy, and having hypertension before or during pregnancy were all associated increased
risk of prematurity. In addition, women who lived in counties with higher poverty and unemployment rates had higher
risks of prematurity than those living in counties of low poverty and unemployment. All of these social and medical
factors that were associated with prematurity were significantly more common among non-Hispanic black women than
among low-risk non-Hispanic white women.
LOOKING FORWARD
Beyond the factors studied in this report, it would be useful to analyze factors associated with preterm birth further ,
such as those reported in the Pregnancy Risk Assessment Monitoring System (PRAMS) survey. Given that the PPOR
analysis also showed a large excess mortality in the infant health period of risk, further analyses of infant sleep behav-
iors could inform efforts to reduce these deaths.
17
LOW POVERTY
Boone
Brown
Clinton
Douglas
DuPage
Effingham
Grundy
Henderson
Henry
Jasper
Jersey
Jo Daviess
Kendall
Lake
Lee
Menard
Marshall
McHenry
Mercer
Monroe
Ogle
Piatt
Shelby
Tazewell
Will
Woodford
MEDIUM-LOW POVERTY
Bureau
Calhoun
Carroll
Cass
Clay
Crawford
De Witt
Edwards
Ford
Hancock
Kane
LaSalle
Lawrence
Livingston
Macoupin
Madison
Moultrie
Pike
Putnam
Randolph
Stark
Wabash
Washington
White
Whiteside
MEDIUM-HIGH POVERTY
Adans
Bond
Christian
Clark
Cumberland
Fulton
Gallatin
Hamilton
Iroquois
Johnson
Kankakee
Logan
Mason
McLean
Montgomery
Morgan
Pope
Richland
Rock Island
Sangamon
Scott
Stephenson
Warren
Wayne
Williamson
HIGH POVERTY
Alexander
Champaign
Coles
Cook
DeKalb
Edgar
Fayette
Franklin
Greene
Hardin
Jackson
Jefferson
Knox
Macon
Marion
Massac
McDonough
Peoria
Perry
Pulaski
Saline
Schuyler
St. Clair
Union
Vermillion
Winnebago
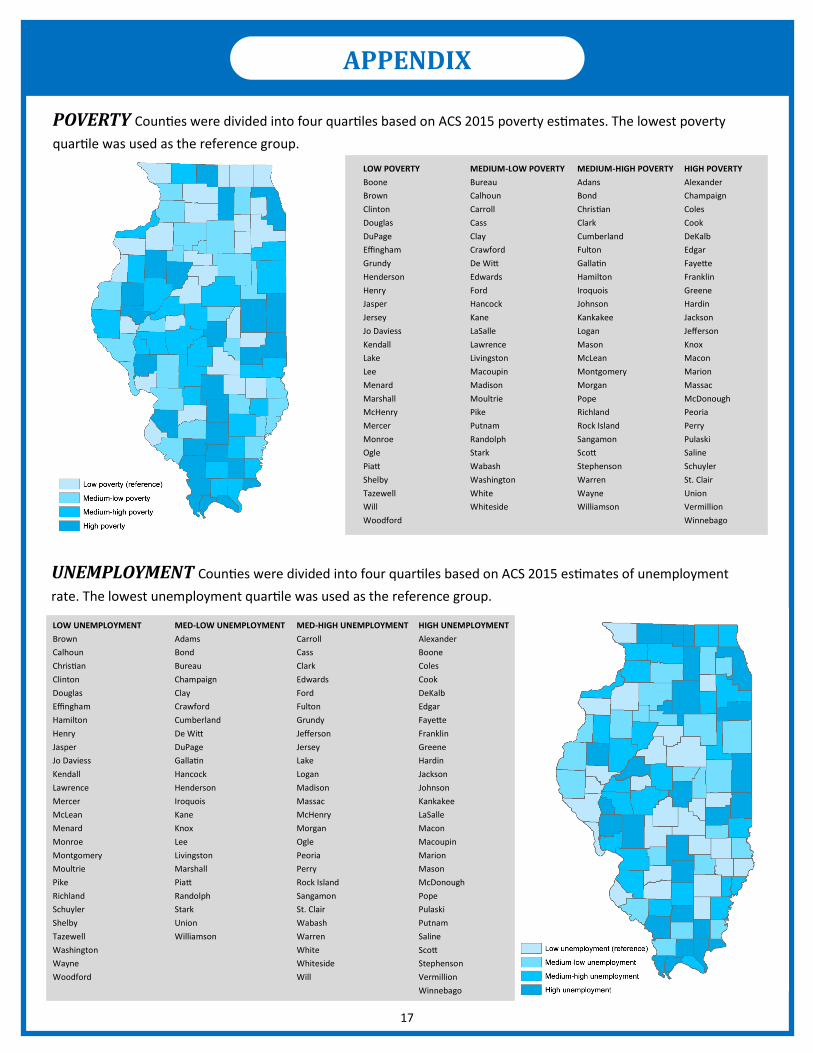
POVERTY Counties were divided into four quartiles based on ACS 2015 poverty estimates. The lowest poverty
quartile was used as the reference group.
APPENDIX
LOW UNEMPLOYMENT
Brown
Calhoun
Christian
Clinton
Douglas
Effingham
Hamilton
Henry
Jasper
Jo Daviess
Kendall
Lawrence
Mercer
McLean
Menard
Monroe
Montgomery
Moultrie
Pike
Richland
Schuyler
Shelby
Tazewell
Washington
Wayne
Woodford
MED-LOW UNEMPLOYMENT
Adams
Bond
Bureau
Champaign
Clay
Crawford
Cumberland
De Witt
DuPage
Gallatin
Hancock
Henderson
Iroquois
Kane
Knox
Lee
Livingston
Marshall
Piatt
Randolph
Stark
Union
Williamson
MED-HIGH UNEMPLOYMENT
Carroll
Cass
Clark
Edwards
Ford
Fulton
Grundy
Jefferson
Jersey
Lake
Logan
Madison
Massac
McHenry
Morgan
Ogle
Peoria
Perry
Rock Island
Sangamon
St. Clair
Wabash
Warren
White
Whiteside
Will
HIGH UNEMPLOYMENT
Alexander
Boone
Coles
Cook
DeKalb
Edgar
Fayette
Franklin
Greene
Hardin
Jackson
Johnson
Kankakee
LaSalle
Macon
Macoupin
Marion
Mason
McDonough
Pope
Pulaski
Putnam
Saline
Scott
Stephenson
Vermillion
Winnebago
UNEMPLOYMENT Counties were divided into four quartiles based on ACS 2015 estimates of unemployment
rate. The lowest unemployment quartile was used as the reference group.

18
AUTHOR Jennifer Le, MPH candidate (Tulane University)
Graduate Student Epidemiology Program (GSEP) Intern
Illinois Department of Public Health
Office of Women’s Health and Family Services
INTERNSHIP MENTOR Amanda Bennett, PhD
CDC Assignee in Maternal and Child Health Epidemiology
Illinois Department of Public Health
Office of Women’s Health and Family Services
DATA SOURCES Illinois Vital Statistics: birth and death certificates (2000-2015)
American Community Survey (ACS) 5-Year Estimates (2015)
RESOURCES CityMatCH Tools and Resources. http://www.citymatch.org/perinatal-periods-risk-ppor-home/training-
materials/tools-and-resources
Gibson, C., MPH, Blackwell, S., MPH, & Rohan, A., PhD. (2015). A Perinatal Periods of Risk (PPOR) Analysis for
the Lifecourse Initiative for Healthy Families (LIHF). Wisconsin Department of Health Services.
INTERNSHIP AND FUNDING SUPPORT This report was supported in part by a placement from the Graduate Student Epidemiology Program (GSEP)
sponsored by the Health Resources and Services Administration (HRSA) Maternal and Child Health Bureau
(MCHB).
ACKNOWLEDGEMENTS