III Ipdf.usaid.gov/pdf_docs/pnaca759.pdf · ... Phase III (AP AP III) USAID Contract No. LAG ......
127
I I I I I I I I I I I I I I I LIKELY IMPACTS OF THE GATT AGRICULTURAL AGREEMENT ON AFRICAN AGRICULTURAL TRADE AND DEVELOPMENT May 1997 APAP III Research Report No. 1024 Prepared for Agricultural Policy Analysis Project, Phase III (APAP III) USAID Contract No. LAG-4201-C-00-30S2-00 Authors: Lawrence Kent David Wilcock Cheryl Gwynn Development Alternatives Inc. )
Transcript of III Ipdf.usaid.gov/pdf_docs/pnaca759.pdf · ... Phase III (AP AP III) USAID Contract No. LAG ......
I I I I I I I I I I I I I I I
LIKELY IMPACTS OF THE GATT AGRICULTURAL AGREEMENT ON AFRICAN AGRICULTURAL TRADE AND DEVELOPMENT
May 1997
APAP III Research Report No. 1024
Prepared for
Agricultural Policy Analysis Project, Phase III (AP AP III)
USAID Contract No. LAG-4201-C-00-30S2-00
Authors: Lawrence Kent David Wilcock Cheryl Gwynn Development Alternatives Inc. )
jmenustik
Rectangle
jmenustik
Rectangle
jmenustik
Rectangle
I I I I I I I I I I I I I I I I
TABLE OF CONTENTS
IN'TRODUCTION ..................................... . . . . . . . . . . . . . . . . . . . . . . . iii
PART 1: IMPACTS OF THE AGRICULTURAL AGREEMENT ON AFRICA ........ 1
Summary of Agricultural Agreement ................................... I What Are the Probable Impacts on African Agricultural Exports? ............ I How Serious Is the Preference Erosion Problem for Africa? ................ 5
PARTTI: COUNTRY CASE STUDIES: METHODOLOGY AND SUMMARY-OBSERVATIONS ................................................ 31
Case Study Methodology ........................................... 31 Importance of Looking at Trade Impacts at the National Level ............. 33 Summary of the Degree and Importance of Preference Erosion ............. 34
PARTITI: CONCLUSIONS AND IMPLICATIONS ............................. 37
Conclusions on the Impacts of the AA ................................ 37 Conclusions on Future Directions .................................... 39 Implications for USAID ............................................ 41
BffiLIOGRAPHY ............................................................ 45
ANNEX A. KENYA CASE STUDY . . . . . . . . . . . . . . . . . . . . . . . . . . . . . . . . . . . . . . . . . .. A-I
ANNEX B. MALAWI CASE STUDY ........................................... B-1
ANNEX C. MOROCCO CASE STUDY ......................................... C-l
ANNEX D. SOUTH AFRICA CASE STUDY ................................... D-I
ANNEX E. COTE D'NOIRE CASE STUDY ..................................... E-l
ANNEX F. SENEGAL CASE STUDY .......................................... F-l
L

I I I I I I I I I I I I I I
I I
LIST OF TABLES
1 Incidence of OECD Tariffs on Sub-Saharan Countries' Non-Oil Exports (%) ........ 10
2 ACP Export Losses to the EU, Relative to Total Revenue from Exports to the EU and to the World .................................................... 12
3 FAD-Predicted Change in World Food Prices by the Year 2000 Relative to 1987-90 I..evels ......................................................... 16
4 Agricultural Commitments in the UR by Sub-Saharan African Countries ........... 21
5 Predicted Effects of the AA on Sub-Saharan Africa Trade in Temperate Crops (TCs, in millions of SUS) ................................................ 24
6 Examples of the Erosion of Preference Margins in the Access of African Agricultural Exports into Important Markets .................................. 35
A-I Kenya's Major Agricultural Exports by Destination, 1992 (thousands of SUS) ..... A-I
A-2 Major Exporters of Cut Flowers to the EU, 1994 ............................ A-6
A-3 Kenya's Major Agricultural Imports by Source, 1992 (thousands of SUS) ......... A-8
B-1 Malawi's Major Agricultural Exports by Destination, 1991 (thousands of SUS) ..... B-1
B-2 Malawi Tobacco Export Destinations and Values, 1994 ....................... B-3
B-3 Major External Tobacco Suppliers to the EU and Effects of the AA .............. B-4
B-4 Malawi's Major Agricultural Imports by Source, 1992 (thousands of SUS) ........ B-9
B-5 Maize Production and Requirement Estimates (in tons) ....................... B-I0
C-l Morocco's Major Agricultural Exports by Destination, 1993 (thousands of SUS) .... C-l
C-2 Preference Erosion Caused by AA on Moroccan Exports to the EU on Selected Products ..................................................... C-3
C-3 Tariffs Reduced by AA on Moroccan Exports to the EU on Selected Products ...... C-4
C-4 Anticipated Effects of AA on Moroccan Exports to the United States of Certain Products ...................................................... C-6
3

C-5 Major Exporters of Oranges, Mandarins, and Clementines to the EU, 1994 ........ C-9
C-6 Morocco's Major Agricultural Imports by Source, 1993 (thousands of $US) ...... C-12
D-l The South African Custom Union's Major Agricultural Exports by Destination, 1993 (thousands of SUS) .............................................. D-2
D-2 South African Maize Exports by Major Trading Partners (in tons) .............. D-7
D-3 Change in Tariff Escalation in Hides and Skins ............................. D-8
D-4 South Africa Custom Union's Major Agricultural Imports by Source, 1993 (thousands of SUS) ................................................... D-9
D-5 South African Tariff Reduction Commitments and Actual Tariffs Applied, Selected Agricultural Products . . . . . . . . . . . . . . . . . . . . . . . . . . . . . . . . . . . . . . . . .. D-ll
E-I Value of Cote d'Ivoire Agricultural Exports, by Destination, 1994 ($US mill) ...... E-1
E-2 Cote d'Ivoire Exports oflnstant Coffee, 1992-94 ($US millions) ................. E-5
E-3 Cote d'Ivoire Exports of Pineapple, Banana, and Rubber, 1989-94 (in SUS millions) ...................................................... E-5
E-4 Cote d'Ivoire Agricultural Imports by Source and Value, 1994 ($ US million) ...... E-7
F-I Senegal's Major Agricultural Exports by Destination, 1994 ($US '000) ........... F-2
F-2 Value of Senegal's Fish and Seafood Exports, 1991-94, to Selected Destinations (in $ millions) ......................................................... F-4
F-3 Senegal's Agricultural Imports by Source and Value, 1994 ($US '000) ............ F-7
I I I
I I I I I I I I I I I I I I I
INTRODUCTION
This report analyzes the expected impacts on Africa of the Agricultural Agreement (AA) negotiated as part of the GATT Uruguay Round. The topic is important because agriculture is important for Africa, and the Uruguay Round is expected to have significant impacts on many dimensions of Africa's agricultural trade. Agriculture accounts for about 30 percent of African GDP, 75 percent of employment, and two thirds of all exports. The signing of the Agricultural Agreement has raised hopes about new market openings for African agriculture at the same time that it has raised concerns about the Agreement's impact on food security and domestic policy formulation. This report aims to help USAID develop a fuller understanding of these issues so that it can take them into account during its programming and policy dialogue with African countries.
The first part of this report synthesizes the existing literature on the probable impacts of the Uruguay Round (UR) and the Agricultural Agreement (AA) on developing countries, with particular attention on Africa. A large amount of ink has been used in speculating about these impacts over the past six years, including analyses conducted before and after the 1994 signing of the Agreement. Part I of this report draws on this literature to address key questions about the AA's expected impact on African agricultural exports and food imports.
The second part of this report moves away from the generalizations available in the existing literature to look at the expected impact of the GATT/AA at the micro level, that is, on the agricultural trade of six specific African countries: Morocco, Senegal, Cote d'Ivoire, Kenya, Malawi, and South Africa This section explains the methodological approach we used in doing these case studies and presents some summary observations. The detailed country case studies are included as annexes. They include our own analyses of agricultural trade data for each country, looking at: (a) which products each country exports and how the URI AA affects access to each of the destination markets, and (b) which agricultural products each country imports and how the URI AA may affect availability, price, and food security. The case studies also draw on information gathered by local consultants hired in each country to provide a local perspective.
The third part of this report draws summary conclusions about the impacts of the AA on African countries and what countries might do to improve their overall competitiveness in world markets. What are the implications of the AA for domestic policy reform, export promotion, food security policy, and future trade negotiations? How can African governments seize the opportunities offered by a liberalizing international trade environment and prepare their economies for increasing competition? Finally, Part ill suggests types of project interventions USAID might wish to consider to pursue a trade-led development strategy in African countries where it has maintained its assistance programs.
/
I I I I I I I I I I I I I I I
PART I
IMPACTS OF THE AGRICULTURAL AGREEMENT ON AFRICA
Summary of the Agricultural Agreement
The agricultural sector was dealt with in a serious way for the first time by the GAIT during the Uruguay Round (UR). To help open world agricultural markets and increase the volume of world trade, it was agreed that tariff levels would be lowered and non-tariff barriers would be converted into tariffs (tariffication). In addition, levels of domestic support to agriculture would be reduced, and made more transparent, to reduce distortions of domestic and world market signals, thus improving sectoral efficiency.
The UR Agricultural Agreement (AA) is expected to achieve reform in world agricultural trade through provisions designed to:
• Expand market access (and thus promote expanded trade in agricultural products) through tariffication and lowering of tariff levels;
• Reduce export subsidies (provisions which affect North America and the EU most directly);
• Reduce internal or domestic support to agriculture through reductions in aggregate measures of support (AMS); and
• Unify sanitary and phytosanitary measures and reduce their use as "non-scientific" barriers to trade.
The potential impact of the Agricultural Agreement on developing countries has been a topic of considerable study and analysis over the past six years, including the four years prior to the signing of the agreement and the two years since. These studies estimate the Agricultural Agreement's probable impact on the developing world and on Africa in particular. We draw on these studies to address key questions below.
What Are the Probable Impacts on African Agricultural Exports?
The degree to which the Agricultural Agreement will affect African agricultural exports depends on several factors:
• The degree to which the AA actually reduces tariffs and non-tariff barriers on African exports, thereby improving access to markets;

• The degree to which the AA reduces the tariffs and non-tariff barriers on Africa's competitors, thereby eroding the value of the special tariff preferences that African countries have traditionally been accorded in many developed markets, especially the European Union;
• The degree to which the Agricultural Agreement and the entire Uruguay Round agreement lead to increases in global income and thereby increased demand for African products;
• The degree to which reduced domestic support for agriculture and reduced export subsidies in developed countries affect the prices of products which Africa exports; and
• The degree to which the AA requires African countries to modify their own support program for crops which they export.
Thirty-four African countries are WTO members, including all of the larger economic powers. Applications are pending for the Seychelles, Sudan, and Algeria. Several of the smallest countries (Cape Verde, Equatorial Guinea, Comoros, Sao Tome and Principe) are not official members but apply the agreements under the status of former colonies.
To what degree does the AA actually reduce tariffs and non-tariff barriers on African exports, thereby improving access to markets?
The AA calls for developed countries to reduce the average level of their Most Favored Nation (MFN) agricultural tariffs by 36 percent with a minimum reduction of 15 percent for each product. Developing countries are required to reduce average tariffs by 24 percent with a minimum of 13 percent for each product. All tariffs are to be bound; that is, the agreed upon rates cannot be exceeded. Developed countries are to phase in their reductions over a six -year period from 1994 to 2000, while developing countries have 10 years to phase in their reductions. The poorest countries are exempt from reduction commitments.
All signatories are required to convert non-tariff barriers (NTBs) on agricultural products into tariffs, through a process called tariffication. Once converted, these new tariffs must be reduced along the same lines as other tariffs.
Minimum market access provisions require a country whose NTBs effectively kept all foreign supply of a good out of its markets prior to the AA to guarantee that three to 5 percent of its market will be supplied by foreign countries under the new regime. The United States, for example, excluded foreign suppliers from its peanut market prior to the AA, but now is committed to allowing annual imports of 56,283 tons by the year 2000. The allowed quantities enter at a favorable tariff rate, but quantities beyond the "tariff quota" would generally face prohibitively high tariffs.
Sanitary and phytosanitary provisions call for member countries to employ scientific standards to determine all health-related measures that affect trade. The goal is to stop the use of
1 /
-I I
I I I I I I I I I I I I I I
arbitrary measures as a tool to restrict trade. Members are encouraged, but not required, to use international standards, such as those set by the F AO's Codex Alimentarius Commission, the International Office of Epizootics, and the International Plant Protection Convention. Members can use their own stricter standards, if they choose to, as long as the standards are "science-based."
At first glance these changes appear promising for African exporters. Upon closer examination, however, the results are less dramatic. There are several reasons for this.
First, the 36 percent average reductions to which the developed countries committed themselves are simple averages rather than weighted averages. Developed countries were allowed to chose which cuts to make on which products to achieve the simple 36 percent average reduction, and they tended to make smaller cuts on those commodities that were most heavily traded and most directly in competition with their own domestic production. To check what level of cuts were made on each agricultural product, one must check carefully each country's "schedule" of tariff commitments annexed to the overall Uruguay Round Agreement.
Second, the tariff cuts are to be made on the basis of average tariff levels in the 1986-1988 period. This was a period of particularly low commodity prices and therefore a period of particularly high tariff levels. Thirty-six percent reductions from these high levels result in much less actual tariff reduction than they would if they were applied to more recent tariff levels. In a few cases current tariff levels are already 36 percent below the 1986-88 levels.
Third, the process of tariffication did not improve market access in most cases. Under tariffication, the EU and United States transformed their existing agricultural import quotas into a system of Tariff Rate Quotas (TRQs) which allow imports of a commodity at a low tariff up to a certain quota but charge prohibitively high tariffs on any amounts beyond the quota limit. In most cases the effect is essentially the same as the original quota system. According to research conducted by Hathaway and Ingco (paper presented at World Bank Conference 1995), the EU, the United States, and many other countries tended to set over-quota tariff levels at exaggerated levels in a process the authors label "dirty tariffication." Because of these exaggerated levels, promised reductions of 15 to 36 percent will still result in tariffs that are too high to allow expanded trade in these products (e.g., the U.S. peanut tariff will fall from 155 percent to 131.8 percent).
Fourth, the minimum market access commitments made by developed countries, while significant, do not favor Africa's major export crops. The most significant minimum market access commitments were made by Japan and Korea to allow imports of foreign rice, a crop which Africa does not export.
Fifth, the AA includes "special safeguard provisions" that will allow, for those commodities subject to tariffication, the upward adjustment of tariffs to protect domestic production if:
• The volume of imports exceeds the average of the previous three years' imports by a certain "trigger amount," with the trigger level based on that commodity's proportion of consumption in the importing country; or
/

• The price of the imported product drops 10 percent below the average 1986-88 world reference price.
Sixth, and most importantly, most African agricultural exports already receive preferential tariff treatment in developed country markets, through mechanisms such as the Generalized System of Preferences, which provides duty-free or reduced-tariff access for some commodities originating in developing countries, and the Lome Agreement, which allows duty-free access to the EU for many commodities originating in developing countries with historical, colonial relationships with Europe. Boxes I and 2 explain how these systems work. Almost all African countries receive such preferential treatment for most of their agricultural exports. The cuts in the MFN rates agreed to in the URI AA do not, therefore, help Africa in most cases. Instead, the cuts erode these countries' margins of preference and cause their competitive position to deteriorate vis-a.-vis other suppliers. Trade losses will occur as some preference-receiving goods are displaced (diverted) by exports from other (non-preference receiving) countries.!
The UR did not cut GSP or Lome rates, which are very low or zero for most products (and cannot be cut below zero). Preferential treatment is considered a bilateral issue and strictly outside the multilateral trade negotiations.
For developing countries which hold a tariff preference over their competitors because of Lome or GSP, cuts in MFN rates reduce the level of their competitive advantage - a process called preference erosion. In this sense, the MFN tariff cuts agreed to in the AA represent a threat to Africa's market share in many commodities in developed countries. Morocco, for example, can export asparagus duty free to Europe, while the United States and Chili must pay a 16 percent tariff on their exports. Under the AA, this 16 percent MFN tariff will be reduced to 10 percent, cutting the advantage that Morocco enjoys by 6 percentage points.2
! Alexander Yeats, "What are OEeD Trade Preferences Worth to Sub-Saharan Africa?," African Studies Review, Volume 38, April 1995.
2 Oddly, several documents reviewed for this research seem to forget about preference erosion when hailing the achievements of the DR in reducing tariff rates. Blackhurst, Enders, and Francois (1995) present a table showing the 29 percent tariff reduction on coffee and cocoa as a benefit to 23 African countries, without so much as an asterisk to explain that all of these countries have duty free access to the EU and therefore wi1l be hurt, not helped, by the tariff reduction. The misleading table also appears in the WTO's own publication, International Trade Forum (111995).
q 4
I I I I
-I I I I I I I I I I I I I
I I
Box 1: The Generalized System of Preferences (GSP)
The principle of GSP - granting tariff reductions to developing countries - was first internationally accepted at an UNCT AD conference in 1968 where support was voiced for a "generalized, nonreciprocal, nondiscriminatory system in favor of developing countries." Under the GSP principle, industrialized countries make unilateral decisions to grant lower tariffs to developing countries, and each industrialized country decides how large these reductions will be and which countries are eligible.
Tariff reductions are helpful to developing countries; however, far from being generalized, nearly all schemes are subject to restrictions affecting country coverage, product coverage, depths of tariff cuts, safeguards, and rules of origin. Often times these require complex paperwork and are temporary in nature in the sense that they could be withdrawn at anytime. "Sensitive" products are usually excluded. About 30 percent of exports from the least developed countries that qualify for GSP tariff reductions fail to receive those reductions because of difficulties meeting administrative requirements (Lal, 1994).
The United States excludes Nigeria and Gabon from its GSP program because they are OPEC members, and India, Argentina, South Africa and many other countries are excluded on certain products. The U.S. GSP rate is usually zero, but citrus, grapes, tomatoes, roses, many types of fish, rice, and hundreds of other line items are totally excluded. Japanese GSP rates range from a 10 percent discount off the MFN rate to full duty-free. Product coverage is limited and ceilings apply for countries that exceed certain volumes.
The GSP of the EU excludes more line items than it includes, and the list of qualifying countries varies over time. GSP rates are less than MFN rates but usually more than zero. Currently, the EU is considering modifying its GSP to vary the tariff reduction depending on the beneficiary country's level of development and compliance with "social policies" such as environmental protection and child labor laws.
GSP rates were not negotiated in the Uruguay Round, and some say such preferences "are beginning to smack of a bygone era" (Page, Davenport, and Hewitt, 1992). The importance of GSP has shrunk as MFN rates have fallen and regional, more preferable preference schemes, such as Lome, have expanded.
How Serious Is the Preference Erosion Problem for Africa?
To answer this question one must first understand the pennissible complicated systems of tariff preference that currently exist. These are reviewed below:
• Most Favored Nation (MFN). These rates are the standard tariffs offered to all countries that are signatories of the GAIT (now known as members of the WTO). MFN tariffs are not preferential rates but rather the rates to which preferential rates should be compared.
• Generalized System of Preferences (GSP). These rates are the preferential tariffs accorded to developing countries and some transitional countries for certain commodity groups. They are intended to help developing countries develop exports. GSP rates are either zero or a percentage of the regular MFN rates. Each developed country decides
5 )!Q
for itself which products it will offer asp rates and how big the reduction will be. From mid-1995 until August 1996 the GSP program in the United States was suspended. The August 1996 legislation only extended the program to the end of May, 1997, so things are still in flux. The asp system in the EU is also under revision.
• Least Developed Countries (LDC). Under this sub-system of the GSP, OECD countries allow duty-free entry of certain commodities from the poorest developing nations. The ED's list includes 41 countries, most of which are in Africa, but excludes more developed countries such as Nigeria and Cote d'Ivoire. Most of these countries already benefit from the Lome Convention. The EU offers similar tariff terms to countries affected by drug trafficking in the Andean Pact and Central America. The U.S. list includes 35 countries, mostly African, that receive duty-free access for commodities designated as GSP goods, without any quantity limitations. The WC program will be suspended in the United States for as long as the GSP program is suspended.
• Bi-Iateral Trade Accords. Reduced rates or zero tariffs have been negotiated in trade agreements between the United States and its neighbors. These include: the North American Free Trade Agreement (NAFT A), the Andean Trade Preference Act, the Caribbean Basin Act, and the US-Israel Free Trade agreement. The European Union has similar agreements with its neighbors in Europe and the Mediterranean, including Turkey, Morocco, Algeria, Tunisia, Egypt, Cyprus, Malta, the non-EU Western European countries (EFT A), the countries of Eastern Europe, and Israel. These agreements offer generous tariff discounts or zero tariffs on many agricultural goods, but not on all. Preferences are often limited to fixed quantities of each commodity.
• The Lome Convention. Tariff rates are zero for the members of the convention on practically all agricultural exports to the EU. Lome convention countries are also known as ACP countries (Africa, Caribbean, and the Pacific). Virtually all African countries are members, with South Africa and the North African countries being the only exceptions. ACP exports of tropical products to the EU are not limited, but exports of sugar, beef, rum and a few other temperate crops are subject to quotas, which are defined in the convention and subsequent regulations.3
3 It is common practice to divide agricultural products into two groups: tropical products and temperate zone products. Although there are no agreed-upon definitions of these terms, in practice, tropical products applies to beverages like tea, coffee and cocoa; cotton and hard fibers like jute and sisal; and fruits like mangoes and guavas. Temperate zone products are those that are grown, and often subsidized, in DECO countries, such as wheat, other grains, meat, temperate fruit and vegetables, and dairy.
I I 6
I I I I

I I I I I I I I I I I I I I
Box 2: The Lome Convention
The Convention is a treaty of cooperation between the European Union and 70 of the world's poorest countries in Africa, the Caribbean, and Pacific (ACP). Most are ex-European colonies, and all of Sub-Saharan Africa is included, except South Africa. The first convention was signed in 1975, and the latest (Lome N) was signed in 1990, with a scheduled validity of 10 years.
Under Lome, the EU grants duty-free access to the ACP countries for almost all of their exports - a substantial and cherished preference. Quantity restrictions are applied only to tuna and a few vegetables and fruits (currently under revision), and special quotas apply to four "sensitive" crops: sugar, beef, rum, and bananas. These quotas are assigned to individual countries which use them to sell in the lucrative EU market, where prices are well above world levels. In Africa, beef quotas are assigned to Botswana, Kenya, Madagascar, Swaziland, Zimbabwe, and Namibia. Sugar quotas are assigned to Swaziland, Mauritius, Malawi, Madagascar, Kenya, Uganda, and Tanzania.
Doubts exist about whether the Lome scheme meets the GA'IT criteria for permissible preferential arrangements, but a waiver was obtained for the life of the existing convention, which expires in the year 2000.
Analysts agree that African countries will suffer the most serious preference erosion under the UR because they have the most to lose, particularly in the EU, where over half of their exports are destined (Harrold, 1995). Preferences result in at least 97 percent of each African country's exports entering the Community free of duty (Yeats, 1995).
Preference erosion will occur on some of Africa's most important agricultural exports: coffee, cocoa, other tropical products, and fish. Before the Agreement, GSP and MFN countries faced a 5 percent tariff on coffee beans in the EU while Lome convention countries faced no tariff. The 5 percent tariff is to be reduced to zero under the AA, thereby eliminating the Lome tariff preference. Before the AA, GSP and MFN countries faced a 3 percent tariff on cocoa beans while Lome countries faced no tariff. The 3 percent tariff will be eliminated under the AA.
On other tropical products, Lome countries faced no tariffs while MFN competitors faced an average of 7.6 percent and GSP countries faced 6 percent. Under the AA, the MFN rate is scheduled to fall to 4.2 percent and presumably the GSP rate will fall to the same level (ODI, 1994). The size of the Lome preference margin will thereby be reduced by 3.4 percentage points or 48 percent.
In the case of fish, MFN rates are scheduled to drop from 14 percent to 12 percent, while GSP rates of 10.6 percent remain the same. The size of the Lome preference margin for fish will fall by 2 percentage points but will still remain substantial.
Lome convention countries have better preferential tariff entry than other developing countries in some important sectors, including processed and unprocessed cocoa, in which Africa
7

competes with Brazil, Malaysia and Indonesia; processed and unprocessed coffee, in which Africa competes with Colombia and Brazil; pineapples, in which Africa competes with the Philippines; tobacco, in which Zimbabwe and Malawi compete with Brazil, India and the Republic of Korea; palm oil, in which West Africa competes with Malaysia; and beef, in which Africa competes with Argentina. In so far as these competitors enjoy tariff cuts under the AA, the Agreement hurts African exports.
North African countries generally have bi-Iateral trade agreements with the EU that give their products duty-free access to the EU up to certain quantity limits. The value of these preferential arrangements will be reduced as the AA cuts the MFN rates of their competitors.
In markets outside the EU, African countries generally face the same tariffs as other developing countries, i.e., the GSP or MFN rates (depending on whether or not the destination country offers the preferred rates for the particular product). In those cases where the GSP rate is below the MFN rate, cuts in MFN rates will erode the African preference margin. This is the case, for example, for pyrethrum flowers imported into Japan. African exporters of pyrethrum, such as Kenya, face no duty while developed countries, such as Australia, faced a 20 percent duty prior to the AA, an amount scheduled to drop to 12 percent under the Agreement.
For many agricultural commodities, there are no GSP rates and therefore African countries must pay full MFN tariffs. In these cases, AA tariff cuts will be beneficial to Africa. In the United States, for example, African countries face the full MFN tariff on bulk pineapples ($O.64lkg) while competitors with special trade arrangements with the United States face no tariffs (such as Mexico, and the Caribbean and Andean countries). Under the AA, the MFN rate will fall to $0.51Ikg, thereby providing a small improvement in Africa's competitive positi0n vis-a.-vis the Latin Americans.
As the above examples demonstrate, preference erosion is a real issue, but calculating the degree of erosion is complicated because of the complex maze of tariff levels that exist for different products, for different destinations, and for different preference schemes (which vary by product, season, and frequent legislative changes in destination countries). AA-induced tariff reductions will erode African preferences in many cases, but they will help African exporters and erode their competitors' preferences in other cases. Accurate assessments of impacts are probably best made on an individual country basis, allowing analysis of competitive positions for the products that each country exports. We attempt to carry out such assessments for six African countries in Part IT of this report.
In his article on DECD trade preferences, Yeats' figures are based on complete elimination of MFN duties. His analysis was conducted before the DR was finalized, which in the end cut MFN rates by about 36 percent. His projections, therefore, need to be adjusted downward by 64 percent, to a new estimate of $63 million in annual losses.
Lal of the World Bank (1994) updates Yeats' analysis, using actual DR results, but focuses only on the Least Developed Countries. He concludes that preference erosion will cause Africa's poorest countries to lose export revenues of $5.5 million in the EU, $6.5 million in Japan, and gain
8
-I I

I I I I I I I I I I I I I I I I
$4.2 million in the United States - resulting in an overall loss of $7.7 million - 0.1 percent of their total exports. Unfortunately, Lal's analysis does not separate the effects of the Agricultural Agreement from other aspects of the Round.
Harrold, in a draft paper for the 1995 World Bank Conference on the Uruguay Round, argues that the importance of preferences, and concerns about their erosion, are exaggerated. Harrold presents data showing that African exports to the EU typically enjoy preferences in the range of 2.1 to 4 percentage points (on average), while exports to the United States typically receive preferences of under 2 percentage points.4
Despite the difficulties of generalizing, several analysts have attempted to assess the degree of preference erosion caused by the Uruguay Round and the AA on Africa and developing countries on the whole.
Yeats (1995) analyzes African exports in detail and finds that Sub-Saharan African countries generally face low tariffs on their exports. The average tariff faced by African countries in OECD countries is only 0.66 percent which is 2.4 percentage points less than the average tariff faced by non-African exporters of the same goods (Table 1). Yeats calculates the trade losses that would occur if African preference margins disappeared due to liberalization of MFN rates. He finds that a complete liberalization of MFN duties would produce annual African trade losses of about $250 million in the EU and $14 million in Japan. In the US, the cuts would actually increase African exports by $89 million, because of the helpful effects of MFN cuts on textiles and clothing, mostly produced in Mauritius. Overall, the net losses from preference erosion would be $175 million annually.
According to Harrold, these preferences are quite low and therefore their erosion is not alarming. Harrold draws on a partial equilibrium trade projection model developed by the World Bank and UNCT AD to stimulate the impact of the actual Uruguay Round tariff cuts and predict the costs of preference erosion on African Least Developed Countries (LDCs). The results predict net trade losses of about $7.5 million in the OECD markets with a loss of $5.4 million occurring in the European Union. Harrold points out that this represents only a tenth of 1 percent loss in total African LDCs' exports to these destinations. Losses in the EU are somewhat offset by positive trade gains in the United States market due to reductions in the MFN tariffs that Africa faces on textiles and clothing exports to that market. Harrold concludes that "the impact of preference erosion on African exports will only have a very small impact on trade," and the effects "would be so small as to be unnoticeable in comparison with other factors influencing exports and development in Africa."
4 The averages presented by Harrold are based on all aspects of the Uruguay Round and not just the Agricultural Agreement. The inclusion of clothing trade may explain the higher preferences in the EU, which allows duty-free entry for ACP countries, and the lower preferences in the United States, which excludes clothing and textiles from preferences.
9 )~

Table 1: Incidence of OECD Tariffs on Sub-Saharan Countries' Non-Oil Exports (%)
OECD Average European Community Japan United States
Exporting African Preference African Preference African Preference African Preference
country tariff margin * tariff margin tariff Margin tariff margin
Angola 0.2 -1.5 0.3 -3.2 1.8 0.0 0.1 -0.4
Botswana 0.3 -2.8 0.1 -2.9 0.0 -2.1 3.5 -1.1
Cameroon 0.4 -2.5 0.1 -2.8 0.0 0.0 2.1 -1.1
C.A.R. 0.2 -2.2 0.2 -2.3 0.0 0.0 0.0 -1.1
Chad 0.4 -2.7 0.2 -2.9 2.5 0.0 1.6 0.0
Congo 0.1 -1.4 0.0 -2.2 0.0 0.0 0.3 -0.6
Cote D'Iv. 0.7 -3.1 0.3 -3.3 1.2 -0.5 3.3 -2.0
Ethiopia 0.7 -1.3 0.1 -1.9 1.5 -1.3 2.0 0.4
Gabon 0.6 -2.0 0.0 -2.7 0.0 0.0 2.9 0.7
Ghana 1.0 -2.2 0.1 -3.1 2.3 0.0 2.6 -0.9
Guinea 0.6 -2.3 0.0 -2.9 1.8 -1.9 1.9 -1.0
Kenya 0.5 -3.3 0.2 -3.5 2.4 -1.1 3.1 -2.3
Liberia 0.6 -1.7 0.3 -1.9 0.0 -0.3 2.5 -1.1
Madagascar 0.5 -2.0 0.4 -2.7 0.8 -0.2 0.8 -1.0
Malawi 1.1 -2.4 0.1 -3.5 0.0 -0.1 5.4 -0.6
Mali 0.4 -3.4 0.2 -3.5 0.0 -1.6 3.1 -2.2
Mauritania 1.7 -2.3 0.2 -3.9 3.6 -0.4 1.2 -1.6
Mauritius 1.3 -3.1 0.2 -3.4 4.8 -1.1 6.4 -1.8
Niger 0.1 -3.0 0.0 -3.0 0.0 0.0 3.3 -1.6
Nigeria 2.7 -0.9 0.1 -2.6 3.7 -0.8 5.2 0.7
Senegal 0.5 -3.3 0.3 -3.5 3.6 0.1 4.9 -1.2
Sierra 0.5 -3.1 0.0 -4.0 2.6 -0.7 2.3 -0.2
Sudan 0.1 -1.5 0.1 -1.9 0.0 0.0 0.7 -1.0
Swaziland 0.8 -4.4 0.5 -4.9 6.7 -3.0 3.5 -1.9
Tanzania 0.1 -2.3 0.0 -2.5 1.4 -1.0 0.0 -2.4
Togo 0.3 -2.8 0.2 -2.8 9.8 -0.8 0.2 -2.8
Uganda 0.9 -2.4 0.6 -3.0 0.0 0.0 2.1 -0.3
Zaire 0.3 -2.1 0.1 -2.4 0.0 -0.5 1.3 -1.1 Zambia 0.3 -1.7 0.5 -2.9 0.0 -0.6 1.4 -1.4
Zimbabwe 0.9 -2.5 0.2 -3.3 1.2 -1.0 4.0 -1.0
*Negatlve values show the average preferential tariff margins (in points) that the African Exporter has over all other exporters of the same goods. Positive values indicate that the exporter faces a higher than average tariff due to preferences other countries receive. All tariffs shown above are the simple average (unweighted) of duties faced on the country's exports. Source: Yeats, 1995.
10
I I I
I I I I I I I I I I I I I I I I
Evaluation of the accuracy of Harrold's conclusion is difficult for several reasons. First, his partial equilibrium estimates are based only on the Least Developed Countries, leaving out some of Africa's biggest traders such as Cote d'Ivoire, Kenya, South Africa, Nigeria, Cameroon, and the Maghreb countries. Losses could be much greater if these countries were included in the analysis. Second, his analysis is based on the entire UR and not just the AA, which is our focus in this paper. If the analysis were restricted to the AA, net losses might be smaller or greater, because both total losses and total gains would be smaller. Overall, our impression is that Harrold is overly eager to downplay the importance of preference erosion. The evidence suggests that preference erosion on tropical exports will not be devastating, but it will be significant, particularly in Europe where most African exports are directed, and the impact will be substantial for many other agricultural products for many African countries.
Three analysts at the Overseas Development Institute (ODI) also address the issue of preference erosion in a 1994 report called "The Impact of the GATT-Uruguay Round on ACP States" (Davenport, Hewitt, and Koning). Based on partial equilibrium modeling, the report estimates that African ACP States will lose $175 million of their export revenue due to preference erosion, an amount equal to 0.7 percent of their total export earnings on the EU market. Most of this loss is due to preference erosion for coffee and cocoa beans, basic wood exports, and metals and minerals. The authors stress that this estimate only suggests the static loss in current African exports, and that dynamic losses will be greater through lost investment.
According to ODI, African ACP countries were hurt most by preference erosion in the area of tropical products exports, with coffee beans and cocoa beans being the most important products, but with cut flowers and plants, nuts and tropical fruits, spices, and tobacco also responsible for significant losses. For ACP exporters of coffee and cocoa beans, the earlier preferences of 5 and 3 percentage points are eroded 100 percent under the AA. For the other tropical products, the ACP countries lose 48 percent of their advantage vis-a.-vis MFN exporters and 30 percent vis-a.-vis GSP exporters. Overall, ACP countries are expected to lose export revenues of $45 million in the area of tropical products. Ghana and Cote d'lvoire are hard hit by preference erosion in cocoa, while Uganda, Kenya, Cote d'Ivoire and Cameroon loose the most in coffee.
Fish exports to the EU is another area of concern for the African ACP countries. Luckily, from their point of view, average MFN tariffs in this sector did not drop dramatically - only from 14 percent to 12 percent - thereby leaving a substantial level of preference for the duty free ACP countries. The 001 report estimates that losses from this small preference erosion will be limited to $31 m annually, with Senegal losing about $2.3 m and Cote d'lvoire about $1.9 m.
The 001 report analyzes separately the negative effects of the Uruguay Round on the earnings of ACP countries from exports of beef and sugar to the EU. Under the Lome Convention, certain ACP countries are allocated quotas of allowable exports of these products into the EU for sale at internal EU prices - prices that are substantially higher than world prices. These quotas, therefore, are highly prized. The ODI model assumes that EU import prices fall by 30 percent for sugar and beef as the result of EU reductions in farm support induced by the Uruguay Round. The revenue generated by the ACP preferences for these products therefore falls by 30 percent in the
11 JL

model. According to the authors, losses will be significant for these African beef exporters: Botswana, Kenya, Madagascar, Swaziland, Zimbabwe, and Namibia, and these African sugar exporters: Swaziland and Mauritius. The ODI report does not report on the value of these losses separately; instead, it combines them with other preference losses and trade losses to estimate an overall commodity trade loss of $230 million per year for African ACP countries, which represents 1.3 percent of its export revenues to the EU.
The authors acknowledge that this overall estimate seems small. They explain that only
about half of ACP exports to the EU will suffer trade diversion since the other half consists of products which already enter the EU market free of tariffs for all suppliers. Even where MFN tariffs are non-zero, in many cases the main competitors to the ACP are other developing countries which enjoy comparable preferential treatment. The reported losses, however, are only static estimatesdynamic effects on investment and future export earnings are difficult to quantify but they may double the loss figures.
The authors point out that aggregate losses are small in percentage terms, but losses are likely to be much higher in certain countries. The biggest losers in Africa are shown in Table 2 below:
Table 2: ACP Export Losses to the EU, Relative to Total Revenue from Exports to the EU and to the World
Total export Loss as % Loss as % loss ($ millions) of total exports of total exports
to the EO to world
Ethiopia -13.6 -10.62 -3.97
Mauritius -44.6 -4.96 -3.52
Senegal -17.2 -4.58 -2.39
Tanzania -6.4 -3.40 -1.37
Malawi -5.6 -3.07 -1.35
Source: OD!, Davenport et. aI., 1994. Note: these losses are due to lost preferences in agriculture, fish, wood, and manufactures (clothing and textiles losses are excluded).
The ODI authors conclude that continent-wide estimates are likely to overlook many of the complex ways that AA-induced tariff and policy shifts can affect trade patterns. They recommend a more detailed study, looking into all products exported by the ACP states individually, and taking into account changes in MFN and asp tariffs plus non-tariff barriers for each product, to get a better picture of the effects of the opening of the EU market.
Another study that addresses the preference erosion question is Blackhurst, Enders, and Francois (1995). Without looking at the issue in as much detail as the aDI report, they find that Africa will suffer from preference erosion in Europe, but that conditions of market access may
1\ 12
I I I I

I I I I I I I I I I I I I I I I
improve in Japan and the United States. The improvements in the United States and Japan, however, are unsure because price advantages to African exporters granted under GSP in these markets will be eroded and because there is an absence of comprehensive data on the benefits offered under these programs. The authors conclude that the overall significance of GSP preference erosion is likely to be negligible since most donor countries circumscribe the benefits available by quota limitations, excluded products and eligibility conditions.
A recent paper prepared by the WTO and UNCT AD Secretariat (April 1996) recognizes that preference erosion may lead to significant losses in some specific products exported by specific countries; however, the paper emphasizes that overall losses will be slight and the new MFN tariffs are legally bound, in contrast to the preferential rates which are not. Emphasizing the positive, the WTO and UNCT AD argue that "the margin of preference may be lower, but the security of market access is unambiguously greater."
To what degree will the Agricultural Agreement and the entire Uruguay Round lead to increases in global income and thereby increased demand for African products?
While preference erosion will hurt Africa, increases in global income resulting from trade liberalization caused by the DR Agreement will help Africa by increasing demand for its products. The effects on global income have been estimated by a number of economic modelers:
Study Estimates of increase in global income
GATT (1994) $235 billion annually by 2005 from the full market access package (1992 dollars)
World Bank/OECD (1993) $213 billion annually by 2002 from liberalization on industrial tariffs and agriculture (1992 dollars)
OECD (1993) $274 billion annually by 2002 from liberalization of industrial tariffs and agriculture (1992 dollars)
Nguyen, Perroni, and Wigle (1993) $212 billion annually from the full market access package
Source: GAIT 1994 In am 1994
These four studies predict (on average) an annual increase in world income of about 1 percent by 2002. According to the OD! report, the increased demand triggered by this growth would increase Mrican export revenues by $481 million dollars, assuming an income elasticity of one for Mrican products, or by $1.4 billion dollars, assuming an income elasticity of three. These expected gains are $251 million larger than the expected losses due to preference erosion, resulting in an expected net gain in African export revenues of 0.6 percent (using the lower elasticity estimate) or 2.7 percent (using the higher elasticity estimate). Such gains are not uniform, however, and about 25 African countries will still show losses, even after the income effect (using the lower elasticity estimate).
13
A second set of analysts that have considered this issue (Goldin, Knudsen, and van der Mensbrugghe, 1993) agree that GAIT -induced growth in OECD countries will help expand demand for African exports and thereby increase African revenues. They calculate that if OECD real income increases by 18 percent between 1993 and 2002, this effect alone will result in a real income gain of about 2 percent in Africa. Higher gains will accrue to those countries with the highest level of penetration in the economies of the DECD countries.5
More recent work on this question by Goldin and van der Mensbrugghe (1995) greatly scales back the predictions for global income gains. Based on an analysis of the actual agreement, with less liberalization than was originally hoped for, these analysts now predict gains of $25-48 billion in global income, roughly a quarter of what was originally expected. These more modest gains will mean more modest growth in demand for African exports.
To what degree will reduced domestic support for agriculture and reductions in export subsidies in developed countries affect African exports?
These measures, as required by the Agricultural Agreement, would be expected to lead to less production of temperate crops in developed countries and therefore higher prices on world markets. Higher prices for wheat, coarse grains, rice, beef, and other such commodities will improve earnings for African exporters, but will hurt African importers, particularly countries that are heavy food importers. In this section, we consider impacts on exports only, leaving questions of import bills for later.
Analysts that have looked at this issue predict that the reduced domestic support levels for agriCUlture agreed in the UR will have a limited impact on world prices, but reductions in export subsidies will have a more substantial impact.
Domestic Support: Hathaway and Ingco (1995) show in their paper how Agricultural Agreement provisions requiring reductions in domestic subsidies were watered down during the final months of the negotiations, minimizing their probable impact. The final Agreement requires developed countries to cut their aggregate level of subsidization for agriculture (as measured by the Aggregate Measure of Support - AMS) by 20 percent over the six-year implementation period, but it does not make reference to any specific commodities. According to Hathaway and Ingco, this leaves the door open for maintaining high subsidy levels for sensitive crops and achieving the required aggregate cuts through creative accounting or through cuts that have already occurred for independent domestic reasons. They also point out that the Agreement exempts major subsidy programs in the United States and EU (e.g., U.S. deficiency payments) as well as a variety of other subsidies considered "non-distorting" (so called "green box" policies). As a result, in their assessment, there are likely to be few policy changes that will reduce the incentives to produce in DECD countries, and thus the hoped-for cut backs in subsidized outputs are unlikely to be realized.
SPAO (1995) stresses that global income growth, induced by the UR, will have a particularly strong effect on demand in particular commodities. Rising world incomes are predicted to expand sugar demand by 5 percent over baseline projections by the year 2000. In addition, smaller increases in coffee and cocoa exports are predicted.
/0, 14
I I I I
I I I I I I I I I I I I I I I
In another paper, Ingco (1995) concludes that the "new. commitments may not involve any further real reductions in current levels of domestic support" (p. 12).
This conclusion is accepted by other analysts, such as Francois, McDonald, and Nordstrom (1995) who state that the committed reduction in domestic support involves no cuts beyond those already undertaken in recent years. According to these analysts, the calculation of the base Aggregate Measure of Support, to which the cuts apply, is based on outlays during the period 1986 to 1988, which was characterized by relatively low world market prices for agricultural goods and therefore high outlays of domestic support to farmers. Because of a combination of higher world market prices and domestic reforms, the new commitments may not, at least in the short to medium run, entail any further cuts in domestic support. Believing the commitments to be impotent, these analysts drop them from any consideration in their economic modeling of the UR.
Export Subsidies: The impacts of reductions in export subsidies are expected to be more important. The agreement defines the permissible upper limit in the use of export subsidies by country and commodity and defines these limits in the individual country schedules. Where countries had no export subsidies in the base period, they are prohibited from using them in the future, and countries which use them cannot use them on products where they were not used in the base period. Developed countries are required to reduce the volume (quantity subsidized) of their subsidies to a level 21 percent below the volume in the base period 1986-90. They are required to reduce their budget outlays on subsidies to 36 percent of the average amount spent during the base period. These reductions should be made over the six-year implementing period. Developing countries are also required to reduce export subsidies, but by a lesser amount, over 10 years. The EU, United States, Canada, Turkey, Hungary, and Brazil are the most important subsidizers.
The reports by Hathaway and Ingco (1995) and Ingco (1995) analyze the reduction commitments of the major export subsidizers to assess the probable impact of these reductions on world markets for the relevant commodities, i.e., wheat, rice, sugar, dairy products, vegetable oil, coarse grains, beef and veal, pork, and pOUltry. They find that during the base period of 1986-90:
• Subsidized wheat accounted for nearly half of world trade in wheat;
• Subsidized dairy products accounted for over half of world trade in dairy products;
• Subsidized beef accounted for about one third of world trade in beef;
•
•
Subsidized coarse grains accounted for about a quarter of world trade in coarse grains; and
But subsidized exports in rice, sugar, and vegetable oil accounted for only about 5 percent of world trade in these commodities.
They conclude, therefore, that the export subsidy reductions will have significant impacts on world markets for wheat, beef, dairy products, and (to a lesser extent) coarse grains markets, but that they
15
will not significantly impact rice, vegetable oil, or other markets where subsidies have been less dominant. Price increases can be expected on wheat, dairy products, beef, and coarse grains, but the authors decline to speculate about the size of these increases, saying too much uncertainty surrounds how domestic policy shifts in the United States and EU may affect their use of export subsidies.
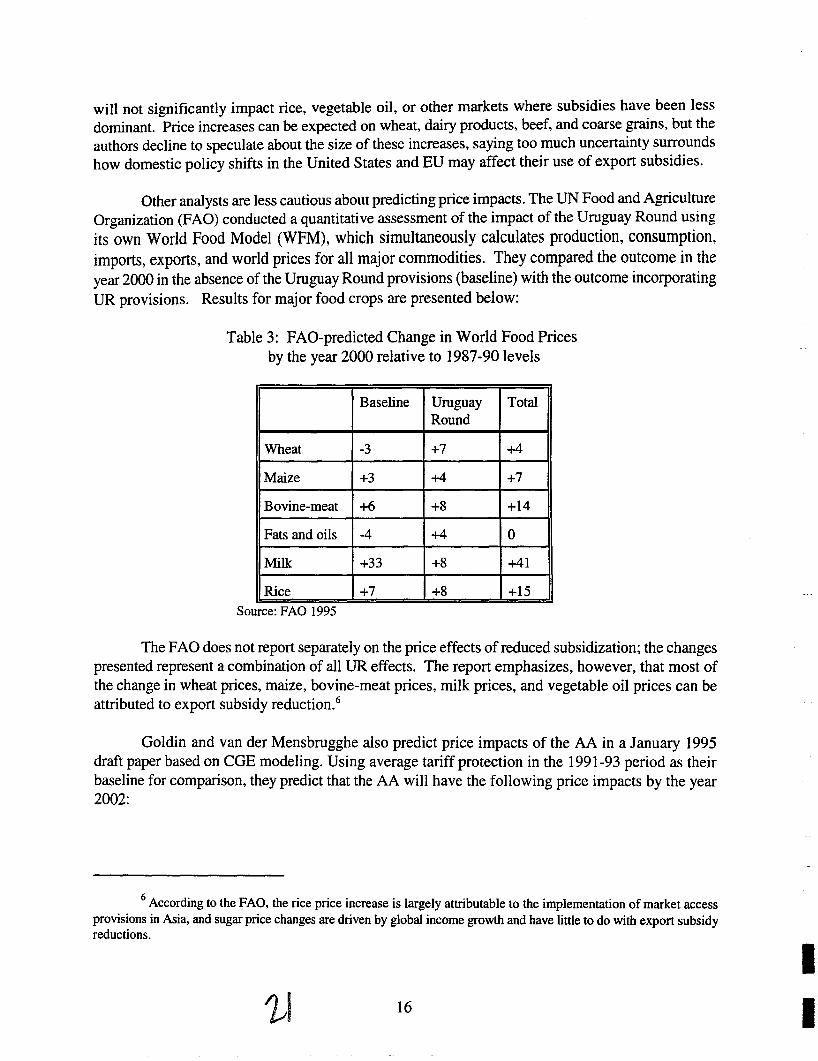
Other analysts are less cautious about predicting price impacts. The UN Food and Agriculture Organization (FAO) conducted a quantitative assessment ofthe impact of the Uruguay Round using its own World Food Model (WFM), which simultaneously calculates production, consumption, imports, exports, and world prices for all major commodities. They compared the outcome in the year 2000 in the absence of the Uruguay Round provisions (baseline) with the outcome incorporating UR provisions. Results for major food crops are presented below:
Table 3: FAD-predicted Change in World Food Prices by the year 2000 relative to 1987-90 levels
Baseline Uruguay Total Round
Wheat -3 +7 +4
Maize +3 +4 +7
Bovine-meat +6 +8 +14
Fats and oils -4 +4 0
Milk +33 +8 +41
Rice +7 +8 +15 Source: FAO 1995
The FAD does not report separately on the price effects of reduced subsidization; the changes presented represent a combination of all UR effects. The report emphasizes, however, that most of the change in wheat prices, maize, bovine-meat prices, milk prices, and vegetable oil prices can be attributed to export subsidy reduction.6
Goldin and van der Mensbrugghe also predict price impacts of the AA in a January 1995 draft paper based on CGE modeling. Using average tariff protection in the 1991-93 period as their baseline for comparison, they predict that the AA will have the following price impacts by the year 2002:
6 According to the FAO, the rice price increase is largely attributable to the implementation of market access provis~ons in Asia, and sugar price changes are driven by global income growth and have little to do with export subsidy reductIOns.
16
I I
I I I I I I I I I I I I I I
I I
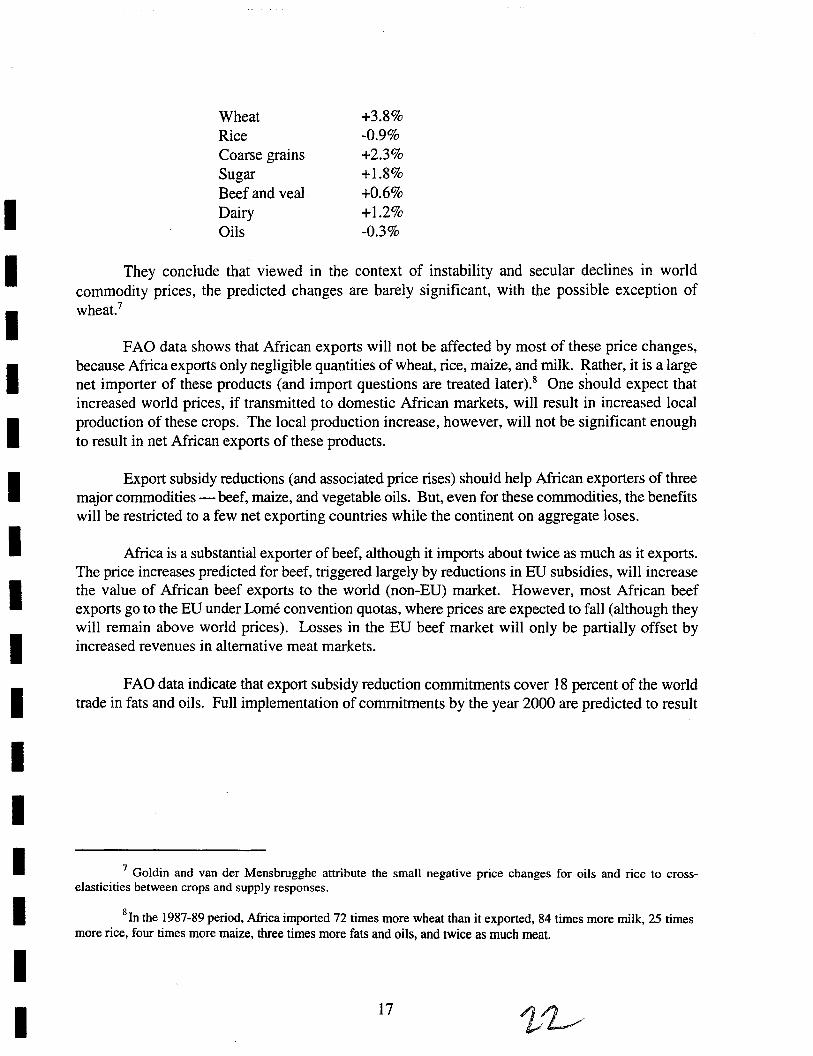
Wheat +3.8% Rice -0.9% Coarse grains +2.3% Sugar +1.8% Beef and veal +0.6% Dairy +1.2% Oils -0.3%
They conclude that viewed in the context of instability and secular declines in world commodity prices, the predicted changes are barely significant, with the possible exception of wheat. 7
FAD data shows that African exports will not be affected by most of these price changes, because Africa exports only negligible quantities of wheat, rice, maize, and milk. Rather, it is a large net importer of these products (and import questions are treated later).8 One should expect that increased world prices, if transmitted to domestic Mrican markets, will result in increased local production of these crops. The local production increase, however, will not be significant enough to result in net African exports of these products.
Export subsidy reductions (and associated price rises) should help Mrican exporters of three major commodities - beef, maize, and vegetable oils. But, even for these commodities, the benefits will be restricted to a few net exporting countries while the continent on aggregate loses.
Africa is a substantial exporter of beef, although it imports about twice as much as it exports. The price increases predicted for beef, triggered largely by reductions in EU subsidies, will increase the value of African beef exports to the world (non-EU) market. However, most African beef exports go to the EU under Lome convention quotas, where prices are expected to fall (although they will remain above world prices). Losses in the EU beef market will only be partially offset by increased revenues in alternative meat markets.
FAD data indicate that export subsidy reduction commitments cover 18 percent of the world trade in fats and oils. Full implementation of commitments by the year 2000 are predicted to result
7 Goldin and van der Mensbrugghe attribute the small negative price changes for oils and rice to crosselasticities between crops and supply responses.
8In the 1987-89 period, Africa imported 72 times more wheat than it exported, 84 times more milk, 25 times more rice, four times more maize, three times more fats and oils, and twice as much meat.
17
in prices 4 percent higher for vegetable oils than without the UR. Although Africa as a whole is a net importer of vegetable oils, certain countries, such as Cote d'Ivoire, are net exporters that will benefit from the price increases.9
For maize, the FAD predicts that the reduction in subsidized exports under the DR is likely to cause higher international maize prices. A few Southern African countries that are normally net exporters will benefit from this increase, although in recent years drought conditions have made most of these countries net importers, like the rest of Africa. Interestingly, South Africa has been a subsidizer of maize exports in the past, and is required to reduce those subsidies in the Agricultural Agreement.
Will the AA require African countries to modify their own support program for crops that they export?
According to Harrold (1995) the negotiations in the Uruguay Round were essentially a conversation between developed countries. As a consequence, very little is asked of developing countries, particularly those in Africa.
In theory, developing countries are to reduce their domestic subsidization of agriculture (AMS) by 13 percent over 10 years, but in practice this measure will have no affect on agricultural support programs in Africa. This is because of the many exceptions given to all countries for "green box" policies and the special exceptions given to developing countries. Thus, virtually all government support measures for agriculture can be justified in Africa, including services such as agricultural research and extension, marketing and promotion, targeted credit provision, public stock holding for food security reasons, domestic food aid, regional assistance programs, investment subsidies, and agricultural input subsidies to low-income or resource-poor producers. For developing countries, subsidies that do not exceed 10 percent of the value of a country's agricultural production are exempt from discipline.
DR commitments on export subsidy reduction are also unlikely to impact African agricultural policy in any way, with the exception of South Africa. Least developed countries are exempt from reduction requirements, and African countries generally cannot afford and do not use export subsidies anyway. Indeed, their tradition has been one of taxing exports, a practice that is not disciplined by the GATT. The Agricultural Agreement disallows introduction of new export subsidies, thereby forbidding African countries from introducing export subsidies in the future, but this is probably not something they could afford or planned to do anyway. The door is left open for developing countries that want to subsidize marketing or internal transport of agricultural products. South Africa is the only African country that uses export subsidies on a regular basis. It has committed to reduce its subsidies on coarse grains from a base of 24 million metric tons to 19.5 million tons by the year 2000.
9 Ingco (1995) disagrees with the FAO assessment on vegetable oils, saying that the volume of subsidized exports is a small share of world trade and reductions are unlikely to have a significant impact on world prices (p. II).
18
• I I

I I I I I I I I I I I I I I I I
committed to reduce its subsidies on coarse grains from a base of 24 million metric tons to 19.5 million tons by the year 2000.
In sum, the AA will have little effect on Mrican export policies, with the exception of South Africa. According to the FAO (1994),
[I]t is apparent that the agricultural component of the UR agreement is primarily designed to affect the behavior of policy makers in developed countries, where agricultural producers generally benefit from substantial subsidies. In contrast, in many developing countries the main thrust of policy has been to tax agricultural producers, particularly those producing export crops. The extent to which agricultural producers and exporters are taxed is not likely to form a requirement of any international agreement, even though it is likely to form part of domestic reform policies.
The domestic support and export subsidy reduction measures in the AA thus will have virtually no affect on African export policies. The agreement, however, will have a greater effect on agricultural import policies, which are addressed separately below.
What are the probable impacts of the AA on agricultural imports and food security in Africa?
The AA can affect imports and food security in Africa in three ways:
• By requiring liberalization in the tariffs that African countries charge on food imports;
• By causing increases in world food prices, making iinports more expensive; and
• By influencing the availability of food aid.
Will the AA require African countries to lower tariffs and allow more imports?
Detractors of the Agricultural Agreement have asserted that it will require poor developing countries to throw their markets open to uncontrolled imports from developed countries that have large-scale farms, pushing peasants from their small farms into urban slums. A careful reading of the agreement, especially the associated country schedules, reveals that these assertions are groundless. In truth, very little is asked of developing countries under the AA and it requires very little actual tariff reduction in Africa.
Unlike industrial countries, developing countries were not required by the AA to bind their tariffs at a level based on their 1986-88 tariff levels. mstead, they were permitted to declare simple "ceiling bindings," without relation to existing tariffs, at levels they chose arbitrarily - at high levels in most cases. Developing countries are required to reduce these bound levels by 24 percent over
19
a 10-year period, but least developed countries are exempted from these reductions. Most African countries, therefore, made no tariff reduction commitments. 10
Harrold shows the extent of African commitments in Table 4 (which contains only the agricultural portion of the original table). The table shows that African bindings are very high, generally over 100 percent. Average applied rates in these commodities are usually well under 50 percent. Thus the ceiling bindings have no practical impact. Senegal, for example has bound itself to a ceiling of 180 percent compared with average applied tariffs of 44 percent. Sub-Saharan African countries make no commitments to reduce internal support or export subsidies, with the exception of South Africa. From these data, Harrold concludes that the rationalization of protection In
agriculture in Africa will have to rely on unilateral actions and not the WTO.
Ingco also shows how little the Agricultural Agreement asks of Sub-Saharan African countries. While all were required to bind their agricultural tariffs, most chose to do so at prohibitive levels (100-300 percent) set way above pre-DR levels of protection. And very few Sub-Saharan African countries offered reductions in their ceiling bindings, with only Cote d'Ivoire, Ghana, and Zimbabwe offering minimum reductions on several commodities. The South African Customs Dnion (South Africa, Swaziland, and Namibia) is the exception, as it committed to reduce its duties from more than 70 percent to 40 percent over six years.
In North Africa, the DR commitments indicate no or very little liberalization in most commodities. In Morocco, for example, import licenses have been maintained for many commodities and state trading enterprises continue to monopolize imports of most grains, vegetable oils, and sugar. In the DR, Morocco established tariff equivalents which provide potentially higher rates of protection for most agricultural products. The bound tariffs submitted by Morocco were substantially higher than the actual tariff equivalent rates during the base period. Although these tariffs are to be reduced by 24 percent, most commodities will still receive higher protection rates at the end of the DR implementation period relative to the pre-DR period. In the case of wheat, for instance, the bound tariff was set at 190 percent for durum wheat in 1995, declining to 144 percent in 2004, which is still higher than the estimated tariff equivalent at 130 percent in 1986-88.
Aside from tariffs, there are three other areas where African policy makers have expressed concerns about the AA's impact on food import policies.
10 According to Hathaway and Ingco (1995), "it was not until the country schedules were tabled in the final days of 1993 and early 1994 that it was generally recognized that developing countries could choose to escape the disciplines and that many had chosen to do so."
20
• I I I I

I I I I I I I I I I I I I I I
Country
Benin
Burkina Faso
Cameroon
Congo
Cote d'Ivoire
Gabon
Ghana
Kenya
Madagascar
Mali
Mauritania
Mauritius
Namibia
Niger
Nigeria
Senegal
South Africa
Swaziland
Tanzania
Uganda
Zambia
Zimbabwe
Table 4: Agricultural commitments in the DR by Sub-Saharan African Countries
GAIT Status Average rate of tariff Average applied binding (%) rates (%)
LD 80
LD 150 .
D 310
D 30
D 215
D 260
D 98 22*
D 100 44*
LD 280
LD 110
LD 54
D 135
D 40
LD 132
D 230 47*
D 180 44*
IND 40 7*
D 40
LD 240
LD 80
LD 124
D 161 24* LD=least developed, D=developmg, IND=mdustnahzed *from GAIT Trade Policy Reviews, latest available • provided list of permitted programs but no subsidy reduction commitments source: Harrold (1995)
21
Domestic Export support subsidies
- -
- -
- -
- -
• -
- -
- -
- -
- -
• -- -
- -
- -
- -
- -
• -
by 2000 by 2000
- -
- -
- -- -
- -

The first has to do with state trading enterprises and their monopoly on imports of various food commodities in many African countries. Such monopolies are not prohibited by the AA. Their "mark-ups," however, are constrained, in theory, by countries' tariff bindings. As Ingco explains, "if a tariff is bound, at say 40 percent, any duty at the border greater than 40 percent is prohibited whether it is a tax levied by the government or a "mark u" charged by a state trading enterprise (STE) ... Under the agreement, STEs or any import monopoly cannot provide domestic protection in excess of the tariff bindings" (p. 7). However, as shown earlier, bindings were set so high in most African countries that this constraint on "mark ups" will not be relevant for the foreseeable future. Ingco (1995) argues that the AA failed to bring any discipline to STEs, thereby leaving room for significant trade distortions, and she is skeptical about the ability of the WTD to control STE actions or discipline resale prices.
Variable levies are another policy issue affected by the AA. In the last few years, a few African countries have been considering establishing variable levies on commodity imports as a means to insulate their markets from world price instability. Under the GATT and the UR, these types of variable levies are formally forbidden. Ingco points out, however, that the door is not closed on variable levies. Under the AA, countries can charge tariffs at varying levels within the margin of the binding, which could be linked to an internal price. The duty can be set as the difference of the given domestic price and the world price as long as the tariff charged does not exceed the binding. In practice, this could work like a variable levy. The permissibility of such a policy remains ambiguous at this time.
A third import policy that may be affected by UR rules is the use of minimum prices in customs valuation. In West Africa, customs offices routinely use minimum price lists (prix mercuriales) to assess the value of imported goods. The technique is designed to reduce customs fraud and under-invoicing for tax evasion. Under the UR, an agreement on customs valuation prohibits the use of minimum prices, requiring their phase-out in five years; however, it is unclear how rigorously this will be enforced in the case of Africa.
How will the AA affect food import expenses?
Until very recently, most analysts predicted that the AA would cause a substantial rise in international food prices, thereby causing sizable increases in the food import bills of developing countries. The international price increases would be driven by subsidy reductions in the DEeD countries and therefore reduced production and tighter supplies. According to the FAD (1995), developing countries in Africa can expect their food import bill to increase from $6 billion in 1989 to $10.5 billion in the year 2000, with about $0.5 billion of the increase (11 percent) attributable to the effects of the Uruguay Round. The FAD predicts that the UR will lead to increases in wheat prices by 7 percent, rice prices by 8 percent, and maize prices by 4 percent.
There have been widespread concerns about these projected increases and their impact on the poorest food importing countries. According to the FAD, there will be cases where low-income developing countries that are frequent recipients of targeted export subsidies will see the availability
t1 22
I I I I
I I I I I I I I I I I I I I I I
of these subsidies reduced and as a result will have to pay world market prices for more of their food at a time when world prices are expected to increase.
In response to these concerns, the UR issued a "Decision on Measures Concerning the Possible Negative Effects of the Reform Programme on Least-developed and Net Food Importing Countries." This decision recognizes the concerns of developing countries and suggests that some compensation be provided in the form of food aid and technical assistance for agricultural development. The Decision also refers to the possibility of assistance from the International Monetary Fund and the World Bank with respect to the short-term financing of food imports. The Decision is not very specific or operational, but its implementation is the responsibility of the WTO's Committee of Agriculture.
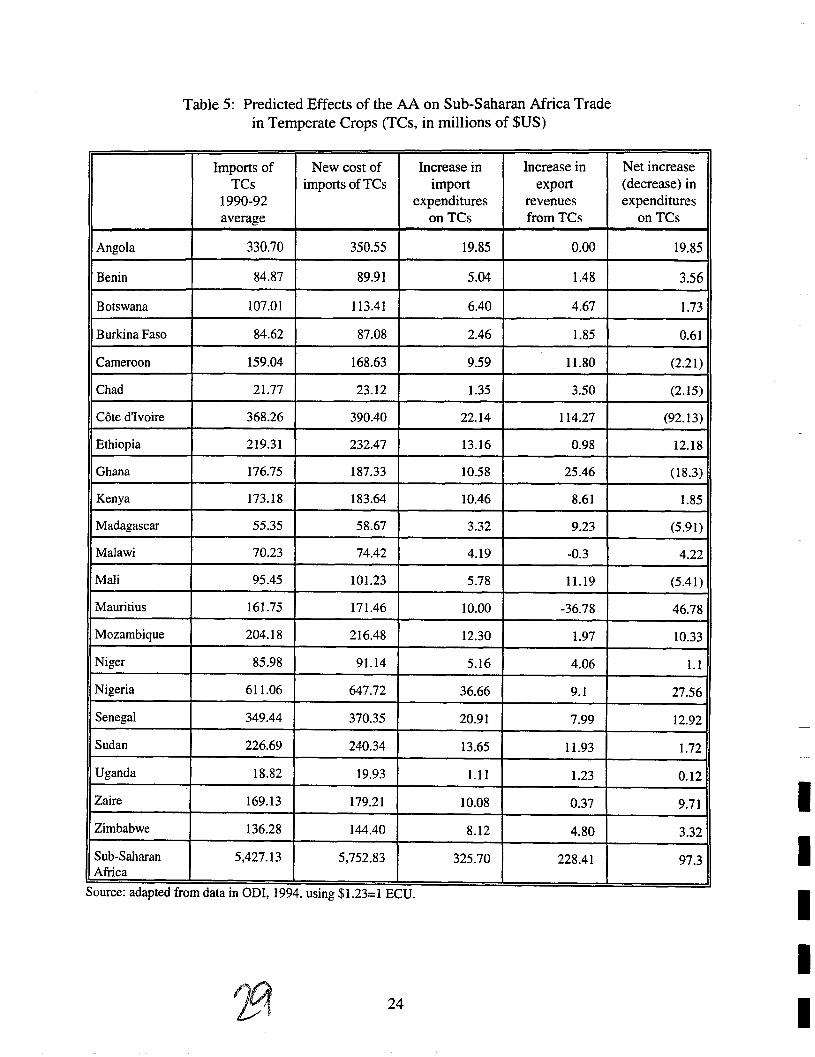
ODI examines the question of food import bills in its 1994 report on the ACP States. ODI assumes that the AA will cause a 5 percent increase in the prices of temperate crops such as wheat and an 8 percent increase in sugar prices. As a result of these price increases, Sub-Saharan Africa's annual food import bill is projected to increase from $5.43 billion to $5.75 billion because of the AA (assuming import volumes are constant). This $320 million increase is offset to some degree by improved earnings from African exports of temperate crops, so that the net food expenditure increase for Africa is estimated at $97 million. Table 5, adapted from the OD! report, shows the effects on selected SSA countries.
Harrold, commenting on the ODI study, concludes that price increases caused by the AA will raise the net food deficit in Sub-Saharan Africa by "about $100 million only, or perhaps close to $200 million if the gainsfor Cote d'Ivoire and Ghana (the only major winners) were excluded." Harrold concludes that "Clearly, therefore, we are discussing a change that might affect import bills by a fraction of 1 percent, and an effect that will therefore be de minimis."
Harrold also questions ODI's assumptions about food price rises, suggesting that 5 percent is likely to be an overestimate. This questioning is supported by the modeling results of Goldin and van der Mensbrugghe (1995) which predict wheat price rises caused by the UR of only 1.2 to 3.8 percent and coarse grain price rises of only 0.1 to 2.3 percent. Goldin and van der Mensbrugghe conclude that viewed in the context of instability in world commodity prices, and given that UR changes will be phased in gradually, the predicted changes are "barely significant."
Nonetheless, they recognize that even small food price increases can have negative consequences for the most food insecure countries, particularly in Africa. ODI predicts that Ethiopia, for example, will see its annual imported food bill increase by $13 million because of the AA. If OEeD agricultural subsidies are cut more deeply in future negotiating rounds, these effects can be expected to become more severe. Goldin and van der Mensbrugghe predict that Africa would suffer a $2.5 billion income loss if, someday, OECD countries made genuine 36 percent cuts in their overall subsidization of agriculture.
Much of this discussion became moot in 1995-96 because of rises in world markets for temperate crops. Droughts in Australia and the United States and expanded imports by China led
23
Angola
Benin
Botswana
Burkina Faso
Cameroon
Chad
Cote d'Ivoire
Ethiopia
Ghana
Kenya
Madagascar
Malawi
Mali
Mauritius
Mozambique
Niger
Nigeria
Senegal
Sudan
Uganda
Zaire
Zimbabwe
Sub-Saharan Africa
Table 5: Predicted Effects of the AA on Sub-Saharan Africa Trade in Temperate Crops (TCs, in millions of $US)
Imports of New cost of Increase in Increase in TCs imports of TCs import export
1990-92 expenditures revenues average on TCs from TCs
330.70 350.55 19.85 0.00
84.87 89.91 5.04 1.48
107.01 113.41 6.40 4.67
84.62 87.08 2.46 1.85
159.04 168.63 9.59 11.80
21.77 23.12 1.35 3.50
368.26 390.40 22.14 114.27
219.31 232.47 13.16 0.98
176.75 187.33 10.58 25.46
173.18 183.64 10.46 8.61
55.35 58.67 3.32 9.23
70.23 74.42 4.19 -0.3
95.45 101.23 5.78 11.19
161.75 171.46 10.00 -36.78
204.18 216.48 12.30 1.97
85.98 91.14 5.16 4.06
611.06 647.72 36.66 9.1
349.44 370.35 20.91 7.99
226.69 240.34 13.65 11.93
18.82 19.93 1.11 1.23
169.13 179.21 10.08 0.37
136.28 144.40 8.12 4.80
5.427.13 5.752.83 325.70 228.41
Source: adapted from data mODI. 1994. usmg $1.23=1 ECU.
24
Net increase (decrease) in expenditures
on TCs
19.85
3.56
1.73
0.61
(2.21)
(2.15)
(92.13)
12.18
(18.3)
1.85
(5.91 )
4.22
(5.41)
46.78
10.33
1.1
27.56
12.92
1.72
0.12
9.71
3.32
97.3
I I I I I

I I I I I I I I I I I I I
I I
to unusually high world prices. Analysts agreed that these high prices had little to do with the Uruguay Round.
Because of the high prices, the United States and the EU suspended their subsidization of agricultural exports for almost all temperate crops. The programs were suspended not because of the AA but because world prices were so high that farmers could make profits without export subsidies. The EU, in fact, switched from subsidizing wheat exports to actually taxing them.
in this context, AA commitments to reduce export subsidies are irrelevant. There are no grain subsidies to reduce at this time. Therefore, one cannot say that the AA commitments to reduce export subsidies are causing food price increases.
Since world markets are predicted to remain relatively tight and food prices high, the AA commitments to reduce export subsidies will remain irrelevant. Eventually, this situation changed - prices have fallen, but OECD countries have not expanded their export subsidization again.
How will the AA affect food aid and government stockholding of food commodities?
The Agricultural Agreement states that members that are donors of international food aid shall ensure:
(a) That the provision of international food aid is not tied directly or indirectly to commercial exports of agricultural products to recipient countries;
(b)
(c)
That international food aid transactions, including bilateral food aid which is monetized, shall be carried out in accordance with the F AO "Principles of Surplus Disposal and Consultative Obligations," including, where appropriate, the system of Usual Marketing Requirements (UMRs); and
That such aid shall be provided to the extent possible in fully grant form or on terms no less confessional than those provided for in Article IV of the Food Aid Convention 1986.
In practice, these provisions are expected to have little impact on current OECD practices relating to food aid. State Department officials indicate that the AA will not affect U.S. management of its PIA80 programs (Titles I, fl, and Ill). According to the F AO, "there is no reason to suppose that bona fide food aid will be adversely affected by the agreement" (F AO, 1994, p. 21).
However, the FAO and other organizations have raised concerns that the AA will indirectly affect the availability of food aid. Hathaway and Ingco address this issue in their analysis:
Concerns have been raised that the reduction in domestic subsidies in developed countries wiIJ reduce the quantity of food aid available. This view assumes that the quantity of food aid is primarily a function of the need for surplus disposal. Thus, if
25

surpluses disappear. the quantity of food aid will be cut back. However, as discussed earlier there is nothing in the Uruguay Round that will appreciably reduce domestic subsidies and the incentives to produce; therefore, the surplus disposal problem will not be changed by the UR agreement. Moreover, since the agreement puts specific limits on the use of export subsidies as a method of moving surpluses into world markets, food aid will remain as the one legitimate method of moving excess supplies into world markets. Thus, if countries continue the use of output expanding subsidies in the face of the limits on export subsidies, it may encourage the use of more rather than less food aid (p. 32).
State Department officials interviewed for this research indicated that American food aid was once tied to the availability of surplus stocks at the Commodity Credit Corporation; however, in recent years food aid is purchased by the U.S. government on open markets using funds budgeted for this purpose. The non-availability of surplus stocks is no longer an issue. Instead, the key question is how much money will be budgeted for food aid and how much food will that money buy. U.S. budget cuts and high food prices have led to reduced American pledges of food aid in the last two years.
Insofar as the AA causes increases in food prices, the agreement will mean that food aid budgets can buy less food. However, as discussed above, the AA has little to do with current high world food prices; they are the result of other factors.
Regarding government stockholding of food commodities, the F AO has raised additional concerns in its Preliminary Assessment of the Uruguay Round (1994):
The general move towards liberalization and a reduced role of the government in price support activities could lead to a fall in government stockholding of agricultural commodities. The reduction may not be large, but there is a question as to whether the private sector would step in to fill the gap. If not, as seems likely, then global food stocks are likely to be reduced (p. 21).
The F AO expresses concern that reduced government stockholding may increase world price instability. This concern may be justified to some extent, although it must be weighed against the positive effects the UR may have on international price stability by reducing the use of "instability exporting" policies such as variable levies. It is also worth noting that the cause of reduced government stockholding is not the Agricultural Agreement. We have already seen that most analysts consider the AA's stipulations about reduced domestic support to be ineffectual. Rather, it is domestic political forces and limited budgets that are causing the cut backs in government intervention in commodity markets in the OECD countries.
The AA excludes food security stocks from reduction targets and makes no prohibitions against them. According to the F AO, countries should take advantage of this exemption and build up adequate food security reserves, but developing countries cannot be expected to make large efforts on this score, as holding stocks is expensive.
26
I I I I I

I I I I I I I I I I I I I I I I
How will the AA be enforced?
All agreements under the Uruguay Round will be enforced through the WTO's dispute settlement procedures. Under these procedures (and the GATT procedures that preceded them), a country's trade policies are only subject to possible discipline when another country, perceiving injury, brings a complaint before the WTO. If the WTO panel rules in the plaintiffs favor, the plaintiff is authorized to apply countervailing duties on exports from the offending country.
The dispute settlement procedures of the WTO are substantially stronger than those of the GATT. In the past, dispute settlement procedures could be blocked either at the formation of a panel, or the adoption of its report, and the procedures could be delayed interminably. Under the new system, the right to a panel is virtually automatic; the panel's report may be rejected only if there is a consensus among WTO members to reject it; and all procedures must adhere to a strict timetable (Martin and Winters, p. 55).
Most African countries will probably not be exposed to a panel investigation, because most African countries do not have a big enough impact on world trade to cause an injury that would provoke a complaint. The decisions of the AA, therefore, are unlikely to be enforced vigorously in smaller African countries. Larger countries, such as Morocco and South Africa, are more likely to receive complaints if they violate measures agreed to in the AA.
The Uruguay Round initiated a new enforcement mechanism, that relies more on moral persuasion than on any threat of countervailing measures. It is called the "Trade Policies Review Mechanism" or TPRM. Under this mechanism, WTO teams of experts will conduct regular reviews of trade policies of member countries, focusing on conformance with the spirit and rules of the Uruguay Round agreements. The resulting reports are published to increase transparency of countries' trade policies. Harrold calls the TPRM a powerful peer-pressure way of ensuring compliance with WTO rules and UR commitments. African countries can expect to have a TPRM every six years. By mid-1995, nine SSA countries will have done so.
What are the anticipated overall effects?
Overall, the impact of the Agricultural Agreement on Africa will not be dramatic. In terms of exports, the AA will lead to preference erosion in some markets, particularly Europe, and some slightly improved access in other markets. It also should expand world income by around 1 percent, thereby causing an expansion in demand for Africa's exports by perhaps a similar percentage.
In terms of imports, the AA has the potential to cause increases in the prices of key commodities such as wheat, and thereby increase Africa's food import bill, although not dramatically. However, for the next few years such effects are unlikely, because world food prices are currently unaffected by the export subsidies the AA controls.
27
The agreement requires tariffication, and this process is well underway throughout Africa. Most countries, however, are binding their tariffs at levels that are substantially higher than the levels they actually apply. Thus the bindings have little or no liberalizing effects.
In terms of domestic policies in Africa, the agreement is undemanding. With the exception of South Africa, the agreement will not affect internal subsidies on agriculture, nor will it require reductions in export subsidization, because the practice is rare in Africa.
The agreement is also unlikely to have a significant effect on food aid.
Economic modelers have tried to estimate the overall impact of the Agricultural Agreement on Africa, with results suggesting a slightly negative outcome. Harrison, Rutherford, and Tarr (1995) use a general equilibrium model to estimate the effects of the Uruguay Round, based on the actual country schedules. They conclude that reductions in agricultural subsidies will result in a $4.7 billion gain in world welfare but a loss in welfare of $340 million in Sub-Saharan Africa, due essentially to increased food import bills. Some of this loss is recovered through the benefits of improved market access and reduced world market distortions, but overall, according to these analysts, the Agricultural Agreement results in $103 million in welfare losses for Sub-Saharan Africa.
The CGE model of Francois, McDonald, and Nordstrom (1995) is based on the actual UR Agreement and a realistic, perhaps pessimistic, estimation of the extent to which the agreement is likely to cause genuine liberalization in agricultural trade. This model predicts that agriculture is among the least important aspects of the Round, while textiles and clothing are the most important. The model finds that agricultural liberalization is adverse for Africa under most scenarios, but this is consistently outweighed by other aspects of the Round. African production of clothing is predicted to shrink (because of preference erosion) while its production of textiles should expand. On net, welfare effects for Africa range from positive 0.2 percent to 1.5 percent of GDP. Because the final agricultural liberalization package is less ambitious than earlier studies had assumed, the predicted impact on net food importers is much smaller than in previous studies.
All of the above predictions apply to Africa as a whole where ups and downs over the continent tend to balance each other out. However, on an individual country basis, effects are likely to be more noticeable, depending on which commodities each country exports and how dependent each country is on food imports. We analyze these effects in more detail for six sample countries in Part II of this report.
Although immediate impacts of the AA on Africa will be undramatic, one cannot conclude that the agreement is irrelevant. Most analysts agree that the most important accomplishment of the AA was the groundwork it laid for future negotiations. Martin and Winters write:
The disappointing overall achievements of the Round in increasing market access for agricultural products need to be weighed against the major progress made in improving the rules for agricultural trade. The introduction of virtually universal
28
I I I I I

I I I I I I I I I I I I I I
I I
tariff binding is a signal achievement, stemming the seemingly inexorable trend towards higher agricultural protection, and providing both immediate benefits through reductions in the average cost of protection, and systemic benefits by providing a base for future liberalization. Much of the slippage during this round occurred during the one-off process of converting from nontariff barriers to tariffs. With tariffication completed, this will not recur, and so the Uruguay Round has provided the foundation for more extensive liberalization in future rounds (p. 12).
Hathaway and Ingco conclude:
Most of the promise of the Uruguay Round agreement lies in the future it makes possible. The groundwork has been laid for serious trade liberalization in the next round of negotiations if countries choose to do so. The agricultural agreement calls for discussions at the end of five years on the need for further refonns ( p. 33).
Africa needs to prepare itself for the future that further negotiations will create 5, 10, or 15 years from now. One can reasonably expect that future negotiations will lead to further cuts in tariffs on agricultural products. These cuts will further reduce the value of Africa's tariff preferences, moving in the direction of no preferences at all. Africa will have to rely less on Lome-style agreements and more on the quality of its products to compete successfully against other suppliers. It also will need to address non-tariff factors that hurt its cost competitiveness, such as corruption and high transportation costs. Recent research by the World Bank (Amjadi et al. 1996) shows that Africa pays significantly higher shipping rates than other areas of the developing world, partly because of African policies that limit competition. These policy distortions should be rectified.
Further cuts in the export -subsidy programs of the OEeD countries should also be expected. These programs were recently suspended because of high world prices. They are likely to be reinstated two, three, or four years from now, but not to the levels they were once funded. Further cuts agreed in future negotiations are likely to restrict their levels further, eventually to the point of eliminating them altogether, as was accomplished in industrial goods under the GATT. Thus, cheap subsidized food is not likely to be available on world markets in the future. Africa will need to adjust to this new situation, importing less and encouraging more production of its own food crops. Promising ways to do this are to remove distortions that keep farm gate prices low, such as overvalued exchange rates and trade restrictions, and to invest more in rural infrastructure and agricultural research.
29

I I I I I I I I I I I I I I I I
PARTII.
COUNTRY CASE STUDIES: METHODOLOGY AND SUMMARY OBSERVATIONS
The second part of this report goes beyond the analysis available in the existing literature to look at the expected impact of the URI AA at the micro level, that is, on the agricultural trade of six specific countries in Africa. Our objective is to explore in a tangible and specific manner the effects of the AA. The six country case studies make up the bulk of this report and are presented as attached annexes:
Kenya Malawi
Annex A Annex B
Morocco Annex C South Africa Annex D Cote d'Ivoire Annex E Senegal Annex F
These countries were chosen for the degree to which they represented the geographic and agricultural diversity of the continent and for our potential to hire a local researcher in each location to assist in the research. The local researchers gathered documents and customs data in each country to provide local information and perspective. In addition, in most cases, the local consultants interviewed key trade and agricultural policy officials in order to get additional perspectives on the AA and future economic development prospects under the WTO.
We analyzed the potential impacts of the AA on each case study country by looking at:
• Which products the country exports and how the AA affects access to each of the destination markets;
• Which agricultural products the country imports and how the AA may affect import tariffs, prices, and food import bills; and
• How the AA may require trade policy changes by the country's government.
Case Study Methodology
In each case study country we tried to do two things: (l) follow a common approach to the analysis of potential impacts of the AA on the country's exports and imports; and (2) put these impacts into the economic development context of that country, since agricultural trade weighs differently in the evaluation of the future prospects of these diverse parts of the vast African continent.
31

Methodology for Analysis of Exports
To analyze the effects of the AA on agricultural exports from our case study countries, we used a methodology with six steps:
• First, we identified and quantified each country's exports to its major destination markets, using data from the UN Statistics Office, one of the only sources for comprehensive trade data organized by trading partner. l However, in a number of cases, we used data directly from the national Ministries of Commerce when the UN data were not complete or up-to
date;
• Second, we identified the competing suppliers for the products and destinations of interest;
• Third, we reviewed the destination countries' schedules to the AA to check their commitments to reduce tariffs on the products of interest;
• Fourth, we reviewed legislation concerning the destination countries' preference schemes to determine whether or not tariff preferences apply to the exports of our case study countries andlor its competitors;
• Fifth, we reviewed FAO and World Bank predictions about how the AA may affect the prices that our countries earn on certain key products; and
• Sixth, we attempted to place the collected trade information in a national development context that takes into account some of the unique circumstances that define the history and orientation of these diverse countries.
In cases where a country already had preferences while its competition did not, we concluded that the MFN cuts of the AA would harm the country's competitive position. In cases where a country had no preference compared to the competition, the MFN cuts generally helped its position.
Methodology for Analysis of Imports
To analyze the potential impact of the AA on our case study countries' imports of agricultural products (foods, with just a few exceptions), we used a three step methodology:
• First, we reviewed the UN and national government data to identify the major imports and their sources;
1 We used data for the most recent year reported by each country, ranging from 1992 to 1993 for the African countries, and 1994 to 1995 for the DEeD destination countries.
32
I I I I I
I I I I I I I I I I I I I I I
• Second, we reviewed our countries' schedules to the AA and their actual customs regulations to see if the Agreement would lower these rates; and
• Third, we reviewed FAO and World Bank predictions about the potential price impacts of the AA on the major food products each country imports, to evaluate potential impacts on food import bills.
Methodology for the Analysis of Policy Impacts
To analyze the potential impact of the AA on national trade and development policy, we examined the commitments made by each case study country in its schedule to the AA, we reviewed relevant documents on the topic gathered from government, donor, and university sources, and we attempted to weave into the analysis the particular insights of our national consultants.
Importance of Looking at Trade Impacts at the National Level
The real impacts of changes in trade policies are not captured at the international level or in Africa-wide statistics on estimated gains and losses. These gains and losses only take on meaning at the national level, and there, they are often concentrated in particular regions or agro-ecological zones. The national economy provides a meaningful level of aggregation or the correct economic context within which to evaluate the consequences of exports of a particular commodity increasing or decreasing. If the value of exports declines, is this a short term aberration or a long term trend? Are there substitute crops that are immediately accessible to farmers, processors, and exporters to replace a crop in decline?
Further it is at the national level where policy decisions can be taken that may have an influence on the cost of production (through changes in taxes or subsidies to inputs, for example), or on the f.o.b price of the product (through the reduction or elimination of an export tax), or where innovation in product marketing (devising and paying for a national promotional campaign) might allow our product to access new markets. It is national representatives that can appear at the WTO and present their arguments for more equitable treatment under international agreements. It is at the national level where political leaders and business leaders can combine forces for the promotion of national production to more successfully compete with imports or to be able to expand exports into new markets.
There is general and growing recognition across Africa that, even in the largest economies, that economic growth is not going to come from autarchic approaches, from seeking to produce and market only in response to national demand, with borders largely closed to outside competition. While it is increasingly recognized that trade-led economic development may be the main path toward sustainable economic growth for many countries, it is within the crucible of the nation and national policy and economic cooperation that this process will occur. One of the keys to becoming more competitive is to allow the best technology, the best science, and the best management to be applied to a country's productive sub sectors at prices that are as near to "world market prices" as is possible. One of the keys to actualizing a country's natural or human comparative advantage and
33 37

making its exports as competitive as they can be, is to liberalize the importation of the broadest range of goods and services that can contribute to that effort. As we have seen, very few African countries understood this lesson in the years leading up to the DR agreements, as witnessed by their high tariff bindings and their general lack of interest in any unilateral trade liberalization.
It is for these reasons that we have included the six country case studies in this report in their entirety. It is at the country level where the seeds for strategies for real economic growth and sustainable development will be planted and flourish. These may very involve major changes in thinking about where the growth will come from. As one example, regional trade in food in African (while still small portion of total exports) is a rapidly growing phenomenon which may very well be part of the trade-led development solutions of the next century. Whether it is maize in Eastern and Southern Africa, or sorghum/millet, rice, and maize in West Africa, virtually all countries can participate in and benefit from an acceleration of this type of trade. The signs of this may not yet be visible in the aggregate trade statistics but are known to participants in national food trade.
Summary of the Degree and Importance of Preference Erosion
In this study, the most important area of trade analysis has been our focus on what seems to be the almost inevitable erosion of the preferential margin that African agricultural exports have had in their most important markets: foremost the EU under the Lome Convention, with a secondary importance to North American and Asian (primarily Japan) markets under asp arrangements. The analysis of preference erosion is central to the analyses of AA impacts on agricultural exports contained in the six country case studies. In Table 6, we present some of our key findings as to the degree and importance of these lost preferences, in order for them to be conveniently available on one page.
Table 6 reveals some interesting comparisons among our case study countries in terms of the impacts of the AA on their agricultural exports. Two of the strongest agricultural exporters on the continent, South Africa and Cote d'lvoire, have either a neutral to slightly positive impact predicted for their exports due to influence of AA tariff reductions in target markets. South Africa because it does not have much preferential access to erode, is in a very strong position to further exploit its comparative advantage without preferences that will be lost in the future. Cote d'lvoire, due to the positive impact of the CF A devaluation and a rise in world coffee and cocoa prices has done very well in world markets since 1994. Even though the AA tariff bindings will reduce its margins of preference in EU, North America, and Japan, it is anticipated that both rising world incomes and changing consumer preferences will help it with many of its traditional crop exports.
Kenya faces substantial preference erosion on its coffee and especially its black tea exports but it is estimated by FAO and others that these will be partially made up by increased demand due to trade-induced rises in world income. Kenya shares similarities with Morocco in terms of horticultural exports to the EU where tariffs are so high on above-quota entry of vegetables and fruit that only the negotiated quota amounts actually enter the market, making it a market that largely escaped making serious protection reductions.
34
I I I I
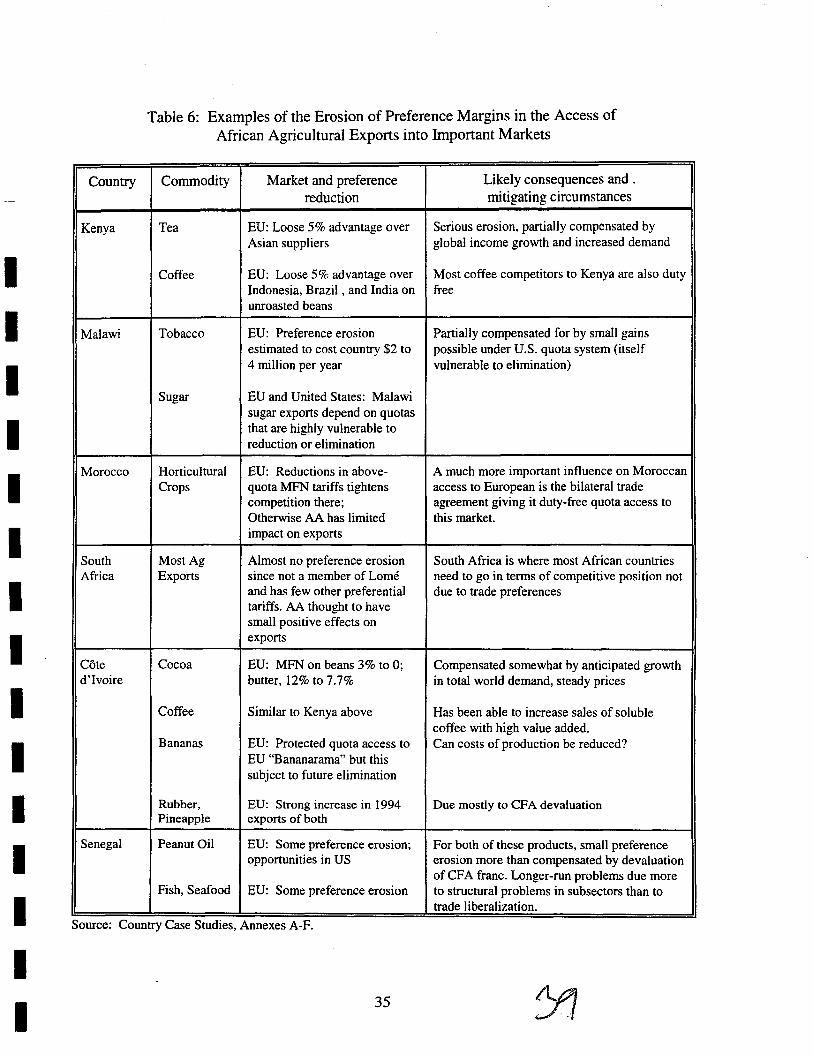
I I I I I I I I I I I I I I I
Country
Kenya
Malawi
Morocco
South Africa
Cote d'Ivoire
Senegal
Table 6: Examples of the Erosion of Preference Margins in the Access of African Agricultural Exports into Important Markets
Commodity Market and preference Likely consequences and .
reduction mitigating circumstances
Tea EU: Loose 5% advantage over Serious erosion, partially compensated by Asian suppliers global income growth and increased demand
Coffee ED: Loose 5% advantage over Most coffee competitors to Kenya are also duty Indonesia, Brazil, and India on free unroasted beans
Tobacco EU: Preference erosion Partially compensated for by small gains estimated to cost country $2 to possible under U.S. quota system (itself 4 million per year vulnerable to elimination)
Sugar EU and United States: Malawi sugar exports depend on quotas that are highly vulnerable to reduction or elimination
Horticultural ED: Reductions in above- A much more important influence on Moroccan Crops quota MFN tariffs tightens access to European is the bilateral trade
competition there; agreement giving it duty-free quota access to Otherwise AA has limited this market. impact on exports
MostAg Almost no preference erosion South Africa is where most African countries Exports since not a member of Lome need to go in terms of competitive position not
and has few other preferential due to trade preferences tariffs. AA thought to have small positive effects on exports
Cocoa ED: MFN on beans 3% to 0; Compensated somewhat by anticipated growth butter, 12% to 7.7% in total world demand, steady prices
Coffee Similar to Kenya above Has been able to increase sales of soluble coffee with high value added.
Bananas ED: Protected quota access to Can costs of production be reduced? EU "Bananarama" but this subject to future elimination
Rubber, ED: Strong increase in 1994 Due mostly to CFA devaluation Pineapple exports of both
Peanut Oil ED: Some preference erosion; For both of these products, small preference opportunities in DS erosion more than compensated by devaluation
ofCFA franc. Longer-run problems due more Fish, Seafood ED: Some preference erosion to structural problems in subsectors than to
trade liberalization.
Source: Country Case Studles, Annexes A-F.
35

The third pair of countries, Malawi and Senegal, are perhaps most representative of the majority of sub-Saharan countries. Their agricultural exports are highly concentrated to just a few commodities and those have their origins in the colonial past. Malawi tobacco and sugar exports were largely spared negative impacts from the AA due to EU and U.S. quotas but those are likely to come under attack in the next round of trade liberalization. Senegal has suffered some erosion of preference on its peanut exports (accounting for almost 60 percent of agricultural exports) but its biggest problems seem to be internal ones revolving around the ownership and correct policy environment for promoting peanut exports and protecting or expanding its current market shares .
. The reader is encouraged to consult the six country case studies themselves for more detail on the impacts of the AA on exports, imports, and on trade and development policies. These are presented in a country economic context which provides a better picture of the consequences of these changes in world agricultural trade policy and some of the policy and development challenges facing African leaders in the public and private sectors. In the following and final chapter of this report, we draw a set of conclusions on the overall impacts of the AA on African agricultural trade and implications for USAID economic development programming.
36
• I I I
-I I I I I I I I I I I I I I I
PART III
CONCLUSIONS AND IMPLICATIONS
In this final section we draw on both the review of the literature (Part I) and the six country case studies (Part IT and Annexes A-F) to distill a set of summary conclusions on the impacts of the AA on African countries and on what appropriate national responses might be. Then we sketch out a number of implications for USAID program work in potential economic development field activities.
Conclusions on the Impacts of the AA
Conclusion #1: The AA is likely to have a slightly negative impact on African exports.
The AA improves African access to some markets through small reduction in agricultural tariffs. At the same time the AA hurts Africa's competitive position in other markets through preference erosion, particularly in the European Union. Overall, the evidence suggests that the AA is likely to cause more preference erosion than trade creation for Africa. Preference erosion will cause significant losses for exporters of certain products, such as tea; however, the effects of preference erosion should not be exaggerated - in most markets Africa competes mainly against suppliers that have similar preferential arrangements, not industrialized countries that will benefit from MFN tariff cuts. The situation varies from product to product and country to country, requiring detailed analysis to determine potential impacts in different markets. Generally, the Lome countries will lose the most, and South Africa will gain the most. The amounts lost and gained, however, will represent only a very small percentage of overall trade revenues. Moreover, the negative effects will be offset to some degree by the increased demand created by the 1 percent growth in global income predicted to result from the Uruguay Round.
Conclusion #2: The AA's Impact on the quantity and cost of African imports also will be small in the near term.
Concerns that the AA will require Africa to open its doors to a flood of imports are unjustified. The AA required African countries to undergo tariffication and to set ceiling bindings on tariff levels, but most countries set these ceilings at levels so high above their actual tariff rates that they are largely irrelevant. Other concerns about the AA causing prices of food imports to increase are probably exaggerated. While export subsidy reductions made by OECD countries have the potential to cause price increases in commodities that Africa imports, the increases are predicted to be relatively small - 0 to 7 percent by 2000 - and well within the normal range of price fluctuation for these commodities. Currently the AA is having virtually no influence on food prices; cereals prices were very high in 1995 and part of 1996 for reasons independent of the Agreement.
37
Conclusion #3: The AA's Impact on African agricultural trade policy is positive but undramatic.
The WTO and the AA require conversion of non-tariff barriers into tariffs, the establishment of tariff bindings, and reductions in the use of export subsidies. Most of these requirements are not new - they have been components of structural adjustment programs for the past 10 years in most of Africa. Many of the measures, therefore, were already well underway or largely completed when the AA was signed, usually with the support of the World Bank and IMF.! The WTO will not suddenly force governments to complete these reforms and conform to the trade policy conditionalities that have been placed on them for years, but it will reinforce the multilaterals' efforts to convince governments of their necessity. It also may add transparency and help prevent backsliding on issues such as illegal use of quantitative restrictions. The Trade Policy Review Mechanism should continue to be helpful in this regard. Two policy areas where the AA and WTO may have particular influence are: (a) discouraging the use of reference prices for customs valuation, and (b) dampening enthusiasm for variable levies in Africa. Both of these practices are theoretically but not practically banned by the agreement.
Finally, most African countries (as well as most other developing countries world wide) did not use the GATT UR negotiations as an opportunity to undertake unilateral trade liberalization that could significantly contribute to improving the competitiveness of subsectors producing both for national markets and for export.
Conclusion #4: The hand writing is on the wall. Despite the limited nature of the AA's near-term impact, the Agreement is important because it points to the future of agricultural trade and lays the groundwork for future liberalization.
In future negotiating rounds, analysts expect the Agreement on Agriculture to follow the path blazed by the GATT for manufactures over the past 45 years - steady movement towards lower tariffs and less subsidization. Although the 1994 Agricultural Agreement resulted in limited, some would say timid, liberalization, the stage was set for future rounds that will almost certainly lead to deeper tariff cuts and deeper reductions in export subsidization and domestic support. This implies that over time: (1) preference arrangements will lose their value and cannot be relied on, (2) market access will improve for those African products that were once constrained by non-tariff barriers or high tariffs, and (3) cheap, subsidized food will become even more rare on international markets. African countries should not loose time in preparing for this future. Conclusions #5 through #9 provide suggestions on how.
! Nash, 1993, reports that 16 percent of all critical actions (conditions) in World Bank loans to Africa between 1980 an 1992 were Trade Policy and Exchange Rate (TPER) measures. Of these, 22 percent related to import duties, 17 percent with quantitative restrictions, and 17 percent with exchange rates. Of these conditions, 18 percent were "under implemented" or not implemented.
38
• I I I

I I I I I I I I I I I I I I I
Conclusions on Future Directions
Conclusion #5: Given the eroding value of preferences, African exporters will need to rely less on special treatment and more on improved quality and promotion to expand their agricultural exports.
Exporters must try to upgrade from undifferentiated, bulk commodities to higher-value, quality products that have brand name recognition, incorporating more value-added processing and packaging. Trade in this latter group of products grew from 33 to 46 percent of world agricultural trade between 1983 and 1993, while trade in bulk commodities fell from 45 to 29 percent over the same period.2 To move towards higher-value trade, Mrican governments need to create a more conducive regulatory and economic environment for this type of export development, including lower tariffs and other restrictions ranging from packaging materials to insurance and other services that facilitate trade.3 As agricultural tariffs disappear in OECD markets, both opportunities and competition will expand, and those countries that aggressively promote their exports and improve their quality will flourish. Those that do not, will not.
Conclusion #6: African countries should learn how to make WTO bodies and the dispute settlement mechanism work for their interests, particularly to combat nontariff barriers on their exports to OEeD countries.
When the EU's non-tariff barriers on bananas threatened Latin American exporters, these countries brought their complaints to the GATT, and the EU was obliged to make concessions. The concessions were less than the Latin Americans hoped for but sufficient to keep them from pursuing the case further through the dispute settlement mechanism. The Latin Americans made the new "rules-based" agricultural trading system work in their interest. African countries must learn to do the same, familiarizing themselves with WTO mechanisms, studying carefully how their interests are affected by foreign trade barriers, and challenging those barriers through WTO mechanisms when strategic considerations warrant such actions. Such steps will require the preparation of technical and legal argumentation and strict compliance with WTO procedures within specific and often short time limits. In the case of challenges to discriminatory sanitary and phytosanitary measures, intimate knowledge of scientific evidence and international standards will be essential. African countries also should monitor the allocation of tariff quotas by OECD countries for products like beef and sugar, working with the WTO to ensure that the process is favorable to African interests. The impact of potential new members' accession, such as China, also needs to be carefully monitored. Special reviews already scheduled by the WTO will provide fora for African countries to argue their viewpoints.
1semi-processed products make up the remainder of agricultural trade and were stable at 22 to 25 percent over the period. WTO and UNCTAD, 1996.
3 Polystyrene boxes used to package exported fish are five times as expensive in Cote d'Ivoire as in Tunisia (World Bank, 1992 in Nash, 1993).
39
Conclusion # 7: Africa should begin preparations for future rounds of negotiations.
The Agreement on Agriculture provides for further negotiations to be initiated one year before the end of the implementation period. Discussions on the agenda began during the first WTO Ministerial Conference held in Singapore in December 1996. African countries need to prepare to push the agenda towards the issues of greatest concern to them - such as tariff escalation and prohibitive tariff quotas on sugar and beef -and to confront issues that Western countries are pushing, such as environmental and labor standards. Each African country needs to prepare its own analysis of those trade measures which it considers to be significant barriers to its exports and, at the same time, prepare to address the concerns of its trade partners. Positions need to be coordinated by an intenninisterial task force on both a continent-wide and regional basis. African trade expertise developed during the Uruguay Round must be nurtured and expanded to allow fuller and more fruitful participation in the next negotiating round. Government negotiators, analysts at universities, and representatives of private exporters' associations should all be encouraged to build further expertise in trade policy.
Conclusion #8: Because the acceptability of domestic production subsidies and export subsidization is likely to wane in DECD countries over the next decade, Africa should be preparing for a future of higher international food prices.
One way to prepare is to remove restrictions on futures trading, allowing African importers to mitigate the risks of sudden price increases by buying futures on international commodity exchanges or on commodity exchanges developing in Africa (such as the maize exchange in South Africa). When African importers are less restricted in their operations, it is more likely that they will "play the market" successfully and find the best prices for food on international markets.
A second way to adjust to higher food prices is to use them as an incentive to increase domestic production, that is, to "pass through" price increases to African farmers and encourage them to generate a supply response. This response can be facilitated by intensified investment in rural infrastructure, agricultural research, extension, and competitive marketing arrangements that maximize farmgate prices. These investments should be undertaken before international prices increase, as a way to prepare for that scenario.
Conclusion #9: African countries can maximize their benefits from the international trading system by engaging in unilateral liberalizations, outside of the framework of multilateral negotiations. The welfare increases that can be derived from such actions are much greater than those generated from further improving access to foreign markets, which are relatively open already.
Virtually all of the major economic studies on the Uruguay Round make a similar point: the biggest welfare gains go to those countries that liberalize the most. Elimination of quantitative restrictions and reductions in high tariffs move a country towards more efficient resource allocation and provide widespread benefits for domestic consumers. Low tariffs preclude wasteful inward-looking investments that add negative value-added at international prices. Low tariffs can
40
I I I I

I I I I I I I I I I I I I I
I I
help keep food prices low, restraining inflation. Cuts also make it cheaper and easier for domestic agro-industries to obtain inputs, such as packaging materials, that improve international competitiveness. Low food prices also help keep wages at internationally competitive levels, aiding employment generation. Liberalized trade is an essential element in developing an outward-looking, expanding economy. Away from the negotiating table, tariff cuts should not be considered "concessions" but rather as positive steps facilitating growth.
The constraints to tariff reform are significant, including fiscal concerns and vested interests. To defend against those who would put these interests first, reformers within African governments can strengthen their positions by using multilateral trade negotiations to "anchor" or "lock in" reform measures. They also can use the transparency and debate generated by negotiations to consolidate their reformist position. Several Asian and Latin American countries followed this strategy successfully in the Uruguay Round, binding tariffs to lock in earlier unilateral reforms. African reformers can learn from their experience.
The basic principle is that if a country wants to make its agricultural exports as competitive as possible all the normal factors involved in producing a given product (seeds, agricultural chemicals, machines involved in processing, packing materials) plus a wide range of services (transport, insurance, banking, consulting on production, processing, and overseas marketing) should be available in the country at prices that are as close to "world market prices" as possible. This means that not only high tariffs but also legal barriers to the use of specialized foreigners can impede making African production as competitive as it needs to be. We understand the fear of "neocolonialism" and domination by foreign firms. However, existing African trade restrictions favor inefficient domination by a few privileged foreign firms (which were often there in the colonial period) at the expense of being cost-competitive on world markets. It is hoped that economic liberalization will allow a broader range of foreign partners to form cooperative alliances with local entrepreneurs that can meet the simultaneous objectives of efficiency in exporting, employment and income generation, and genuine economic growth.
Finally, the DR left many of the worst distorting policies in Mrica outside its scope, such as , state-trading monopolies and explicit and implicit taxes on agricultural exports. In many countries,
unilateral reform in these areas is necessary for agriculture exports to expand.
Implications for USAID
The following are a few summary recommendations that are directed to USAID and to interested development workers.
Continued Investment in African Agriculture Needed
The GATT AA, while likely to generate increased agricultural trade for other parts of the world, is likely to produce - in and of itself - differing results in Mrican countries where USAID still has programs. These will vary from slightly positive to slightly negative depending on the range of exports and imports concerned. However, outside Africa, world agricultural trade, particularly
41

in higher value products, is booming. The opportunities in the developed world are there. If USAID is still involved in investing directly in economic growth activities in African countries (in addition to programs in democracy and governance, population growth, maternal and child health, etc. - all important and often having at least indirect impacts on economic growth as well), then it cannot forget the agricultural sector. The opportunities for investment and reform will be in production for domestic markets, markets in neighboring African countries, and export markets outside the African continent. All of these areas of commodity development may grow together.
Possible Projects As Part of a Trade-Led Development Strategy
Recent USAID project experience, in Africa and other parts of the world, shows that there are a number of inter-related areas for potential project activity:
• Agricultural policy reform;
• Agribusiness promotional projects;
• Promotion of intra-regional trade; and
• Promotion of viable commercial food production, marketing and trade.
Agricultural Policy Reform: Most of the more flagrant agricultural policies in Africa, at least in food policy, have been the subject of adjustment program reforms sponsored by USAID or the World Bank in recent years (so much so that African food policies are, in general, much more liberal than those in many Asian or Latin American countries). This is less true in the traditional export cash crops where heavy state involvement in marketing and pricing are still the norm. There are thus two very useful areas for further USAID agricultural policy reform work in Africa:
• Reform of state management of cash crop marketing systems so that farmers get a bigger share of the world price received and thus more incentive to continually improve production and quality for export (directly or through associations, processors, promotional marketing, etc). There are also many opportunities to look at cash crop promotion, product differentiation for higher prices, and other market-friendly techniques for price risk management (in contrast to the large national price stabilization boards which serve more as tax collectors); and
• Policy reform efforts focused on trade policy liberalization. The objective would be for African countries to aggressively embrace trade liberalization to create economic environments that are the most supportive of export growth in commodities where the country has demonstrable comparative advantage. This can be accompanied by technical assistance to prepare to use WTO and future trade negotiations to improve national competitiveness. A national "trade policy community" needs to be created, comparable to that flourishing in many developed countries, comprising not only government officials, but also lawyers, trade consultants, academics, journalists, lobbyists, private
42
•
I I I I

I I I I I I I I I I I I I I I
sector representatives, consumer groups, etc., all focused on trade issues. In policy dialogue, the WTO is a new ally to work with along with the World Bank and the IMF.
Agribusiness Promotion Projects: USAID, over the past 15 to 20 years, has an unparalleled record of accomplishment among donors in agribusiness promotional projects, often focused on agricultural exports. Beginning first in Latin America, many of these projects have demonstrated extremely high rates of return as they have diagnosed problems in existing commodity export channels, then gone about fixing them (whether at the level of production, first-handler marketing, processing, target market development, etc). There have been fewer of these projects in Africa (partly due to the focus on basic food crops) but those that have been funded on the continent have generally proven to be cost-effective in generating great increases in export volumes.4
While product adaptation and up-grading needs to be essentially market driven, the lTC's sector and market-specific trade development projects have shown that attractive cost-benefit ratios can be achieved, provided that assistance is well-targeted to export-ready enterprises. Improving export quality and packaging usually involves outside assistance by knowledgeable professionals. Given that export success in many industries hinges upon access to competitively priced inputs, international purchasing and supply management continues to be a major handicap in many low-income developing countries. This calls for increased efforts in providing information, training and enterprise-specific assistance programmes.
Intra-regional trade promotion: In this report we have seen a number of very promising trade tendencies at the sub-regional level. For example, sales of soluble coffee and local textiles from Cote d'Ivoire to its neighbors in West Mrica and increases in intra-regional cereals trade in both East and West Africa are very promising for future development. Recent work sponsored by the USAID/Africa Bureau in West Africa has (AIRD, 1996) identified many sub-regional export possibilities that are largely being blocked by easy to fix legal or policy problems. Intra-regional trade development programmes in Southern and Eastern Africa have registered cost-benefit ratios of more than US$ 10 of additional annual trade flows per dollar spent on technical assistance. Many of these projects do not require huge amounts of capital but are management intensive, so are attractive targets for competitive contracts.
Reconsider Food Production and Marketing Projects: Finally, considering the potential for increased commercial food prices and substantially less food aid available for free or low cost distribution, USAID might want to examine the potential for funding projects that promote the increased commercial production and marketing of staple foods. For example, improvements in the disease resistance of hybrid corn in West Africa may soon allow larger-scale production, milling, and marketing to become commercially viable. These are areas where USAID has considerable comparative advantage due to the availabilities of relevant biological, chemical, and mechanical production, harvesting, processing, and marketing technologies in the United States.
4We would particularly point to the KEDS project in Kenya, MAPP in Morocco, ANEPP in Uganda, and the TIP project in Ghana as notable examples of successful USAID-funded cOnUnercial export promotion projects.
43
I I I I I I I I I I I I I I I
BffiLIOGRAPHY
Alston, Julian, Colin Carter, Kenneth Weiss, and Bin Zhang. "Temperate Fruit and Vegetable Trade under the GATT." GATT Research Paper 94-GATT 7. Center for Agricultural and Rural Development. Ames, Iowa: Iowa State University, February 1994.
Amjadi, Azita, Ulrich Reinke, and Alexander Yeats. "Did External Barriers Cause the Marginalization of Sub-Saharan Africa in World Trade?" Policy Research Working Paper 1586. Washington, D.C.: The World Bank, March 1996.
Blackhurst, Richard, Alice Enders, and Joseph F. Francois. "The Uruguay Round and Market Access: Opportunities and Challenges for Developing Countries." Geneva: World Trade Organization, January 1995.
Boye, Greta R. and Montague J. Lord. "GATT Impact on European Trade." Regional Agribusiness Project. Bethesda, MD: Development Alternatives, Inc. September 1994.
Davenport, Michael, Adrian Hewitt, and Antonique Koning. "The Impact of the GATT -Uruguay Round on ACP States." Final Report. London: Overseas Development Institute, August 1994.
FOCUS, GATT Newsletter. "Africa to gain more trade and investment from Round." Issue No. 106. Geneva: Information and Media Relations of GATT, March-April 1994.
Food and Agriculture Organization of the United Nations. "Expert Consultation on the Impact of a Changing International Trade Environment on Agricultural Trade in the Near East Region." Nicosia, Cyprus: FAO, December 5-8, 1994.
Food and Agriculture Organization of the United Nations. "Expert Consultation on Policy Change and Agricultural Trade in Africa South of the Sahara." Akasombo, Ghana: FAO, March 15-18,1993.
Food and Agriculture Organization of the United Nations. "The State of Food and Agriculture 1995." Rome: FAO, 1995.
Food and Agriculture Organization of the United Nations. "Uruguay Round Agreement: A Preliminary Assessment." Prepared by the Commodities and Trade Division. Rome: FAa, March 1994.
Francois, Joseph F., Bradley McDonald, and Hakan Nordstrom. "Assessing the Uruguay Round." Presented at The Uruguay Round and the Developing Economies, A World Bank Conference. Washington, D.C., January 26-27, 1995.
45
Goldin, Ian, Odin Knudsen, and Dominique van der Mensbrugghe. Trade Liberalisation: Global Economic Implications. Paris: OECD, 1993.
Harrison, Glenn W., Thomas F. Rutherford, and David G. Tarr. "Quantifying the Uruguay Round." Presented at The Uruguay Round and the Developing Economies, A World Bank
Conference. Washington, D.C. January 26-27, 1995.
Harrold, Peter. "The Impact of the Uruguay Round on Africa: Much Ado About Nothing?" Presented at The Uruguay Round and the Developing Economies, A World Bank Conference. Washington, D.C. January 26-27, 1995.
Hathaway, Dale E., and Merlinda D. Ingco. "Agricultural Liberalization and the Uruguay Round." Presented at The Uruguay Round and the Developing Economies, A World Bank
Conference. Washington, D.C. January 26-27, 1995.
Helmar, Michael D., Deborah L. Stephens, K. Eswaramoorthy, D. Scott Borwn, Dermot J. Hayes, Robert Young, and William H. Meyers. "An Analysis of the CAP Reform." GATT Research Paper 94-GA TT 17. Ames, Iowa: Center for Agricultural and Rural Development, Iowa State University, April 1994.
Ingco, Merlinda D. "Agricultural Trade Liberalization in the Uruguay Round: One Step Forward, One Step Back? Presented at The Uruguay Round and the Developing Economies, A World Bank Conference. Washington, D.C. January 26-27, 1995.
International Trade Centre UNCT ADIWTO and Commonwealth Secreatariat. "Business Guide to the Uruguay Round." Geneva: ITC/CS. 1995.
Lal, Anil K. "Impact of Uruguay Round Agreements on Least Developed Countries' Exports: An Initial Assessment." Washington, D.C.: International Trade Division, The World Bank, November 28, 1994.
Martin, Will, and L. Alan Winters. "The Uruguay Round: A Milestone for the Developing Economies." Washington, D.C.: International Trade Division, The World Bank, August 9, 1995.
Nash, John. "Implementation of Trade Reform in Sub-Saharan Africa: How Much Heat and How Much Light?" Policy Research Working Paper 1218. Washington, D.C.: The World Bank. November 1993.
Overseas Development Institute. Briefing Paper. "Developing Countries in the WTO." London. May 3,1995.
46
• I I I I
I I I I I I I I I I I I I I I
Page, Sheila, Michael Davenport, and Adrian Hewitt. "The GAIT Uruguay Round: Effect on Developing Countries." London: Overseas Development Institute. (no year)
Runge, C. Ford. "Beyond the Uruguay Round: Emerging Issues in Agricultural Trade Policy." In World Agriculture and the GATT, edited by Avery, William P. Boulder, CO: Lynne Rienner Publishers, Inc. 1993.
UNCT AD Secretariat, and WTO Secretariat. "Strengthening the Participation of Developing Countries in World Trade and the Multilateral Trading System." April 1996.
U.S. International Trade Commission. "U.S.-Africa Trade Flows and Effects of the Uruguay Round Agreements and U.S. Trade and Development Policy." Investigation No. 332-362. Washington, D.C.: lTC, Publication 2938, January 1996.
Wilcock, David, Kim Neuhauser, and Bagie Sherchand. "Potential Impacts of the GATT Agricultural Agreement on Developing Countries." Agricultural Policy Analysis Project, Phase III. Bethesda, MD: Development Alternatives, Inc. November, 1994.
World Trade Organization. Secretariat. "Market access for goods: a Uruguay Round summary for developing country exporters." International Trade FORUM, January 1995.
Yeats, Alexander J. "What are OECD Trade Preferences Worth to Sub-Saharan Africa?" African Studies Review 38(1): 81-101 (April 1995).
47

I I I I I I I I I I I I I I I
ANNEXA KENYA CASE STUDyl
The Agricultural Agreement of the Uruguay Round will affect the tariffs faced by Kenya's exports, the price of the food it imports, and, to a certain degree, its agricultural trade policies.
Kenyan Agricultural Exports
Kenya's major agricultural exports, which totaled over $600 million in 1992, are summarized in Table A-I.
Table A-I: Kenya's Major Agricultural Exports by Destination, 1992 (thousands of $US)
Total To the To the To To To Sub- To Egypt To Israel EU US other Japan Saharan and
Europe Africa Pakistan
Tea 289,721 140,641 6,603 - 928 5,059 117,870 -Coffee 126,328 82,584 5,061 26,294 1,688 - - -Preserved, 38,037 34,450 2,565 236 - - - 380
prprd fruit
Fruit, nuts 15,137 7,428 1,144 - 4,172 - - -
Vegetables 27,289 24,463 108 373 - 1,390 - -
Preserved 7,344 7,100 - 101 - - - -vegetables
Cut flowers 27,868 24,925 - 1,332 - 598 - -
Pyrethrum 23,775 4,709 14,488 1,411 1,920
Sisal 10,675 3,998 - - 912 933 - -
Fish 25,776 10,021 310 - 1,390 - - 9,233
Sub-total 591,950 340,319 30,279 29,747 11,010 7,980 117,870 9,613 of column
Source: assembled from UN StatistiCal Office data.
I This annex is largely based on a longer paper by Dr. Mark O. Odhiambo (Moi University, Faculty of Agriculture, Eldoret, Kenya), "Potential Impact of the Agricultural Agreements of the GATT Uruguay Round on the Economy of Kenya," 1996.
{;J

As a member of the Lome Convention, Kenya has duty-free access to the ED for virtually all of its agricultural exports, and almost 60 percent are destined for that market. Kenya also is eligible for the GSP programs in the US, Japan, and other European countries, which results in zero or preferential tariff rates on many, but not all, agricultural products. Because of its high level of preferences, Kenya is vulnerable to preference erosion when MFN rates are cut, as they are under the Agricultural Agreement.
Little of Kenya's agricultural trade is with other African countries, despite efforts to liberalize exchanges in the Common Market for Eastern and Southern Africa (COMESA) and the states of the former East African Community (EAC).2 The UR Agreement is not expected to have a direct effect on these regional trade efforts, but it may reduce the urgency some countries were feeling about joining regional trading blocks before the Final Act was signed.
Tea Exports
Kenya accounts for 65 percent of Africa's tea exports with $300 million in sales in 1994. Production has expanded substantially during the last decade and is capable of further increases through improvement in small-holder yields. Kenya produces black tea, and its share of the world trade in this commodity is 15 percent, about the same as the other black tea giants, India and Sri Lanka. China is the world's largest tea exporter but most of its tea is green.
In the European Union, Kenya is the largest supplier of tea, with about 28 percent of the market. India, Sri Lanka, China, Indonesia, and Malawi are also important suppliers. Before the Uruguay Round Agricultural Agreement, the EU charged a 5 percent tariff on black tea in packages of less than three kilograms, while bulk tea was duty-free. The green tea tariff was zero for virtually all suppliers. Under the AA, the EU committed to reduce the black tea tariff to zero.
The reduction in the black tea tariff will cause some preference erosion for Kenya, because Kenya has duty-free access to the EU under Lome. Kenya's 5 percent tariff preference over Asian suppliers will evaporate, and the country will lose competitiveness in relation to India, Sri Lanka, and Indonesia. Kenya's situation vis-a-vis other Lome countries like Malawi will not be affected.
The U.S. sources most of its tea in Argentina, China, and Indonesia (80 percent of consumption consists of iced tea). Kenyan tea exports to the United States were only $6 million in 1992. U.S. tariffs are zero on all tea, so the AA will have no direct effect.
Kenyan tea exports to Japan were about $1 million in 1994. Under the AA, Japan is cutting its black tea MFN tariff from 20 percent to 12 percent (packages under 3 kg). Because Kenyan tea enters Japan at a reduced rate under GSP (12 percent), this cut in the MFN will cause preference
2 On March 14, 1996 the President of Kenya chaired the fonnaIlaunching of the new EAC, now known as East African Cooperation, with its secretariat in Arusha. Tanzania and Uganda are the other two members. The old EAC (East Africa Community) broke up in 1977 because of political differences.
A-2
I I I I I

--I I I I I I I I I I I I I I
erosion. The effect, however, is minimal, because most suppliers of black tea to Japan are already paying 12 percent under the GSP program.
Kenya exports large amounts of tea to Egypt, Pakistan, Sudan, and Yemen. The AA is unlikely to affect tea tariffs in these countries in any way. Sudan and Yemen are not WTO members, and North African countries have bound their tea tariffs at levels that significantly exceed applied rates and therefore do not have any real impact on protection.
The F AO (1995) predicts that the UR will have little direct effect on the world tea market. However, since the Round is projected to bring about significant increases in global income, there is likely to be a positive impact on tea consumption, particularly in countries such as Pakistan and Egypt which are major buyers of Kenyan tea. Income elasticity for tea is high in developing countries such as these. Economic recovery in the former Soviet Union, at one time the world's largest importer of tea, will also boost world demand.
Coffee Exports
Coffee is Kenya's second most important export crop, but production declined by 40 percent between 1983 and 1992, mainly because low world prices reduced incentives for intensive cultivation. However, over the past two years prices recovered significantly, and Kenya's earnings and interest in coffee have expanded again. 1994 exports were $233 million.
The EU is the destination for 65 percent of Kenya's coffee exports. Kenya is the third largest African exporter of coffee (after Uganda and Cote d'Ivoire), but still has only 3 percent of the EU market. The biggest exporters to the EU are from Latin America - Columbia, Brazil, EI Salvador, and Costa Rica. Indonesia and India are the biggest Asian exporters.
Before the AA, the EU had a 5 percent MFN tariff on unroasted coffee and a 15 percent tariff on roasted coffee. Ninety percent of imports are unroasted. Kenya, like all other African exporters, pays no tariffs because of the Lome Convention. Andean and Central American countries, as areas affected by drug trafficking, also are eligible for zero tariffs. Brazil, India, and Indonesia qualify for GSP rates, but these are only relevant on roasted coffee, on which they pay 11.5 percent instead of 15 percent. On unroasted they pay the MFN rate of 5 percent.
Under the Agreement, the MFN rates will be reduced to zero on unroasted and 7.5 percent on roasted coffee. This will not affect the rates paid by Kenya, other African countries, or suppliers from Central America or the Andean countries. It will reduce the duties paid by Brazil and Asian suppliers, leveling the playing field for them on unroasted coffee. The result is preference erosion for Kenya vis-a.-vis these countries·, but no change in relation to the more important competitors from the Andean, Central American, and African areas.
Kenyan coffee exports to the United States are much less important - about $5 million in 1992. All coffee enters the United States duty free, so the AA will not affect Kenya's position in this market. Japan is a minor market for Kenyan coffee. It has no tariff on unroasted coffee, and its 20
A-3
percent tariff on roasted coffee will be reduced to 12 percent under the AA. This latter cut will cause minor preference erosion, as Kenya faces a GSP rate of 10 percent for roasted coffee. Japan, North America, and Europe account for 90 percent of world trade in coffee.
The F AO predicts that the Uruguay Round will have a mild effect on world coffee markets. Tariff reductions in Europe and Japan will lead to slight reductions in prices for consumers in those markets, slight increases in consumption, and slightly more demand on world markets. Therefore, according to the FAO, coffee prices in 2000 should be slightly finner than without the effects of the Uruguay Round. However, prices will remain volatile.
The World Bank predicts that coffee prices will fall by 40 percent by the year 2000 because of expanded production and relatively little growth in demand in saturated Western markets. Demand, however, may be more buoyant at the higher end of the market in which Kenyan coffee is sold. Recent developments in the gounnet and specialty coffee markets in the United States and Europe indicate that high quality coffee demand can increase.3
Overall, the preference erosion Kenya faces in Europe pales in importance compared to the issues of weather, penetration of gounnet markets, and the ability of the International Coffee Agreement to support prices through stock retention schemes.
Horticultural Exports
Kenya's exports of fruits and vegetables are focussed on the EU, where the country enjoys duty-free access because of Lome.
Green beans have been an important Kenyan export for years. Over the past decade, exports of so called Asian vegetables - brinjals, karela, okra, snow peas, dudhi, and chilies among others - have also become important, although growth has tapered off more recently. Mangoes and avocados are Kenya's major fruit exports.
Under the AA, the EU will reduce its MFN rates on most of these products. MFN tariffs on salad vegetables, for example, will fall from 13 percent to 10.4 percent, tariffs on okra will fall from 16 to 12.8 percent, and tariffs on fresh green beans will fall from 13 to 10.4 percent. Avocado tariffs fall from 8 percent to 4.6 percent, and mango tariffs will move from 6 percent to zero. Tariffs on canned green beans will fall from 24 percent to 19.4 percent.
Given Kenya's duty-free access, these tariff cuts will cause preference erosion. In most cases, however, the erosion is minor because most of Kenya's competitors already have their own preferential arrangements. This is illustrated for selected products below.
3 Egerton University PAM Team, Proceedings of the Conference on Improving Agricultural Performance held in Nairobi in September 1995.
A-4
I I I I
I I I I I I I I I I I I I I
I I
For fresh green beans, Kenya is in competition with Burkina Faso, Senegal, Ethiopia, Tanzania, and Zimbabwe (all Lome countries) and Morocco and Egypt (both of which have duty-free preferences under bilateral agreements). The MFN tariff cut will have virtually no effect on this market. The situation is similar for okra and mangoes.
For avocados, Kenya competes directly with South Africa in supplying European markets from June through September. From October through mid-November Kenyan avocados also compete with supplies from Israel. Israeli avocados enter the ED tariff-free and will be unaffected by the MFN cuts. Under the GSP program, South African avocados pay a 6 percent tariff which will fall to 5.1 percent as the MFN rate is reduced under the AA. This will result in minor preference erosion for Kenya.
For canned green beans, Kenya competes in the EU with Morocco and China. Under the AA, the MFN tariff will fall from 24 to 19.4 percent, giving a boost to China's competitiveness in relation to Morocco and Kenya which have duty free access. This will be one of the few instances of significant preference erosion for Kenyan horticulture.
Kenyan vegetable exporters generally are less concerned with tariff erosion than they are with high freight charges and inadequate air freight space (problems outside the scope of the AA). They also are concerned about the prospects of further tightening of EU phyto-sanitary regulations, something that the AA cannot stop as long as the standards are "science-based."
Exports of Cut Flowers
Kenyan exports of cut flowers have grown substantially in recent years owing to the success of high quality production by large-scale, vertically integrated producers with access to new planting materials. These products command price premiums in the European market, where virtually all Kenyan flower exports are sold. Smaller scale greenhouses for rose production also have flourished during the past five years. At Europe's most important flower auction, in the Netherlands, Kenyan cut flowers account for over one-quarter of all imported flowers. Kenya's market share in alstroemeria, spray carnations, spray roses, solidaster, and statice are especially strong, but in tight competition with Columbia, Israel, and Zimbabwe. Kenya's 1994 cut flower exports were $43 million.
Under the AA, the EU agreed to cut its flower tariffs by half. The summer rate (June through October) will be reduced from 24 percent to 12 percent and the winter rate will drop from 17 percent to 8.5 percent. In most cases this reduction will not cause significant preference erosion for Kenya, because most suppliers, like Kenya, have duty-free access to the EU. This is demonstrated in table A-2.
A-5

Table A·2: Major Exporters of Cut Flowers to the EU, 1994
Country Exports to the EU Tariff status Average tariff Average tariff to
(thousands of $U5) faced in 1995 be faced in 2000
Israel 138 bi-Iateral agreement 0 0
Columbia 96 drug affected nation 0 0
Kenya 78 Lome Convention 0 0
Costa Rica 57 drug affected nation 0 0
US 51 MFN 20.5 10.25
Zimbabwe 30 Lome Convention 0 0
Thailand 25 GSP* 20.5 10.25
South Africa 21 GSP* 20.5 10.25
Ecuador 17 drug affected nation 0 0
Guatemala 13 drug affected nation 0 0
Turkey 11 bi-Iateral agreement 0 0
Morocco 8 hi-lateral agreement 0 0
*GSP provides a slightly reduced rate for orchids, anthunums, and "other" cut flowers, but does not affect key flowers such as roses and carnations; therefore we show the MFN rate in columns 4 and 5. Source: assembled from EU schedule to the AA and Official Journal of the European Communities.
Pyrethrum Exports
Global production of pyrethrum is heavily concentrated in East Africa, with Kenya accounting for over 80 percent of world extract production. Other major producers include Tanzania, Rwanda, Ecuador, and Papua New Guinea. Recently, Australia has entered the market. With growing environmental concerns about the harmful long-term effects of synthetic pyrethroid insecticides, demand for natural pyrethrum is relatively buoyant. The United States is the largest consumer of pyrethrum, accounting for three-quarters of world imports. The American company Mclaughlin, Gormley, King Incorporated is the leading buyer of Kenyan extract.4 In 1992, Kenyan exports were $23 million with $14 million of them going to the United States.
The United States and the EU have zero tariffs on pyrethrum, and therefore the UR agreement will have no direct impact. Kenyan pyrethrum enters Japan duty-free under the GSP program. Japan's MFN tariff of 20 percent will be reduced to 12 percent, causing preference erosion for Kenya vis-a.-vis Australia in the small Japanese market ($1.9 million).
4 Egerton University PAM Team, 1995.
I I I I I I
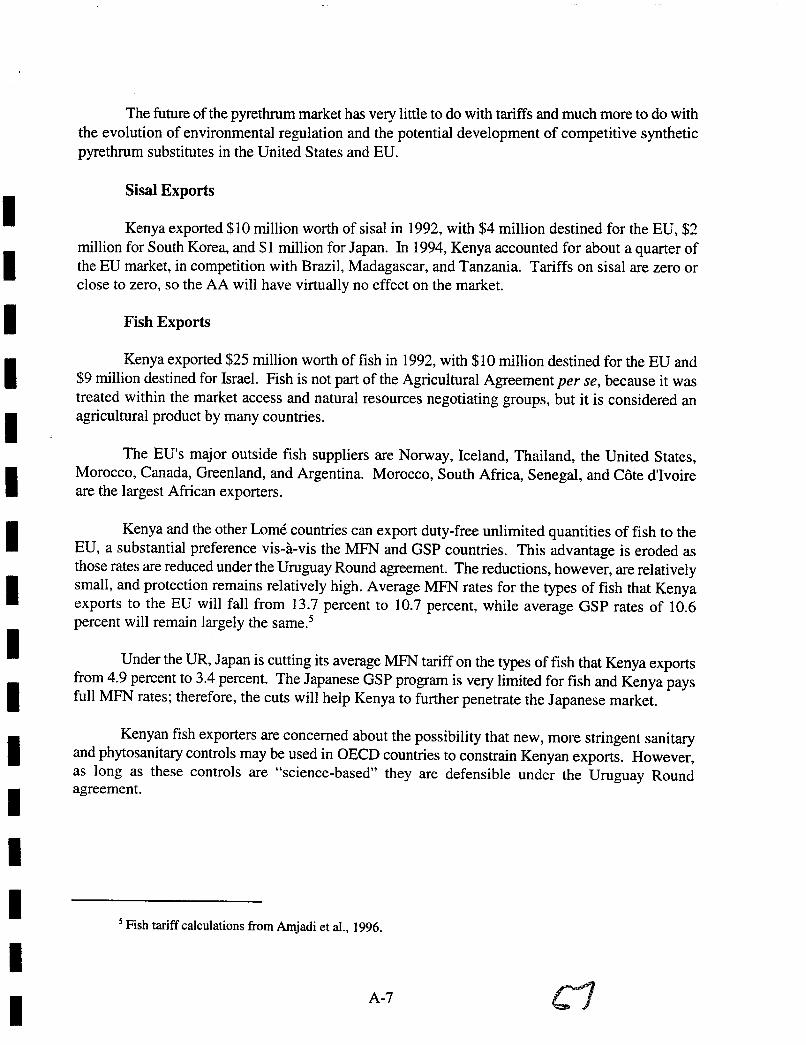
I I I I I I I I I I I I I I I I
The future of the pyrethrum market has very little to do with tariffs and much more to do with the evolution of environmental regulation and the potential development of competitive synthetic pyrethrum substitutes in the United States and ED.
Sisal Exports
Kenya exported $10 million worth of sisal in 1992, with $4 million destined for the EU, $2 million for South Korea, and $1 million for Japan. In 1994, Kenya accounted for about a quarter of the EU market, in competition with Brazil, Madagascar, and Tanzania. Tariffs on sisal are zero or close to zero, so the AA will have virtually no effect on the market.
Fish Exports
Kenya exported $25 million worth of fish in 1992, with $10 million destined for the EU and $9 million destined for Israel. Fish is not part of the Agricultural Agreement per se, because it was treated within the market access and natural resources negotiating groups, but it is considered an agricultural product by many countries.
The ED's major outside fish suppliers are Norway, Iceland, Thailand, the United States, Morocco, Canada, Greenland, and Argentina. Morocco, South Africa, Senegal, and Cote d'Ivoire are the largest African exporters.
Kenya and the other Lome countries can export duty-free unlimited quantities of fish to the EU, a substantial preference vis-a-vis the MFN and GSP countries. This advantage is eroded as those rates are reduced under the Uruguay Round agreement. The reductions, however, are relatively small, and protection remains relatively high. Average MFN rates for the types of fish that Kenya exports to the EU will fall from 13.7 percent to 10.7 percent, while average GSP rates of 10.6 percent will remain largely the same.5
Under the UR, Japan is cutting its average MFN tariff on the types offish that Kenya exports from 4.9 percent to 3.4 percent. The Japanese GSP program is very limited for fish and Kenya pays full MFN rates; therefore, the cuts will help Kenya to further penetrate the Japanese market.
Kenyan fish exporters are concerned about the possibility that new, more stringent sanitary and phytosanitary controls may be used in DECD countries to constrain Kenyan exports. However, as long as these controls are "science-based" they are defensible under the Uruguay Round agreement.
5 Fish tariff calculations from Amjadi et aI., 1996.
A-7 C1
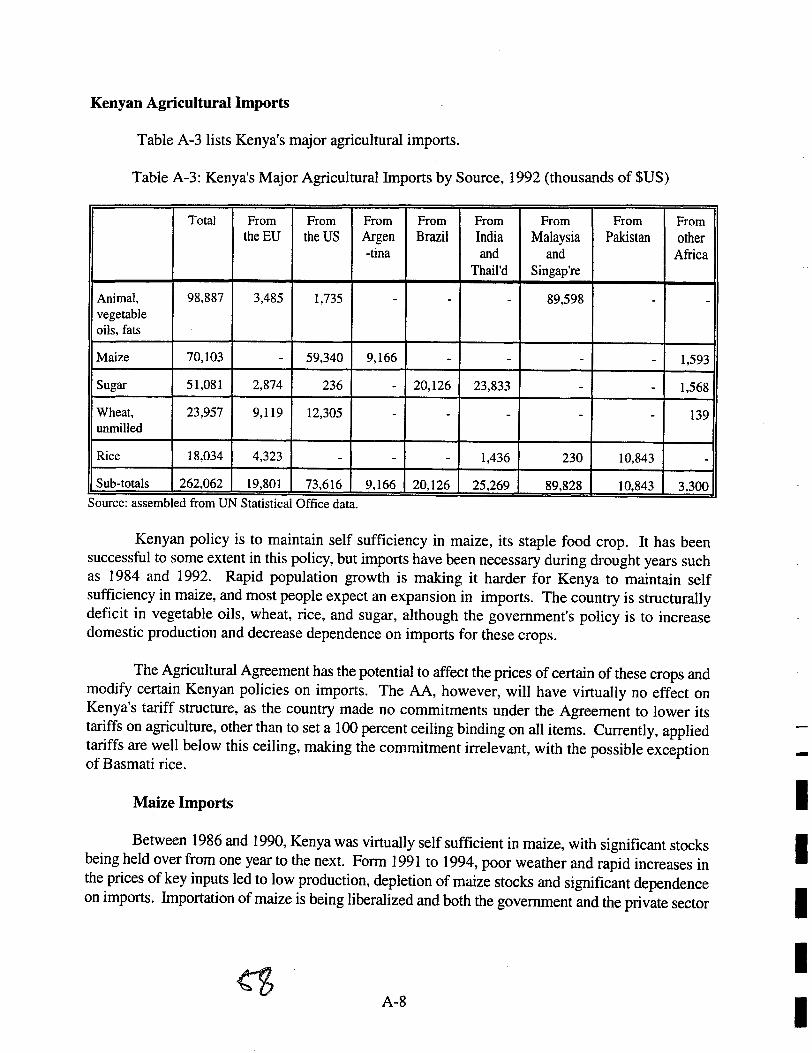
Kenyan Agricultural Imports
Table A-3 lists Kenya's major agricultural imports.
Table A-3: Kenya's Major Agricultural Imports by Source, 1992 (thousands of SUS)
Total From From From From From From From From
theEU the US Argen Brazil India Malaysia Pakistan other -tina and and Africa
Thail'd Singap're
Animal, 98,887 3,485 1,735 - - - 89,598 - -vegetable oils, fats
Maize 70,103 - 59,340 9,166 - - - - 1,593
Sugar 51,081 2,874 236 - 20,126 23,833 - - 1,568
Wheat, 23,957 9,119 12,305 - - - - - 139 unmilled
Rice 18,034 4,323 - - - 1,436 230 10,843 -Sub-totals 262,062 19,801 73,616 9.166 20,126 25,269 89,828 10.843 3.300
Source: assembled from UN Statistical Office data.
Kenyan policy is to maintain self sufficiency in maize, its staple food crop. It has been successful to some extent in this policy, but imports have been necessary during drought years such as 1984 and 1992. Rapid population growth is making it harder for Kenya to maintain self sufficiency in maize, and most people expect an expansion in imports. The country is structurally deficit in vegetable oils, wheat, rice, and sugar, although the government's policy is to increase domestic production and decrease dependence on imports for these crops.
The Agricultural Agreement has the potential to affect the prices of certain of these crops and modify certain Kenyan policies on imports. The AA, however, will have virtually no effect on Kenya's tariff structure, as the country made no commitments under the Agreement to lower its tariffs on agriCUlture, other than to set a 100 percent ceiling binding on all items. Currently, applied tariffs are well below this ceiling, making the commitment irrelevant, with the possible exception of Basmati rice.
Maize Imports
Between 1986 and 1990, Kenya was virtually self sufficient in maize, with significant stocks being held over from one year to the next. Form 1991 to 1994, poor weather and rapid increases in the prices of key inputs led to low production, depletion of maize stocks and significant dependence on imports. Importation of maize is being liberalized and both the government and the private sector
A-8
-I I I I I

I I I I I I I I I I I I I I I
are involved, although a variable levy is imposed on private imports. The 1995 Customs Amendment publishes a 15 percent or 10 Shs/kg tariff on maize imports.
The FAD predicts that the Uruguay Round will cause a 4 percent increase in maize prices by the year 2000 (FAD, 1995). Goldin and van der Mensbrugghe predict than the UR will raise maize prices by 2.3 percent. These effects will be driven mainly by export subsidy reductions in the EU, Canada, Mexico, the United States, and South Africa. These subsidy reductions will reduce the amount of subsidized maize on world markets by 4.8 million tons by the year 2000. The reductions are likely to mean higher import bills for Kenya when it needs to import from the world market and fewer opportunities to purchase subsidized maize.
It should be noted, however, that few countries are using export subsidies for maize at this time, so the UR currently has little effect on world prices. If world prices fall in the future and countries are tempted to revive their subsidy programs, the AA should become more binding.
Also worth noting is the government's decision to establish a strategic maize reserve stock of up to 3 million 90-kilogram bags, an amount deemed necessary to cover a 3 month lag time to arrange for imports in the event of an emergency shortage. The reserve is to be supplemented by a foreign exchange reserve earmarked for maize imports during emergencies.6 The Agricultural Agreement explicitly exempts such food security reserves from any requirements for subsidy reductions.
Imports of Wbeat, Rice, Edible Oils, and Sugar
Domestic production of wheat currently meets only 40 percent of national consumption requirements. Wheat imports increased dramatically after 1990 because production declined and marketing was liberalized to allow more imports. 1994 imports were over $40 million. According to the government, wheat imports will be subject to a variable duty to protect domestic producers from dumping of cheap imports. The 1995 Customs Amendment publishes a 15 percent or 1.35 Shs/kg tariff on wheat imports.
Rice consumption in Kenya is only 3 percent that of maize. Production is subsidized and heavily protected. The country imports about 55 percent of its requirements, with 1994 imports of $24 million. The 1995 Customs Amendment publishes a 40 percent tariff or 10 Shs/kg, but in September 1995, the variable duty was reported to be at 200 percent for Basmati rice and 80 percent for Sindano rice.7 The Basmati rice tariff would be in conflict with Kenya's commitments under the AA to a ceiling binding of 100 percent.
Kenya is heavily dependent on imports of edible oils, mostly palm oils from Malaysia and Indonesia. Imports tripled between 1984 and 1992. The government has expressed concerns about
6 Republic of Kenya, "Sessional Paper No.2 of 1994 on National Food Policy," April 1994.
7 Egerton University PAM Team. 1995.
A-9

the high cost of these oils in terms of foreign exchange and has created an Oil seeds Development Council to promote more domestic production of oil seeds such as soya and sunflower.8 A variable levy policy is in effect, with rates of 15 percent to 40 percent published by the government.
Kenya imports about half of the sugar it consumes. Domestic production has been dominated by state owned operations that have had severe management problems since 1990 leading to reduced output. Sugar tariffs were set at 15 percent or 5.5 Shs/kg in 1995, but imports are subject to a variable "supplementary levy."
Influences on Import Prices
The AA is expected to influence the prices of the foods which Kenya imports. In 1995 the F AO predicted that the Agreement would cause the following price increases by the year 2000:
• wheat +7% • rice +7% • maize +4% • edible oils +4% • sugar +7%
The wheat price increase would result from reduced use of export subsidies, and rice price increases would be caused by the opening of the Japanese and Korean markets. If these predictions prove correct, the AA will increase Kenya's food import bill.
However, other credible analysts have made quite different predictions. Goldin and van der Mensbrugghe (1995) of the World Bank predict that the AA will have the following price impacts by the year 2002:
• wheat +3.8% • nee -0.9% • coarse grains +2.3% • edible oils -0.3% • sugar +1.8%
These price increases, if realized, will cause only a small increase in Kenya's food import bills. The differences between the two sets of predictions are related to Goldin's more skeptical interpretation of the impacts of subsidy reductions and heavier reliance on cross-elasticities in the analysis. Both sets of predictions are well below the changes associated with the normal instability in world markets.
8 Republic of Kenya, Recovery and Sustainable Development to the Year 2010, 1994.
A-lO
I I I I I

I I I I I I I I I I I I I I I
Only time will tell which one of these sets of predictions is more accurate; however, Goldin's skeptical interpretation of the impacts of subsidy reductions has more support among other analysts (Hathaway and Ingco, 1995, Francois, McDonald, and Nordstrom, 1995). Ingco concludes that subsidy reductions will affect too small a percentage of edible oil, sugar, and rice markets to have much impact. And, as noted earlier in this report, the United States and EU currently are subsidizing very few exports, so the reduction commitments are non-constraining and irrelevant for the moment.
Impacts of the AA on Kenyan Agricultural Trade Policy
Neither the binding of its tariffs at a 100 percent ceiling nor the AA's requirement of tariffication will have much impact on the tariffs Kenya charges at its borders. The reason for this is that Kenya underwent tariffication and tariff rationalization before the AA was signed. These reforms were part of an overall trade reform implemented with support from the World Bank and IMF. Import licensing was abolished in May 1993, and quantitative restrictions were converted into tariffs. The maximum tariff rate was reduced from 45 percent in 1994 to 40 percent in 1995. A gradual tariff reform policy is being pursued with the objective of achieving a maximum tariff rate of 30 percent and 3 non-zero tariff rates by July 1997.9 The Uruguay Round agreements can be seen as supportive of these reforms, but the driving forces were the IMF and World Bank.
Given that official tariff rates are relatively low, an explanation is necessary for Kenya's decision to set such a high ceiling tariff in its schedule to the Agricultural Agreement. The reason appears to be a desire to maintain the capacity to impose a supplementary variable levy on top of its published tariffs for wheat, maize, sugar, rice, and vegetable oils. This levy, according to the government, is needed "to protect domestic producers from dumping of cheap imports.,,10 In the past, Kenyan farmers have complained about unfair competition from subsidized imports of sugar, maize, and milk, mainly originating in the EU.
Kenya's high ceiling binding gives it considerable flexibility to vary its tariffs to achieve the protection it wants. The levies, however, could be challenged under the Agreement, since it states that variable levies are forbidden (Article 4, paragraph 2). In practice, several countries use variable levies without sanction, and a challenge is unlikely for Kenya in the near term. This is not to say that Kenya's high ceiling binding was a good decision. Ingco (1995) argues that high bindings represent a missed opportunity for African leaders to "lock in" or anchor their tariff reforms to an international treaty, and to engage more substantially in the Uruguay Round negotiations themselves. She argues that high bindings provide a negative signal about liberalization and could be one of the many factors which can damper the enthusiasm of potential foreign investors.
Kenya's variable levies are a contentious issue, but the government is willing to phase them out if it can develop other methods to protect against "dumping." In this spirit, the government is developing anti-dumping legislation, consistent with WTO rules, for presentation to Parliament.
9 Republic of Kenya, "Economic Reforms for 1996-98 The Policy Framework Paper," February, 1996.
10 Republic of Kenya, "Sessional Paper No.2 of 1994 on National Food Policy," April 1994.
A-ll

Once these are enacted, variable levies on cereal imports are scheduled to be eliminated, with a target date of December 1996. The government is also committed to eliminating "the discriminatory elements of the supplementary levy on sugar" by that time.))
Summary and Conclusion
The EU is by far Kenya's most important market. Because of Kenya's preferential tariff status there, the MFN tariff cuts negotiated under the AA will cause some preference erosion. For black tea exports, the 5 percentage point advantage over Asian suppliers will evaporate. For unroasted coffee, the 5 percentage point advantage over Brazil, Indonesia, and India will disappear. For some horticultural products, such as canned green beans, preference erosion will occur in relation to China.
This preference erosion, however, is not as serious as initially feared because so many of Kenya's competitors in the EU market also have preferential access and will not be affected by the MFN tariff cuts. Virtually all suppliers of fresh green beans, for example, have duty-free access to the EU, as do most coffee suppliers. Tea is the only major crop where preferences are seriously eroded. However, analysts believe that the Uruguay Round agreements will cause global income growth, thereby increasing the demand for tea, compensating Kenya to some degree for this erosion.
In terms of imports, the Agricultural Agreement has the potential to cause slight increases in the prices of foods that Kenya imports - maize, wheat, rice, sugar, and edible oils. Analysts disagree about the likely size of these increases, and most agree that they will be small - less than normal variations in world prices. Nonetheless, commitments made by the West to reduce subsidized exports of maize and wheat may eventually result in less opportunities for Kenya to buy these cereals at bargain prices.
In terms of policy, the Agricultural Agreement will have limited impact on Kenya because of the country's decision to bind its tariff rates at the high level of 100 percent. This ceiling binding is well above the rates Kenya actually applies, and it leaves room for Kenya to continue to impose variable levies on key imports, although these are technically prohibited by the Agreement. Reformers in the Kenyan government missed an opportunity to anchor their own tariff reductions to the Agricultural Agreement when they opted for their high tariff binding.
One of the reasons that the AA's impact on Kenyan policy is muted is that the country implemented significant trade reforms, such as tariffication, before the Agreement was signed. The spirit of the Uruguay Round may have reinforced Kenya's decision to undertake these reforms, but the World Bank and IMF were the true driving forces.
II RepUblic of Kenya. "Economic Reforms for 1996-98 The Policy Framework Paper," February, 1996.
A-12
I I I I I
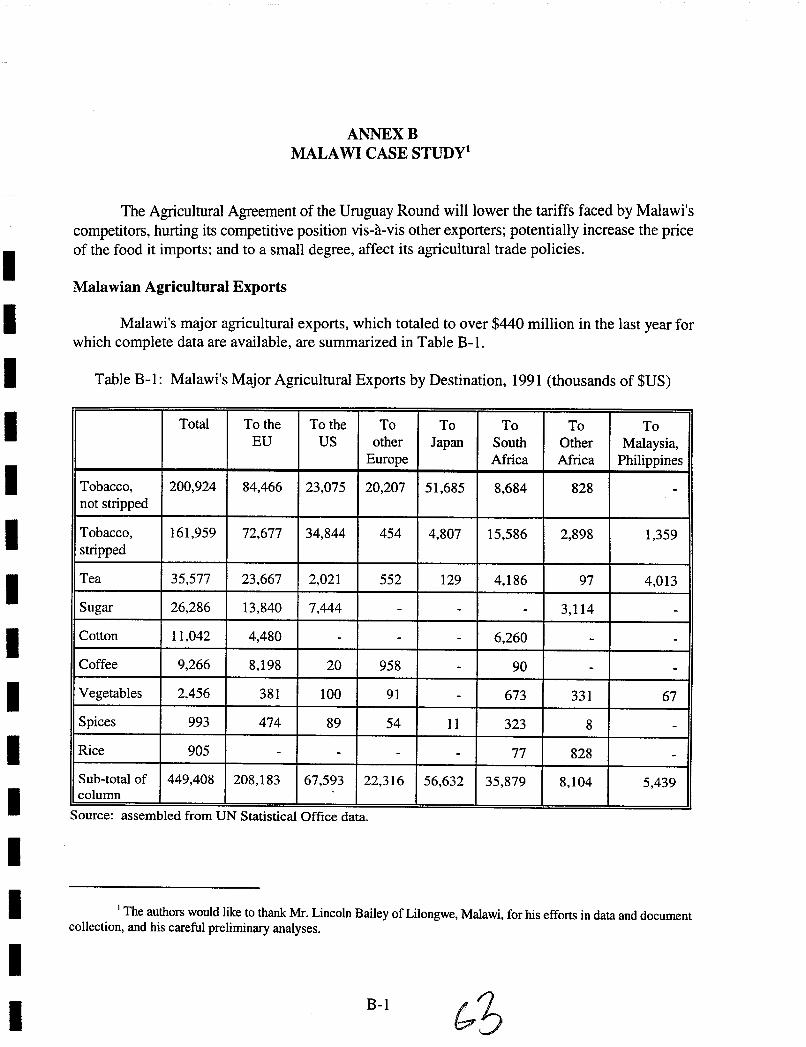
I I I I I I I I I I I I I I I
ANNEXB MALA WI CASE STUDY·
The Agricultural Agreement of the Uruguay Round will lower the tariffs faced by Malawi's competitors, hurting its competitive position vis-a-vis other exporters; potentially increase the price of the food it imports; and to a small degree, affect its agricultural trade policies.
Malawian Agricultural Exports
Malawi's major agricultural exports, which totaled to over $440 million in the last year for which complete data are available, are summarized in Table B-1.
Table B-1: Malawi's Major Agricultural Exports by Destination, 1991 (thousands of SUS)
Total To the To the To To To To To EU US other Japan South Other Malaysia,
Europe Africa Africa Philippines
Tobacco, 200,924 84,466 23,075 20,207 51,685 8,684 828 -not stripped
Tobacco, 161,959 72,677 34,844 454 4,807 15,586 2,898 1,359 stripped
Tea 35,577 23,667 2,021 552 129 4,186 97 4,013
Sugar 26,286 13,840 7,444 - - - 3,114 -Cotton 11,042 4,480 - - - 6,260 - -Coffee 9,266 8,198 20 958 - 90 - -Vegetables 2,456 381 100 91 - 673 331 67
Spices 993 474 89 54 11 323 8 -Rice 905 - - - - 77 828 -Sub-total of 449,408 208,183 67,593 22,316 56,632 35,879 8,104 5,439 column
Source: assembled from UN Statistical Office data.
1 The authors would like to thank Mr. Lincoln Bailey of Lilongwe, Malawi, for his efforts in data and document collection, and his careful preliminary analyses.
B-1

Malawi is strongly dependent on agricultural exports to generate employment and foreign exchange. In 1995, exports of tobacco, tea, sugar, and coffee comprised 80 percent of the country's total export earnings. Tobacco alone accounts for 60 to 70 percent of earnings, making Malawi one of the most concentrated exporters in the world and extremely vulnerable to international tobacco price changes.
As a member of the Lome Convention, Malawi has duty-free access to the EU for virtually all of its agricultural exports, and almost 60 percent are destined for that market. Malawi is also eligible for the GSP programs in the United States, Japan, and other European countries, which results in zero or preferential tariff rates on many, but not all, agricultural products. Malawi is classified by the UN as a Least Developed Country (LDC) which gives it additional preferences, for example duty-free entry of most goods into Japan. Because of its high level of preferences, Malawi is vulnerable to preference erosion when MFN rates are cut, as they are under the Agricultural Agreement.
A small but growing part of Malawi's agricultural trade is with other African countries. This trade is facilitated by Malawi's bilateral trade agreements with South Africa and Zambia (reciprocal MFN arrangements) and Zimbabwe (reciprocal duty-free trade). Malawi is a member of the Common Market for Eastern and Southern Africa (COMES A) which results in tariff rates that are 60 percent lower than MFN rates among the 22 member states.
Malawi joined the WTO in 1995. Before the Uruguay Round, Malawi had signed only one GATT agreement - the Customs Valuation Code.
Tobacco Exports
In 1995, tobacco accounted for 87 percent of Malawi's agricultural exports and 60 percent of total exports.
The international harmonized tariff code divides the unmanufactured tobacco that Malawi exports into two categories:
• •
Tobacco, not stemmed or stripped, and Tobacco, partly or wholly stemmed or stripped .
In 1994, "not-stemmed" tobacco made up 38 percent of Malawian tobacco exports, and stemmed tobacco made up 62 percent. Burley tobacco accounts for 73 percent of earnings, flue tobacco 20 percent, and other tobaccos such as "oriental" account for 7 percent.2 Destinations are shown in Table B-2.
2 Based on 1995 figures supplied by the Malawi Tobacco Control Commission.
B-2
I I I I I
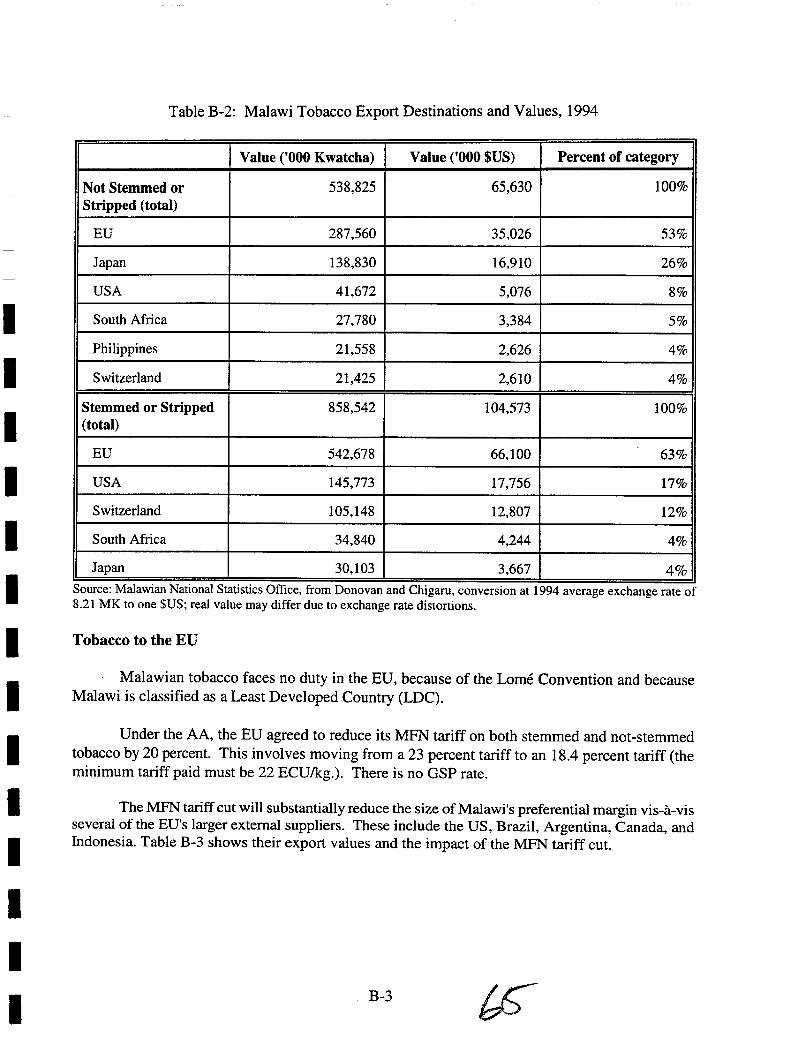
I I I I I I I I I I I I I I
Table B-2: Malawi Tobacco Export Destinations and Values, 1994
Value ('000 Kwatcha) Value ('000 $US) Percent of category
Not Stemmed or 538,825 65,630 100% Stripped (total)
EU 287,560 35,026 53%
Japan 138,830 16,910 26%
USA 41,672 5,076 8%
South Africa 27,780 3,384 5%
Philippines 21,558 2,626 4%
Switzerland 21,425 2,610 4%
Stemmed or Stripped 858,542 104,573 100% (total)
EU 542,678 66,100 63%
USA 145,773 17,756 17%
Switzerland 105,148 12,807 12%
South Africa 34,840 4,244 4%
Japan 30,103 3,667 4% ..
Source: Malawian Natlonal StatIStICS Office, from Donovan and ChIgaru, converSIon at 1994 average exchange rate of 8.21 MK to one $US; real value may differ due to exchange rate distortions.
Tobacco to the EU
, Malawian tobacco faces no duty in the EU, because of the Lome Convention and because Malawi is classified as a Least Developed Country (LDC).
Under the AA, the EU agreed to reduce its MFN tariff on both stemmed and not-stemmed tobacco by 20 percent. This involves moving from a 23 percent tariff to an 18.4 percent tariff (the minimum tariff paid must be 22 ECUlkg.). There is no asp rate.
The MFN tariff cut will substantially reduce the size of Malawi's preferential margin vis-a-vis several of the EO's larger external suppliers. These include the US, Brazil, Argentina, Canada, and Indonesia. Table B-3 shows their export values and the impact of the MFN tariff cut.
B-3

Table B-3: Major External Tobacco Suppliers to the EU and Effects of the AA
Country Exports in 1994 Effect of the MFN tariff cut on ($US millions) competitive position
US 687 helps
Brazil 316 helps
Zimbabwe 145 preference erosion
Turkey 115 preference erosion
Malawi 110 preference erosion
Indonesia 62 helps
Argentina 45 helps
Canada 37 helps
Source: export data from UN Statistics Office.
Under a worst case scenario, the 20 percent tariff cut could result in a 3.8 percent fall in EU tobacco prices and Malawi could lose $4.2 million in annual revenue. A more likely outcome is something like a 2 percent fall in tobacco prices, costing Malawi $2.2 million in lost revenues annually if it maintains its export volumes.
Al1 other factors remaining unchanged, the impact is clearly negative for Malawi, given its strong dependence on the EU tobacco market. The impact should be seen, however, in the light of normal fluctuations in world tobacco prices. Between 1982 and 1992 the real price of Malawian burley tobacco varied by as much as 100 percent. 3
Tobacco to the United States
The United States is Malawi's second largest tobacco destination. The U.S. market is protected by a quota system for many tobacco products, including those exported by Malawi. GAIT issued a "Section 22 waiver" to entitle the United States to impose import quotas on tobacco before the AA was signed. The quota system has been transformed into a "tariff quota" on paper but in reality it functions as a traditional allocated quota. Under the system, the fol1owing countries receive al1ocations:
3 The real price was 180 MKlton in 1982 and 96 MKlton in 1989. In 1992, the last year for which equivalent data is available, the real price was 125 MKlton. Real prices are nominal prices deflated by the consumer retail price index. Data from World Bank, 1995.
B-4
I I I I I
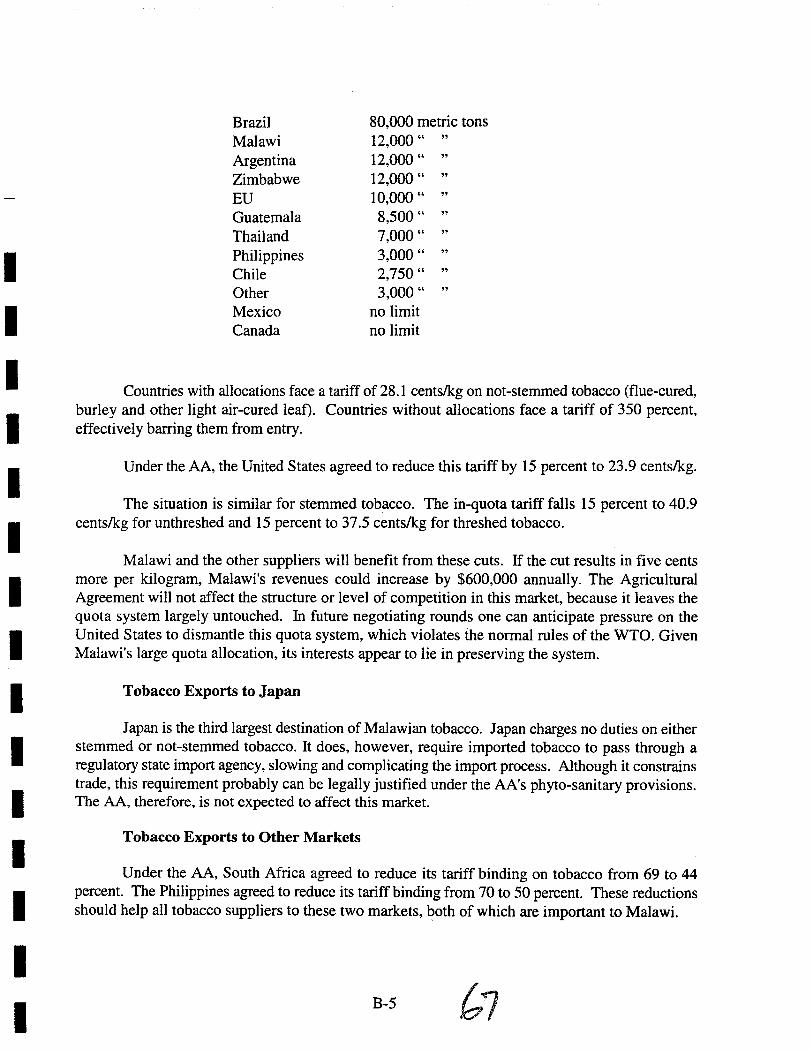
I I I I I I I I I I I I I I I
Brazil 80,000 metric tons Malawi 12,000 .. " Argentina 12,000 .. " Zimbabwe 12,000 .. " EU 10,000 " " Guatemala 8,500 .. " Thailand 7,000 .. " Philippines 3,000 .. " Chile 2,750 .. " Other 3,000 .. " Mexico no limit Canada no limit
Countries with allocations face a tariff of 28.1 cents/kg on not-stemmed tobacco (flue-cured, burley and other light air-cured leaf). Countries without allocations face a tariff of 350 percent, effectively barring them from entry.
Under the AA, the United States agreed to reduce this tariff by 15 percent to 23.9 cents/kg.
The situation is similar for stemmed tobacco. The in-quota tariff falls 15 percent to 40.9 cents/kg for unthreshed and 15 percent to 37.5 cents/kg for threshed tobacco.
Malawi and the other suppliers will benefit from these cuts. If the cut results in five cents more per kilogram, Malawi's revenues could increase by $600,000 annually. The Agricultural Agreement will not affect the structure or level of competition in this market, because it leaves the quota system largely untouched. In future negotiating rounds one can anticipate pressure on the United States to dismantle this quota system, which violates the normal rules of the WTO. Given Malawi's large quota allocation, its interests appear to lie in preserving the system.
Tobacco Exports to Japan
Japan is the third largest destination of Malawian tobacco. Japan charges no duties on either stemmed or not-stemmed tobacco. It does, however, require imported tobacco to pass through a regulatory state import agency, slowing and complicating the import process. Although it constrains trade, this requirement probably can be legally justified under the AA's phyto-sanitary provisions. The AA, therefore, is not expected to affect this market.
Tobacco Exports to Other Markets
Under the AA, South Africa agreed to reduce its tariff binding on tobacco from 69 to 44 percent. The Philippines agreed to reduce its tariff binding from 70 to 50 percent. These reductions should help all tobacco suppliers to these two markets, both of which are important to Malawi.
B-5
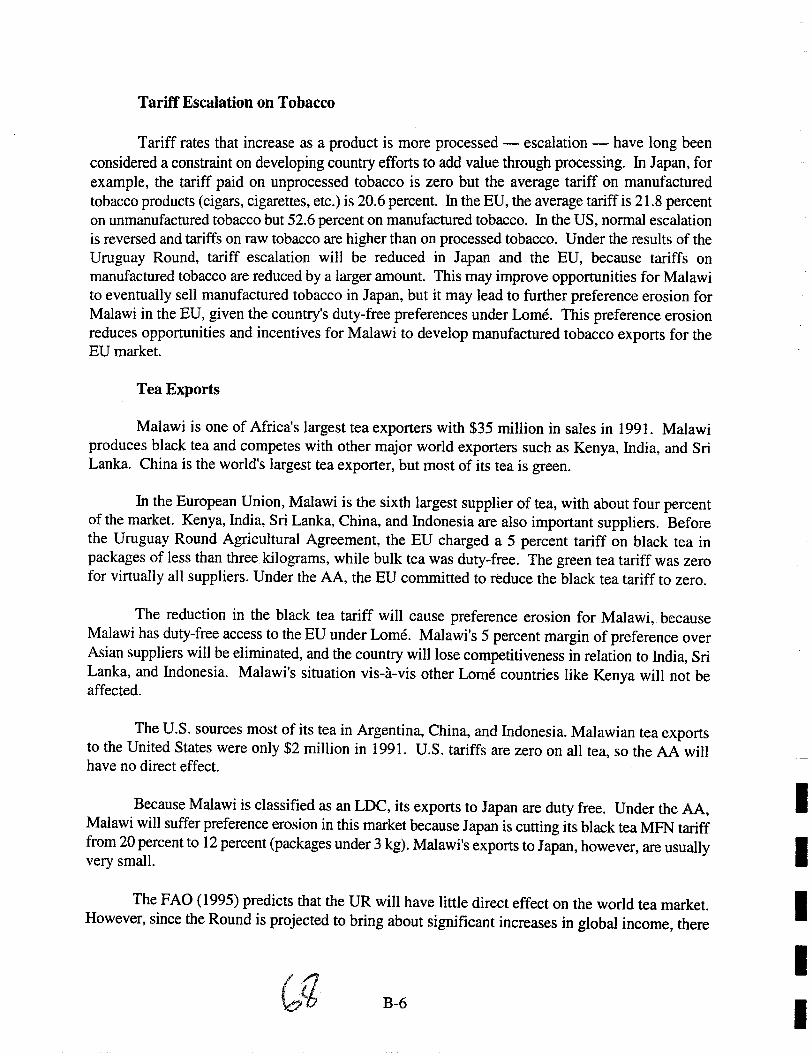
Tariff Escalation on Tobacco
Tariff rates that increase as a product is more processed - escalation - have long been considered a constraint on developing country efforts to add value through processing. ill Japan, for example, the tariff paid on unprocessed tobacco is zero but the average tariff on manufactured tobacco products (cigars, cigarettes, etc.) is 20.6 percent. In the EU, the average tariff is 21.8 percent on unmanufactured tobacco but 52.6 percent on manufactured tobacco. In the US, norma] escalation is reversed and tariffs on raw tobacco are higher than on processed tobacco. Under the results of the Uruguay Round, tariff escalation will be reduced in Japan and the EU, because tariffs on manufactured tobacco are reduced by a larger amount. This may improve opportunities for Malawi to eventually sell manufactured tobacco in Japan, but it may lead to further preference erosion for Malawi in the EU, given the country's duty-free preferences under Lome. This preference erosion reduces opportunities and incentives for Malawi to develop manufactured tobacco exports for the EU market.
Tea Exports
Malawi is one of Africa's largest tea exporters with $35 million in sales in 1991. Malawi produces black tea and competes with other major world exporters such as Kenya, India, and Sri Lanka. China is the world's largest tea exporter, but most of its tea is green.
In the European Union, Malawi is the sixth largest supplier of tea, with about four percent of the market. Kenya, India, Sri Lanka, China, and Indonesia are also important suppliers. Before the Uruguay Round Agricultural Agreement, the EU charged a 5 percent tariff on black tea in packages of less than three kilograms, while bulk tea was duty-free. The green tea tariff was zero for virtually all suppliers. Under the AA, the EU committed to reduce the black tea tariff to zero.
The reduction in the black tea tariff will cause preference erosion for Malawi, because Malawi has duty-free access to the EU under Lome. Malawi's 5 percent margin of preference over Asian suppliers will be eliminated, and the country will lose competitiveness in relation to India, Sri Lanka, and Indonesia. Malawi's situation vis-a-vis other Lome countries like Kenya will not be affected.
The U.S. sources most of its tea in Argentina, China, and Indonesia. Malawian tea exports to the United States were only $2 million in 1991. U.S. tariffs are zero on all tea, so the AA will have no direct effect.
Because Malawi is classified as an LDC, its exports to Japan are duty free. Under the AA, Malawi will suffer preference erosion in this market because Japan is cutting its black tea MFN tariff from 20 percent to 12 percent (packages under 3 kg). Malawi's exports to Japan, however, are usually very small.
The F AO (1995) predicts that the UR will have little direct effect on the world tea market. However, since the Round is projected to bring about significant increases in global income, there
B-6
I I I I I
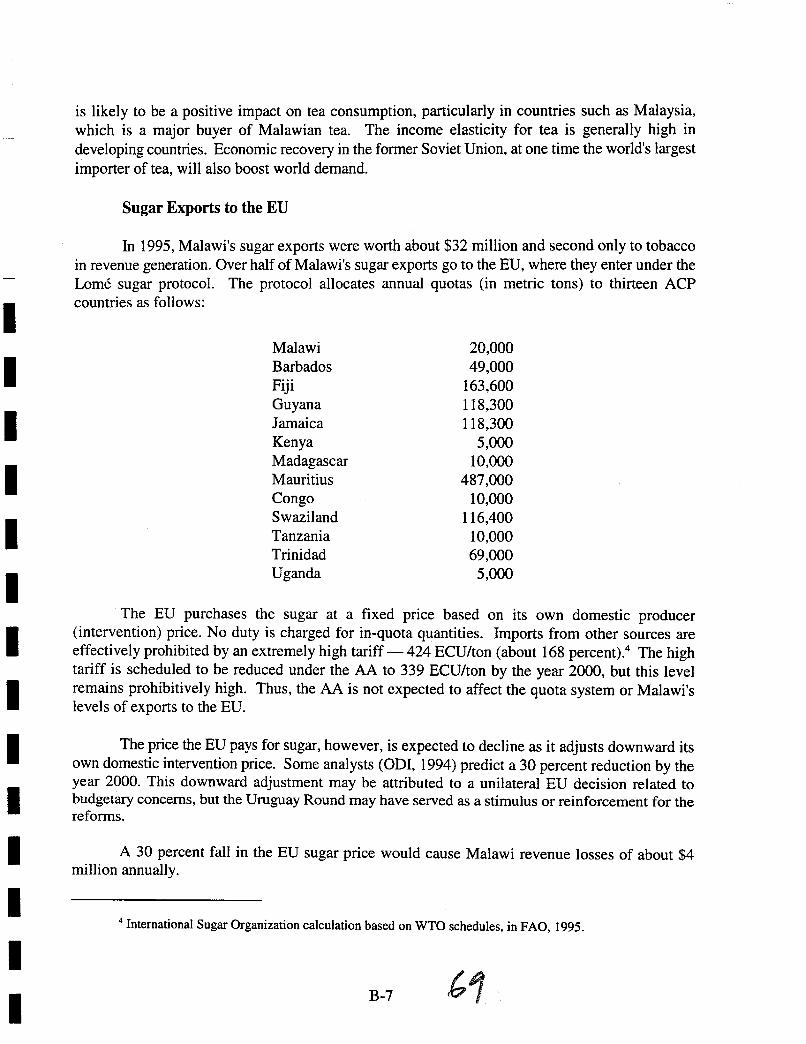
I I I I I I I I I I I I I I
is likely to be a positive impact on tea consumption, particularly in countries such as Malaysia, which is a major buyer of Malawian tea. The income elasticity for tea is generally high in developing countries. Economic recovery in the former Soviet Union, at one time the world's largest importer of tea, will also boost world demand.
Sugar Exports to the EU
In 1995, Malawi's sugar exports were worth about $32 million and second only to tobacco in revenue generation. Over half of Malawi's sugar exports go to the EU, where they enter under the Lome sugar protocol. The protocol allocates annual quotas (in metric tons) to thirteen ACP countries as follows:
Malawi Barbados Fiji Guyana Jamaica Kenya Madagascar Mauritius Congo Swaziland Tanzania Trinidad Uganda
20,000 49,000
163,600 118,300 118,300
5,000 10,000
487,000 10,000
116,400 10,000 69,000
5,000
The EU purchases the sugar at a fixed price based on its own domestic producer (intervention) price. No duty is charged for in-quota quantities. Imports from other sources are effectively prohibited by an extremely high tariff- 424 ECU/ton (about 168 percent).4 The high tariff is scheduled to be reduced under the AA to 339 ECU/ton by the year 2000, but this level remains prohibitively high. Thus, the AA is not expected to affect the quota system or Malawi's levels of exports to the EU.
The price the EU pays for sugar, however, is expected to decline as it adjusts downward its own domestic intervention price. Some analysts (ODI, 1994) predict a 30 percent reduction by the year 2000. This downward adjustment may be attributed to a unilateral EU decision related to budgetary concerns, but the Uruguay Round may have served as a stimulus or reinforcement for the reforms.
A 30 percent fall in the EU sugar price would cause Malawi revenue losses of about $4 million annually.
4 International Sugar Organization calculation based on WTO schedules, in FAO, 1995.
B-7

Sugar Exports to the United States
The United States is Malawi's second largest market for sugar, with about $7 million in annual sales. Sugar sales in the United States are governed by quotas, now converted into "tariff rate quotas" under the Agricultural Agreement. Each year the U.S. Trade Representative sets a total quota amount and divides it among traditional suppliers, including Malawi. As in the case of the EU, the above-quota tariff rates are prohibitively high and will remain so in the year 2000, despite AA reduction commitments.5 In-quota rates are low (about 1.46 centslkg) for MFN suppliers, and most suppliers enjoy duty-free access under the GSP or other preferential arrangements.
The AA is not expected to affect Malawi's quota, its zero duty status, or the price it receives for sugar in the US. Sugar prices in the United States remain insulated from world prices, and the recently-passed 1996 farm bill did little to change American sugar policy.
The AA may improve sugar prices in markets outside of the DECO, because: (a) export subsidies will be reduced, producing slight upward pressure on prices, and (b) global income growth stimulated by the UR will increase demand for sugar, particularly in Asia. To date, Malawi exports very little to non-DECO markets, but this situation might evolve if prices become more attractive.
Coffee Exports
The value of Malawi's coffee exports declined during the late 1980s and early 1990s because of low world prices. However, over the past two years prices have recovered significantly, and Malawi's earnings and interest in coffee have expanded again. 1995 exports were $13 million.
The EU is the destination for over 70 percent of Malawi's coffee exports. Uganda, Cote d'Ivoire, and Kenya are Africa's largest exporters to the EU, but most supplies come from Latin America. The biggest exporters to the EU are Columbia, Brazil, EI Salvador, and Costa Rica. Indonesia and India are the biggest Asian exporters.
Before the AA, the EU had a 5 percent MFN tariff on unroasted coffee and a 15 percent tariff on roasted coffee. Ninety percent of imports are unroasted. Malawi, like other African exporters, pays no tariffs because of the Lome Convention. Andean and Central American countries, as areas affected by drug trafficking, also are eligible for zero tariffs. Brazil, India, and Indonesia pay the MFN rate of 5 percent on unroasted coffee.
Under the Agreement, the MFN rates will be reduced to zero on unroasted and 7.5 percent on roasted coffee. This will not affect the rates paid by Malawi, other African countries, or suppliers from Central America or the Andean countries. It will reduce the duties paid by Brazil and Asian suppliers, leveling the playing field for them on unroasted coffee. The result is preference erosion
5 The ad-valorem equivalent tariff is 197 percent for above-quota sugar in the United States, according to estimated by Ingco, 1995.
B-8
I I I I
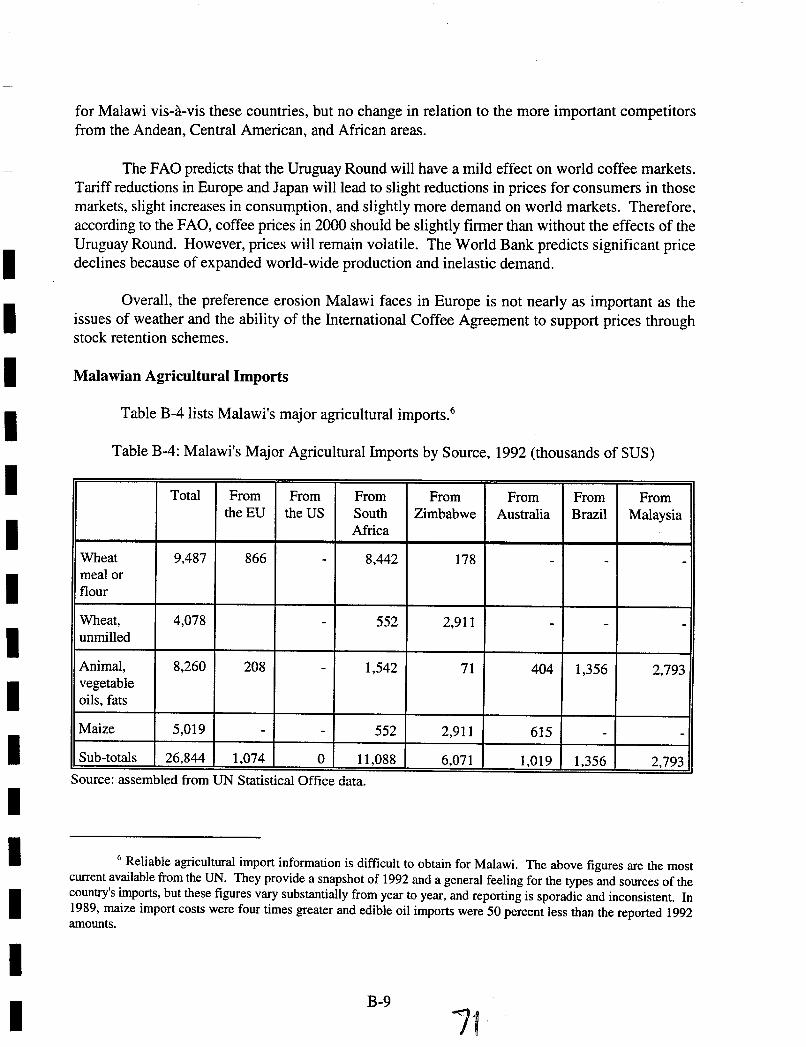
I I I I I I I I I I I I I I I
for Malawi vis-a-vis these countries, but no change in relation to the more important competitors from the Andean, Central American, and African areas.
The FAO predicts that the Uruguay Round will have a mild effect on world coffee markets. Tariff reductions in Europe and Japan will lead to slight reductions in prices for consumers in those markets, slight increases in consumption, and slightly more demand on world markets. Therefore, according to the F AO, coffee prices in 2000 should be slightly firmer than without the effects of the Uruguay Round. However, prices will remain volatile. The World Bank predicts significant price declines because of expanded world-wide production and inelastic demand.
Overall, the preference erosion Malawi faces in Europe is not nearly as important as the issues of weather and the ability of the International Coffee Agreement to support prices through stock retention schemes.
Malawian Agricultural Imports
Table B-4lists Malawi's major agricultural imports.6
Table B-4: Malawi's Major Agricultural Imports by Source, 1992 (thousands of $US)
Total From From From From From From From theEU the US South Zimbabwe Australia Brazil Malaysia
Africa
Wheat 9,487 866 - 8,442 178 - - -meal or flour
Wheat, 4,078 - 552 2,911 - - -unmilled
Animal, 8,260 208 - 1,542 71 404 1,356 2,793 vegetable oils, fats
Maize 5,019 - - 552 2,911 615 - -Sub-totals 26,844 1,074 0 11,088 6,071 1,019 1,356 2,793
Source: assembled from UN StatIstIcal Office data.
6 Reliable agricultural import information is difficult to obtain for Malawi. The above figures are the most current available from the UN. They provide a snapshot of 1992 and a general feeling for the types and sources of the country's imports, but these figures vary substantially from year to year, and reporting is sporadic and inconsistent. In 1989, maize import costs were four times greater and edible oil imports were 50 percent less than the reported 1992 amounts.
B-9
71

Although Malawi was a net food exporter during much of the 1980s, the country has come to rely increasingly on food imports and food aid in recent years. Drought is the primary explanation, as rains have been poor and production of the staple crop - maize - has dropped. There is widespread food insecurity at the household level, with chronic malnutrition and some of the worst rates of infant mortality in Africa.
Maize Imports
Maize occupies about 80 percent of land cultivated by small-holders in Malawi. The crop mainly consists of low-yielding local varieties, but in recent years the adoption of higher yielding hybrids has increased. Drought has caused overall production to fall to low levels in three of the past four years, causing food insecurity in many parts of the country. The maize production and deficit situation is shown in Table B-5, based on FAD estimates.
Table B-5: Maize Production and Requirement Estimates (in tons)
1990/91 1991192 1992/93 1993/94 1994/95
Production 1,775,014 742,408 2,256,480 1.038,401 1,532,413
Estimated 1,543,752 1,599,065 1,647,321 1,701,682 1,757,840 requirement
Difference 231,262 (856,657) 609,159 (663,281) (225,427)
Source: Johnson, FAO, 1996.
Maize imports are traditionally the domain of the state trading company ADMARC. Private maize imports are subject to licensing. In practice, most of the deficit is covered by food aid from the US, Canada, and European countries, either in the form of emergency aid (free) or program aid (purchased on subsidized credit).7 Japan has provided money for maize purchases. In 1995, the government calculated the food deficit to be 190,000 tons and negotiated with the donors to receive 90,000 tons in emergency aid and 100,000 tons in program aid. The government also manages a newly created Strategic Grain Reserve (SGR).
The Agricultural Agreement is not expected to have a direct impact on Malawi's maize imports. Most imports are conducted through food aid and ADMARC and are therefore exempt from tariffs. Under the AA, Malawi set a ceiling binding of 125 percent for almost all agricultural imports including maize, but the ceiling will not affect actual tariff levels. Currently, maize is listed in the customs law as duty-free for all importers.
7 The EU provides food aid averaging $683 million annually to Malawi, with transport constituting 32 percent of the cost.
B-1O
I I I I I

I I I I I I I I I I I I I I I
The AA may have indirect effects on Malawi's maize imports, either through price increases or reductions in food aid availability.
The FAO predicts that the Uruguay Round will cause a 4 percent increase in maize prices by the year 2000 (FAO, 1995). Goldin and van der Mensbrugghe predict than the UR will raise maize prices by 3.8 percent. These predictions are based on the anticipated effects of export subsidy reductions in the EU, Canada, Mexico, the United States, and South Africa. These subsidy reductions are scheduled to reduce the amount of subsidized maize on world markets by 4.8 million tons by the year 2000. The reductions are likely to mean higher import bills for Malawi when it needs to import from the world market and less opportunities to purchase subsidized maize.
It should be noted, however, that few countries are using export subsidies for maize at this time, so the DR currently has little effect on world prices. If world prices fall in the future and countries are tempted to revive their subsidy programs, the AA should become more binding and at that time affect world prices.
Food aid is a major consideration, because Malawi depends more heavily on this source of maize than on pure commercial imports. Concerns have been voiced about reductions in OECD domestic subsidies leading to reduced surplus stocks being available for food aid.
US State Department officials play down these concerns, indicating that the AA will not affect U.S. management of its PIA80 programs (Titles I, n, and ill), although the global U.S. food aid pledge was cut in half in 1995. In the US, food aid is no longer sourced from surplus government stocks; it is purchased through the market. Analysts also downplay the role of the AA in reducing domestic subsidies in OECD countries. Domestic budgetary constraints drive these cuts, not the AA's weak provisions regarding subsidy reductions.
Given Malawi's heavy dependence on food aid during drought years and the country's poverty and food insecurity, concerns about food aid reductions are appropriate. The AA, however, probably has little to do with food aid availability. The problem is more closely related to OECD aid budgets and how much food these budgets can buy during times of high world prices, such as the past year.s
Imports of Wheat and Edible Oils
Although Malawi produces wheat and sunflower oil, the country is structurally deficit in these foods, relying on imports for over 90 percent of its needs. Most of these imports are commercial, although some wheat and vegetable oil are provided as food aid.
8 Hathaway and Ingco (1995) downplay any potential negative effects of the AA, writing that "there is nothing in the Uruguay Round that will appreciably reduce domestic subsidies and the incentives to produce; therefore, the surplus disposal problem will not be changed by the UR agreement. Moreover, since the agreement puts specific limits on the use of export subsidies as a method of moving surpluses into world markets, food aid will remain as the one legitimate method of moving excess supplies into world markets. Thus, if countries continue the use of output expanding subsidies in the face of the limits on export subsidies, it may encourage the use of more rather than less food aid."
B-ll

Malawi charges no tariff on unmilled wheat imports. It charges a 10 percent tariff on imports of wheat flour and edible oils. These tariffs will not be affected by the AA. The world price of edible oils is not expected to be influenced by the AA; however, wheat prices may be affected, according to the FAO and other analysts.
The FAO predicts that the AA will cause a 7 percent increase in international wheat prices by the year 2000. Goldin and van der Mensbrugghe predict that the UR will raise wheat prices by 3.8 percent. These predictions are based on the anticipated impact of reductions in wheat export subsidies. The United States and EU do not currently use such subsidies, but in the future the AA may constrain them from using subsidies as much as they did in earlier years, thus keeping world prices high. High wheat prices increase Malawi's food import bill.
Impacts of the AA on Malawian Agricultural Trade Policy
As a Least Developed Country, Malawi was obliged to make very few commitments under the AA. LDCs are exempted from cutting their tariffs, domestic subsidies, and export subsidies. Malawi took advantage of this flexibility to declare a simple ceiling binding of 125 percent on almost all agricultural products, and made no commitments to reduce it. The ceiling has no practical effect, as Malawi's agricultural tariffs are generally 10 to 50 percent, and even when fiscal surcharges are accounted for, the total protection is well below the ceiling. Nonetheless, some see the ceiling binding as a gesture of seriousness about trade reform and at least a step in the right direction for Malawi.9
Malawi eliminated import quotas under previous structural adjustment programs, but it continues to require import licences for 19 commodities, including maize and groundnuts. In the future, when the WTO conducts a Trade Policy Review (TPR) for Malawi, these licenses are likely to receive close attention, but only moral suasion will be used to encourage their liberalization. The government has stated its intention to maintain licences only for health, safety, and national security reasons. 10
The AA will not influence Malawi's practice of taxing exports, as these taxes fall outside the scope of the agreement. In 1994 the government introduced temporary export taxes of 10 percent on tobacco, tea, and sugar - the main foreign exchange earners. The government has stated its understanding of the potential negative effects of these taxes and its desire to eliminate them. However, according to the government, the measures are needed for fiscal reasons, until new measures to strengthen an alternative tax system take effect.
The Uruguay Round agreement defined rules for the use of anti-dumping measures, subsidies and countervailing measures, special safeguards, and technical barriers to trade. In many countries these rules will require legislation to be adapted to agree with WTO procedures. Malawi
9 Donovan and Chigaru, 1996.
10 Ministry of Commerce and Industry, "Concept Paper on Trade Policy in Malawi," 1996.
B-12
I I I I I

I I I I I I I I I I I I I I I
also needs to review its legislation and adapt it to conform to the new rules. Action is not urgent, however, as most of the new rules are not immediately relevant for Malawi's imports; they are administratively difficult to implement "by the book"; and the country is unlikely to be the subject of complaint by foreign suppliers, given the limited size and purchasing power of its internal market.
Summary and Conclusion
Given the importance of tobacco to Malawi, the Agricultural Agreement's effect on that crop is critical. In the EU, where Lome Convention tobacco enters duty-free, Malawi will experience preference erosion - costing the country perhaps $2-4 million annually once the tariff reductions are fully implemented. In the United States, small tariff reductions on tobacco will help Malawi, increasing earnings by up to $0.6 million annually. The U.S. quota system, which probably helps shield Malawi from tougher competition, remains intact after the Uruguay Round, but it may be weakened in future rounds, as it violates WTO principles. The Agricultural Agreement, therefore, potentially hurts Malawian tobacco exports more than it helps them.
The situation in sugar is somewhat similar. Malawi benefits from quotas in the EU and United States. These quota systems are not directly affected by the AA in the short run, but in the longer term they are likely to be weakened in further negotiating rounds. The ED's plans to reduce its internal price for sugar is only indirectly associated with the AA, but it could cost Malawi up to $4 million in lost revenues annually.
Malawi's heavy dependence on the artificial quota systems of the EU and United States for sugar and tobacco put the country in a vulnerable and precarious position. Policy shifts in these markets could cause precipitous falls in export earnings. A disaster would occur in Malawi if, one day, the United States decided to dismantle its quota systems, either for domestic or WTO reasons. Similarly, if the Lome agreement is not renewed when it expires in the year 2000, either for EU political purposes or because it is not granted a second waiver by the WTO, Malawi will lose the rents associated with its EU sugar quota.
For coffee and tea exports, the AA causes immediate preference erosion in the EU for all Lome countries, including Malawi. The erosion is relatively minor, but it is genuine.
Overall, the AA does not represent good news for Malawi's traditional exports in traditional markets. Two factors help to mitigate the losses, although they are unlikely to fully offset them:
• Global income growth stimulated by the Uruguay Round is expected to lead to growth in demand for some of Malawi's export crops, particularly in Asia, where growth is expected to be highest and demand for tea and tobacco are likely to grow faster than in
B-13
the United States or Europe. As much as possible, Malawi should try to diversify its trade in the direction of Asia. II
• The losses caused by preference erosion are significant, but they pale in comparison to the price fluctuations that normally occur in commodity markets. Preference erosion does not help, but it is not as dangerous as other factors that cause prices to fall.
Unfortunately, the AA is unlikely to help Malawi's situation as an importer either. If and when the AA's provisions limiting export subsidies actually become binding, some upward pressure on wheat and maize prices is likely, and cheap subsidized food will be rarer on international markets. There also is a risk that in the future, perhaps after the next round of negotiations, the AA will cause genuine reductions in domestic OECD subsidies and reduce the availability of food aid by making it more expensive to provide. This possibility represents an important source of apprehension for a country as poor and food insecure as Malawi.
Malawi needs to be vigilant to ensure that its interests as a food importer are not hurt by the Agricultural Agreement. It needs to participate actively in future WTO negotiations to ensure that developed countries do not use the AA as an excuse to reduce food aid commitments.12 It also needs to work with other LDCs to bring to life the Decision on Measures Concerning the Possible Negative Effects of the Reform Program on the Least-Developed Countries and Net-Food Importing Developing Countries. Malawi and other LDCs should put the AA to use for their needs by pressuring the WTO and its OECD members to respect this Decision and its clause requiring "consideration to requests from those countries for the provision of technical and financial assistance to improve their agricultural productivity and infrastructure.,,13
In terms of trade policy, the AA required little from Malawi. A ceiling was set on tariffs but at a very high level. Import quotas were forbidden, but these were already eliminated under prior structural adjustment programs. Nevertheless, Malawi's signing of the agreement is likely to benefit its policy-making in several ways. First, membership in the WTO will bring greater stability and certainty to trade policy formulation, improving the "intangible" aspect of business confidence. Second, AA commitments may help Malawi depoliticize import policy, helping the government fend off special interests that want, for example, reimposition of quotas on certain imports. Third, the AA
11 Diversification is always easier said than done. Established shipping routes tie many developing countries to relatively few OECD markets, and efforts to trade with others often involve costly transshipment through way-ports (Amjadi, Reinke, and Yeats, 1996).
12 Part VI of the AA states that WTO members should ensure that food aid is not tied to commercial purposes, that it is provided in grant form (as much as possible), and that FAO norms are met. Donovan and Chigaru (1996) express concerns that Part VI could be used as an excuse for reduced food aid deliveries.
13 An official memorandum by a Malawian official returning from a seminar on the WTO states that several African officials expressed disappointment in the results of the Uruguay Round. These officials said that they participated little in the UR under the assumption that "the EU would look after our interests." During future negotiations, more active, direct participation by countries like Malawi will be necessary.
B-14
I I I I I

I I I I I I I I I I I I I I
provides a guide to "best international practices" in the areas covered and defines goals in tenns of policy fonnation. 14 Fourth, as a member, Malawi will gain access to technical advice from the WTO on trade matters, including Trade Policy Reviews.
Taking these factors into account, the limited constraints that the Agreement imposes on domestic policy making probably represent more of an advantage than a drawback. At least one Malawian official expressed regret at not having used the opportunity to bind domestic trade refonns more closely to the "international anchor" of the Agricultural Agreement. 15
Given the negative effects that the AA will have on Malawi's exports and imports, it is vital that the country "tune up" its own economic policies to improve the country's resource allocation, competitiveness, and investments. The external environment is increasingly difficult and beyond Malawi's control. The country must, therefore, reform its own policies to make the best of the internal resources that it can control. It should, for example, accelerate the process of replacing its current agricultural export taxes with alternatives that are less-distorting.
14 Conclusion drawn from Donovan and Chigaru, 1996.
15 Mission Report, EUlACPIWTO Seminar on Uruguay Round Results, Gaborone, February 1996.
B-15 1~
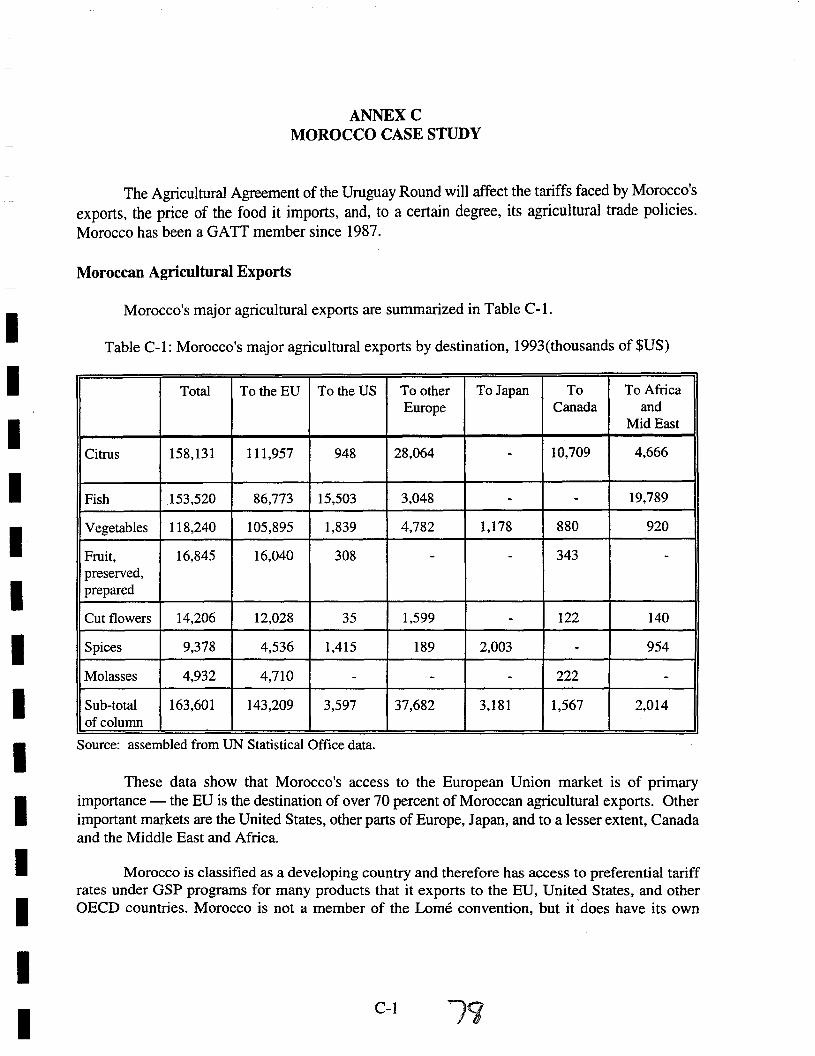
I I I I I I I I I I I I
I I
ANNEXC MOROCCO CASE STUDY
The Agricultural Agreement of the Uruguay Round will affect the tariffs faced by Morocco's exports, the price of the food it imports, and, to a certain degree, its agricultural trade policies. Morocco has been a GATT member since 1987.
Moroccan Agricultural Exports
Morocco's major agricultural exports are summarized in Table C-l.
Table C-l: Morocco's major agricultural exports by destination, 1993(thousands of $US)
Total To the EU To the US To other To Japan To To Africa Europe Canada and
Mid East
Citrus 158,131 111,957 948 28,064 - 10,709 4,666
Fish 153,520 86,773 15,503 3,048 - - 19,789
Vegetables 118,240 105,895 1,839 4,782 1,178 880 920
Fruit, 16,845 16,040 308 - - 343 -preserved, prepared
Cut flowers 14,206 12,028 35 1,599 - 122 140
Spices 9,378 4,536 1,415 189 2,003 - 954
Molasses 4,932 4,710 - - - 222 -Sub-total 163,601 143,209 3,597 37,682 3,181 1,567 2,014 of column
Source: assembled from UN Statistical Office data.
These data show that Morocco's access to the European Union market is of primary importance - the EU is the destination of over 70 percent of Moroccan agricultural exports. Other important markets are the United States, other parts of Europe, Japan, and to a lesser extent, Canada and the Middle East and Africa.
Morocco is classified as a developing country and therefore has access to preferential tariff rates under GSP programs for many products that it exports to the EU, United States, and other OEeD countries. Morocco is not a member of the Lome convention, but it -does have its own
C-l
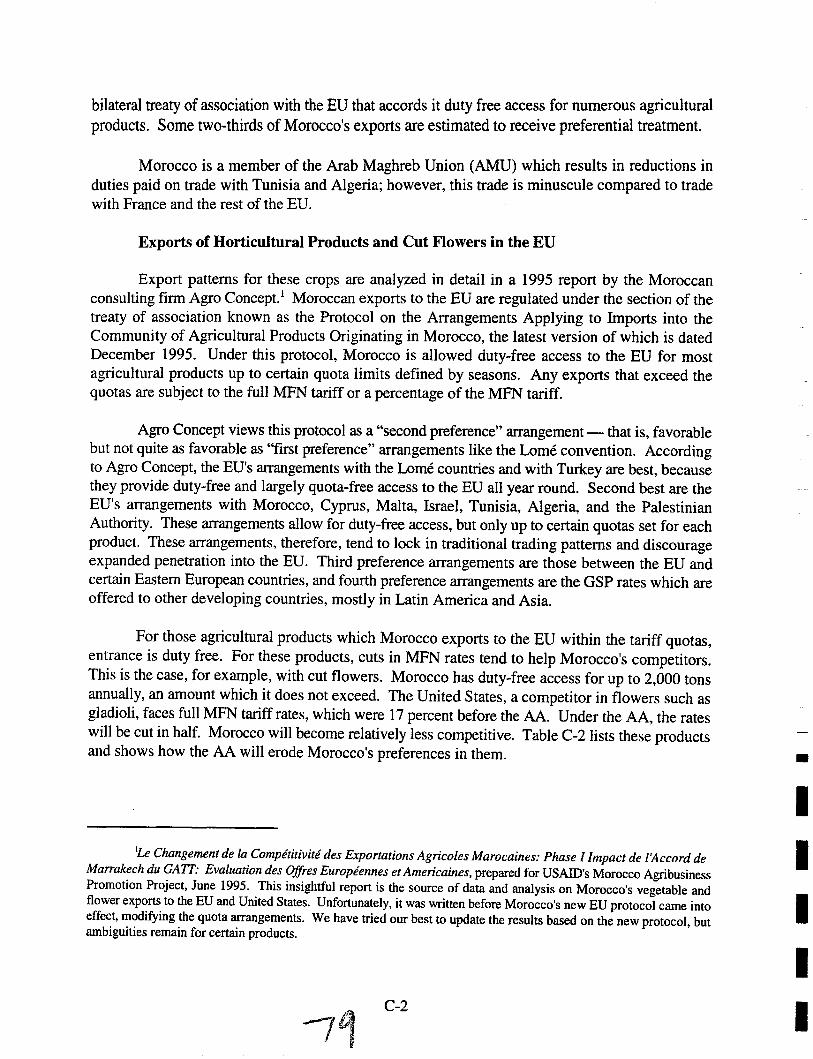
bilateral treaty of association with the EU that accords it duty free access for numerous agricultural products. Some two-thirds of Morocco's exports are estimated to receive preferential treatment.
Morocco is a member of the Arab Maghreb Union (AMU) which results in reductions in duties paid on trade with Tunisia and Algeria; however, this trade is minuscule compared to trade with France and the rest of the EU.
Exports of Horticultural Products and Cut Flowers in the EU
Export patterns for these crops are analyzed in detail in a 1995 report by the Moroccan consulting firm Agro Concept.I Moroccan exports to the EU are regulated under the section of the treaty of association known as the Protocol on the Arrangements Applying to Imports into the Community of Agricultural Products Originating in Morocco, the latest version of which is dated December 1995. Under this protocol, Morocco is allowed duty-free access to the EU for most agricultural products up to certain quota limits defined by seasons. Any exports that exceed the quotas are subject to the full MFN tariff or a percentage of the MFN tariff.
Agro Concept views this protocol as a "second preference" arrangement - that is, favorable but not quite as favorable as "first preference" arrangements like the Lome convention. According to Agro Concept, the EO's arrangements with the Lome countries and with Turkey are best, because they provide duty~free and largely quota-free access to the ED all year round. Second best are the EO's arrangements with Morocco, Cyprus, Malta, Israel, Tunisia, Algeria, and the Palestinian Authority. These arrangements allow for duty-free access, but only up to certain quotas set for each product. These arrangements, therefore, tend to lock in traditional trading patterns and discourage expanded penetration into the EU. Third preference arrangements are those between the EU and certain Eastern European countries, and fourth preference arrangements are the asp rates which are offered to other developing countries, mostly in Latin America and Asia.
For those agricultural products which Morocco exports to the EU within the tariff quotas, entrance is duty free. For these products, cuts in MFN rates tend to help Morocco's competitors. This is the case, for example, with cut flowers. Morocco has duty-free access for up to 2,000 tons annually, an amount which it does not exceed. The United States, a competitor in flowers such as gladioli, faces full MFN tariff rates, which were 17 percent before the AA. Under the AA, the rates will be cut in half. Morocco will become relatively less competitive. Table C-2lists these products and shows how the AA will erode Morocco's preferences in them.
'Le Changement de la Compititivite des Exportations Agricoles Marocaines: Phase I Impact de I 'Accord de Marrakech du GATT: Evaluation des Offres Europeennes et Americaines, prepared for USAID's Morocco Agribusiness Promotion Project, June 1995. This insightful report is the source of data and analysis on Morocco's vegetable and flower exports to the EU and United States. Unfortunately, it was written before Morocco's new EU protocol came into effect, modifying the quota arrangements. We have tried our best to update the results based on the new protocol, but ambiguities remain for certain products.
C~2
• I I I I I

I I I I I I I I I I I I I I
Table C-2: Preference Erosion Caused by AA on Moroccan Exports to the ED on Selected Products
Product Tariff quota Volume of Morocco's MFN tariff Competitors that (# oftons that exports to the EU in reduction in gain relative to Morocco can tons (1992) percentage Morocco
export duty-free) points
Canned green beans 13,200 3,485 4.6 China
Apricots (large 16,250 2,796 3.4 South Africa, packets only) US
Apricots with sugar 8,800 8,117 4.8 S. Africa
Frozen green beans 6,000 6,237 3.6 Poland, US, Hungary
Non-white wines 6,000 982 2.4 Australia, US, Chile
Winter asparagus no limit from 321 5.8 US, Poland Nov-Feb Mexico,
S. Africa
Frozen artichokes part of quota for 53 3.6 China, Chile, all vegetables Egypt
Winter strawberries no limit from 1,607 2.8 Columbia, Nov-Apr Mexico, US
Cut Flowers 3,600 2,000 8.5 U.S., S. Africa (Oct-May)
Melons no limit from 2,154 2.2 Brazil, Nov-May S. Africa
Source: modIfied from Agro Concept, 1995, the December 1995 ED-Morocco Protocol, and Amendment as publIshed in Official Journal of the European Communities, No. L326, 1995.
For another group of agricultural products, Morocco does not enjoy duty-free access to the ED; instead it faces full MFN or an above-zero GSP rate. This is the case, for example, with dried tomatoes, for which Morocco faces the MFN rate of 16 percent. This rate will be cut under the AA to 12.8 percent to Morocco's advantage. The cut will make Morocco more competitive relative to Turkey, which is a major dried tomato supplier to the EU and has duty free access. Table C-3 lists these products and shows how the AA will improve Morocco's competitive position vis-a-vis countries with better preferential arrangements.
C-3
Table C-3: Tariffs Reduced by AA on Moroccan Exports to the EU on Selected Products
Product Tariff faced by MFN tariff Quantity of Competitors that Morocco before reduction in Moroccan exports lose relative to
AA percentage points to EU (tons) Morocco
Dried tomatoes 16% 3.2 253 Turkey
Tomato juice 21% 4.2 13 Israel
Pickles * 22% 4.4 6,050 Turkey, Hungary
Late potatoes 21% 7.6 355 Turkey, Malta, (May-June) Cyprus
Summer 16% 3.2 418 Poland strawberries
Apricots, small 24% 4.8 285 -I packets, sugared * Morocco's first 3,200 tons enter duty-free, but the extra amount competes agaInst duty-free Turkey. Source: modified from Agro Concept, 1995, the 1995 EU-Morocco Protocol, and Amendment as published in Official lournal ofthe European Communities, No. L326, 1995.
For certain products, such as pickles, Morocco tends to exceed its duty-free quotas, thereby incurring the higher MFN rate. Cuts in the MFN tariffs agreed to in the AA will help Morocco for the portion of these exports that exceed the quotas and hurt for the duty-free portion. For other products, such as sugared apricots, Morocco and its competitors face the same tariff and will benefit equally from the AA-induced cuts.
For a third set of products, the AA will not affect Morocco's competitive position. Morocco has duty free access to the EU for fresh green beans, for example, as do all of its competitors (Burkina Faso, Senegal, Ethiopia, etc.) The MFN tariff cut, therefore, will not affect any of Europe's current suppliers. The same is true for tomatoes, one of Morocco's main horticultural exports. Virtually all of the EO's foreign suppliers of tomatoes are Mediterranean countries with duty-free access who will be unaffected by the AA. The situation for spring potatoes is similar; Morocco's main competitor is Egypt which also has duty-free access.
It is also important to note that the EU uses a separate tariff-like tax called the VFI (Valeur Forfaitaire a ['Importation) which functions as a type of variable levy tied to a "minimum price" set by the EO. The system results in additional taxes on several agricultural products that Morocco exports to Europe: fresh tomatoes, cucumbers, artichokes, clementines, squashes. Although the VFI contradicts the spirit of the Uruguay Round and increases taxes on imports, it is not disciplined by the Agricultural Agreement. The VFI continues to bedevil all foreign suppliers of these products to the EU.
C-4
I I I I I

I I I I I I I I I I I I I I
Aside from tariff reductions, the EU committed to reduce its subsidized exports of a few horticultural products of interest to Morocco. Most of these reductions are too small to have an impact on world prices. However, subsidies of olive oil exports will be reduced from 81 million ECU in 1995 to 55 million in 2000, and this may improve Morocco's position in small markets outside the EU.
Overall, Agro Concept concludes that the number of Moroccan exports that lose ground in Europe because of the AA is greater than those that gain. Of the products studied, the losers represent 74 percent of the total export value and the winners 26 percent. Once the effects of the latest Morocco-EU association protocol are taken into account, the number of products that lose is even larger. The negative effects, however, are much less dramatic than they appear at first glance, because many of Morocco's most important horticultural exports - tomatoes, potatoes, fresh beans - will not be affected by the agreement. Several of these are hurt more by the VFI than by traditional tariffs.
Exports of Horticultural Products and Cut Flowers in the United States
The AA will lead to changes in United States tariffs on these products, affecting Morocco in different ways.
• For some products, Morocco faces the full MFN tariff rate in the United States (for example for roses). Morocco benefits when these rates are reduced in compliance with the AA (they are scheduled to fall from 8.0 percent to 6.8 percent). Competitors who have preferential rates (for example Andean Pact members) will see their tariff preferences eroded on these products.
• For other products, Morocco has preferential rates because of the American GSP program, while its competitors face full MFN rates. For these products, cuts in the MFN rates erode Morocco's preference. Such is the case of fresh tomatoes, for which Morocco faces no duty while the Netherlands faces a tariff of 4.6 cents per kilogram (¢lkg). Because ofthe AA, this rate will fall to 3.9 ¢lkg, eroding Morocco's advantage. For the past year, the GSP has been suspended in the US, which changes this analysis; however, the program was expected to be reinstated by the end of 1996.
Agro Concept summarizes the effects of the AA on vegetables, prepared fruits, and cut flowers into the U.S. Table C-4. The first column lists the products and the second lists the corresponding MFN tariff cuts committed by the United States in the AA. The cuts are expressed in percentage points (e.g., for roses the rate falls from 8 percent to 6.8 percent - 1.2 percentage points). The third column indicates whether or not the MFN cut helps Morocco or erodes Morocco's preference. In cases were Morocco is helped, column four lists its competitors whose preferences are eroded. In cases where Morocco is hurt, column five lists its competitors who gain in competitiveness.
C-5

Table C-4: Anticipated Effects of AA on Moroccan Exports to the United States of Certain Products
Product MFNtariff Effect of reduction reduction on
in Morocco's percentage competitive-
points ness
Dried tomatoes 4.3 helps
Preserved apricots 5.2 helps
Tomatoes without 2.0 helps vinegar
Miniature carnations 0.8 helps
Roses 1.2 helps
Standard carnations 0.8 helps
Vacuum packed 2.2 helps tomatoes
Tomatoes otherwise 2.2 helps packed
Preserved olives 3.0 Hurts
Cucumber in 2.4 hurts vinegar
Cucumber for 4.3 hurts industrial use
Fresh tomatoes 0.5 hurts
Fresh cucumber 2.5 hurts
Frozen strawberry 2.8 hurts (small packages)
Frozen strawberry 2.8 hurts (large packages)
Dried apricots 0.2 hurts ..
fa = nummal amounts, but expected to develop III future. Source: modified from Agro Concept, 1995.
C-6
Competitors that Competitors lose that gain
competitiveness relative to relative to Morocco Morocco
- -Israel -Israel, -Dominican Rep.
Columbia -Columbia -
Columbia -Israel -
Israel -
- Spain
- France, Poland Germany
- Greece
- Netherlands
- Spain
- Poland
- Poland
- South Africa
Value of Morocco's exports to the U.S. in
$US
7.669,000
274,000
96,000
69,000
19,000
minimal fa
minimal fa
minimal fa
9,000,000
333,000
24,000
minimal fa
minimal fa
minimal fa
minimal fa
minimal fa
I I I I I
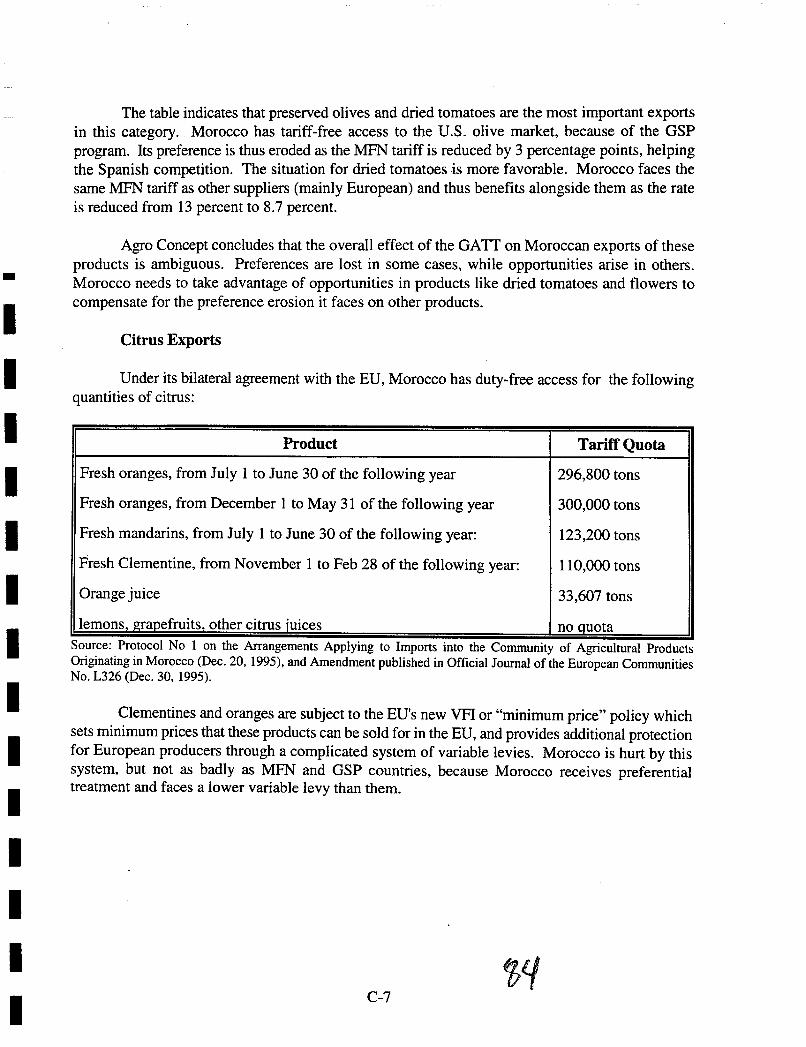
-I I I I I I I I I I I I I I
The table indicates that preserved olives and dried tomatoes are the most important exports in this category. Morocco has tariff-free access to the U.S. olive market, because of the GSP program. Its preference is thus eroded as the MFN tariff is reduced by 3 percentage points, helping the Spanish competition. The situation for dried tomatoes is more favorable. Morocco faces the same MFN tariff as other suppliers (mainly European) and thus benefits alongside them as the rate is reduced from 13 percent to 8.7 percent.
Agro Concept concludes that the overall effect of the GAIT on Moroccan exports of these products is ambiguous. Preferences are lost in some cases, while opportunities arise in others. Morocco needs to take advantage of opportunities in products like dried tomatoes and flowers to compensate for the preference erosion it faces on other products.
Citrus Exports
Under its bilateral agreement with the EU, Morocco has duty-free access for the following quantities of citrus:
Product Tariff Quota
Fresh oranges, from July 1 to June 30 of the following year 296,800 tons
Fresh oranges, from December 1 to May 31 of the following year 300,000 tons
Fresh mandarins, from July 1 to June 30 of the following year: 123,200 tons
Fresh Clementine, from November 1 to Feb 28 of the following year: 110,000 tons
Orange juice 33,607 tons
lemons, grapefruits, other citrusiuices no Quota Source: Protocol No 1 on the Arrangements Applying to Imports into the Community of Agricultural Products Originating in Morocco (Dec. 20, 1995), and Amendment published in Official Journal of the European Communities No. L326 (Dec. 30, 1995).
Clementines and oranges are subject to the EU's new VFI or "minimum price" policy which sets minimum prices that these products can be sold for in the EU, and provides additional protection for European producers through a complicated system of variable levies. Morocco is hurt by this system, but not as badly as MFN and GSP countries, because Morocco receives preferential treatment and faces a lower variable levy than them.
C-7

In the AA, the ED agreed to make the following changes (not simplifications) in its complex citrus tariff system:
Product Base rate of duty Bound rate of duty for 2000
For MFN Countries: Fresh Oranges:
From April 1-30 13% + 89 ECUrr 10.4% + 71 Ecurr
From May 1-15 From 6% + 89 ECUff 4.8% + 71 ECUff
May 16-31 4% + 89 ECUff 3.2% + 71 ECUff From June I-Oct. 15 4% 3.2% From Oct. 16-Nov. 30 20% 16% From Dec. I-Mar. 31 20% + 89 ECUrr 16% + 71 ECUrr
Fresh Mandarins 20% 16%
Fresh Clementines 20% + 132 ECUrr 16% +106 ECUrr
For asp countries: Fresh Mandarins May 15-Sep 15 16%+ current specific ECUrr rate
Clementines from May 15-Sep 15 16%+ current specific Ecurr rate
For Least Developed Countries: Fresh Mandarins May 15-Sep 15 zero duty Clementines from May 15-Sep 15 zero duty Tangerines from Mav 15-Sep 15 zero dutv
Source: ED schedule to the AA, CouncIl regulatIon of applymg generalized tariff preference for 1991 in respect of certain agricultural products originating in developing countries.
The ED's largest external suppliers of oranges, mandarins, and cIementines and their preferential statuses are presented in Table C-S.
~r;~ C-8
-I I I I I
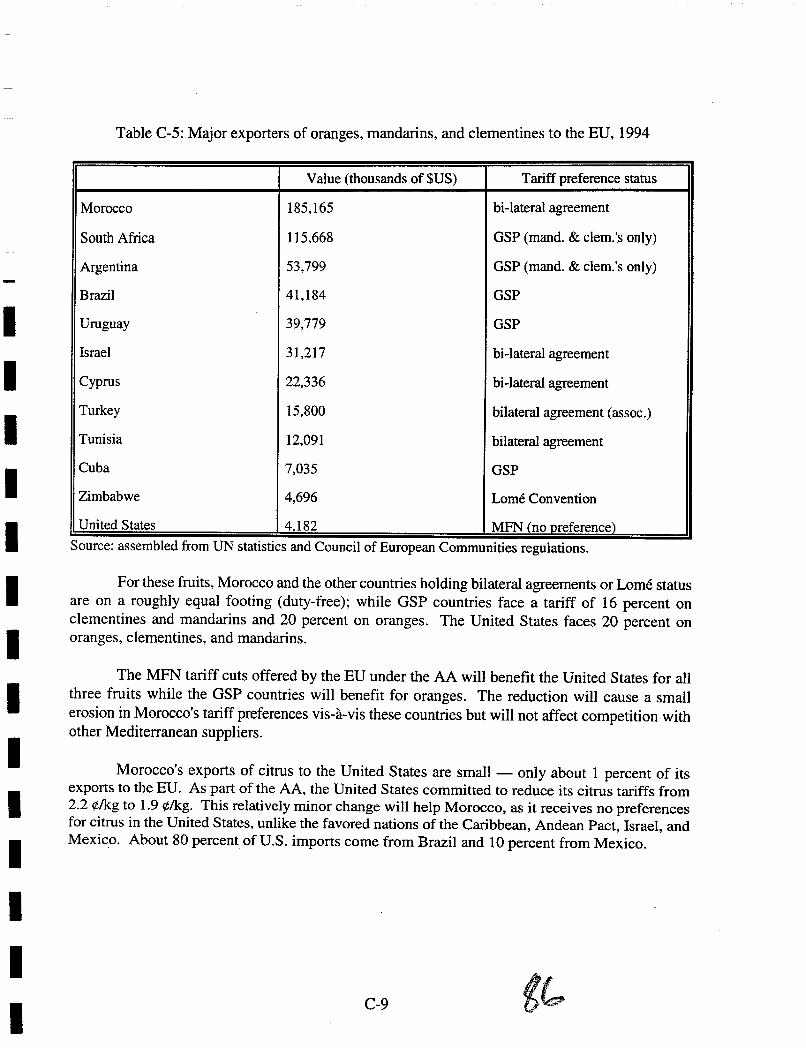
I I I I I I I I I I I I I I
Table C-5: Major exporters of oranges, mandarins, and clementines to the EU, 1994
Value (thousands of$US) Tariff preference status
Morocco 185,165 bi-Iateral agreement
South Africa 115,668 asp (mand. & clem.'s only)
Argentina 53,799 asp (mand. & c1em.'s only)
Brazil 41,184 GSP
Uruguay 39,779 GSP
Israel 31,217 bi-Iateral agreement
Cyprus 22,336 bi-Iateral agreement
Turkey 15,800 bilateral agreement (assoc.)
Tunisia 12,091 bilateral agreement
Cuba 7,035 GSP
Zimbabwe 4,696 Lome Convention
United States 4182 MFN (no preference)
Source: assembled from UN statistIcs and Council of European Communities regulatIons.
For these fruits, Morocco and the other countries holding bilateral agreements or Lome status are on a roughly equal footing (duty-free); while GSP countries face a tariff of 16 percent on cIementines and mandarins and 20 percent on oranges. The United States faces 20 percent on oranges, cIementines, and mandarins.
The MFN tariff cuts offered by the EU under the AA will benefit the United States for all three fruits while the GSP countries will benefit for oranges. The reduction will cause a small erosion in Morocco's tariff preferences vis-a-vis these countries but will not affect competition with other Mediterranean suppliers.
Morocco's exports of citrus to the United States are small - only about 1 percent of its exports to the EU. As part of the AA, the United States committed to reduce its citrus tariffs from 2.2 ¢lkg to 1.9 ¢lkg. This relatively minor change will help Morocco, as it receives no preferences for citrus in the United States, unlike the favored nations of the Caribbean, Andean Pact, Israel, and Mexico. About 80 percent of U.S. imports come from Brazil and 10 percent from Mexico.
C-9

Fish Exports
Most of Morocco's fish exports go to the EU ($87 million), to the United States ($16 million), and to other parts of Africa and the Middle East. Sardines account for about 75 percent of catches and are canned for export. Also important are tuna, mackerel, crustaceans, white fish, and
anchovies.
Fish is not part of the Agricultural Agreement per se, because it was treated within the market access and natural resources negotiating groups, but it is considered an agricultural product by many
countries.
Fish Exports to the EU
The ED's major outside fish suppliers are Norway, Iceland, Thailand, the US, Morocco, Canada, Greenland, and Argentina. In 1994, Morocco exported more fish to the EU than Canada, and more than any other African country.
Morocco is granted preferential treatment in its exports of fish under its bilateral arrangement with the EU. It can export duty-free, unlimited quantities of the following species:
• Caviar, crab, shrimps and prawns, lobster, other crustaceans, mussels, other molluscs; and
• Fresh or prepared or preserved: Salmon, herring, tuna, skipjack and bonito, mackerel, anchovies, salmonidae, fish of the genus euthymnus, fish of the species orcynopsis unicoI or.
For sardines, Morocco has duty-free access up to a quota limit of 19,500 tons in 1996, to be expanded to 22,500 by 1998.
This duty-free access gives Morocco a considerable advantage compared to those countries that must face MFN or GSP rates. This advantage is eroded as those rates are reduced under the Uruguay Round agreement. The reductions, however, are relatively small and protection remains relatively high. Average MFN rates fall from 14 percent to 12 percent, while average GSP rates of 10.6 percent will remain largely the same.
Morocco has no advantage vis-it-vis the LOme Convention countries or the Least Developed Countries, because they, like Morocco, have duty-free access to the EU for fish.
Fish Exports to the United States
Morocco has access to the GSP program in the United States which offers a zero duty on many, but not all, fish species. On many species, the United States charges zero duty for all suppliers. On most species, America's privileged partners face no duty, i.e., Mexico, Canada, Israel, and the Caribbean and Andean countries. Average tariffs were only 1.4 percent prior to the UR and
C-lO
• I I I I I

I I I I I I I I I I I I I I
are scheduled to fall to 1.2 percent. Because the cuts are small and so many suppliers face zero duty, there is little threat of genuine preference erosion for Morocco.
On a small number of products, the MFN tariff cuts may hurt Morocco (e.g., preference erosion on dogfish) and on a small number they may help (e.g., Morocco faces less MFN on haddock fillets). Overall, American cuts in fish tariffs were minimal and the effects on Morocco are also expected to be minimal.
Fish Exports to Other Africa and Middle East
Morocco's substantial exports to these destinations are unlikely to be significantly affected by the Uruguay Round, because most of these countries set ceiling tariffs in the Round that do not affect the actual tariffs they charge.
Molasses Exports
Practically all of Morocco's molasses exports go to the EU. No tariff preferences for molasses appear in the bilateral arrangement with the EU or in the ED's asp program. Therefore, it appears that Morocco benefits from the cut in the MFN tariff rate appearing in the ED's schedule to the Agricultural Agreement. This cuts the tariff from 0.44 ECU/lOO kg. to 0.35 ECU/lOO kg.
C-ll

Moroccan Agricultural Imports
Table C-6 lists Morocco's major agricultural imports:
Table C-6: Morocco's Major Agricultural Imports by Source, 1993 (thousands of $US)
Total From From From From From From From From theEU the US Canada Argen- Brazil other Tunisia Asia
tina Latin and Amer. Turkey
Wheat, 361,92 84,404 277,053 465 - - - - -unmilled 3
Barley, 67,305 43,938 11,018 11,298 - - - 1,049 -unmilled
Maize, 46,388 879 38,947 - 6,401 - - - -unmilled
Vegetables 38,823 16,858 77 3,543 2,064 - - 4,687 8,335
Sugar 96,573 636 - - - 69,51 26,12 - -2 0
Animal, 140,91 53,680 32,090 - 23,237 19,22 - 3,293 5,022 vegetable 3 4 oils, fats
Sub-totals 751,92 200,34 359,185 15,306 31,702 88,73 26,12 9,029 13,357 5 5 6 0
Source: assembled from UN Stanstlcal Office data.
With over $700 million in imported foodstuffs, Morocco is highly dependent on imported foods and therefore imported food prices. The AA has the potential to affect Morocco's imports in three related ways:
• By reducing the availability of subsidized foods offered directly to Morocco;
• By leading to increases in world prices for foods, as a result of reduced export subsidization and reduced internal subsidies in DEeD countries; and
• By reducing the availability of food aid because of reductions in surplus government stocks in DECD countries.
We have already explored in Part I of this report the reasons why we consider these possibilities to be unlikely, at least in the short-term. In sum:
C-12
I I I I I
I I I I I I I I I I I I I I
• The domestic support reduction commitments in the AA are very weak and therefore unlikely to trigger cuts in DECD internal subsidies that go beyond the cuts that had already been carried out or had been planned before the AA was signed;
• The export subsidy reduction commitments in the AA are timid, and world markets have shifted so much since the signing of the AA that the export subsidy reductions are essentially irrelevant at this time for most crops. Neither the United States nor the EU is subsidizing grain exports now because world prices are already high. Currently, Morocco cannot buy subsidized grains from these sources; and
• It therefore is unlikely that the AA is having any effect on the size of government stocks, the availability of subsidized grains, or world prices for grains at this time. Current prices are high for reasons other than the AA (droughts, Chinese purchases, etc.).
This situation is unlikely to change for the next few years. World markets are predicted to remain relatively tight and food prices high. Thus, the AA commitments to reduce export subsidies will remain irrelevant. Eventually, this situation may change, prices may fall, and DECD countries may expand their export subsidization again. At that time, the AA may begin to constrain subsidization to some degree and thereby affect prices.
If such a situation develops and the AA begins to affect prices, the Agreement will clearly be costly to Morocco. In 1995, the FAD predicted that the Agreement would cause a 7 percent increase in international wheat prices by the year 2000. This prediction has lost some credibility because it does not take into account the irrelevancy of the AA in 1996. However, if the prediction were to come true, the AA could increase Morocco's annual wheat import bill by $13 million, assuming half of its purchases are on the world market. Similarly, if FAD predictions prove true about the AA causing a 7 percent barley price increase, Morocco's annual bill for this crop might also rise by $2-4 million annually. Reductions in Brazilian and U.S. subsidized vegetable oil exports could also lead to higher prices or reduced availability for Morocco.
These numbers are highly speculative at the moment. For now, it is safe to say that the AA is having little impact on food prices. In the future, when and if the AA's rules on export subsidies become relevant, they are likely to have a negative effect on Morocco's food import bills.
During the next round of WTD agricultural negotiations, DECD countries are likely to make further progress in reducing both export subsidization and domestic subsidization. Cheap subsidized food is likely to become less and less available for countries like Morocco.
Effects of the AA on Moroccan Agricultural Trade Policies
Under the AA, Morocco agreed to the following measures:
• Tariffication of its non-tariff barriers on many agricultural products;
C-13

• Minimum access quotas for these products, upon which reduced tariff quotas will apply to ensure entry of minimum quantities;
• Reductions in its base tariff levels by 24 percent by 2004, through progressive annual reductions; and
• A progressive reduction it its Aggregate Measure of Support from a base of 790 million dirhams to 685 dirhams by 2004.
Morocco carried out tariffication both before and after signing the UR Final Act. However, in the case of major food imports, significantly higher base tariff equivalents than actual pre-UR levels were established in Morocco - so called "dirty tariffication."
Wheat is an example. Morocco's protection of wheat was about 14 percent during the base period of 1986-88, but for purposes of negotiation, the government set its hard wheat base tariff well above this at 224 percent (estimates by Ingco, 1994). Morocco agreed to cut its base rate to 170 percent by 2004, but this ceiling rate remains meaningless because it is well above the levels actually charged today. The commitments therefore result in no real liberalization. This is also true for coarse grains (1986-88 protection of 8 percent but base set at 150 percent) and sugar (1986-88 protection of 58 percent but base set at 221 percent).
The tariff bindings for all basic foodstuffs are very high. Over 24 percent of agricultural tariff lines are bound at rates equal to or greater than 100 percent. Bound rates for meat are 380 percent.
Morocco agreed to minimum access commitments for a number of these sensitive food products. For example, it will allow 204,000 tons of maize to enter at a reduced tariff of 122 percent (or lower if necessary to reach the minimum amount). It will allow 1.5 million tons of wheat in at a reduced tariff quota rate of 144 percent.
The 24 percent reduction in tariff levels on non-sensitive food products such as vegetables may lead to reduced domestic prices in some cases and slightly increased imports. Morocco's commitments in terms of lowering its AMS are unlikely to be binding.
In January 1996, the WTO conducted its second Trade Policy Review (TPR) of Morocco's trade policies. The Trade Policy Review Body praised Morocco's efforts to liberalize its economy but made the folJowing criticisms regarding agriculture:
•
•
•
There have been delays in the implementation of agricultural tariffication. Quantitative restrictions (licences) are still in force for edible oils, sugar, and cereals;
Questions remain about Morocco's use of import licencing, prior declaration requirements, and sanitary and phytosanitary controls;
High agricultural tariffs continue to restrict trade;
C-14
I I I I I I
I I I I I I I I I I I I I I
• The tariff structure remains complex, and the additional levy called Prelevement Fiscal a l'lmportation (PFI) further increases real tariff levels; and
• Imports of certain agricultural products are potentially subject to a variable levy tied to an internally set reference price (Law 13-89).
In response, the Moroccan government stated that it was committed to agricultural liberalization as part of its overall structural adjustment program. It cited the following areas of progress:
• Import licensing is being phased out for sugar, vegetable oils, cereals and their derivatives. Tariff equivalents will replace licensing for these products by the end of 1996;
• Agricultural tariff equivalents had been calculated in accordance with the relevant WTO provisions, and these were being applied on meat and dairy products;
• Sugar imports are being de-monopolized and oilseed processing is being liberalized.
• A new tariff system was initiated in January 1996 that reduces the number of different tariff rates from thirteen to six; and
• The variable levy established by Law 13-89 has never been applied and will not be in the future, subject to the introduction of tariff equivalents.
Although the WTO has little real leverage to make Morocco fulfill its commitments under the Uruguay Round agreements, the TPR report indicates that the WTO has engaged in a frank dialogue with Morocco about its trade policies, and that it is intent on using transparency, moral suasion, and peer pressure to promote trade liberalization. The WTO's efforts will complement those ofthe World Bank and IMF as they also work with Morocco to liberalize its economy.
Summary and Conclusion
Morocco's preferential access to the EU and the United States means that the cuts in MFN tariff rates that are at the heart of the Agricultural Agreement are in most cases irrelevant or preference-eroding for Morocco's agricultural exports. Only in a limited number of cases where Morocco has no preference (e.g., dried tomatoes, molasses) do these tariff cuts favor Morocco. Morocco should benefit, however, by the global income effects of the UR agreement, which can be expected to lead to increased demand for all agricultural exports.
Compared to the AA, the association protocol between Morocco and the EU is much more important for Moroccan agriculture, because of the duty-free access it affords for key products such as tomatoes, green beans, potatoes, cut flowers, citrus, and fish. Over 70 percent of Moroccan
C-15
agricultural exports go to the EU, and the duty-free access is essential for competitiveness. Morocco has a huge stake in maintaining this preferential access.
Commitments to reduce export subsidies by OECD countries have the potential to increase the prices Morocco pays for its food imports, particularly wheat. For the moment, however, these commitments are irrelevant because export subsidies are not currently being used. The AA, therefore, is not affecting the price of Morocco's food imports.
This situation may change two or more years into the future, and export subsidy constraints may become constraining at that time. If this happens, the AA will begin to have an effect on prices. The FAD predicts that this effect could raise the price of wheat by 7 percent by the year 2000, which might increase Morocco's wheat import bill by $13 million or more annually. Morocco should prepare itself for a future of higher food prices, because future WTO negotiations are likely to put more limits on export subsidization.
The Uruguay Round agreements and the WTO have influenced Moroccan trade policy for the better, by encouraging tariffication, tariff reduction, and simplification. The WTO does not have the authority to enforce Morocco's compliance with the AA or any UR agreements, but it does have the power to bring pressure through its Trade Policy Review mechanism. In combination with the efforts of the IMF and World Bank, the WTO is likely to help Morocco as it moves its trade policy in the direction of liberalization.
C-16
I I I I I I
I I I I I I I I I I I I I I
ANNEXD SOUTH AFRICA CASE STUDY 1
The Agricultural Agreement of the Uruguay Round will affect the tariffs faced by South Africa's exports, the price of the food it imports, and, to a certain degree, its agricultural trade policies.
South African Agricultural Exports
South Africa is by far the largest and economically strongest member of the Southern African Customs Union (SACU) which includes Botswana, Lesotho, Namibia, and Swaziland. Most trade statistics are published with the SACU countries grouped together. SACD's major agricultural exports, which totaled over $1.7 billion in 1993, are summarized in Table D-1.
These data show that South Africa's access to the European Union market is of primary importance; the EU is the destination of about two thirds of Southern African exports. The Japanese market is also important, as are the markets of the US, Saudi Arabia, Bahrain, Switzerland, Hong Kong, Zimbabwe, Angola, and Mozambique.
The Republic of South Africa was a founding member of the GATT in 1948 and was treated as an industrialized country during the Uruguay Round. It is required to follow the rules applying to industrial countries, not developing countries, on issues such as timing of agricultural tariff cuts and reductions in export subsidies. In one sense this is fair because part of South African agriculture is modem, mechanized, and highly productive. In another sense it is not, because a large part of South African agriculture - the black sector of the former "homelands" - is highly underdeveloped, similar to agriculture in the poorest African countries.
Since the fall of apartheid, South Africa has attempted to gain some of the preferential trade advantages granted to other African countries, such as the Lome Convention, by stressing the underdeveloped nature of its traditional agricultural sector. These efforts, however, have been only partially successful. In 1995, the European Union turned down South Africa's petition for full membership in the Lome Convention, offering instead to negotiate a free trade agreement that would benefit Europe as much as South Africa. The EU stipulated that several of South Africa's agricultural exports, however, would have to be excluded from such a free trade agreement. These
1 We would like to thank Roland Pearson, Executive Director of Ebony Development Alternatives (Pty) Ltd., of Johannesburg, South Africa, and associates for their collection of trade statistics and documentation, and conducting interviews with key informants in the GOSA.
D-l
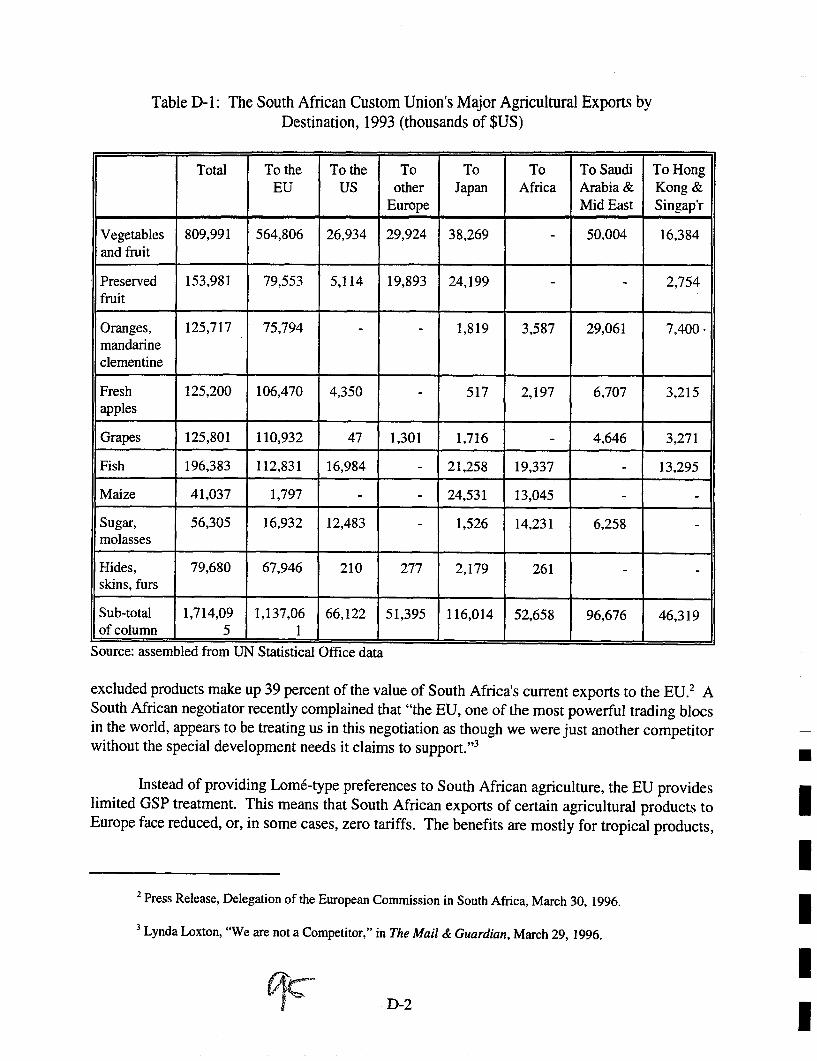
Table D-l: The South African Custom Union's Major Agricultural Exports by Destination, 1993 (thousands of SUS)
Total To the To the To To To To Saudi EU US other Japan Africa Arabia &
Europe Mid East
Vegetables 809,991 564,806 26,934 29,924 38,269 - 50,004 and fruit
. Preserved 153,981 79.553 5,114 19,893 24,199 - -fruit
Oranges, 125,717 75,794 - - 1,819 3,587 29,061 mandarine clementine
Fresh 125,200 106,470 4,350 - 517 2,197 6,707 apples
Grapes 125,801 110,932 47 1,301 1,716 - 4,646
Fish 196,383 112,831 16,984 - 21,258 19,337 -Maize 41,037 1,797 - - 24,531 13,045 -Sugar, 56,305 16,932 12,483 - 1,526 14,231 6,258 molasses
Hides, 79,680 67,946 210 277 2,179 261 -skins, furs
Sub-total 1,714,09 1,137,06 66,122 51,395 116,014 52,658 96,676 of column 5 1
Source: assembled from UN Statistical Office data
To Hong Kong & Singap'r
16,384
2,754
7,400·
3,215
3,271
13,295
-
-
-
46,319
excluded products make up 39 percent of the value of South Africa's current exports to the EU.2 A South African negotiator recently complained that "the EU, one of the most powerful trading blocs in the world, appears to be treating us in this negotiation as though we were just another competitor without the special development needs it claims to support.,,3
Instead of providing Lome-type preferences to South African agriculture, the EU provides limited GSP treatment. This means that South African exports of certain agricultural products to Europe face reduced, or, in some cases, zero tariffs. The benefits are mostly for tropical products,
2 Press Release, Delegation of the European Commission in South Africa, March 30, 1996.
3 Lynda Loxton, "We are not a Competitor," in The Mail & Guardian, March 29,1996.
D-2
• I I I I I
I I I I I I I I I I I I I I I
with temperate crops largely excluded. Overall, the preferences are slim, especially when compared to preferences in the Lome Convention or Mediterranean country agreements.
In the United States and Japan, South African products also receive GSP treatment for some but not all agricultural products.
Vegetables and Fruits to the EU
Because of its reverse seasons, South Africa is well suited to supply Europe with vegetables and fruits during Europe's winter months. South Africa is one of the EUs largest outside suppliers. In 1993, South Africa sent $809 million worth of vegetables and fruits to the EU, with fruit being the major revenue earner. Two-thirds of all fruit production in South Africa is for export, and export marketing is a virtual monopoly of a private marketing board called Universal Frutrade Cooperative.
A small portion of South Africa's vegetables and fruits benefit from the EUs GSP program, and thereby are subject to reduced tariffs (although many of these reduced rates are over 10 percent). This includes products such as okra, sweet potatoes, and pineapple juice. Other products must pay full MFN rates, either because they do not figure in the EUs GSP program (e.g., broccoli, oranges), or because the products have been specifically excluded from South Africa's GSP eligible list (e.g., cucumbers, asparagus).
For those few vegetables that are GSP eligible, the MFN tariff cuts committed by the EU in the Uruguay Round will lead to preference erosion for South Africa. This is the case, for example, of sweet potatoes (South Africa is exempt from duty). Under the AA, the MFN tariff rate for sweet potatoes will fall from 6 percent to 3.8 percent, causing preference erosion.
More commonly, South African vegetable exports are subject to full MFN duties. In these cases, the EUs tariff cuts will benefit South Africa. These cuts range from 20 percent to 36 percent, depending on the product. The tariff on eggplants, for example, is scheduled to fall from 16 percent to 12.8 percent; on asparagus it should fall from 16 percent to 10.2 percent.
For fruit, the situation is similar to vegetables. A few varieties enter the EU at GSP rates, but most must pay full MFN rates; therefore, most will benefit from the AA tariff cuts. However, it is important to note that apples, oranges, clementines, and grapes are subject to the EUs "minimum price" policy which acts like a variable levy to protect EU producers. The associated levy - the VFI (Valeur Forfaitaire a l'Importation) - is not affected by the Agricultural Agreement, even though it represents a major obstacle to trade in these products.
In 1993, SACU exported $106 million worth of apples to the EU. Under the Uruguay Round, the EUs average tariff on apples will fall from 9.3 percent with a fixed charge of 297 ECUrr to 7.5 percent with a fixed charge of238 ECUff. This reduction will benefit South Africa as well as other major suppliers, such as the US, New Zealand, Argentina, and Chile.
D-3

In 1993, SACU exported $111 million worth of grapes to the EU. Under the Uruguay Round, the ED's average tariff on grapes will fall from 16.6 percent to 12.5 percent. This reduction wi11 benefit South Africa as well as other major suppliers, such as the United States.
SACD's exports of oranges, mandarins, and clementines to the EU were worth $76 million in 1993. For oranges, South Africa will benefit from the ED's cuts in its MFN tariff rates. These will fall from an average of 11.2 percent plus a fixed charge of 89 ECUrr to 8.9 percent plus a fixed charge of 71 ECUrr. This reduction should slightly improve South Africa's competitive position vis-a-vis the Mediterranean countries, such as Morocco and Israel, that have duty-free access for
their oranges into the ED.
For mandarins and clementines, South Africa is eligible for the current GSP tariff rate of 16 percent. EU commitments to reduce the MFN rates on these fruits from 20 percent to 16 percent will have virtually no affect on South Africa or any suppliers to the EU because virtually all suppliers benefit from GSP or superior preference arrangements.
Vegetables and Fruits to the United States
South Africa has access to GSP preferential rates for most vegetables exported to the United States. These are almost always duty-free. For these vegetables, MFN tariff cuts do not help South Africa. Nor do they, in most cases, help South Africa's competitors, because most of them also enjoy duty-free entry for these products.
The United States does not offer GSP preferences on a few vegetables, such as tomatoes, celery, spinach, and miniature carrots. South Africa would benefit from MFN cuts on these products. Under the AA, the United States committed to cuts ranging from 15-100 percent, averaging about 36 percent. The celery tariff, for example, will fall from 17.5 percent to 14.9 percent. These cuts will increase South Africa's competitiveness vis-a-vis more preferred partners such as Mexico and Israel.
For fresh fruit, apples are South Africa's largest export to the US. Over $20 million worth of apples were sent in 1995. There is no tariff on apples from any source, therefore AA tariff cuts are irrelevant. For preserved fruit, South Africa generally haS duty free access under the GSP, and therefore will not benefit from the moderate MFN tariff cuts the United States is scheduled to implement in this sector.
Overall, South Africa's vegetables and fruits generally benefit from duty-free entry in the United States and therefore have nothing to gain from the AA. However. the GSP program expires in May 1997. and its future is uncertain. During this time, South Africa will be helped by the MFN tariff cuts.
D-4
I I I I I I

I I I I I I I I I I I I I I I
Vegetables and Fruits to Japan and Other Destinations
The Japanese GSP program does not cover the fresh fruits or vegetables of highest commercial interest to South Africa. Therefore, fruit exports to Japan will benefit from Japan's substantial MFN tariff cuts. Average rates on oranges are scheduled to fall from 40 percent to 24 percent. Rates on mandarins and clementines will fall from 26.6 percent to 17 percent; rates on fresh grapes will fall from 13 percent to 7.8 percent, and rates on apples will fall from 20 percent to 17
percent.
The Japanese asp program covers about half of the processed and preserved fruits and vegetables exported by South Africa to Japan. MFN tariff cuts, therefore, will have a mixed impact on South Africa on these line items. Japan has committed to reduce its average tariff rate on these products from 16.29 to 13.3 percent4• On many preserved and processed fruit products (e.g., marmalades) tariffs will be reduced by 40 percent, and for most juices tariffs will fall 36 percent. The cuts will help in some cases but lead to preference erosion in others. In those cases where there is preference erosion, it is mitigated by the fact that the GSP rates generally represent only small discounts from normal tariff rates.
South Africa sent $36 million worth of fruit and vegetables to Saudi Arabia in 1993 and $13 million to Bahrain, mainly oranges. These countries are not WTO members and therefore made no tariff reductions under the AA. Exports to Singapore and Hong Kong are also not significantly affected, because their tariffs on these products are already zero or very low.
Fish
SACU exports almost $200 million worth of fish annually, with over half destined for the EU ($113 million). Other important markets are Japan ($21 million), the United States ($17 million), other parts of Africa, and Hong Kong.
Fish to the EU
The EUs major outside fish suppliers are Norway, Iceland, Thailand, the US, Morocco, Canada, Greenland, and Argentina. In 1994, South Africa was the EUs eleventh largest source of imports.
Under the GSP, South Africa faces reduced tariffs on many of its fish exports to the EU, such as shark, frozen halibut, lobsters, prawns, canned crab, and canned mackerel. For these products, the asp rate averages 10.6 percent compared to an MFN rate of 14 percent. The EUs asp program, however, does not cover many fish species or products. For these items, South Africa faces full MFN rates. This category includes a large number of line items, such as fresh herring, frozen
4Ingco, 1994, in Hathaway and Ingco, 1995, p. 38.
D-5
herring, sardines, haddock, fresh mackerel, frozen mackerel, tuna, frozen tuna, canned tuna, and
frozen herring.
As a result of this mixed picture, South Mrica will be affected in a mixed manner by the EU's reductions in MFN rates. Under the UR, the EU is committed to reduce its MFN rates from an average of 14 percent to 12 percent. For those products for which South Africa pays full MFN (the majority), these reductions will be helpful. For those products for which South Africa pays GSP rates, the reductions will cause minor preference erosion for South Africa and other GSP countries in relation to MFN suppliers like the United States and Canada.
Overall, the anticipated effects are positive but very small. The average tariff South Africa faces on fish exports to the EU will fall from an average of 12.9 percent to 11.2 percent.s
Fish to the United States
South Mrica has access to the GSP program in the United States which offers a zero duty on a large number, but not all, fish species. However, this preference is not strong, because:
• On many species, the United States charges zero or very low tariffs for all suppliers; and
• On most species, America's privileged partners pay zero duty, i.e., Mexico, Canada, Israel, and the Caribbean and Andean countries.
Because so many suppliers pay zero duty, the DR cuts in U.S. tariff rates pose little threat of genuine preference erosion for South Mrica. The average U.S. tariff on fish is only 1.4 percent and it will fall to 1.2 percent over the next six years. On a few products there will be minor preference erosion, and on other (MFN) products there will be minor gains. The net effect will be minimal on South Mrica. The average tariff it faces on the species that it exports will fall from 0.4 percent to 0.1 percent.
Fish to Other African Countries and the Far East
South Africa's exports of fish to Japan will benefit from Japan's tariff cuts. Unlike the EU and the US, Japan made meaningful cuts in the fish sector, reducing tariffs on most products by 30 percent. Average tariff rates on the fish that South Africa exports will fall from 3.2 to 1.3 percent. The benefits of Japan's GSP are limited to only a few preserved fish products; therefore, prefence erosion is small relative to the gains expected from the MFN tariff cuts.
Morocco's substantial exports to Africa and middle-income Asia are unlikely to be significantly affected by the Uruguay Round. Most African countries set ceiling tariffs in the Round
5 Fish tariff calculations from Amjadi et aI., 1996.
D-6
I I I I I I

I I I I I I I I I I I I I I
that do not affect the actual tariffs they charge, and tariff rates in Hong Kong and Singapore were already very low before the DR.
Maize
Over 75 percent of South African grain production is maize, and throughout the 1970s and 1980s the country was an important net exporter of maize to markets in Europe, Japan, and Africa (Angola, Mozambique, Mauritius, etc). In the early 1990s the country suffered drought and exports fell to the point that South Africa became a net importer. However, in 1994 South African productivity recovered and the country became an important net exporter again. Indeed, exports in 1994 were eight times higher than those of 1993. This is demonstrated in Table D-2.
Table D-2: South African Maize Exports by Major Trading Partners (in tons)
1992 1993 1994
EU 2,014 4,232 4,369
Japan 274,770 198,937 1,702,487
Zimbabwe 4,705 2,021 138
Source: South African Department of Agriculture.
Since 1992, Japan has consistently been South Africa's biggest client for maize. Japan imposes no tariff on raw maize and therefore there are no reductions under the AA. Japan has committed to reduce tariffs on certain maize products, such as maize oil (from 10 yen/kg to 5 yenlkg), maize flour (25 percent to 21.3 percent), and maize meal (25 percent to 21.3 percent). This may be of some benefit to South Africa in the future.
The EU is committed to lowering its maize tariff from 147 ECU/ton to 94 ECU/ton, with the actual rate applied varying under these ceilings. The final bound rate of 94 ECU is still a very high tariff, but the reduction may help South Africa if it continues to export maize to the EU. asp does not apply to this crop.
In 1994, South Africa exported $75 million worth of maize to Kenya, a promlsmg development. Kenya set a ceiling tariff of 100 percent in the AA but its applied rate is much lower, roughly 15 percent. Because African countries like Kenya tended to set their tariff ceilings way above actually applied rates, it is unlikely that the 'AA will help South Africa expand maize exports in Mrica. Opportunities exist, but not because of the Uruguay Round. South Africa has a bilateral trade agreement with Zimbabwe which operates independently of the GATTIWTO.
The AA will affect South Africa's use of export subsidies to promote its maize exports. In the 1970s and 1980s the official Maize Board used such subsidies for surplus disposal. Under the Agricultural Agreement, South Africa is committed to reduce its subsidized maize exports by 21
D-7 100

percent. In 1995, South Africa agreed not to subsidize more than 1,827 tons of maize. By 2000 the South African bound limit will be 1,495 tons (Ingco, 1995).
The FAO predicts that the Uruguay Round will cause a 4 percent increase in maize prices by the year 2000 (FAO, 1995). Goldin and van der Mensbrugghe predict than the UR wil1 raise maize prices by 2.3 percent. These effects will mainly be driven by export subsidy reductions committed by the EU, Canada, Mexico, and the United States. These subsidy reductions will reduce the amount of subsidized maize on world markets by 4.8 million tons by the year 2000. This wiII help South Africa in two ways: by increasing world prices, and by decreasing the amount of subsidized competition on world markets.
Hides and Skins
SACU exported $79 million worth of hides and skins in 1993, with 85 percent going to the EU and the rest going to a wide variety of destinations. The WTO reports that the average trade weighted tariff on raw hides and skins was only 0.1 percent prior to the UR and therefore there was virtually no room for further cuts.
Cuts were made, however, on processed hides and skins, thereby reducing tariff escalation and helping exporters like South Africa. The WTO data is reprinted in Table D-3.
Table D-3: Change in Tariff Escalation in Hides and Skins
Weighted average tariff rates
Pre-UR(%) Post UR (%) Reduction
Raw hides and skins 0.1 0.1 0
Semi-manufactured 4.6 3.6 22%
Finished product 8.7 7.0 20%
Total 5.2 4.1 21%
Source: GATT, 1994 In OD! 1994.
D-8
I I I I I I

I I I I I I I I I I I I I I
South African Agricultural Imports
Table D-4lists the South African Custom Union's major agricultural imports:
Animal, vegetable oils, fats
Wheat, unmilled
Maize, unmilled
Rice
Vegetable & fruit
Animal feed stuff
Meat
Sub-totals
Table D-4: South Africa Custom Union's major agricultural imports by source, 1993 (thousands of $US)
Total From From From From From From From theEU the US Canada Argen- Mal- Aus- Zim-
tina & aysia tralia babwe Chile
158,894 28,111 6,162 - 33,495 58,777 13,990 -
145,395 13,173 84,935 41,255 1,243 - - -
103,240 1,603 85,808 - 4,935 - - 5,322
99,444 3,279 36,212 - - - 272
61,473 9,739 6,467 4,499 - - 1,570 1,869
56,587 4,348 1,350 - 25,704 - - 11,311
44,693 26,268 1,285 1,132 11,256 421
669,726 86,521 222,219 46,886 65,377 58,777 27,088 18,923
Source: assembled from UN StatIstical Office data.
From Thai-land and
China
-
-
4,037
57,564
15,724
-
1,042
78,367
South Africa is mostly self sufficient in food and generally a net exporter. From 1985 to 1990, average wheat exports exceeded imports by 335 thousand tons and average maize exports exceeded imports by 1.2 million tons.6 South Africa, however, imports significant quantities of cereals in drought years such as 1992/93 and always imports animal and vegetable oils. South Africa's imports will be influenced by the Agricultural Agreement in two ways. First, the agreement requires changes in import tariffs and guaranteed minimum access. Second, it is expected to influence the prices of foods that South Africa imports.
6 World Bank, "South African Agriculture: Structure, Performance and Options for the Future," Discussion Paper 6, 1994, p. 87.
D-9

Influences on Import Tariffs and Access
From 1937 to 1990, South Africa strictly controlled imports through quantitative controls while pursuing a policy of national self sufficiency in agriculture. Agricultural development was heavily influenced by government intervention, which seriously limited or eliminated foreign competition. Tariffs played a minor role compared to quotas and licensing requirements.
Since 1990, the government's policy has changed and the movement has been away from heavy intervention and towards liberalization and tariffication. The Uruguay Round played a role in supporting these changes. The government Green Paper on Customs Tariff Policy states:
Owing to a change in the approach to agricultural policy and the Uruguay Round of multilateral negotiations, South Africa adopted the policy that quantitative import control on agricultural products should be eliminated and where necessary, replaced by customs tariffs. As a result of the policy change, a large-scale conversion of import control to customs duties, or so-called tariffication, started in 1994 and it is expected to be completed in 1996.7
Tariffication itself should not significantly effect the quantity of foods South Mrica imports, because the resulting tariffs are designed to provide protection equivalent to that provided by the quotas they replace. Cuts in the new tariffs, however, should result in more openness to imports. South Africa committed to cut its agricultural tariffs by an average of 36 percent under the Agricultural Agreement, over a six year period. But in its schedule to the AA, South Mrica declared high base levels from which its cuts would be made. As a result, the final bound tariff rates rarely are below the actual tariffs that South Africa applies at this time. The commitments therefore will not trigger real liberalization of imports, as Table D-5 demonstrates.
7 Government of South Africa, "Green paper on Customs Tariff Policy with Regard to Agricultural Products," 1996.
103 D-lO
I I I I I I

I I I I I I I I I I I I I I I
Table D-5: South African Tariff Reduction Commitments and Actual Tariffs Applied, Selected Agricultural Products
Declared base rate of Bound rate of duty set Actual tariffs applied duty for 1986-88 for the year 2000 in 1996
Coconut or Palm Oil 163 81 zero
Olive Oils 163 81 30
Other fixed vegetable 163 81 25 fats and oils
Durum wheat 29 21 zero
Other wheat 120 72 zero
Maize 68 50 zero
Sorghum 45 33 zero
Molasses 124 68 zero
Coffee, unroasted 140 119 free
Tea 200 170 zero-25%
Fresh tomatoes 50 37 15
Citrus 50 37 35 Source: South African schedule to AA, lacobsens Customs and EXCise Tanff Book.
South Africa was required by the AA to guarantee imports of minimum amounts of 44 products that it heavily restricted through quotas and licensing prior to 1990. For these products, South Africa set tariff quotas -low tariff rates for the specified minimum quantities to ensure their import. For maize, a minimum access commitment was set at 269,000 tons (year 2000). For wheat, the minimum was set at 108,279 tons; for milk powder 4,479 tons; for vegetable oils 61,083 tons; and for groundnuts 7,908 tons.
In many cases, these minimum access commitments have become irrelevant because South Africa has already cut its tariff on the product (e.g., zero maize tariff) and is already importing more than the minimum amount. In other cases, the commitments should create openings for new imports. Or, if conditions change and South Africa decides to raise tariffs on products such as maize, the minimum access commitments may become relevant again and actually trigger imports.
South Africa maintains a type of variable levy on four food import categories: vegetable oils, maize, sugar, and wheat and wheat flour. The system is currently under review and may be phased out. Variable levies are illegal under the GATT; however, they escape discipline in many cases.
D-ll

South Africa says that these levies are intended "to facilitate the adjustment of these industries to deregulation and a market situation where competition from imported products is a reality."s
Influences on Import Prices
The AA is expected to influence the prices of some of the foods that South Africa imports. In 1995, the FAO predicted that the Agreement would cause a 7 percent increase in international wheat prices by the year 2000. Goldin and van der Mensbrugghe (1995) also predict price impacts on foods South Africa imports. Using average tariff protection in the 1991-93 period as their baseline for comparison, they predict that the AA wil1 have the following price impacts by the year 2002:
• Wheat +3.8% • Rice -0.9% • Coarse grains +2.3% • Beef and veal +0.6% • Edible oils -0.3%
These price increases, if realized, will cause a moderate increase in South Africa's food import bill in years during which it is a net grain importer, and a very minor increase in South Africa's total import bill. There are good reasons to believe, however, that the predicted impacts are overstated. One of their underlying assumptions is that the AA will result in United States and EU cuts in subsidized exports which will drive up world prices; but, as discussed in Part I, the AA has not caused U.S. or EU cuts in export subsidies - these were cut for independent reasons. For now, it is safe to say that the AA is having little impact on food prices. In the future, when and if the AA's rules on export subsidies become more binding, they may have a mildly negative effect on South Africa's import bills for crops like wheat. They may also make it more difficult for South Africa to import subsidized grains and vegetable oils.
Summary and Conclusions
Overall, it is likely that the AA will have a small positive impact on South African agriculture. Compared to other African countries, South Africa is eligible for relatively few preferential tariffs. Therefore, the MFN tariff cuts negotiated in the AA lead to little preference erosion and occasionally help South African exports. The help is not dramatic, however, because many of the fruits and vegetables South Africa exports to the EU are protected through the ED's "minimum price" policy, which was not affected by the AA; and fruit exports to the United States generally were tariff-free before the AA. Fish exports are also only minimally impacted, because the tariff cuts generally were very small in this sector. Future negotiating rounds should lead to more meaningful tariff cuts.
8 Goverrunent of South Africa, "Green Paper on Customs Tariff Policy with Regard to Agricultural Products," 1996.
D-12
• I I I I I I

I I I I I I I I I I I I I I
For maize, the AA may lead to reduced subsidies and slightly higher world prices, which will help South Africa in those years it is a net exporter, as it was in 1994. The Deputy Director-General of South Africa's Department of Trade and Industry explains how the AA may help his country's exports of products like maize:
South Africa simply does not have the resources to subsidize agriculture to the same extent as some of our competitors. It is therefore of vital importance that the playing field be leveled, in order for South Africa to reap the full benefit from its agricultural exports.9
For food crops that South Africa imports in large quantities during drought years, such as wheat, less subsidization and higher world food prices may increase South Africa's import bill. This impact will not be of a serious magnitude, and South Africa, in good years, is a net exporter or nearly self-sufficient in many of these crops. The government believes that with its present structure, South African agriculture will be able to provide for the food and nutritional requirements of the country's growing population until at least the year 2010.10
In terms of policy, the AA has played an important role in supporting reform in South Africa. After 1990, the country took steps away from the heavy government interventionism of the past and towards liberalization of its agricultural trade regime. The AA reinforced those steps by requiring an end to quantitative restrictions, tariffication, and reductions in the use of export subsidies. The agreement does not require much actual tariff reduction, but it sets the groundwork for more significant cuts in the future. The AA also has been the impetus for reform and regularization of procedures to apply countervailing duties in limited circumstances. Further reform is necessary but the WTO should be able to help through tools such as the Trade Policy Review Mechanism.
In 1993 the Department of Trade and Industry recognized the synergy between the UR process and the country's own reform efforts:
It is important to note that tariff liberalization could therefore be considered from two viewpoints, i.e. the Uruguay Round as well as the Normative Economic Model. Fortunately, the two initiatives run parallel to each other and in the same direction so that ultimately they ought to coincide. II
The seriousness with which South Africa views the Agricultural Agreement is evidenced by a recent decision to have the Department of Agriculture open a representative office near the WTO in Geneva.
90.1.1. Breyl, ''The Viewpoint of the Government on the GATT and the Political and Economic Implications Thereof on the Country and Agriculture," MVSA Joernaal1993.
]0 Department of Agriculture, Government of South Africa, "White Paper on Agriculture," 1995.
11 G.J.J. Breyl. 1993.
D-13

I I I I I I I I I I I I I I
ANNEXE COTE D'IVOlRE CASE STUDY'
The Agricultural Agreement of the Uruguay Round will affect the tariffs faced by Cote d'Ivoire's exports, its competitive position on world markets, the price of the food it imports, and, to a certain degree, its agricultural policies.
Cote d'Ivoire's Agricultural Exports
Cote d'Ivoire (Cn remains an agricultural exporting powerhouse (Table E-l). For 1994, its major exports accounted for $1.3 billion, which was over five times greater than its agricultural imports of $236 during the same time period. Ivorian agricultural exports in the 1960s and 1970s, along with massive cutting and exporting of the country's extensive tropical forest resources, were at the basis of the much vaunted "Ivorian economic miracle." However, when forest resources were largely depleted and world coffee and cocoa collapsed for 8 or 9 years, beginning in the mid-1980s, the miracle evaporated.
Table E-l : Value of Cote d'Ivoire Agricultural Exports, by destination, 1994 ($US mill)2
EU USA Asia Other Other Total Percent Commodity Africa
Cocoa beans 678 52 -- -- 46 776 58%
Cocoa Butter 23 12 5 -- 33 73 6%
Green Coffee 103 6 -- 4 31 144 11%
Instant Coffee 40 -- -- 10 9 59 4%
Pineapple 112 -- -- -- 112 9%
Rubber 42 10 -- -- 52 104 8%
Bananas 56 -- -- 3 59 4%
Total Exports 1054 80 5 14 174 1,327 100 %
Percents ----» 80% 6% (0.4 %) 1% 13% ]00 %
Source: GOCIIMIDlStry of Commerce, 1996.
I We would like to thank Ms. Assiata Camara of ClRES in Abidjan for collecting the trade data for this case study and a set of relevant documentation.
2 Due to data being unavailable. Table E-l does not include the value of CI palm oil exports which have been in the range of $90 to $100 million per year in recent years and are projected by FAO to increase slowly over the next 5 to 6 years.
E-l IV?

Similar to most other African countries, these exports are highly concentrated in terms of both the small number of commodities exported and the number of importing countries. For example, fully 64 percent of total agricultural exports was made up of cocoa beans and cocoa butter, and 83 percent of these cocoa exports went to seven countries in the EU. Next in importance is coffee exports, at 15 percent of total, followed by pineapples at 9 percent.
The EU is clearly CI's dominant destination for agricultural exports, absorbing 80 percent of the total. No less than 40 percent of any commodity exported goes to the EU as well. Agricultural exports are so robust in CI that most CGE trade reform impact models show the country gaining modestly over the trade situation that would have prevailed without the agreement - a contrast to the anticipated losses in other African countries.
Cocoa and Coffee Exports and Prospects
Over the 1987-89 period, CI cocoa exports made up a third of the world total. Eighty percent of world cocoa consumption is in developed countries. The EU alone absorbs 40 percent of world cocoa exports. Thus the future of the country's cocoa production and export possibilities are vital to the overall economy, at least in the medium term.
Under the Uruguay AA there will be some preference erosion as European MFN tariffs are lowered and African cocoa will face more direct competition from both Latin American and Asian sources. The following are the reductions which vary by type of cocoa product:
Cocoa beans (raw or roasted): Cocoa pastes Cocoa butter Cocoa powder
Pre-AA Tariff
3.0% 15.0% 12.0% 16.0%
Bound Tariff
free 9.6% 7.7% 8.0%
Trade forecasters have anticipated that reduced import tariffs in developed countries under the AA will stimulate cocoa production, exports, and consumption in developing countries. Most of the projected increases in imports will be in Europe and North America. For example, FAa's projection of the CI share of world cocoa exports in the year 2000 without the URi AA was about 30 percent of the world total. The projection for 2000 with the AA is a slightly smaller percentage share (-0.12 percent less of the world total) but somewhat bigger in absolute quantity of exports, going from 715,000 to 731,000 tons due to a greater projected increase in overall world demand. Thus, lower tariffs lead to higher growth in demand for cocoa and higher levels of exports at fairly stable price levels.
However, as we have seen in other case studies, factors other than the AA can have an even bigger effect on the country's revenues from a key export crop. In the shorter run, world price fluctuations can be very large. It was fortunate for CI that in 1994, the year in which the CF A franc was devalued and made exports more competitive, there was also a substantial recovery in world
E-2
I I I I I I I

I I I I I I I I I I I I I I
cocoa and coffee prices. In the longer run African cocoa producing countries will have to be concerned about increasingly competitive production in Southeast Asia and Latin America gaining even more market share through productivity gains and better scientific research.
Cocoa and coffee exports and pricing in CI are still heavily controlled by the state. Elaborate state price stabilization schemes (supported to some degree by the ACP ST ABEX Fund) have had two effects: (1) they have siphoned off substantial subsector revenues as indirect taxes on production; and (2) inadequate price incentives have often been given to farmers to maintain or increase the quantity and quality of their output. When coffee and cocoa prices plummeted in the mid-1980s some of the heavy involuntary taxes were reduced in order to try and maintain real prices to producers. However, when prices finally returned to high levels in 1994, the state reimposed export taxes, saying that it needed these revenues to help organize small farmer producers so that they could help themselves. Such anti-liberal dirigiste policy risks undermining lvorian export success in a freer and more competitive world trading environment. GOCI efforts to protect farmers from the negative effects of low world commodity prices are understandable. However, new systems of price risk reduction need to be put in place that are more under the direct control of farmers, that give them more individual choice in what risk management tools to use, and which are not disguised excessive government taxes.
Coffee Exports
As has been pointed out in the Kenya and Malawi case studies, developed countries are the biggest coffee importers and their tariffs on coffee, already low before the AA, would be further reduced under the AA. However, those reductions, in and of themselves, would have little effect on demand and prices for coffee in world trade. Other factors, such as overall economic growth, the relatively high level of per capita consumption already reached in developing countries, changes in tastes and preferences (in markets such as the United States there has been a dramatic increase in the demand for higher quality arabica coffees), and weather changes in producing countries, will do much more to shape the world coffee market in the 21 st century than trade liberalization induced by the Uruguay round.
North America, Europe and Japan account for 90 percent in world trade in coffee and tariffs are either already at zero (North America - all coffee; Japan - Green Coffee) or will be reduced substantially:
Pre-AA Post-AA Tariff Tariffs
EU: Green Coffee 5% Free by 2000 ED: Decaffeinated Green Coffee 13% 8.3 % ED: Roasted 15% 7.5 % EU: Roasted Decaffeinated 18% 9.0% Japan: Roasted 20% 12% by 2000
E-3

So, while there will be some preference erosion, it is anticipated that increased demand for coffee will allow for expansion of both production and exports from Cote d'Ivoire (increase of 5,000 tons per year projected by 2000 by FAO) with prices, ceteris paribus, being fairly constant.
One of the major variables that has not been discussed yet in our brief review of impacts on CI coffee production is the question of Arabica versus Robusta production. Since CI is mostly low elevation, its production is primarily Robusta coffee which is generally used in coffee blends or in lower quality processed (instant) coffees due to its very strong taste. The higher quality segment of the coffee market demands Arabica coffee where at least some of the marketed beans are sold as distinct varieties to consumers. One of the questions that a more detailed market analysis would have to address is what are the market prospects for these two, very different types of coffee. In addition, a third type of coffee tree (called the Arabusta - a cross between the two classic types) has been developed to produce a coffee with better Arabica quality characteristics but capable of being produced in lower altitude, hotter conditions. What role this new hybrid coffee will play in world markets is also an important question. Finally, there is instant coffee. Nestle has been producing instant coffee from Robusta in Abidjan for many years. This coffee dominates the local market in CI and is increasingly exported to neighboring countries in West Africa and to a few ED importers. This makes up the bulk of the "instant coffee" category in Table E-l. Additional detail on instant coffee export destinations and values for 1992-94 is in Table E-2. Instant coffee (although not a gourmet market product) is very interesting for CI since it represents capturing and selling substantial amounts of value-added. CI is also having some success in this area in pagne (African textile) production (see below in the agricultural imports section). For additional information on African coffee exports into the ED and other markets, see the Kenya case study above.
Pineapple, Rubber and Banana Exports
The level of exports of these three products all increased substantially over the 1989-1994 period for which we have trade data, as is shown in Table E-3. Pineapple and rubber seemed to have benefited the most from increased sales due to the devaluation of the CF A franc (pineapple up 180 percent and rubber up 136 percent from 1993 to 1994).
rlO E-4
I I I I I I I

I I I I I I I I I I I I I I
Table E-2: Cote d'Ivoire Exports of Instant .coffee, 1992-94 ($US millions)
Importers 1992 1993 1994
Benelux $32 $15 $20
Greece 1 3 20
Burkina 11 8 7
Niger 4 3 0
Mali 5 3 3
Other 12 11 9
Total $65 $43 $59
Source: GOO, Ministry of Commerce, 1996.
Table E-3: Cote d'Ivoire Exports of Pineapple, Banana, and Rubber, 1989-94 (in $US millions)
Crops 1989 1990 1991 1992 1993 1994
Pineapple 38 44 41 45 40 112
Rubber 57 59 52 25 44 104
Banana 21 23 36 53 65 59 Source: GOO, Mmistry of Commerce.
Banana exports (virtually all to France in 1994) are part of an interesting trade controversy which has been brewing for a number of years between the EU, the ACP banana exporters in Africa and the Caribbean, the United States, major fruit companies based in the United States, and the major banana producing countries in Central America. Under Lome IV the EU has been allowing the ACP bananas (and those from European dependencies such as Martinique (France), Guadalupe (France), Madeira (Portugal), and the Canary Islands (Spain) into the zone at zero tariff while those coming from other sources have been subject to both quotas and to a high fixed rate tariff of 850 ECU per ton on quantities above quota, which has served as an effective deterrent to non-ACP bananas. Under the AA this fixed rate tariff will be reduced to 650 ECU per ton, still a substantial barrier above the quota level. Quotas were set for ACP countries and overseas European dependencies to absorb virtually all the bananas they could produce (regardless of cost of production) as a means of providing economic assistance.
This very distortionary situation has been carefully analyzed by Borrell of the World Bank, who concludes that these measures oppose trends in world trade liberalization, support inefficient
E-5
banana producers, and represent a very costly and politically divisive way of providing development assistance.3
In April, 1997, the U.S. Trade Representative lodged an official complaint against this practice with the WTO. This was done in the name of the Central American banana producing countries, but recently the U.S. press has alleged that this was simply a favor to the head of one U.S.based fruit company, who had contributed very large sums to the President's reelection campaign. Regardless of motivation, this situation which has allowed relatively expensive bananas from the exEuropean colonies in the Caribbean to find a market in Europe (and become an important economic resource for some of the very small island republics) will undoubtedly continue to be a subject of trade negotiations in the future.
Whether CI bananas can continue to be competitive in Europe against strong Central American competition will depend on cost of production in CI and cost of shipping to the EU. According to available statistics, cost of Banana production in CI and Cameroon (both have large EU banana quotas) are over 0.4 ECU/kg versus the Latin American average of around 0.2 ECU/kg. These are substantially lower than production costs in the Canary Islands and Martinique/Guadalupe, all well over 0.5 ECUlkg, and Madeira at over 0.6 ECUlkg. It is clear that under free trade banana production, exports would disappear from these latter high-cost production zones. For CI, having always operated under the current EU or previous French bilateral preferential trade arrangements has sheltered this subsector from having to be competitive on world markets and lower its costs of production. There does not seem to be any inherent reason why the CI subsector could not become price competitive in world markets, except for the bad habit of living the easy life of the rentier, under the umbrella of the managed economy, an all too frequent vice across much of francophone Africa.
Virtually all of CI's agricultural exports have come from traditional plantation cash crops. It is quite likely that many of these will continue to remain viable for long into the future. However, it is also quite likely that CI will need to begin efforts to further diversify its agricultural exports, concentrating on a wide range of food crops to neighboring West Mrican states and additional higher value tropical horticultural projects to growing markets in developed countries.
Cote d'Ivoire's Agricultural Imports
CI's agricultural imports, totaling $263 million (Table E-4), are similar in magnitude of those of Senegal (see Annex F which follows), whose GNP per capita ($600/per capita) was fairly similar to that of CI in 1995 ($660/per capita). CI had agricultural imports equivalent to $19 per capita in 1994 while Senegal imported approximately $20 per capita. However, when these figures are examined more closely, we see bigger differences. While the agricultural imports in Table E-4 amount to $19 per capita in CI, food imports only amount to about $9.50 per capita while all of Senegal's $20 per capita is food.
3 Brent Borrell, "EU Bananarama III", Policy Research Working Paper No. 1386, World Bank, 1994.
\~E-6
I I I I I I I
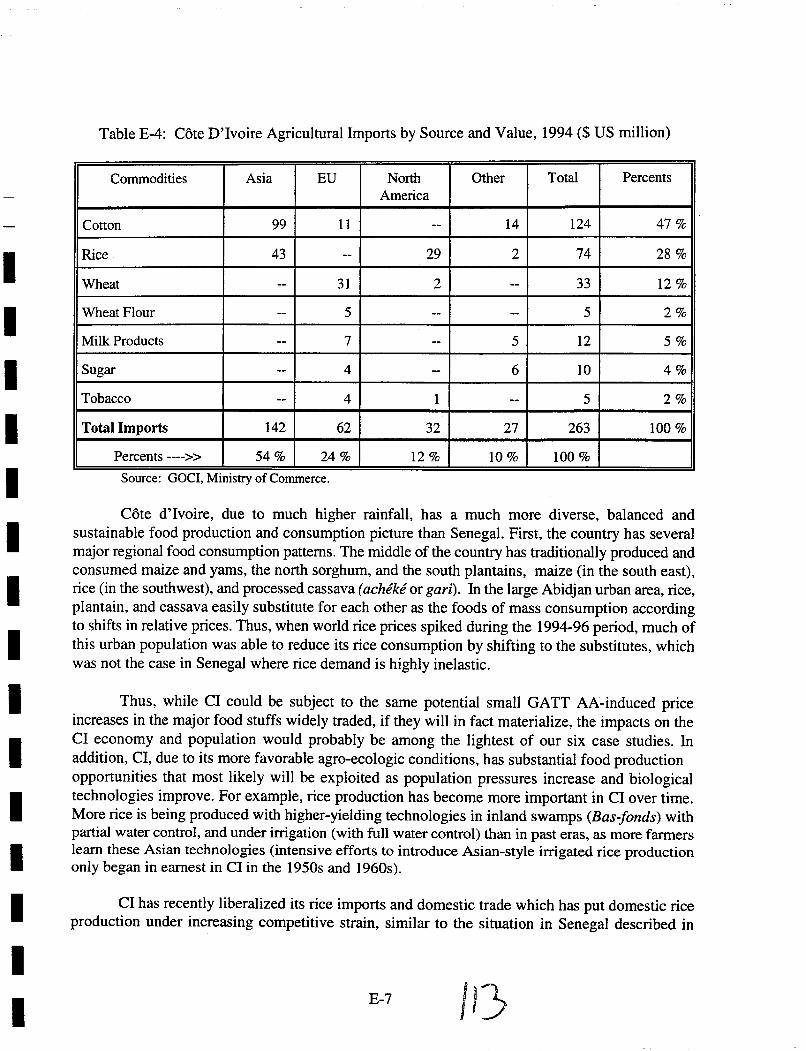
I I I I I I I I I I I I I I I
Table E-4: Cote D'Ivoire Agricultural Imports by Source and Value, 1994 ($ US million)
Commodities Asia EU North Other Total Percents America
Cotton 99 11 -- 14 124 47%
Rice 43 -- 29 2 74 28 %
Wheat -- 31 2 -- 33 12 %
Wheat Flour -- 5 -- -- 5 2%
Milk Products -- 7 -- 5 12 5%
Sugar -- 4 -- 6 10 4%
Tobacco -- 4 1 -- 5 2%
Total Imports 142 62 32 27 263 100 %
Percents ----» 54% 24% 12 % 10% 100 % ..
Source: GOCI, MInIstry of Commerce.
Cote d'Ivoire, due to much higher rainfall, has a much more diverse, balanced and sustainable food production and consumption picture than Senegal. First, the country has several major regional food consumption patterns. The middle of the country has traditionally produced and consumed maize and yams, the north sorghum, and the south plantains, maize (in the south east), rice (in the southwest), and processed cassava (acheke or gari). In the large Abidjan urban area, rice, plantain, and cassava easily substitute for each other as the foods of mass consumption according to shifts in relative prices. Thus, when world rice prices spiked during the 1994-96 period, much of this urban population was able to reduce its rice consumption by shifting to the substitutes, which was not the case in Senegal where rice demand is highly inelastic.
Thus, while CI could be subject to the same potential small GATT AA-induced price increases in the major food stuffs widely traded, if they will in fact materialize, the impacts on the CI economy and population would probably be among the lightest of our six case studies. In addition, CI, due to its more favorable agro-ecologic conditions, has substantial food production opportunities that most likely will be exploited as population pressures increase and biological technologies improve. For example, rice production has become more important in Clover time. More rice is being produced with higher-yielding technologies in inland swamps (Bas-fonds) with partial water control, and under irrigation (with full water control) than in past eras, as more farmers learn these Asian technologies (intensive efforts to introduce Asian-style irrigated rice production only began in earnest in CI in the 1950s and 1960s).
CI has recently liberalized its rice imports and domestic trade which has put domestic rice production under increasing competitive strain, similar to the situation in Senegal described in
E-7 /1)

Annex F which follows. However, due to the diversity of rice production technologies in CI, to well established consumer preference in CI for higher quality whole grain rice, and to the presence of more areas where irrigation or partial irrigation can be practiced at lower cost, the country has the potential to continue to provide a substantial portion of its own rice requirements on a nonsubsidized basis.
In addition to rice, it is quite like that larger-scale maize production will become more important in CI and other coastal West African countries. Recent work on the perfection of highyielding, streak-resistant maize varieties hold great potential for dramatically increasing maize production in CI. In fact, it is likely that hybrid maize that will compete with traditional rice production on the more fertile upper slopes of inland swamp areas. Finally, agricultural researchers also have been devoting more effort to the development of higher-yielding varieties of cassava which could substantially increase the output of this root crop and its processed products.
One of the most important and promising pieces of information in the Table E-4 import figures for CI, is the fact that 47 percent of 1994 imports were made up of cotton, mostly coming from Asian countries. This is due to the fact that, despite a relatively successful expansion of cotton production in CI by the CIDT (Compagnie Ivoirien de Fibres Textiles), the country does not have enough cotton fiber to meet the demands of its large Gonfreville textile facilities in Bouake. This is a tribute to the success of the Ivorian textile industry in producing both "waxed" (refers to the color dying process and the quality and fastness of the colors) and non-waxed cotton cloth that is widely sold in CI and in the other countries of West Africa. CI waxed pagnes4 due to their high quality have largely replaced the highly-prized Dutch wax cloth imported from Holland.
CI cotton imports are the kinds of agricultural imports all developing countries desire, where imported raw materials can be transformed to a higher value product which sells well both in the national market but also in neighboring countries. It is difficult to predict what the total impacts will be of the dismantling of the Multi-Fibre Agreement (MFA), also an important provision of the GAIT DR. In general, most analysts have completely written off any hope that African textiles or sown clothing will be at all competitive with the massive output of China and India and other Asian countries. However, it is possible that African textiles and West-African style sown clothing might be able, with the right organization and promotion, become an important source of significant export earnings for countries such as CI.
Impacts of the AA on Cote d'Ivoire's Agricultural Trade Policy
CI, as most African countries, was not greatly engaged in the GATT AA negotiations. As a developing country, it was not obligated to negotiate many significant trade concessions in the period leading to the UR agreement. The mainstream of its economic policy traditions, firmly rooted in French economic dirigisme, did not see trade liberalization as being that important to its economic
4 Pagne refers to a one meter length of cloth of standard width. In West Africa, cloth is often sold in 3 pagne sets which are used by women to make a outfit that consists of a long skirt or wrap, a sown top or shirt, and a third cloth which is often used for carrying a child on the back.
E-8
I I I I I I I I
I I I I I I I I I I I I I I I
future. Of equal importance is CI's growing power as a West African regional trading partner. The importance of Mrican countries in CI's external trade has doubled since 1975. On the trade policy front, CI's participation in efforts to create a free trade zone in the francophone countries of the West Mrican monetary union (UEMOA) has necessitated that a common tariff wall be envisioned which has required that agricultural tariffs be harmonized and "GATT-consistent."
As in most Mrican countries, the WTO has found that "little effort has been made in recent years to liberalize export policies~ administrative procedures could be substantially simplified, whereas the internal commercial environment continues to impede the development of the agricultural sector." 5 For example, the Ivorian tariff structure has been criticized as being overly complex with three separate import taxes being involved and the continued use of reference prices and alternative taxes adding to this complexity and lack of transparency.
Beyond the effects of overly complex and burdensome trade regulation, are other factors that are highly determinant of a country's competitive position. CI, like all the former French colonies, has policies and regulations in place which mean that businesses must pay excessively high prices for basic services such as transport, water, electricity, fuel, wholesale and retail distribution, commercial finance, insurance and so forth. In late 1995, the prices of 22 basic goods and services remain under tight administrative control.
As we argue in Part II of this paper, decontrol and regulatory simplification can go a long way toward providing a business environment that is more hospitable to increased domestic and foreign private sector investment. Further, analysts have noted that in CI there has been no explicit national government strategy for export promotion and a distinct lack of institutions capable of providing effective support to private exporters, particularly those of small and medium size. Parts of the CI government seem to recognize these deficiencies but it is hard to change the bad regulatory habits of the past overnight.
For agriculture, the GOCI, in order to take advantage of the opportunities of the newly more competitive and growing world markets, says that its trade development strategy consists of:
"consolidating traditional cash crop production, developing and diversifying non-traditional agricultural exports; the promotion of food crops and the development of agro-industries that can transform agricultural raw materials, and that can export semi-finished or finished goods.,,6
Summary and Conclusion
Agricultural exports have been the name of the game in CI. In the almost 40 years since independence, the government of CI has taken advantage of its natural resource wealth to contribute
5 WTO, 'Trade Policy Review of Cote d'Ivoire", Volume II (in French), Geneva, WTO, p. 52.
6 WTO, op. cit, page 59.
E-9 )p"

to the creation of a growing national economy. A limited number of agricultural exports, mostly produced by small farmers (coffee and cocoa), but marketed internationally by large state organizations, have figured heavily in this growth. A second wave of investment in planation agriculture (bananas, pineapples, rubber, and oil palm) added some diversification to this export base. When coffee and cocoa prices slumped on world markets for eight years, the entire economy went into stagnation, revealing the degree of its dependence on and vulnerability to international markets. During this period the Ivorian economy was highly managed and regulated, either for the benefit of state companies or for a small number of privileged European and Ivorian investors.
All other factors held constant, the UR AA is expected to have a slightly positive effect on the CI's agricultural trade. There are anticipated to be modest increases in the exports of coffee, cocoa, and palm oil at fairly stable price levels. Rubber and pineapple exports boomed in 1994 with a strong push from the CFA devaluation. There will be some preference erosion in all of these commodities but anticipated expansion in the size of the markets allows modest growth in traditional agricultural exports, as relative market share may decline with increased competition from exports from Latin America and Asia.
A few highly preferential market access arrangements (such as bananas to the EU) will not likely survive the next round of multilateral trade negotiations. This means that Ivorian industries will need to make substantial efforts to become more efficient and reduce their cost of production if they wish to survive in more lucrative developed country markets. Ivorian agricultural imports are relatively modest and the domestic "food economy" is highly diversified which gives it more capacity to easily absorb possible spikes in imported food prices.
In looking toward the future, the CI will need to diversify its agricultural production and exports and continue its efforts to export more processed goods from national agro-industries. The examples of the instant coffee and higher quality manufactured cotton cloth exports are highly encouraging and illustrate a model that should be emulated as the economy continues to grow and expand its position as a sub-regional "pOle de developpement." Given the basic strength of the economy, it is clearly one where much of future growth will depend on taking the recommended "medicine" of unilateral trade liberalization in order to get the services and goods, the inputs to expanded production, available to the widest range of entrepreneurs at prices that are as close to "world market levels" as is possible. That, plus continued investment in infrastructure and in an educated, and increasingly enfranchised, population, are the keys to continued progress for this country.
E-lO
I I I I I I I

I I I I I I I I I I I I I I I
ANNEXF SENEGAL CASE STUDyl
The Agricultural Agreement of the Uruguay Round will affect the tariffs faced by Senegal's exports, the price of the food it imports, and, to a certain degree, its agricultural trade policies.
Senegal's Agricultural Exports
As a Sahelian country with limited rainfall, Senegal's agricultural sector is composed of both rainfed production with limited surplus for export (except for peanuts) and some areas that can and are being irrigated and which might be suitable for expanded horticultural production. Senegal has by far the smallest agricultural exports of any of our case study countries ($155 million in 1994), as shown in Table F-l.
The table also reveals a pattern of agricultural exports that is highly concentrated in terms of the number of products exported and the number of trade partners. We note that 58 percent of Senegal's agricultural exports in 1994 involved peanuts (Senegal's traditional cash crop). Another quarter of export earnings come from fish and seafood, and 13 percent from cotton. Theses three products alone make up 97 percent of total agricultural exports.
The pattern of exports is also concentrated in terms of destinations with over three quarters going to the countries of the European Union, and much of that to France. Asian destinations (mostly for fish and cotton) make up 12.4 percent, while other African countries (including North Africa) account for a surprisingly small 3.4 percent of Senegal's agricultural exports. Thus, much depends on how Senegal's relative position for these products is maintained vis-a-vis the European market, and to the extent there is preference erosion in those traditional markets whether other regional markets can be developed to allow for maintenance or growth in export levels.
Peanuts, Peanut Oil, and Peanut Cake Exports
In 1994, peanut oil was the most important agricultural export with $64 million in value (f.o.b.) recorded by the GOS Ministry of Commerce. Virtually all of Senegal's peanut oil was shipped to the EU by SONACOS, a GOS-owned company, with monopoly export rights. In 1994, Senegal was by far the largest exporter of peanut oil into the EU with a 44 percent share of the import market (once internal transfers among EU countries were subtracted). The eight top exporters of peanut oil to the EU (making up 99 percent) of imports were:
1 We would like to acknowledge the contributions of Abdul Aziz Gueye and Dr. Abdoulaye Mbaye of the GOSIMOAIUP A in assembling the trade data for Senegal and contributing their insights and understanding of the trade policy environment in Senegal. They are, however, absolved from all errors of interpretation and conclusion which must be attributed to the principal authors of this report.
F-l )'7
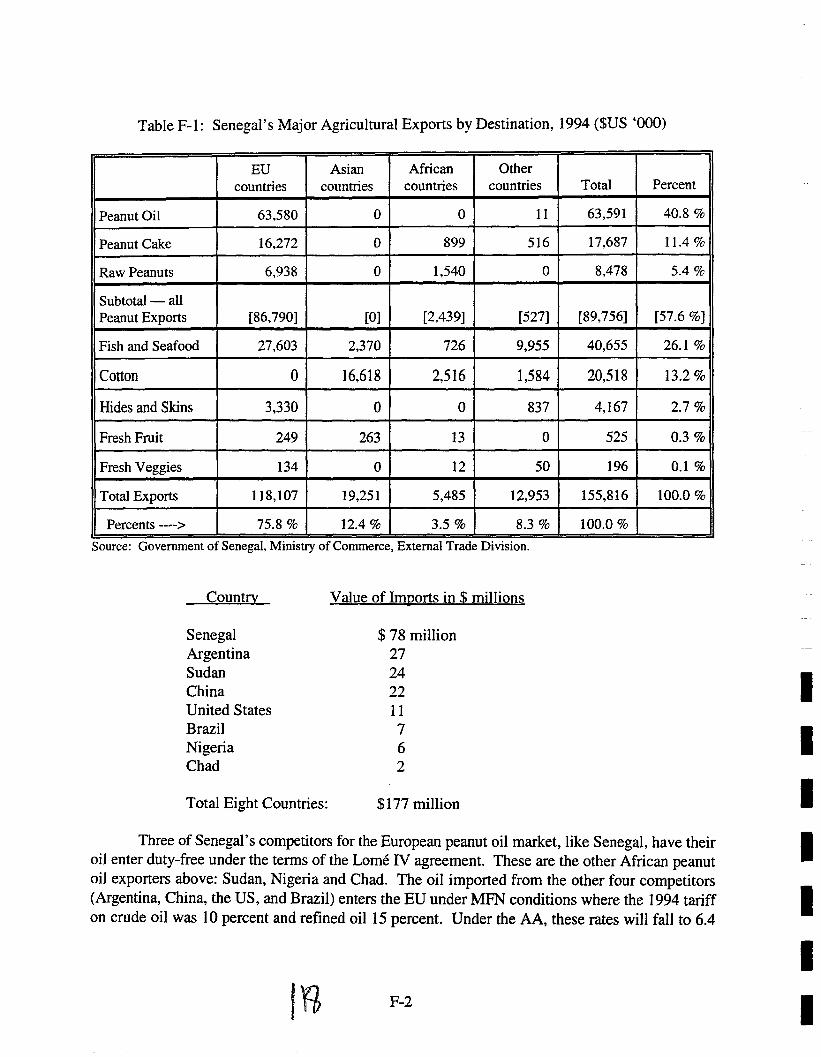
Table F-l: Senegal's Major Agricultural Exports by Destination, 1994 ($US '000)
EU Asian African Other countries countries countries countries
Peanut Oil 63,580 0 0 11
Peanut Cake 16,272 0 899 516
Raw Peanuts 6,938 0 1,540 0
Subtota1 - all Peanut Exports [86,790] [0] [2,439] [527]
Fish and Seafood 27,603 2,370 726 9,955
Cotton 0 16,618 2,516 1,584
Hides and Skins 3,330 0 0 837
Fresh Fruit 249 263 13 0
Fresh Veggies 134 0 12 50
Tota1 Exports 118,107 19,251 5,485 12,953
Percents ----> 75.8 % 12.4 % 3.5 % 8.3 % ...
Source: Government of Senegal, Ministry of Commerce, External Trade DIVISIon.
Country
Senegal Argentina Sudan China United States Brazil Nigeria Chad
Total Eight Countries:
Value of Imports in $ millions
$ 78 million 27 24 22 11 7 6 2
$177 million
Tota1 Percent
63,591 40.8 %
17,687 11.4 %
8,478 5.4 %
[89,756] [57.6 %]
40,655 26.1 %
20,518 13.2%
4,167 2.7%
525 0.3 %
196 0.1 %
155,816 100.0 %
100.0 %
Three of Senegal's competitors for the European peanut oil market, like Senegal, have their oil enter duty-free under the terms of the Lome IV agreement. These are the other African peanut oil exporters above: Sudan, Nigeria and Chad. The oil imported from the other four competitors (Argentina, China, the US, and Brazil) enters the EU under MFN conditions where the 1994 tariff on crude oil was lO percent and refined oil 15 percent. Under the AA, these rates will fall to 6.4
F-2
I I I I I I I

I I I I I I I I I I I I I I I
percent and 9.6 percent, respectively, so there would be a definite erosion of preference for Senegal (and other Lome and least developed country competitors). Both rates are being reduced by 36 percent. What this means in terms of future market access or share is not clear, particularly for a vegetable oil that has a substantially higher price and a reputation for higher quality and special cooking characteristics (e.g., does not begin to smoke until much higher temperatures than many other oils).
Peanut oil worldwide is much more a specialty or niche product than a product of mass consumption such as soy bean oil. In the US, for example, approximately 200 million pounds a year are marketed while the soy oil market is approximately 12 billion pounds a year (or roughly 70 times larger). This ratio may be less unequal in parts of the European market, but peanut oil is surely no longer the oil of mass consumption it was in France during the colonial era.
USAID and the World Bank have been preoccupied with the privatization of SONACOS in recent years (although the advantages for Senegal of converting a public monopoly to a private monopoly remain unclear). Furthermore, SONACOS has been able to derive more of its income in recent years from importing and refining cheaper vegetable oil than in buying and processing peanuts for export. Given the importance of the subsector for dryland farmers in Senegal, it is critical to the agricultural future of the country that a more careful analysis be done of world demand for high quality peanut oil, and how Senegal can improve or modify the positioning of its product on these markets. The biggest boost to Senegal's competitiveness on peanut oil was the devaluation of the CFA franc, which substantially lowered the subsector's break-even price for oil exports. This is all the more reason to try and take maximum advantage of this factor in gaining market share in critical target markets.
Peanut cake exports go to a very different set of buyers on international markets and are in competition with other ingredients (both vegetable and animal based) for livestock feeds. For Senegal, peanut cake is clearly a by-product of the dominant oil industry. The major policy question is whether it is more profitable to the peanut production and processing subsector to export the peanut cake or sell a portion on the domestic market (which has been forbidden in recent years).
Finally, there is a growing world demand for the export of confectionary (or snack) raw peanuts (generally smaller in size and with a lower oil content than peaput varieties produced for oil). It is not clear how the export statistics reported in Table F-l distinguish between these two products, but clearly there are good prospects for converting some ofthe country's peanut production zone to this alternative product should long term market opportunities remain favorable. Keeping the peanut subsector healthy and important to the economy will require a revamped partnership between the GOS and key private sector production, marketing, processing, and export groups.
Fish and Seafood Exports
Senegal is at the southern end of one of the richest fisheries in the world, extending north along the Atlantic coast of Africa to Morocco. Fish and seafood exports have grown rapidly since the mid-1970s supplanting peanut oil exports as Senegal's top money maker. Seafood has slipped
F-3
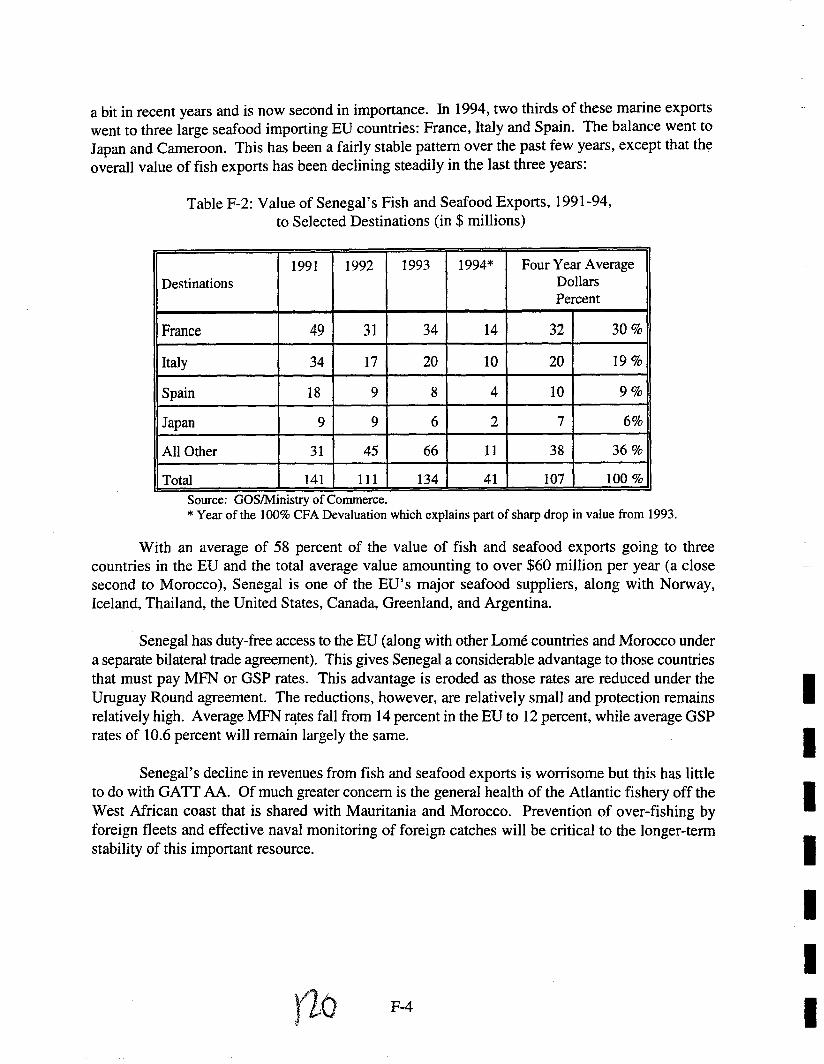
a bit in recent years and is now second in importance. In 1994, two thirds of these marine exports went to three large seafood importing EU countries: France, Italy and Spain. The balance went to Japan and Cameroon. This has been a fairly stable pattern over the past few years, except that the overall value of fish exports has been declining steadily in the last three years:
Table F-2: Value of Senegal's Fish and Seafood Exports, 1991-94, to Selected Destinations (in $ millions)
1991 1992 1993 1994* Four Year Average Destinations Dollars
Percent
France 49 31 34 14 32 30%
Italy 34 17 20 10 20 19 %
Spain 18 9 8 4 10 9%
Japan 9 9 6 2 7 6%
All Other 31 45 66 11 38 36%
Total 141 111 134 41 107 100 %
Source: GOSlMinistry of Commerce. * Year of the 100% CFA Devaluation which explains part of sharp drop in value from 1993.
With an average of 58 percent of the value of fish and seafood exports going to three countries in the EU and the total average value amounting to over $60 million per year (a close second to Morocco), Senegal is one of the EU's major seafood suppliers, along with Norway, Iceland, Thailand, the United States, Canada, Greenland, and Argentina.
Senegal has duty-free access to the EU (along with other Lome countries and Morocco under a separate bilateral trade agreement). This gives Senegal a considerable advantage to those countries that must pay MFN or GSP rates. This advantage is eroded as those rates are reduced under the Uruguay Round agreement. The reductions, however, are relatively small and protection remains relatively high. Average MFN ra,tes fall from 14 percent in the EU to 12 percent, while average GSP rates of 10.6 percent will remain largely the same.
Senegal's decline in revenues from fish and seafood exports is worrisome but this has little to do with GAIT AA. Of much greater concern is the general health of the Atlantic fishery off the West African coast that is shared with Mauritania and Morocco. Prevention of over-fishing by foreign fleets and effective naval monitoring of foreign catches will be critical to the longer-term stability of this important resource.
Y26 F-4
I I I I I I I

I I I I I I I I I I I I I I
Cotton Exports
For 60 years the French company CFDT (Compagnie Franr;aise de Developpement de fibres Textiles), with support from the colonial French administration, then French aid and new national governments, has been promoting the development of smallholder cotton production across West and Central Africa. Senegal was one of the target countries but not one of the most important ones. In recent years, with the decline of peanut production cotton has assumed a more important role in Senegal. SODIFITEX, a GOS parastatal with substantial French assistance, has been leading the effort to substantially expand cotton production for domestic industrial use and for export. Senegalese cotton exports have, however, remained at a fairly low level and have declined somewhat over the period 1992-94:
1991 $23 million 1992 $29 million 1993 $27 million 1994 $21 million
Taiwan was the top buyer in three of four years and other important Asian buyers have been South Korea, Japan, Thailand, and Vietnam. Tunisia was one of the top four or five buyers each year, while Germany and France have also taken significant quantities. There is a World Bank policy reform program in place in Senegal for cotton which has been left to the French to implement. In recent years world cotton prices have been very high but these high prices have not been passed on to the farmer which has limited the desired expansion in production.
See the discussion of possible impacts on GATT AA on cotton in Case Study E on Cote d'Ivoire.
Horticultural Exports
As the figures in Table F-l indicate, Senegal's 1994 Horticultural exports were very small (totaling less than a million dollars) but various development experts feel that the country has the potential to greatly expand these totals. Currently there is some production of fresh green beans, melons, and grafted mangoes, all for export to European markets. There are two areas of the country that look particularly promising for horticultural production for export: the Niaye zone near Dakar (areas of either sandy or ancient volcanic soils not far from the ocean irrigated primarily from shallow wells but with overall water supply for agriculture being a strongly limiting factor) and the much larger land area along the Senegal river which can now be irrigated due to the installation of large flood control dams.
The Senegal river lands to date have been used primarily for rice production with the exception of an area for sugar cane production and smaller areas that have been used for industrial canning tomato production. The big opportunities for production diversification are in horticultural crops for the domestic, sub-regional, and international markets. Sub-regional exports are represented by onions grown in Senegal being exported to Mauritania. One of the difficulties that Senegalese
F-5

producers face is that production zones in Senegal are quite far from potential higher income zones (Bamako, Abidjan, etc.) or face significant competition from local production.
Many of the potential products that Senegal could produce for the European market face very strong competition from other exporting countries in North, West and East Africa. New Senegalese production would have to face competition from well established producers such as Morocco and Kenya. Under Lome N (at least through the year 2000 when that agreement expires), Senegal has the same significant duty-free entry of many tropical products into EU markets. As was pointed out in the Kenya and Morocco case studies above, there will be some erosion of the magnitude of the ACP preferences. However, since Senegal is really not in this market to any significant extent at the current time, its future market access will depend on its natural (or created) comparative advantage in the production of specific crops, interest of foreign investors in taking advantage (in partnership with Senegalese entrepreneurs) of large tracts of irrigable land in the Senegal River valley, and whether some of the bureaucratic and ·'cost of doing business" impediments can be removed or be substantially reduced in the Senegalese business environment. (See the discussion of these factors in Part ill of this report.)
Senegalese Agricultural Imports
Table F-3 provides details of Senegal's major agricultural imports for 1994.
Heavy Food Imports
Table F-3 indicates that Senegal's agricultural imports are predominantly basic food stuffs. Four basic food categories, including rice (27 percent), milk products, vegetable cooking oils, and wheat, made up a total of 93 percent of major agricultural imports in 1994. Since Senegal's urban population has developed a strong taste for wheat bread and it produces no wheat itself, this must be imported in substantial quantities by two wheat milling companies located in Dakar. In additional Senegalese dairy production and marketing does not allow sufficient milk to be available for the milk-consuming popUlation, leading to another sizeable import bill.
It seems somewhat ironic that one of the world's major peanut producers would import substantial quantities of cooking oil but this makes some sense in comparative advantage terms since SONACOS, the monopoly oil processing company, can import and refine cheaper vegetable oils for domestic consumption and export higher quality peanut oil.
F-6
I I I I I I
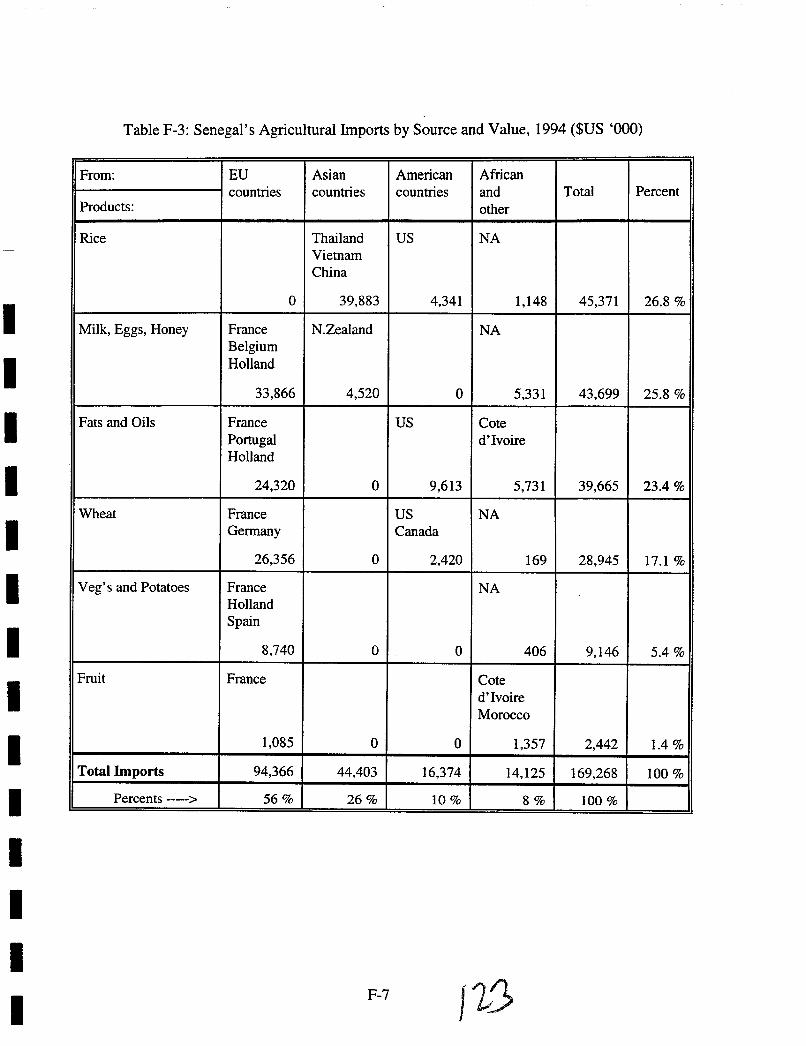
I I I I I I I I I I I I I I
Table F-3: Senegal's Agricultural hnports by Source and Value, 1994 ($US '000)
From: EU Asian American African countries countries countries and Total Percent
Products: other
Rice Thailand US NA Vietnam China
0 39,883 4,341 1,148 45,371 26.8 %
Milk, Eggs, Honey France N.Zealand NA Belgium Holland
33,866 4,520 0 5,331 43,699 25.8 %
Fats and Oils France US Cote Portugal d'Ivoire Holland
24,320 0 9,613 5,731 39,665 23.4 %
Wheat France US NA Germany Canada
26,356 0 2,420 169 28,945 17.1 %
Veg's and Potatoes France NA Holland Spain
8,740 0 0 406 9,146 5.4 %
Fruit France Cote d'Ivoire Morocco
1,085 0 0 1,357 2,442 1.4 %
Total Imports 94,366 44,403 16,374 14,125 169,268 100 %
Percents -----> 56% 26% 10% 8% 100%
F-7

Trade Reforms and Rice Policy Dilemmas
Senegal's rice imports have presented the government with numerous policy dilemmas. The Senegalese population traditionally consumed primarily sorghum and millet (with some rice grown in the southern Casamance region). Sorghum and millet, for which the country has a strong comparative advantage, still makes up approximately half of total staple food consumed in the country.
During the last 50 or 60 years of the colonial period (1900-1960), when Dakar was the regional administrative and economic capital of French West Mrica, colonial policy encouraged the importation of 100 percent broken rice (normally considered a byproduct of industrial milling) from other French colonies such as Madagascar and Indochina which had substantial surpluses. This rice was used to cheaply feed relatively large populations in schools, colonial annies and other public institutions. Thus, the urbanized Senegalese population developed a particularly strong preference for this type of rice (and special dishes that take advantage of its characteristics) which has only increased in the almost 40 years since independence.
When the GOS and donors built dams and invested in the creation of irrigable land along the Senegal River (the northern boundary of the country with Mauritania), it was anticipated that rice production would be the major crop that would utilize this land. It has turned out that, since 100 percent broken rice is the main rice consumed on the Senegalese market (and the cheapest rice on world markets), it was difficult for Senegalese farmers to be competitive with this imported rice, particularly once import supply management and internal subsidies were eliminated in recent years during market liberalization efforts. The GOS instituted a fairly pragmatic system of border protection consistent with the spirit (if not the letter) of the AA by using a combination of tariff and variable levy to try and address one of the most troublesome policy issues associated with liberalized markets: price instability in domestic markets introduced by the combined effects of variable world prices, fluctuating domestic supplies, and market liberalization.
Thus, with policy reform, consistent with trade liberalization and the AA agreement, Senegal may actually produce less of its own rice supply than it could theoretically, if it can find other, higher value crops that can make better use of the diversity of land types and growing conditions prevalent on the Senegal River valley land. These major shifts in land use and policy are much more important in Senegal in determining patterns of food production than possible minor increases in world rice prices attributable to the AA.2 Finally, in regard to food price increases, any minor increase in world food costs are insignificant in terms of the increase in imported food prices due to the devaluation
2 For further detail on these complex trade and domestic food policy issues, see two recent USAID-sponsored analyses of rice in Senegal: David Wilcock et.al, "Senegal Rice Policy Reform Program: Second Situation Report", RSAP/APAPIUPA Report No. 12, DAI, Bethesda, MD, January 1997, and Thomas Randolph, "The Economics of Rice Production in Senegal: Background Paper for the DAI Rice Sector Study" April, 1997, DAIlWARDA B.P. 2551, Bouake, Cote d'Ivoire.
F-8
• I I I I I I

I I I I I I I I I I I I I I
of the CFA franc which effectively doubled the cost of imported food from January 1994 on. This has also provided significant incentive for domestic food producers to increase output in response to these higher market prices.
Impacts of the AA on Senegal's Agricultural Trade Policy
Senegal, as most Mrican countries, was not greatly engaged in the GAIT AA negotiations. As a developing country, it was not obligated to negotiate many significant trade concessions in the period leading to the DR agreement. As we have noted, Senegal's agricultural trade is the smallest of our six case study countries. It is also a country that has received among the highest levels of per capita development assistance in Africa over the same period that its economy has been fairly steadily eroding in terms of per capita growth. The mainstream of its economic policy traditions, firmly rooted in French economic dirigisme, did not see trade liberalization as being that important to its economic future.
Ironically, because of the poor performance of the economy and the country's high dependency on foreign aid, Senegal has been forced to liberalize its economic policies, including those dealing with foreign trade. In terms of general economic and sectoral policy it has been subject to several waves of structural adjustment programs which have been generally consistent with trade liberalization. When these agricultural programs have tackled agricultural sectors, the reforms have been consistent with reduced state management of agricultural trade and with privatization of state ownership of processing and trade companies (most notably with the elimination of the cereals importing agency CPSP and the attempts to privatize SONACOS). Finally Senegal's participation in efforts to create a free trade zone in the francophone countries of the West Mrican monetary union (DMOA) has necessitated that a common tariff wall be envisioned which has required that agricultural tariffs be harmonized and "GATT-consistent."
However, overall the GOS has not yet been very successful in creating freer trade environment where its very entrepreneurial population could begin to take advantage of the country's advantageous geographical location, the quality of its transport and communications infrastructure, and the presence of a large, reasonably educated labor force on the Cap Vert peninsula. The 1994 GATT trade policy review tried to summarize the overall situation as diplomatically as possible:
Deregulation in agriculture, privatization of State Ownership in major enterprises and dismantling of certain trade privileges have enlarged the scope for the private sector to engage in international trade .... However, while reforms have resulted in some curbs on administrative red tape, the overall regulatory framework remains complicated. It is generally recognized, including by government officials, that much further work is required to streamline the trade regime and improve its transparency and predictability for economic operators.3
3 "GAIT Trade Policy Review for Senegal", Volume I, Geneva, 1994, page 3.
F-9 )zh
GOS Ministry of Commerce officials did not feel that the GATT AA placed "Many constraints" on Senegal in the following areas:
•
•
•
Domestic Subsidies: This is not a problem since the GOS cannot afford many subsidies and those under 10 percent were exempt from any reduction;
Market Access: Most of the tarification and consolidation of protection had already taken place under two agreements with the World Bank: the ASAL (Agricultural Sector Adjustment Program) and PASCO (Private Sector Adjustment and Competitiveness Program); and
Safeguard Clause: Provides the GOS with the option of not reducing tariffs on strategic products if this would cause severe balance of payment problems.
It is interesting that the predominant attitude of the Ministry of Commerce was one of looking at the GATT AA as "bad-tasting medicine" which did not cause the GDS any major problems. In contrast, the major question raised by the agricultural policy unit of the Ministry of Agriculture was much more positive and forward-looking. They felt that if Senegalese agriculture (either for exports or domestic food production) had to play by the new rules (where world prices are dominant and allowed to affect the price of inputs and product within the domestic economy), what sort of public service framework or (partnership with the private sector) can be constructed which will help make domestic agricultural production as competitive as possible? According to these specialist, the main GATT -friendly role for the state is to provide basic transportation, communication, and large-scale irrigation infrastructure to production zones and access to agricultural production and marketing credit at reasonable interest rates.4
A final point concerning how the provisions of the AA may yet directly influence national trade policy is in the area of food price stabilization involving the use of a combination of ad valorem and variable levy mechanisms. This type of combined "tariff," within certain price ranges, is what the GOS (with World Bank approval) has used to try and stabilize domestic rice prices. This is not conceptually very different from the "price band" policies used in various Latin American countries. However, since pure variable levies are excluded from use under the AA and some of the national price band polices are likely to be brought to the WTO in Geneva on complaint, it is likely that these "combination" protection/stabilization systems will be subject to future scrutiny.
4 Concerning credit, if all other inputs are provided at world price plus cost of "transport and handling," why not capital? Why should Senegalese farmers have to pay 18 percent to 20 percent for their credit? If this is more a reflection of an excessively high discount rate from the BCEAO rather than just high costs of loan administration, then they probably have a very valid point.
fU4 F-IO
I I I I I I
I I I I I I I I I I I I
Summary and Conclusion
Agricultural exports from Senegal, while not large in absolute terms compared to those of our other case study countries, do make over 20 percent of the value of total exports from the country. Senegal is excessively dependent on peanut oil exports which occupy a privileged place as a higher price and higher quality vegetable oil on world markets. The devaluation of the CFA franc has contributed far more to making Senegalese oil competitive than any tariff preference erosion might contribute to reducing demand. The problems in the subsector have much more to do with inappropriate national policies and the maneuverings that are surrounding the current efforts to privatize SONACOS. The same general situation prevails in the area of fish and seafood exports where virtually all that Senegal exports enters the ED facing no protection. Again the real problems are the health of the production side of the industry and not with excessive competition.
On the import side of the ledger, imports of broken rice, powdered milk and wheat dominate and are appropriate assuming that Senegal can generate the national income to pay for them. The CF A devaluation raised food prices much more than any possible future increases in prices that could be attributable to the AA.
Senegal is representative of that large number of Sub-Saharan African countries that still has a long way to go to create a positive environment for investment and trade. A wide range of inputs and services critical to taking full advantage of the country's theoretical comparative advantage in the production and exporting of higher value commodities (such as horticultural products) end up costing far too much more than their world prices. This largely defines the next round of trade and regulatory policy reform that is needed in order to be able to use booming world trade in agricultural products to help Senegal reach a new and higher level of sustainable economic development.
F-ll