III. Experiments on fluid...
17
INDEX SLIP. M allock . A.—Experiments on Fluid Viscosity. Phil. Trans. A 1896, p. 41. Fluid Friction or Viscosity, Experiments on, using a water annulus. Mallock A., Phil. Trans. A 1896, p. 41. Fluid Friction or Viscosity, Variation of, with Temperature. Mallock, A., Phil. Trans. A 1896, p. 41. Fluid, Stability of Motion in Annulus of. Mallock, A., Phil. Trans. A 1896, p. 41. Friction (Fluid), Determining Co-efficient of, by means of a water annulus. Mallock, A., Phil. Trans. A 1896, p. 41. on June 20, 2018 http://rsta.royalsocietypublishing.org/ Downloaded from
Transcript of III. Experiments on fluid...

INDEX SLIP.
Mallock. A.—Experiments on Fluid Viscosity.Phil. Trans. A 1896, p. 41.
Fluid Friction or Viscosity, Experiments on, using a water annulus.Mallock A., Phil. Trans. A 1896, p. 41.
Fluid Friction or Viscosity, Variation of, with Temperature.Mallock, A., Phil. Trans. A 1896, p. 41.
Fluid, Stability of Motion in Annulus of.Mallock, A., Phil. Trans. A 1896, p. 41.
Friction (Fluid), Determining Co-efficient of, by means of a water annulus.Mallock, A., Phil. Trans. A 1896, p. 41.
on June 20, 2018http://rsta.royalsocietypublishing.org/Downloaded from

[ 41 1
III. Experiments on Fluid Viscosity.
By A. Mallock.
Communicated by Lord K elvin, P.R.S.
Received Ju ly 26,— Read November 21, 1895.
These experiments consisted of the measurement of the moment transmitted, by fluid viscosity, across the annular space between two concentric cylinders, one of which revolves while the other is stationary.
The fluid used in these experiments was water. Three distinct sets of conditions were tried, viz.
(1) Outer cylinder revolving, inner cylinder stationary.(2) Inner „ ,, outer ,, „(3) Repetition of series (1) with an annulus of different width.
It had been intended to have had a repetition of series (2) with a larger annulus, but the motion in the fluid in series (2) was so thoroughly unstable that this was not done.
The object of the experiments was chiefly to examine the limits between which the motion of the fluid in the annulus was stable, and the manner in which the stability broke down. For obtaining the actual value of the coefficient of viscosity, other methods, such as the flow through capillary tubes, would be more suitable.
Fig. 1 is a section of the cylinders as arranged for the experiment of series (1). The inner cylinder A is suspended by a torsion wire, attached by a gymbal ring to the top of the stem B. This stem is guided by two rings of balls, held by the gun- metal casting C, the rings being adjustable in their own planes by means of four set screws at each ring, thus allowing the axes of the suspended and revolving cylinders to be made coincident.* The stem B carries a divided circle which is read by the telescope T. E is the outer cylinder, carried on the axis F. This cylinder was driven at constant speeds by a small electromotor connected with a governor which cuts off the current when, and not before, the desired speed is attained. Surrounding
* Though this adjustm ent was made with ease in the main experiments, preliminary experiments with the axes of the cylinders parallel, but separated by known intervals, had shown that an error in centreing the cylinders, if small, produced a difference of the second order only in the moment transmitted by the fluid.
MDCCCXCVI.— A. G 10.3.96
on June 20, 2018http://rsta.royalsocietypublishing.org/Downloaded from

42 MR. A. MALLOCK ON EXPERIMENTS ON FLUID VISCOSITY.
the cylinder E is another, G, and the space between E and G, and the interior of A, are kept filled with water in which thermometers are placed, and the temperature of the fluid in the annulus between E and A is taken as the mean of the temperatures in A and the outer annulus.
The cylinder A has its floor about half-an-inch up from the lower edge, and during the experiments the space under this floor is filled with air. Thus the fluid in the annulus only touches the cylindrical surface of A. The axis F of the outer cylinder is hollow, and a rod, H, passing through a watertight joint at its upper end, carries a short piece of cylinder K, of the same diameter as A. The arm L at the lower end of H, where it projects beyond F, is held fixed, thus keeping the short cylinder K stationary whilst E revolves. The space between E and K is filled with mercury. The object of this arrangement is to cause the lower surface of the water in the annulus to be in contact with a surface whose velocity at any point is nearly the same as its own. Of course, in the mercury, in consequence of its being in contact with the floor of the cylinder E, there is a certain amount of circulation set up, which causes an outward radial drift in the mercury in contact with the floor and a return current flowing inwards in the mercury surface in contact with the water, but the radial velocity is slow compared with the circumferential, and the water in the annulus between E and A is very nearly in the same condition as it would be if E and A were infinitely long.
Figs. (2) and (3) show the arrangement used in the second and third series of experiments respectively.
Attached to reading telescope T was a small cameraducida, by means of which the image of the divided circle could be seen on the surface of a cylinder, driven by clockwork and carrying continuous paper, P. On this paper an electric clock recorded seconds, and another pen and electromagnet in connection with a contact-maker on the axis F marked every revolution of the cylinder E. A third pen, worked by a hand lever, was used to follow the motion of the image of the divided circle seen on the paper through the camera-lucida.
In making an experiment the usual course was to bring the wire of the telescope to the zero of the divided circle when everything was at rest, then to start the paper cylinder and mark the position of the zero on the paper. The experimental cylinder was then set in motion, and when the suspended cylinder had reached its approximately stationary position (about four minutes after the revolving cylinder was started) the mark on the divided circle, which was nearest to the centre of the paper, was followed by the third pen for a minute or more, after which the zero mark was again made on the paper, and the number of the division (on the circle) followed by the pen was written on. In some experiments, however, the motions of the suspended cylinder were followed from the moment the revolving cylinder was started. The diagrams so made gave a permanent record of the result of each experiment, which could be analyzed at leisure.
Table I. (p. 47) gives the dimensions and constants of the apparatus.
on June 20, 2018http://rsta.royalsocietypublishing.org/Downloaded from

MR. A. MALLOCK ON EXPERIMENTS ON FLUID VISCOSITY. 43
F ig .l . Fig. 2.
Mercury
a 2
on June 20, 2018http://rsta.royalsocietypublishing.org/Downloaded from
44 MR. A. MALLOCK ON EXPERIMENTS ON FLUID VISCOSITY.
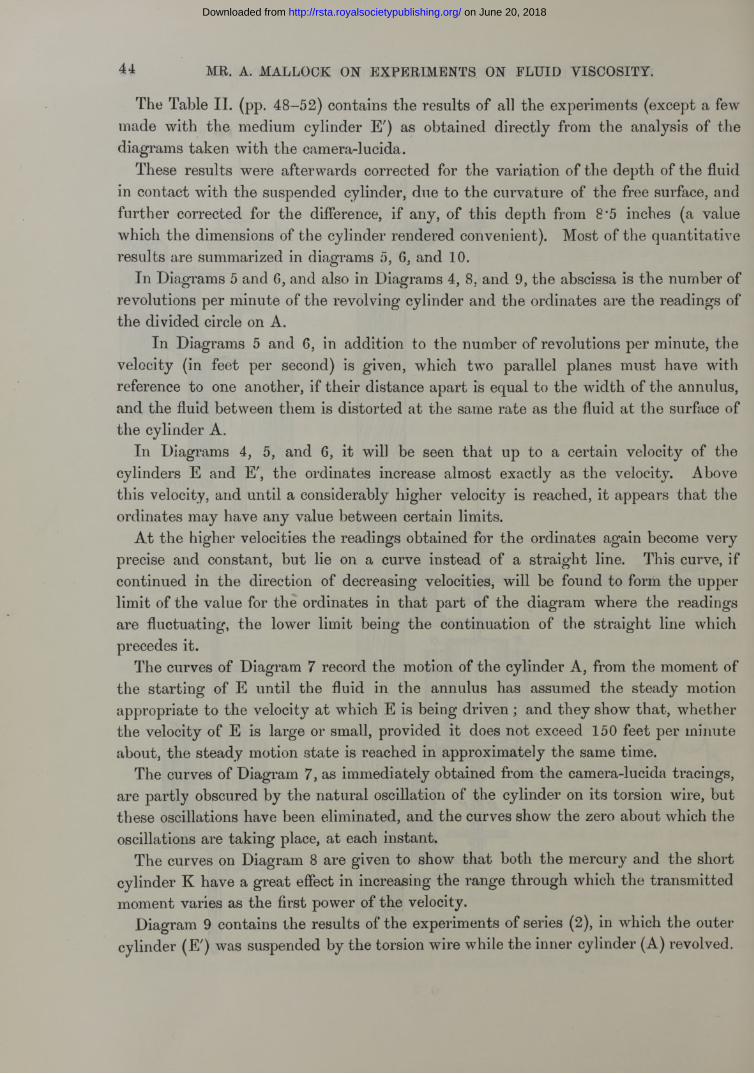
The Table II. (pp. 48-52) contains the results of all the experiments (except a few made with the medium cylinder E') as obtained directly from the analysis of the diagrams taken with the camera-lucida.
These results were afterwards corrected for the variation of the depth of the fluid in contact with the suspended cylinder, due to the curvature of the free surface, and further corrected for the difference, if any, of this depth from 8*5 inches (a value which the dimensions of the cylinder rendered convenient). Most of the quantitative results are summarized in diagrams 5, 6, and 10.
In Diagrams 5 and 6, and also in Diagrams 4, 8, and 9, the abscissa is the number of revolutions per minute of the revolving cylinder and the ordinates are the readings of the divided circle on A.
In Diagrams 5 and 6, in addition to the number of revolutions per minute, the velocity (in feet per second) is given, which two parallel planes must have with reference to one another, if their distance apart is equal to the width of the annulus, and the fluid between them is distorted at the same rate as the fluid at the surface of the cylinder A.
In Diagrams 4, 5, and 6, it will be seen that up to a certain velocity of the cylinders E and E', the ordinates increase almost exactly as the velocity. Above this velocity, and until a considerably higher velocity is reached, it appears that the ordinates may have any value between certain limits.
At the higher velocities the readings obtained for the ordinates again become very precise and constant, but lie on a curve instead of a straight line. This curve, if continued in the direction of decreasing velocities, will be found to form the upper limit of the value for the ordinates in that part of the diagram where the readings are fluctuating, the lower limit being the continuation of the straight line which precedes it.
The curves of Diagram 7 record the motion of the cylinder A, from the moment of the starting of E until the fluid in the annulus has assumed the steady motion appropriate to the velocity at which E is being driven ; and they show that, whether the velocity of E is large or small, provided it does not exceed 150 feet per minute about, the steady motion state is reached in approximately the same time.
The curves of Diagram 7, as immediately obtained from the camera-lucida tracings, are partly obscured by the natural oscillation of the cylinder on its torsion wire, but these oscillations have been eliminated, and the curves show the zero about which the oscillations are taking place, at each instant.
The curves on Diagram 8 are given to show that both the mercury and the short cylinder K have a great effect in increasing the range through which the transmitted moment varies as the first power of the velocity.
Diagram 9 contains the results of the experiments of series (2), in which the outer cylinder (E') was suspended by the torsion wire while the inner cylinder (A) revolved.
on June 20, 2018http://rsta.royalsocietypublishing.org/Downloaded from

MR. A. MALLOCK ON EXPERIMENTS ON FLUID VISCOSITY. 45
Only a few experiments were made with this arrangement, as the motion of the fluid was eddying and unstable, even at very low velocities.
Diagram 10 gives the coefficient of viscosity in terms of temperature, as deduced from the experiment of series (1) and (3). With these results, for the sake of comparison, I have drawn the curve representing the true value of the coefficient (taken from Professor E verett’s C.G.S. units).
What the origin of the high values found for the coefficient by my experiments is, I am not at present in a position to explain, but from the fact of the moment transmitted by the fluid being directly proportional to the velocity,. I do not think it can be put down to eddy-making in the ordinary sense of the word, or, if due to formation of isolated eddies, the magnitude of and rate at which such eddies are formed must be such as to keep the total transmitted moment (at any rate very nearly) proportional to the velocity.
As bearing on this point the curves of Diagram 11 have been introduced. These curves are actual tracings by the camera-lucida of the angular motion of the divided circle on cylinder A during portions of four experiments.
It will be seen that, for low velocities (curves , of the revolving cylinder, the suspended cylinder A remains nearly stationary, the chief movement being a slight harmonic oscillation of about fifteen seconds’ period (the period of the suspended cylinder on the torsion wire), but that this movement is more marked and more irregular in ( b)than in ( a ).
When the speed approaches the limits of stability (curve c) the disturbance becomes very large, showing that at these speeds the motion of the fluid in the annulus is at times, but not always, irregular. At much higher speed (curve d), when the motion is thoroughly unstable, and the fluid, as it were, saturated with eddies, the curve, on the whole, is again fairly straight, but the nature of the irregularities indicates that the forces at work are large.
When the velocity approached that at which instability was liable to occur, it was interesting to notice how small a disturbance of the system was sufficient to change the entire character of the motion. A slight blow on the support which carried the apparatus, or a retardation for a few moments of the rotation of the outer cylinder, was almost sure to produce the effect. (Note that reducing the velocity of E had the effect of increasing for the time the moment acting on A.)
The unstable motion so produced, however, was not necessarily permanent, and 1 have seen the stable form of motion change to the eddying one and back again many times in succession at irregular intervals, and for no apparent reason, when the speed neared the limit of stability.
The appearance of the surface of the fluid in the annulus was as certain a criterion of the character of the motion as the torsion produced on the inner cylinder. As long as the motion was stable, the surface remained as smooth as glass ; the beginning
on June 20, 2018http://rsta.royalsocietypublishing.org/Downloaded from
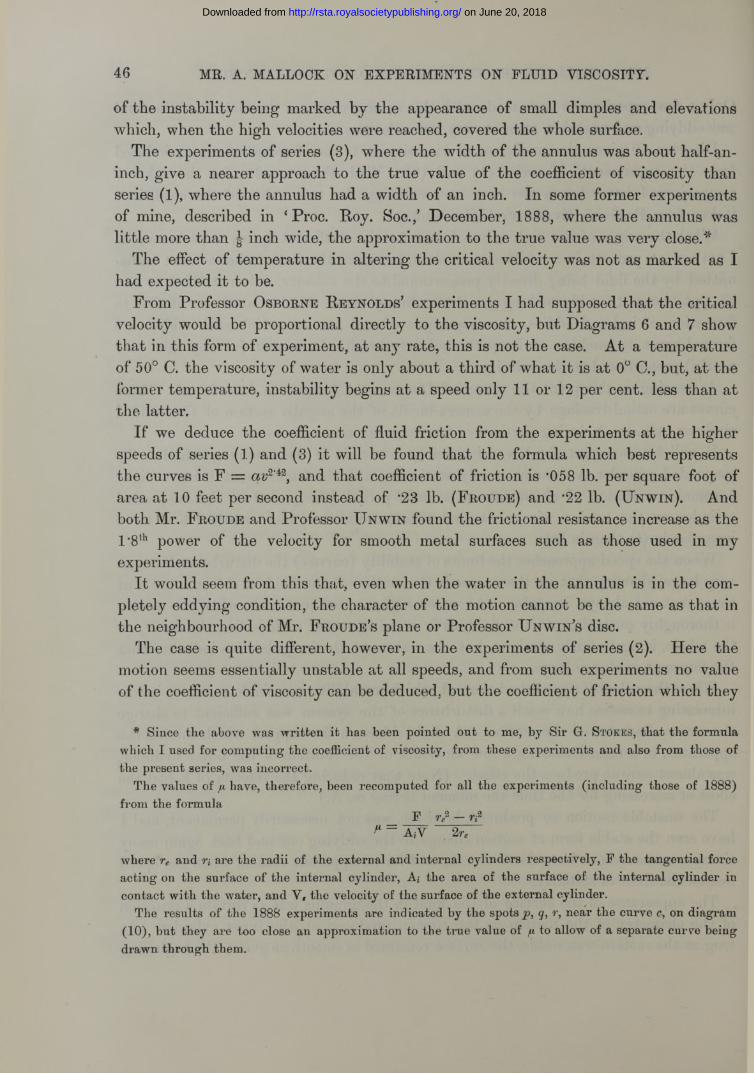
46 MR. A. MALLOCK ON EXPERIMENTS ON FLUID VISCOSITY.
of the instability being marked by the appearance of small dimples and elevations which, when the high velocities were reached, covered the whole surface.
The experiments of series (3), where the width of the annulus was about half-an- inch, give a nearer approach to the true value of the coefficient of viscosity than series (1), where the annulus had a width of an inch. In some former experiments of mine, described in 4 Proc. Roy. Soc.,’ December, 1888, where the annulus was little more than J inch wide, the approximation to the true value was very close.'*
The effect of temperature in altering the critical velocity was not as marked as I had expected it to be.
From Professor Osborne R eynolds’ experiments I had supposed that the critical velocity would be proportional directly to the viscosity, but Diagrams 6 and 7 show that in this form of experiment, at any rate, this is not the case. At a temperature of 50° C. the viscosity of water is only about a third of what it is at 0° C., but, at the former temperature, instability begins at a speed only 11 or 12 per cent, less than at the latter.
If we deduce the coefficient of fluid friction from the experiments at the higher speeds of series (1) and (3) it will be found that the formula Avhich best represents the curves is F = av2'43, and that coefficient of friction is *058 lb. per square foot of area at 10 feet per second instead of ‘23 lb. (Froude) and *22 lb. (Unw in). And both Mr. F roude and Professor U nwin found the frictional resistance increase as the l*8th power of the velocity for smooth metal surfaces such as those used in my experiments.
It would seem from this that, even when the water in the annulus is in the completely eddying condition, the character of the motion cannot be the same as that in the neighbourhood of Mr. F roude’s plane or Professor U nwin’s disc.
The case is quite different, however, in the experiments of series (2). Here the motion seems essentially unstable at all speeds, and from such experiments no value of the coefficient of viscosity can be deduced, but the coefficient of friction which they
# Since the above was w ritten it has been pointed out to me, by Sir G. S tokes, th a t the formula which I used for com puting the coefficient of viscosity, from these experiments and also from those of the present series, was incorrect.
The values of /i have, therefore, been recomputed for all the experiments (including those of 1888) from the formula
F r e3 — n 2^ = A W
where re and r; are the radii of the external and internal cylinders respectively, F the tangential force acting on the surface of the internal cylinder, A; the area of the surface of the internal cylinder in contact w ith the water, and Y , the velocity of the surface of the external cylinder.
The results of the 1888 expei’iments are indicated by the spots q, r, near the curve c, on diagram (10), but they are too close an approximation to the ti*ue value of jx to allow of a separate curve being drawn through them.
on June 20, 2018http://rsta.royalsocietypublishing.org/Downloaded from

MR. A. MALLOCK ON EXPERIMENTS ON FLUID VISCOSITY. 47
indicate is a little more than *2 lb. per square foot at ten feet per second (practically the same as Mr. F roude’s and Professor U nwin’s).
The exponent also of the velocity is not far from 1*8, but the velocities used in this series were so low that I should not attach much importance to the numerical determinations except as showing that the motion is really different in character from that which takes place when the inner cylinder is stationary and the outer one revolves.
[Note added July 10th, 1895.—Since writing the above, I have, at Sir G. G. Stokes’ suggestion, added the set of experiments shown in Diagram 12. These experiments show that the moment transmitted is directly proportional to the depth of the fluid in the annulus measured from the lower edge of the suspended cylinder. They give therefore further and independent evidence that the mercury floor and short cylinder K do really supply boundary conditions such as must exist at any cross-section of an infinitely long annulus, if particles having the same radii on either side of the cross-section are to be without relative motion.]
Table I .—Dimension and Constants of Apparatus.
The letters refer to figs. (1 ), (2 ) , and (3 ).
Inches. Centims.
Radius of Cylinder E . . . 3*915 9 -9 4 3
E' . . . . 3 -42 8*687
A' ., . . . 3*005 7*632
Height of cylinders . . . . 10*0 24*5
Number of divisions on circle, 400.
Tangential Force at Surface of Cylinder A required to turn it through onedivision of the circle.
With torsion wire I.II.
grain.•278*523
gram.•0181•0338
on June 20, 2018http://rsta.royalsocietypublishing.org/Downloaded from

48 MR. A. MALLOCK ON EXPERIMENTS ON FLUID VISCOSITY.
Table II.—Results of Individual Experiments.
Explanation o f Symbols used the Table.
6 = Reading of divided circle, during experiment.00 = Zero reading of divided circle.H = Height of wet surface of stationary cylinder.V = Revolutions per minute of revolving cylinder.T = Temperature, in degrees Centigrade.
Lip to Experiment 97 torsion-wire No. (l) was in use. Experiments 98 to 208 were made with torsion-wire No. (2).
No. (l) was a brass wire. No. (2) was a nickel wire.
Turn-table moving w ith cylin- « der
rW ater in diving- J
bell ^
A ir in diving- bell <
A fter this experim ent H refers to height when water is stationary
Turn-table fixed <(
M ercury in and turn-table fixed . <
Henceforward readings of 6 taken by camera-lucida
U n s ta b le ................................. ..... 1
e. d0. H. V. T.
1893. r 28 -0-6 8-6 30-6 11-8Nov. 29 <1 50
72« •
8*5245-659-75
• •
l 95 + 0-3 8-5 72-8 f #r 93 -0-5 8-5 72-8 13-3
Nov. 30 •<) 87 -0-5 8-6 73-2 • •L 86-8 -0 -8 8-6 73-6 13-5
90 + 0-2 8-4 73-5 13-862 + 2-5 8-45 60-35 ! • •43*5 + 2-6 8-5 46-15 , #255 + 1-7 8-5 30-9 • •18-4 + 1-7 8-5 24-55 • •14-4 + 1-8 8-5 20-0 ,,10-5 + 1-7 8-5 15-067-2 + 1-7 8-5 1017 14
> 52 + 0-2 8-4 73-8 10-540 + 0-5 8-45 60130-2 + 0-5 8-5 45-6 i
Dec. 1 . |̂18 + 0-5 308
\1 13-6 -h0*9 24-211-5 +o-i 9 # 19-6 9 m8-7 + 0-5 # # 150 , ,5-8 + 0-2 10-13 . ,
r 41 + 04 8-55 71-6 8-6Dec. 2 . 1 34 + 0-3 8-52 58-6
i 251 -0-2 8-53 44-9 , .1[ 14-8 -0-2 8-55 30-2 8-41r 14 + 0-9 8-5 30- 11-6
Dec. 5 . J1 24-5 + 0-9 • • 44" 6 „ #t 34-8 + 1-0 # , 59 , .1L # # 70-2 , #(- 33-4 + 0-2 8-5 721 130
33-5 + 0-2 8-5 72-0 • •28-5 -0 -4 8-55 60 13T20-6 + 0-5 8-6 45
Dec. 8 . <( 14-5 0 8-6 31 . #5-6 +0-9 . . 10-9 , ,8-4 + 0-7 , , 14-9 • .
10-5 + 0-5 . . 19-7 • •136 + 0-8 • • 23-85 13-2
No.
1011121314151617181920 21 22232425262728293031323334353637383940
on June 20, 2018http://rsta.royalsocietypublishing.org/Downloaded from

MR. A. MALLOCK ON EXPERIMENTS ON FLUID VISCOSITY. 49
Table I I .—.Results of Individual Experiments—(continued).
e. H. V. T. No.
r 1893. r 29-87 + 0-9 8-5 56-9 10-9 4154-25 , # 8-3 85 111 42
101-7 + 0-8 8-1 111 11-3 43W ater s m ilin g ...................................... ^ Dec. 10 -< 270-6
39-8+ 0-9 + 1-0
8-258-55
135-771-5
11-5 11 7
4445
32-6 , , 8-5 58-7 11-8 4624-6 , # 44-5 11-8 4715-6 + 1-2 # # 30-5 11-9 48
117-7 + 0-4 8-6 117 13-5 49Dec. 13 <1
97-241-8
• • 108-485
5051
i1 27-5 , , 56-3 , , 52r 29 0 8-5 59 12-8 53
Dec. 14 <1 40-5 # . , # 84 12-9 54100-3 # , , # 111 13-0 55161-8 . # 135 131 56125 + 0-4 8-25 130 12-5 57
Dec. 15 <100 , f , , 108-8 12-75 58
l 42-5 .. - 85-5 12-95 59L 28-3 , # 59-5 13-2 60
More mercury added.r 28-1 + 0-8 8-65 60 13-2 61
Dec. 15 <|1 40-9 # , 85-5 13-5 62i 95 , , 111 13-9 63L 135 0 • . 136-5 14-3 64
Dec. 18 48-5 0 8-5 60-L 12 65Dec. 20 r 168-5 + 0-4 8-4 134-5 121 66
74 + 0-4 8-2 111 12 67Cylinder adjusted for centreing . . Dec. 18 < 72-5 # * 110-5 , , 68
51-3 , # 15 • • 6934 • • 60-5 12-7 70
> 171 + 6 * 4 8-4 135 12-7 71Dec 20 <
110 112 13 72I 50-8 88 13-4 731L 32-2 • • 61-3 13-8 74|rii
7-25 + 6-4 8-3 9-7 9-5 ! 75ii 8-25 8-3 14-6 9-7 76i 11 , , 19-1 9-9 77
13-4 , , 23-5 10-1 781 19-5 , . 32-4 10-3 79
Dec. 21 i 27-8 « « 44-8 10-5 8037 # # 58*3 10-7 8146 , , 70-7 10-9 8254-6 85-5 1 11-1 83
Unstable and oscillating . . . . 110 . . 111-5 11-3 84U n stab le ................................................. 162 . , 135-3 11-5 85
f 1r # # 8-1 • • 12-8 86Dec. 27 <i , , , , , # 87
, , , # • • 88Experiments on the rate at which . . 8*2 .. | • . 89cylinders approach stationary posi- • . 8-2 * • j 132 90tion Dec. 31 < • • • • • * • • 91
92(See Diagram 7) • . *. • • •. 93
* * • • • * • • 94
MDCCCXCVI.— A. H
on June 20, 2018http://rsta.royalsocietypublishing.org/Downloaded from

50 MR. A. MALLOCK ON EXPERIMENTS ON FLUX!) VISCOSITY.
Table II.-p-Results of Individual Experiments —(continued).
0. d0. H. V. T. No.
r 1893.Experiments on the rate a t which 1 Dec. 31 1f
* * • * * • • * * # Jo9697cylinders approach stationary posi- ■< | * * • • * * * *
tion(See Diagram 7) ^ 1894.
Ju ly 5 .
Lr 20-910-2
+6*i 8**8
6644*6
19*535*5
V t9899
i 6-1 4-0*1 8 32*8 34 100r 4-6 4-0-3 7*9 16*3 13*5 101
5-5 20*3 , , 102July 7 . •< 8-2 25*8 103
V C . 9-8 32*5 # 104161 52*1 . # 10519-5 65*7 14 106> 2-6 0 8** 16*4 40 1073-4 23 42 108
„ 3-9 26 55 1094-6 33*3 55*5 110
Ju ly 9 . •< 5-8 43*3 54*5 1118-1 57*5 53 1129-5 74*2 53 113
6 , 8-7 60 53 1146-8 45 53 1155-5 31*8 53*5 116
I 28-4 -0*8 8*3 60*4 2*5 117V V 141 8*4 32*1 , , 118
fc ? 26-21 55 119Date not 28 62 120
given, 33-5 74 • . 121probably ]; 28-6 64*6 5*5 122July 10 33 73*5 • • 123
V . 32-8 71*4 4*8 124i a 82 22 , # 125
2-6 8*8 4*5 126Extinction diagrams for zero . <
>- 127128
i More mercury 7*6 - i 8* * 2*7*7 16*5 129i i * •> * 12-3 - l 41*3 . , 130
171 - l 550 # # 131211 - l 67*5 # , 132
< No mercury . r iJ
r 8-112-6
0 8*’ 28*142*2
16*5 133134r- Date not I 18-8 # # 55*4 • • 135
Turn-table freej
Eddies begin . v,?.
es
^ P
_.A— 22.2
121 -6*5 8**67*528*4
136137
< probably 24 • . 43*0 . . 138■ \ •1 39-4 # # 56 , # 139
1L 1 43-8 68 % # 14011-6 0 8*’ 28*8 16 14117-5 # # 43 9 # 142
, „ J , 23*5 55*2 14338*1 + 0-6 67*8 • • 144
1895. |r * 3*9 0 8*4 13*2 7*5 145i , 6*15 t # , , 19*4 . , 146
Feb. 4 <J 9*6 9 9 , 9 26*5 1471 12*3 , , , , 32*25 1481
-28*5 • • • * 67 • * 149
on June 20, 2018http://rsta.royalsocietypublishing.org/Downloaded from

MR. A. MALLOCK OX EXPERIMENTS OX FLUID VISCOSITY. 51
Table II.—Results of Individual Experiments—(continued).
e. 60. H. V. T. No.
1895. f 20 50-1 150Feb. 4 < 36-2 , 9 # 9 78 9 , 151
l 70 •. . • 104-2 • • 152
f 10-2 0 8-4 27 6 4-9 1531 18 9 9 # m 41-2 , # 154
23-8 9 9 # 54 t 9 155Feb. 5 <( 29-5
23-564-753-7
156157
35-5 . # 9 . • • • 79-9 9 m 15847-9 • - 103-8 , 4 15996-3 . • • . 122-6 . . 160
r 104 0 8-4 126 2 16146-8 # 9 9 # 103 , # 16235-5 9 80-4 16324-1 m 53 , , 164
Feb. 11 186 , , 41-2 • , 16512 # , 8-4 28 * , 166
5-7 9 m 9 9 13-4 9 , 1673 51-05
+ 1 0-9j
9 1 2 j
or—i
r r 11 0 8-35 18 2-5 1695-2 9 9 m 1708-1 13-25 f , 171
10-7 # 18 9 9 17213-6 22-1 9 9 173
7-inch cylinder, 1st time• <1\ Feb. 15 10-6
25-3•• ? 26-6
42-1174175
1 33-7 55 9 9 1761j 307 # 51-3 , 9 177
47-25 # . 78-1 m , 178L 60-100 8-i 105 , 9 1791L l 135 8-0 130 . . 180
56-1 0 8-3 78-8 2-5 18133-5 51-8 t # 18232 54-2 18326-1 41-4 , , 184
Feb. 17 <j 17-2 , . 27-2 1858-1 9 # 13-2 , 9 1866-3 9 9 9 1872-6 # # 4-1 9 9 1881-25 • • 2 ♦ . 189
[ Feb. 24 <f‘ 411 + 0-2 8-7 17-6 10-5 190
Outer cylinder (7") suspended , < 22-2 • . 131 • • 191L l 11-8 • . 8-55 . • 192
r ’ 11-4 0 8-7 8-57 4-8 193Feb. 25 { 22-5 # # , , 130 , , 194
l 321 17-4 *• 195
16-6 8-7 10-2 6-3 196104 *• • 9 9 7-6 . # 1975-5 9 9 4 B 5-05 # # 1983-5 0 8-7 3-4 6-3 1993-3 8-7 3 43 5-2 200
on June 20, 2018http://rsta.royalsocietypublishing.org/Downloaded from

52 MR, A. MALLOCK ON EXPERIMENTS ON FLUID VISCOSITY.
T a b l e II.—Results of Individual Experiments—(continued).
0. o0. H. V. T. No.
5-5 5-1 20115-9 10-2 • • 20224-5 , # 151 # 20335-9 8-7 17-3 5-0 20424-0 # , 13-2 , , 20513-7 , , 8-75 206
5-7 , , 4-9 • ♦ 2073-2 3-42 •• 208
on June 20, 2018http://rsta.royalsocietypublishing.org/Downloaded from

MR. A. MALLOCK ON EXPERIMENTS ON FLUID VISCOSITY. 53
Diagram 4./W150
120no
^ toosI$
r
/1/
//
y/ K
O 10 20 SO 4 0 60 60 70 60 SO IOO HO 120 130 140Revolutions per minute of E.
Expei’iments 160-168. Corrected to H = 8*5, T = 0.
Diagram 5.
Revolutions per minute of Cylinder £ .
Equivalent velocity of Parallel Planes in feet per minute.
Corrected results of Series 1.
on June 20, 2018http://rsta.royalsocietypublishing.org/Downloaded from

5.4 MR. A. MALLOCK ON EXPERIMENTS ON FLUID VISCOSITF.
Diagram 6.
/
Revolutions, per minute_Cylinder £'.
Equivalent velocity of Para Us! Plane in feet
Corrected results of Series 3.
Diagram 7.
Minutes 4Time elapsed from the starting the cylinder
Rate a t which Cylinder A approaches its stationary position.
on June 20, 2018http://rsta.royalsocietypublishing.org/Downloaded from

Diagi’am 11.
MR. A. MALLOCK ON EXPERIMENTS ON FLUID VISCOSITY.
f48._J_l_1—L.J—1—I—L
Time in Seconds.__ t_L_i_L_L_J_I___1___t 1 1 I 1 1 t I I ' I 1 1 1 1 1 1 1 I J L i. i l U U ___LJ_l—LJL.LJ—L-i-
Revolutions of Cylinder.> A_ 1 ft— ft \ . >, > \ H- K- JL. » L » A « _ I fi____I------1------K___(___
V*5225 o
SJ
%-*-&V / -
Zero.
i + / —
<8*$
Time m Seconds.
d - L l 4 1 k \ \ \ V- .* ; ; \ \ i - \ j - j
R evo lu tio n s o f Cylinder.____L__J____ 1____ L 1 L i ___ L / l ___ i____ »____L 1____» !____ 1____ 1____1 I_________ 3____\___L l L I _____1____L J L i ____1____i l
-i >____
- / -
Exp. 76. Time in Seconds._JL_JL_1 i 1 I____I I I I I I I I I 1 1 1 I I 1 l I I I 1 I t 1 t 1 1 1 . 1 1 I i 1 1 1 1 t i l l L 1 J-----i —
Revolutions of Cylinder. i ,i « - V - 4 - l - U U l - U - l 4 - ) - l a J - U U - 4 4 ^ - 4 - 4 ^ ^ - U 4 - 4 - M - M ( t . t I t ,jA U J U - U - U - W ^ l - j - 4 l i l t 1 1 \ l M - d -
V = 7 7 .
- / -
Time tn Seconds.-J l 1—l _ _ l l 1_ t 1 \ j l _ 1 1 1 1 1 1 i 1 1 1 1 _ 1 L__ 1 L I 1 1 i 1 1 1 1 1 i, _i _Exp. 44. Revolutions of Cylinder.
JJUH , 41C4 Uin.i-vt-tju u t i i U n a .H i 11 a 14 L* u 1»1 L^ui 1 a CUj l.i * 1a . ii niu u u : i
V = 135-7 ___
- / -----
P M ^ „ Zero Z
’ ^
+a—
1
Specimens of diagrams taken vvitli camera-1 ucida.
on June 20, 2018http://rsta.royalsocietypublishing.org/Downloaded from

!*!Q
56 MR. A. MALLOCK ON EXPERIMENTS ON FLUID VISCOSITY.
Diagram 8.
40 50 60 70Revolutions per minute of .
Experim ents 133-144.
Diagram 9.
Results of Series 2.
Diagram 10.
Coefficient of viscosity of w ater in terms of tem perature. U nits—centimetre-gramme-second. a, as deduced from Series 1.^ 5 55 55 55 3 .e, as taken from E verett’s C.G.S. units.
The spots p, q, r are from the results of sim ilar experiments described in ‘ Pi’oc. Roy. Soc.,’ Dec., 1888.
Diagram 12.
Height of Wet Surface of Suspended Cylinder (A).To show moment transm itted with different depth of water in the annulus.
42 revolutions per minute. Temperature, 19°'5 C.
on June 20, 2018http://rsta.royalsocietypublishing.org/Downloaded from