IIFL Investor Conference - Wall Paints, Home Painting ... · USD 2 Billion Group revenue Operations...
39
IIFL Investor Conference Mumbai, India February 21, 2017
Transcript of IIFL Investor Conference - Wall Paints, Home Painting ... · USD 2 Billion Group revenue Operations...
IIFL Investor Conference
Mumbai, India
February 21, 2017
Disclaimer
This presentation may contain statements which reflect Management’s
current views and estimates and could be construed as forward
looking statements. The future involves certain risks and uncertainties
that could cause actual results to differ materially from the current
views being expressed. Potential risks and uncertainties include such
factors as general economic conditions, foreign exchange fluctuations,
competitive product and pricing pressures and regulatory
developments.
Responses can only be given to questions which are not price
sensitive.

Economic Environment – Q3 FY17
Financial Performance – Q3 FY17
Business Review – Q3 FY17
Risks and Outlook
Agenda
Group Overview

No. 1Paint Company
in India
Servicing
Consumers in over
65 Countries
Part of
30 share
BSE
S&P SENSEX
Over
USD 2 Billion
Group revenue
Operations in
19countries
49 Years of Market
Leadership in India
26Paint
Manufacturing
Plants
Forbes Asia’s Fab
50Company; Four
times in a row
3Times nearest
Competitor in India
4thLargest Paint
Company in Asia
14th Largest Coating
Company In the World
7000+
Employees
worldwide
Part of NSE Nifty
50
Asian Paints Group Today…
-
2.0
4.0
6.0
8.0
10.0
12.0
14.0
16.0
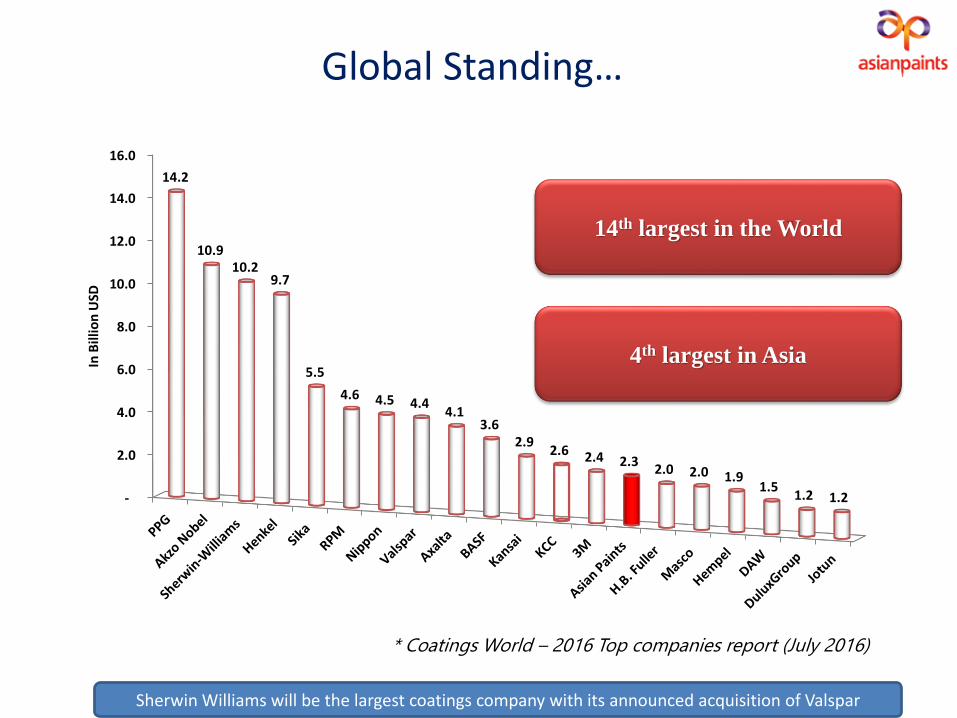
14.2
10.9 10.2
9.7
5.5
4.6 4.5 4.4 4.1
3.6 2.9
2.6 2.4 2.3 2.0 2.0 1.9
1.5 1.2 1.2
In B
illio
n U
SDGlobal Standing…
* Coatings World – 2016 Top companies report (July 2016)
4th largest in Asia
14th largest in the World
Sherwin Williams will be the largest coatings company with its announced acquisition of Valspar
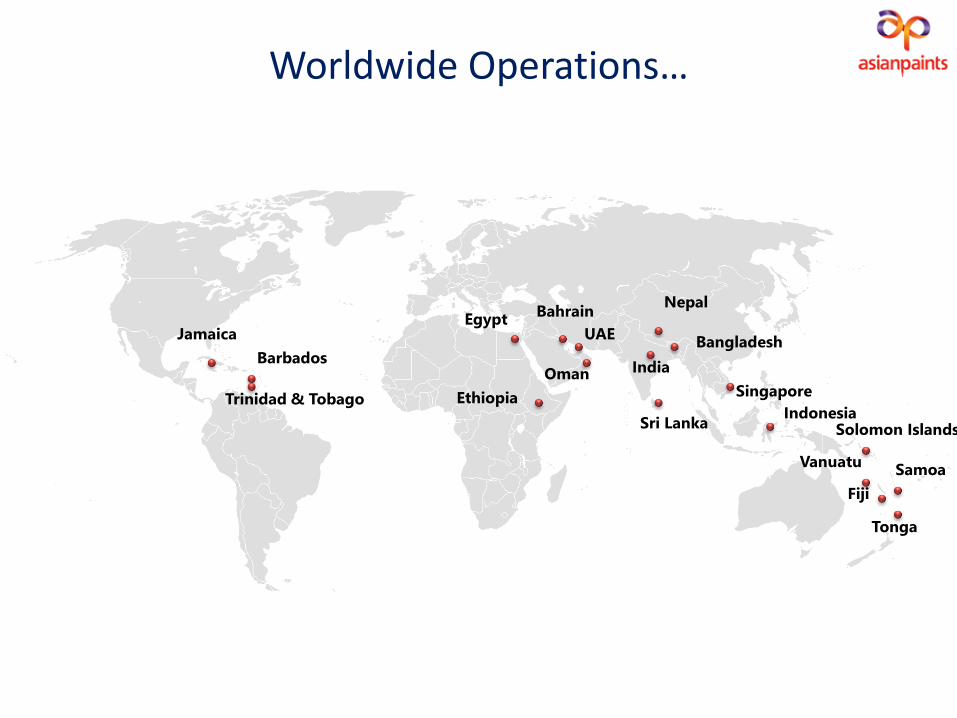
Worldwide Operations…
Jamaica
Barbados
Trinidad & Tobago
Egypt
Oman
Bahrain
UAE
Nepal
India
Sri Lanka
Bangladesh
Singapore
Solomon Islands
Vanuatu
Fiji
Samoa
Tonga
EthiopiaIndonesia
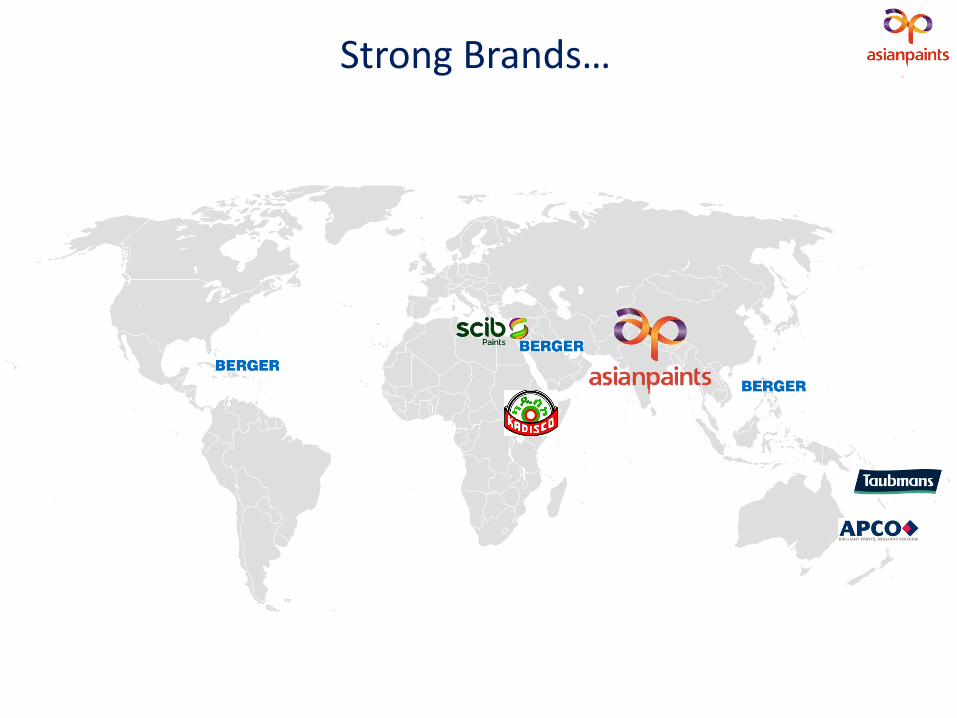
Strong Brands…
Aspiration…
“To be the fore runner of inspiring décor and to actively
empower customers to create their dream homes”
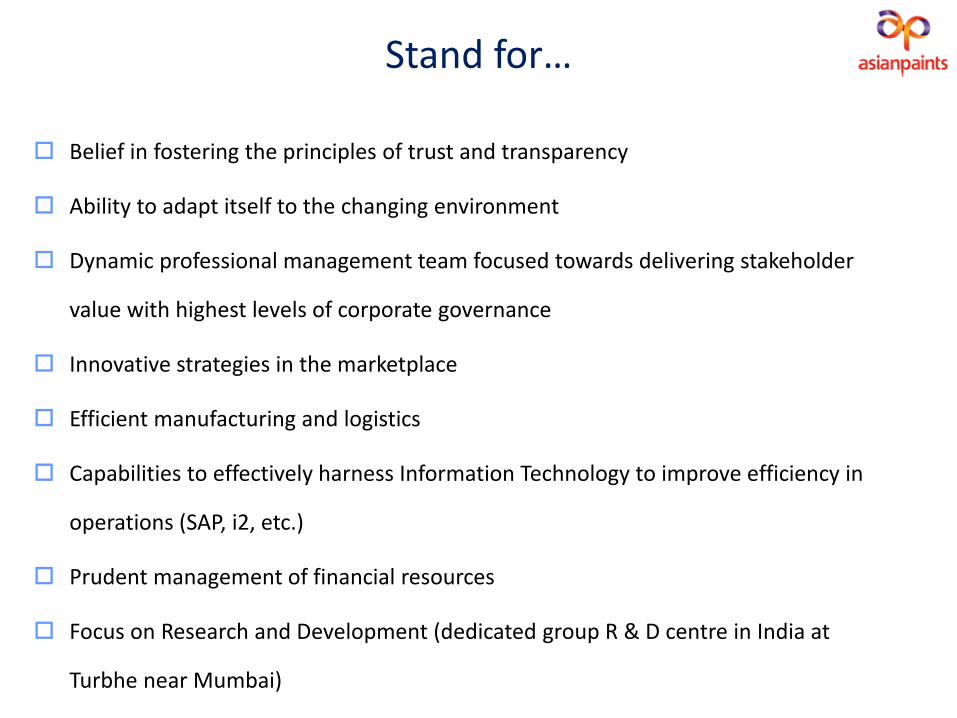
Belief in fostering the principles of trust and transparency
Ability to adapt itself to the changing environment
Dynamic professional management team focused towards delivering stakeholder
value with highest levels of corporate governance
Innovative strategies in the marketplace
Efficient manufacturing and logistics
Capabilities to effectively harness Information Technology to improve efficiency in
operations (SAP, i2, etc.)
Prudent management of financial resources
Focus on Research and Development (dedicated group R & D centre in India at
Turbhe near Mumbai)
Stand for…

Innovative Market place Strategies Small Packs
Exterior Paint Segment
Consumer and Dealer helpline
Colour Next (Prediction of Colour trends through in-depth research
Special effect and textured paints
Signature Stores / Colour Ideas store / AP Homes
Samplers
Beautiful Homes Guide
Water Proofing and Wallpaper business
Ezycolour Service brand
Home Solutions (Painting solution service)
Colour Consultancy @ Home
Adhesives
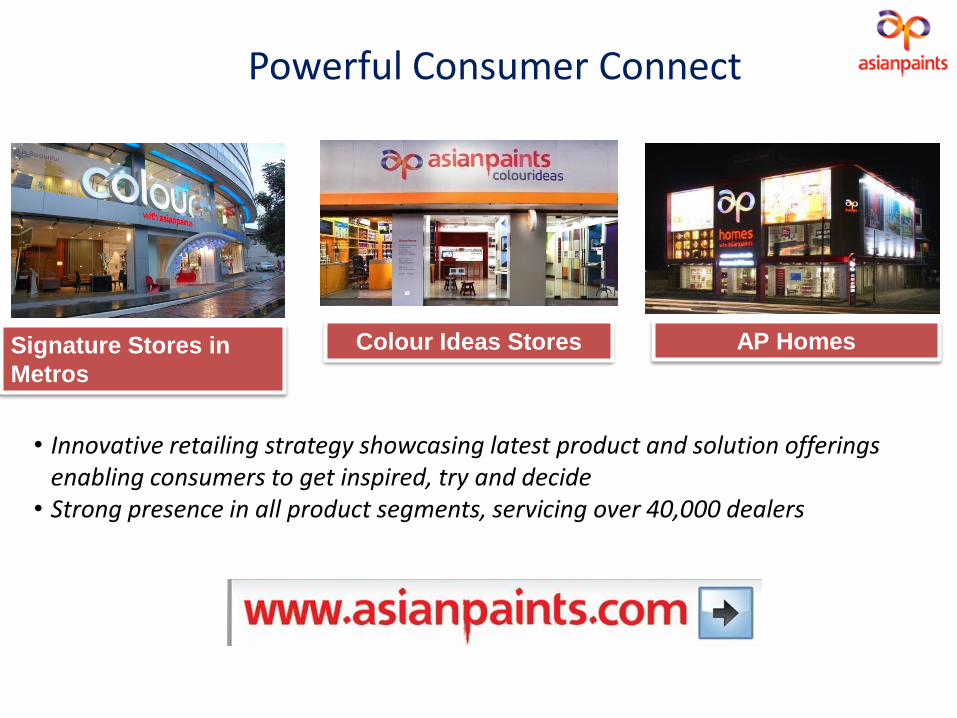
Powerful Consumer Connect
• Innovative retailing strategy showcasing latest product and solution offerings enabling consumers to get inspired, try and decide
• Strong presence in all product segments, servicing over 40,000 dealers
Signature Stores in
Metros
Colour Ideas Stores AP Homes

Robust Supply chain and IT State of the art Supply Chain system using cutting edge latest technology for efficient management
and execution
World Class, large manufacturing facilities with latest automation technologies
Largest single location paint manufacturing capacities at Rohtak (Haryana) and Khandala,
(Maharashtra).
Planning to set up new, fully-automated paint manufacturing facility at Mysuru and Vizag in South
India over the next 2-3 years
Strong distribution and logistic network across geographies using modern material storage and
handling technologies
Dedicated in-house IT team adding value to business process in terms of higher productivity, lower
costs, speed, consistency and standardization

Dedicated R&D
Dedicated Research and Technology facility at Turbhe
(Near Mumbai) with over 150 scientists
Supports company strategy around Technology
development, Sustainable new products, Green
products, Value re-engineering for productivity
improvement and cost optimization
Our scientists had won the Roon award in 2013 – one
of the highest technical achievements in the coatings
industry
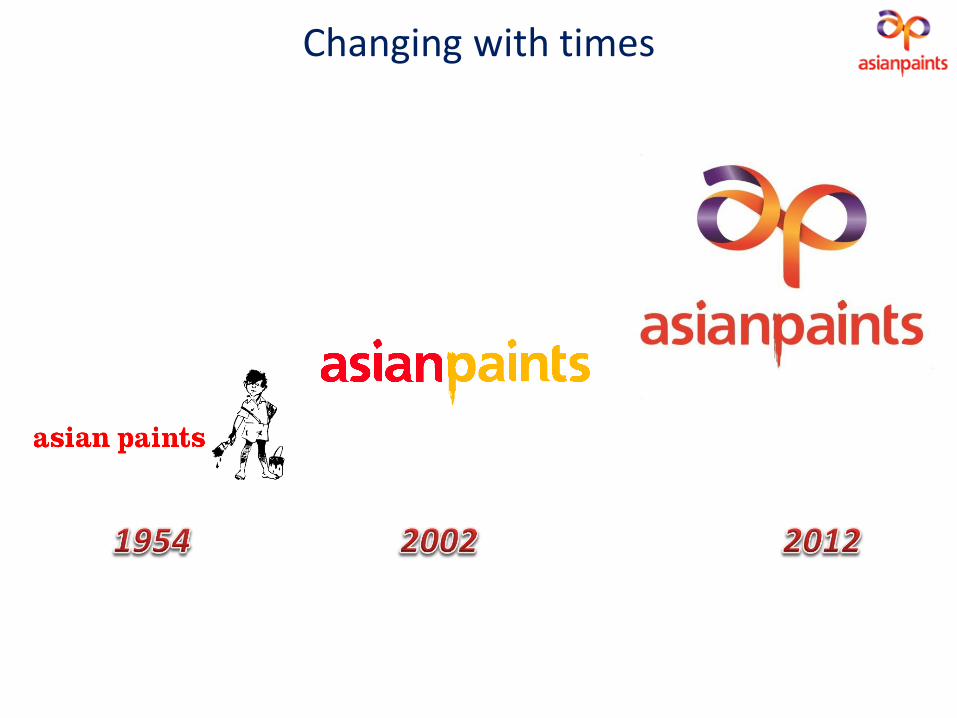
Changing with times
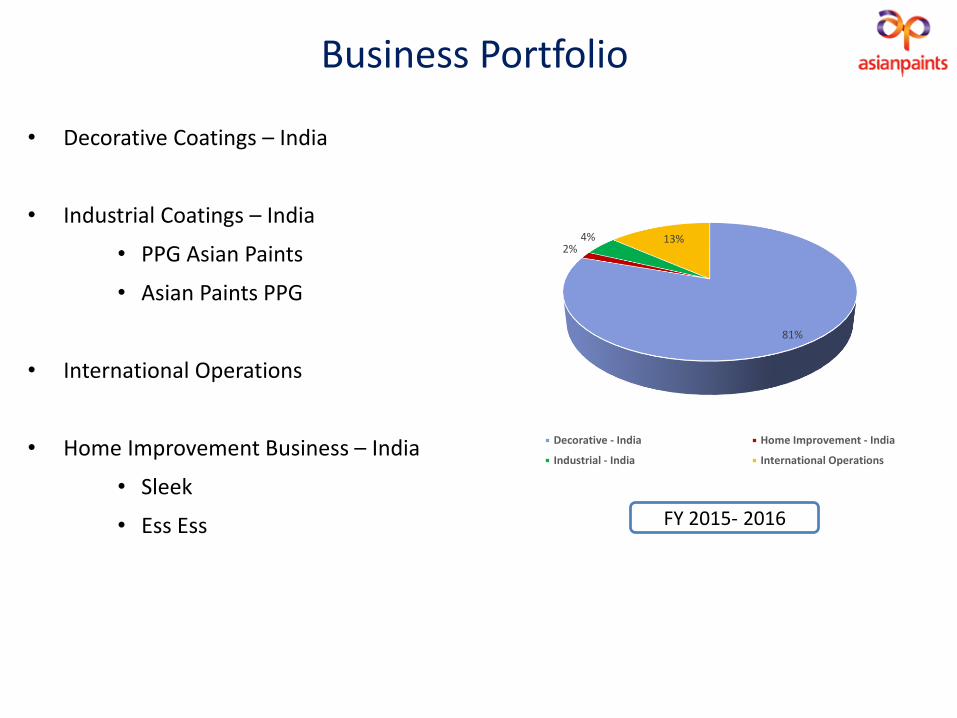
Business Portfolio
• Decorative Coatings – India
• Industrial Coatings – India
• PPG Asian Paints
• Asian Paints PPG
• International Operations
• Home Improvement Business – India
• Sleek
• Ess Ess FY 2015- 2016
81%
2%4% 13%
Decorative - India Home Improvement - India
Industrial - India International Operations
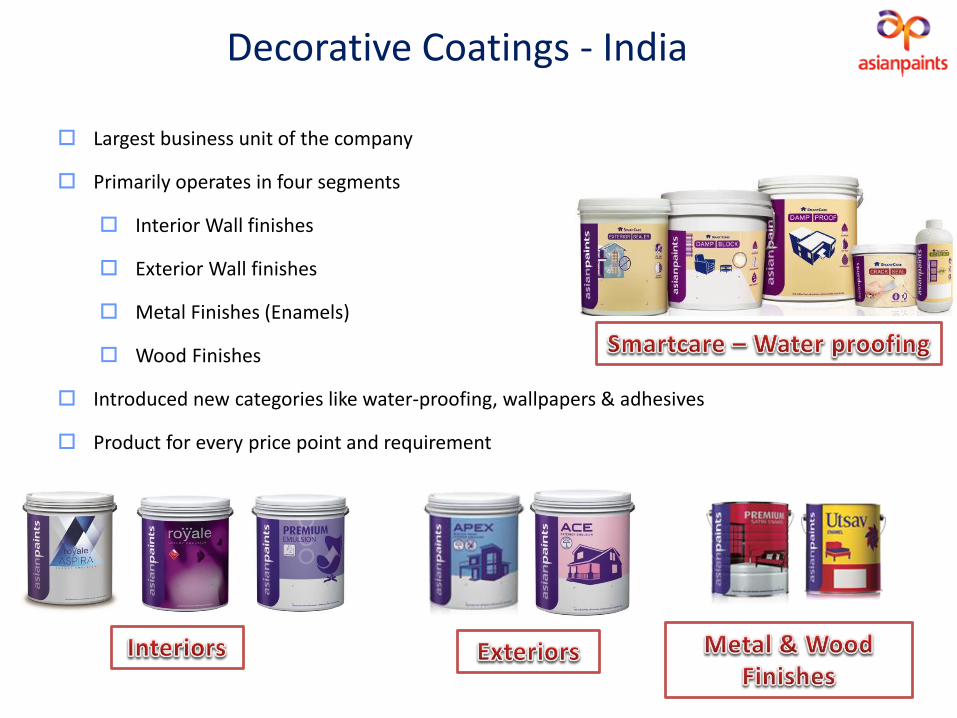
Decorative Coatings - India
Largest business unit of the company
Primarily operates in four segments
Interior Wall finishes
Exterior Wall finishes
Metal Finishes (Enamels)
Wood Finishes
Introduced new categories like water-proofing, wallpapers & adhesives
Product for every price point and requirement

Industrial Coatings - India
Asian Paints participates in the Industrial Coatings segment, through two 50:50 JVs with PPG Inc. of USA
PPG Asian Paints (For Auto Coatings)
The Auto segment is catered through our JV (PPG AP)
Second largest supplier to the auto segment in India
Now, the largest player in auto refinish segment, post acquisition of ICI India’s 2k auto refinish
business in 2007
Commissioned a 3,200 KL / year plant in Chennai, Tamil Nadu in 2008
Asian Paints PPG (For Non Auto Industrial Coatings)
Protective coatings, floor coatings, road marking paints and powder coatings segment catered to
by this JV
Services customers in the sectors of Infrastructure, Oil & Gas, Power Plants, White Goods, etc.

International Operations
Contributes about 13% to the group turnover
Began by establishing presence in Fiji in 1978
Presence in 18 countries spread over 4 regions
Focus on establishing presence and growing in high growth emerging markets
Looking for expansion in key markets of Africa and South East Asia
Acquired 51% stake in Kadisco Chemical Industry PLC, Ethiopia in Feb 2015
Setting up paint manufacturing facility at Indonesia
Enters into a Share Purchase Agreement with the existing shareholders of Causeway Paints Lanka (Private)
Limited, Sri Lanka, for acquisition of 100% stake
Transaction closure subject to certain conditions precedent and statutory approvals
Caribbean : Jamaica, Barbados and Trinidad & Tobago
Middle East & Africa : UAE, Bahrain, Oman, Egypt & Ethiopia
Asia : Nepal, Sri Lanka, Bangladesh, Singapore & Indonesia
South Pacific : Fiji, Tonga, Solomon Islands, Vanuatu & Samoa
11.0%
54.7%
27.9%
6.4%
Caribbean
Middle East & Africa
Asia
South Pacific
FY 2015-2016Net Sales Break-Up
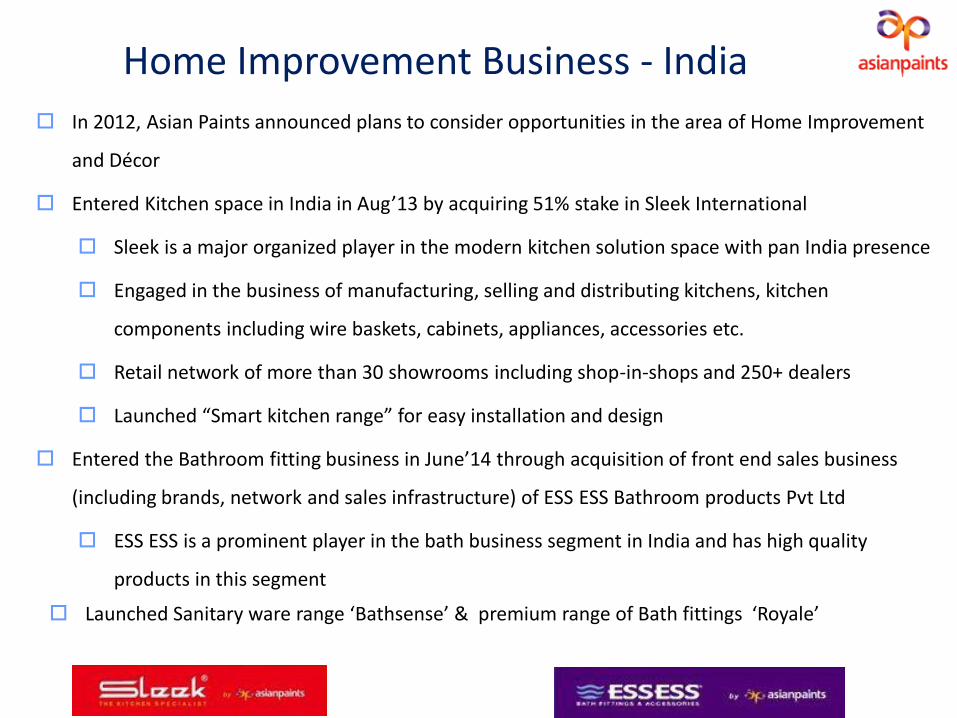
Home Improvement Business - India
In 2012, Asian Paints announced plans to consider opportunities in the area of Home Improvement
and Décor
Entered Kitchen space in India in Aug’13 by acquiring 51% stake in Sleek International
Sleek is a major organized player in the modern kitchen solution space with pan India presence
Engaged in the business of manufacturing, selling and distributing kitchens, kitchen
components including wire baskets, cabinets, appliances, accessories etc.
Retail network of more than 30 showrooms including shop-in-shops and 250+ dealers
Launched “Smart kitchen range” for easy installation and design
Entered the Bathroom fitting business in June’14 through acquisition of front end sales business
(including brands, network and sales infrastructure) of ESS ESS Bathroom products Pvt Ltd
ESS ESS is a prominent player in the bath business segment in India and has high quality
products in this segment
Launched Sanitary ware range ‘Bathsense’ & premium range of Bath fittings ‘Royale’
Chemicals
Asian Paints manufactures Phthalic Anhydride (PAN) and Pentaerythritol (Penta)
PAN manufactured in Gujarat and Penta in Tamil Nadu
More than 50% consumed internally
Contribution to the group’s revenue has been continuously decreasing
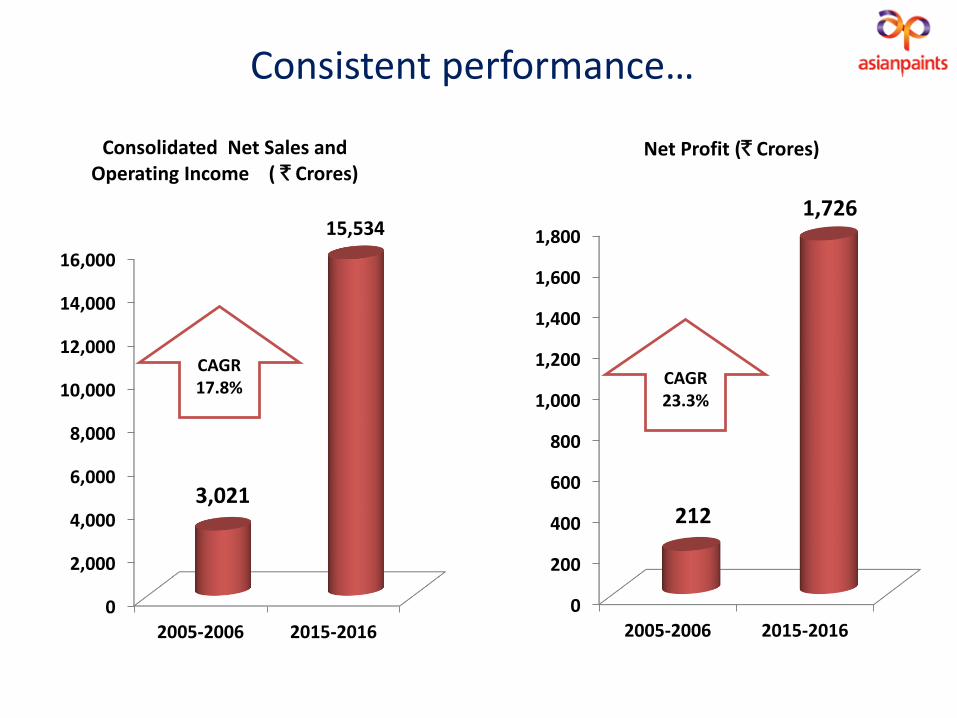
Consistent performance…
0
2,000
4,000
6,000
8,000
10,000
12,000
14,000
16,000
2005-2006 2015-2016
3,021
15,534
Consolidated Net Sales and Operating Income ( ` Crores)
CAGR 17.8%
0
200
400
600
800
1,000
1,200
1,400
1,600
1,800
2005-2006 2015-2016
212
1,726
Net Profit (` Crores)
CAGR 23.3%
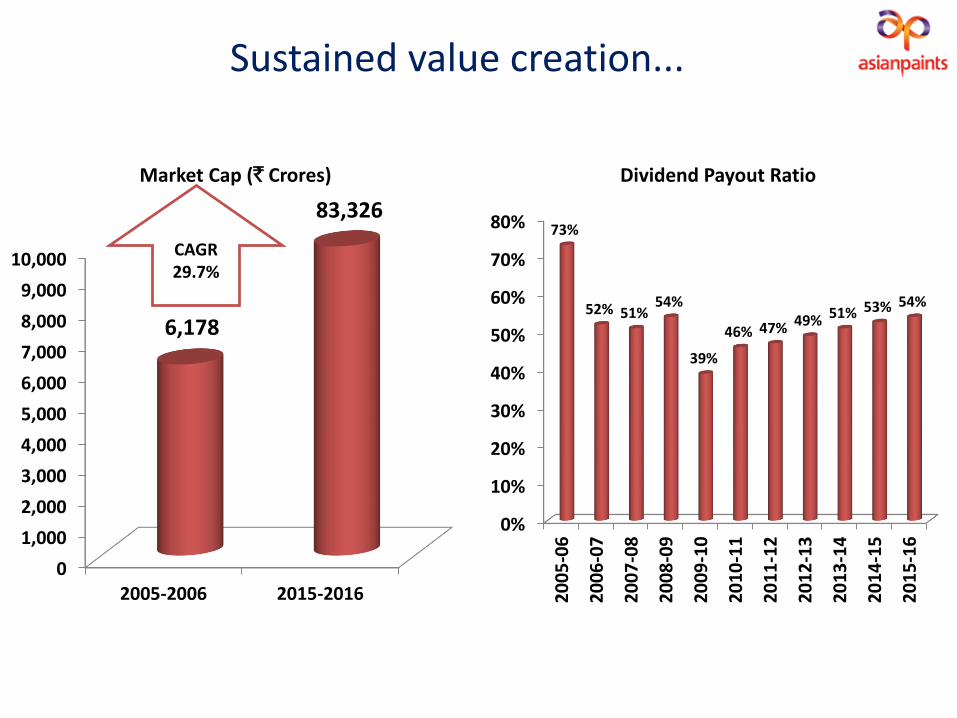
Sustained value creation...
0
1,000
2,000
3,000
4,000
5,000
6,000
7,000
8,000
9,000
10,000
2005-2006 2015-2016
6,178
83,326
Market Cap (` Crores)
CAGR 29.7%
0%
10%
20%
30%
40%
50%
60%
70%
80%
20
05
-06
20
06
-07
20
07
-08
20
08
-09
20
09
-10
20
10
-11
20
11
-12
20
12
-13
20
13
-14
20
14
-15
20
15
-16
73%
52% 51%54%
39%
46% 47% 49% 51% 53% 54%
Dividend Payout Ratio
Recent Accolades…
Rated as the 5th ‘Most valuable Brand’ in India – Sept 2015 (Compiled by marketing and brand
consultancy Millward Brown and WPP Group)
Included in Forbes India’s List of “Super 50 companies in India’ in 2016
Felicitated as one of the ‘MOST IMPACTFUL COMPANIES OF THE DECADE’ by CNBC Awaaz in Jan
2015
Included in Forbes Magazine's – ‘Asia's Fab 50’ List of cos 4 years in a row from 2011
Ranked as the 4th ‘Most Admired Company’ in the FMCG Sector by Fortune India – Aug 2014
Presented with the Asian Centre for Corporate Governance & Sustainability Award for the ‘Best
Governed Company’ in 2011
Asian Paints receives the ‘Best Audit Committee’ Award from the Asian Centre for Corporate
Governance & Sustainability in 2011

Economic Environment – Q3 FY17
Financial Performance – Q3 FY17
Business Review – Q3 FY17
Risks and Outlook
Presentation structure
Group Overview

Economic Environment
Challenging third quarter on the macro front – both domestic as well as international
Uncertain environment, on the back of implementation of the radical demonetization decision
Most external agencies have revised the growth forecasts downwards; but in our assessment,it is too early to have a fair picture of the impact.
Growth prospects for the global economy continues to be weak
Unexpected outcome of the US Presidential elections has raised lot of uncertainty in themarket
Financial markets were impacted too
Rupee saw depreciation of almost 2% during the quarter.
Economic Environment – Q3 & FY17
Financial Performance – Q3 FY17
Business Review – Q3 FY17
Risks and Outlook
Presentation structure
Group Overview

Financials – Q3 FY17 results
27

Gro
wth
ove
r La
st Y
ear
Standalone Revenue Growth Trend
28
The growth % in Q3FY17, Q2FY17 & Q1FY17 is as per the new Indian Accounting Standards (IND AS) which was adopted wef 1st April 2016 ; hence it not comparable with the numbers for the previous quarters

Economic Environment – Q3 FY17
Financial Performance – Q3 FY17
Business Review – Q3 FY17
Risks and Outlook
Presentation structure
Group Overview

Business Review : Q3 FY17
DECORATIVES BUSINESS
Decorative Paints business in India registered low single digit volume growth in the third quarter
The quarter began on a good note due to the festive season of Diwali.
However, demand was impacted to certain extent in the month of November on the back of demonetization, particularly in the North and Central parts.
Sales in South India especially Tamil Nadu were also impacted due to cyclone Vardah in the month of December
On a sequential basis, material prices continued to witness an upward trend in the quarter thereby squeezing margins to an extent.
No Price revision done in Q1 & Q2 FY17
Cumulative price decrease of 2% for FY16 against increase of 0.39% in FY15
Price decrease of 2% effective 26th Feb’16
Announced average price increase of 3% across products wef 1 Mar’17
Continued focus on network expansion and opening new ‘Colour Ideas’ store
36,000+ ‘Colour World’ machines and 300+ ‘Colour Ideas’ stores across the country
SmartCare range of waterproofing products continues to grow well
Business Review : Q3 FY17
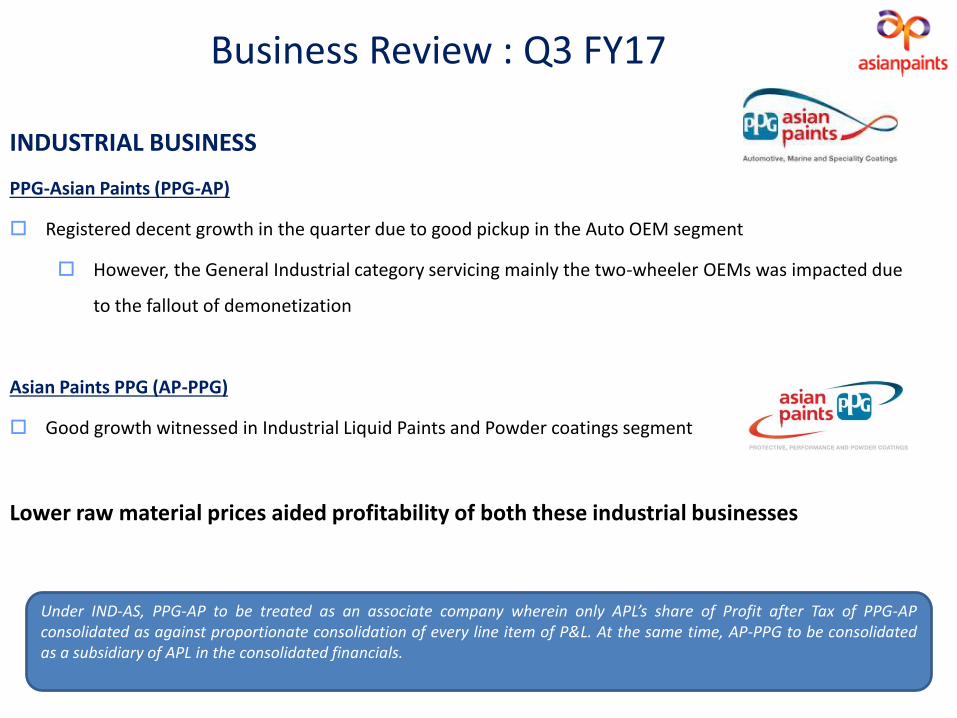
INDUSTRIAL BUSINESS
PPG-Asian Paints (PPG-AP)
Registered decent growth in the quarter due to good pickup in the Auto OEM segment
However, the General Industrial category servicing mainly the two-wheeler OEMs was impacted due
to the fallout of demonetization
Asian Paints PPG (AP-PPG)
Good growth witnessed in Industrial Liquid Paints and Powder coatings segment
Lower raw material prices aided profitability of both these industrial businesses
Under IND-AS, PPG-AP to be treated as an associate company wherein only APL’s share of Profit after Tax of PPG-APconsolidated as against proportionate consolidation of every line item of P&L. At the same time, AP-PPG to be consolidatedas a subsidiary of APL in the consolidated financials.

Business Review : Q3 FY17
INTERNATIONAL BUSINESS
The international business reported good numbers specifically aided by contribution from Nepal, Fiji andcertain units in the Middle East.
Egypt, one of our key markets, saw a decent growth but was impacted by the sharp devaluation of theEgyptian Pound.
Egypt implemented a flexible exchange rate regime effective 3rd Nov 2016 following which theEgyptian Pound experienced significant depreciation.
This has led to a recognition of loss on translation of the company’s receivable from SCIB-Egyptreducing the Other income in the current quarter and year by ` 16.4 crores.
Shortage of foreign exchange also continued to impact operations in Ethiopia.
Construction of the greenfield plant at Indonesia in progress
HOME IMPROVEMENT BUSINESS
The pace of growth for both - Kitchen business under ‘Sleek’ and the Bath business under ‘Ess Ess’, wasslower than earlier with some impact of delayed sales as a result of demonetization
We continue to enhance our distribution reach and drive operational efficiencies in both thebusinesses

Capex Total capex at Standalone level for FY17 estimated to be about ` 600 crores
Includes some spends on the two new paint manufacturing facility to be built at Vizag (Andhra Pradesh) and Mysuru (Karnataka)
Revision of the proposed paint manufacturing capacity of Vizag
The total capacity will be 5,00,000 KL/annum (4,00,000 KL announced earlier)
Investment outlay of ` 1785 crores (` 1750 crores announced earlier)
No change in Mysuru plant plan
6,00,000 KL plant with an investment of approximately ` 2300 crores
Both plants (Vizag & Mysuru) to come up in phases depending on future demand conditions
Capacity expansion and augmentation of Ankleshwar (Gujarat) plant
Planning to enhance Ankleshwar plant capacity from 130,000 KL/annum to 300,000 KL/annum
Augmenting manufacturing capacity of synthetic resins and emulsions from 32000 MT to 85000 MT(approx.)
Capacity expansion and augmentation to be completed over next 3-4 years depending on demand conditions
Approx. investment of ` 650 crores through internal accruals

Economic Environment – Q3 FY17
Financial Performance – Q3 FY17
Business Review – Q3 FY17
Risks and Outlook
Presentation structure
Group Overview
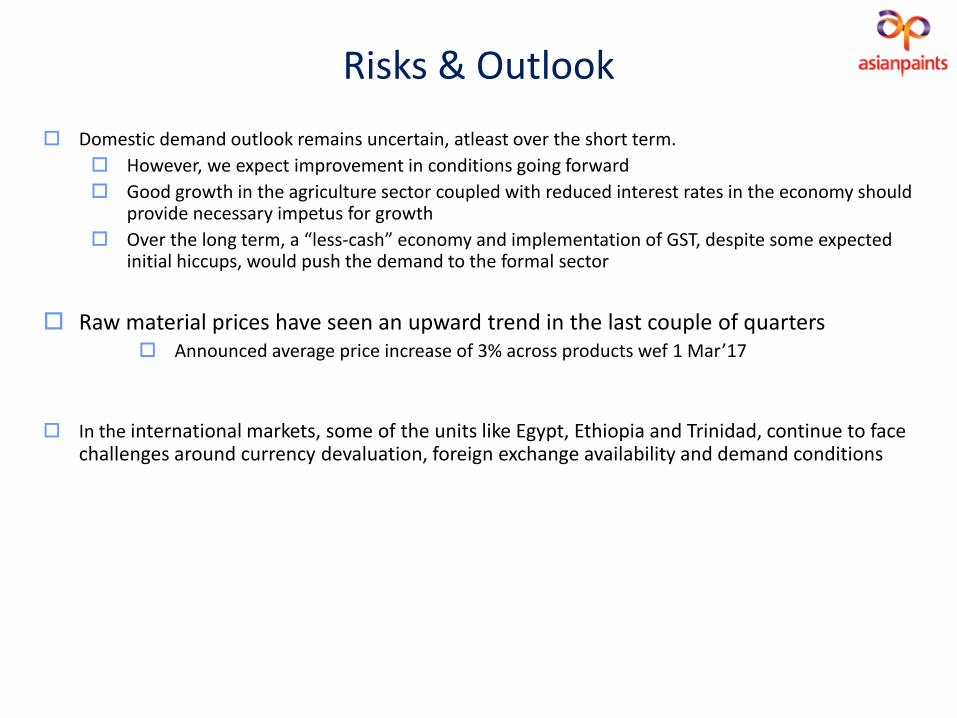
Risks & Outlook
Domestic demand outlook remains uncertain, atleast over the short term.
However, we expect improvement in conditions going forward
Good growth in the agriculture sector coupled with reduced interest rates in the economy should provide necessary impetus for growth
Over the long term, a “less-cash” economy and implementation of GST, despite some expected initial hiccups, would push the demand to the formal sector
Raw material prices have seen an upward trend in the last couple of quarters Announced average price increase of 3% across products wef 1 Mar’17
In the international markets, some of the units like Egypt, Ethiopia and Trinidad, continue to face challenges around currency devaluation, foreign exchange availability and demand conditions

Thank you
37
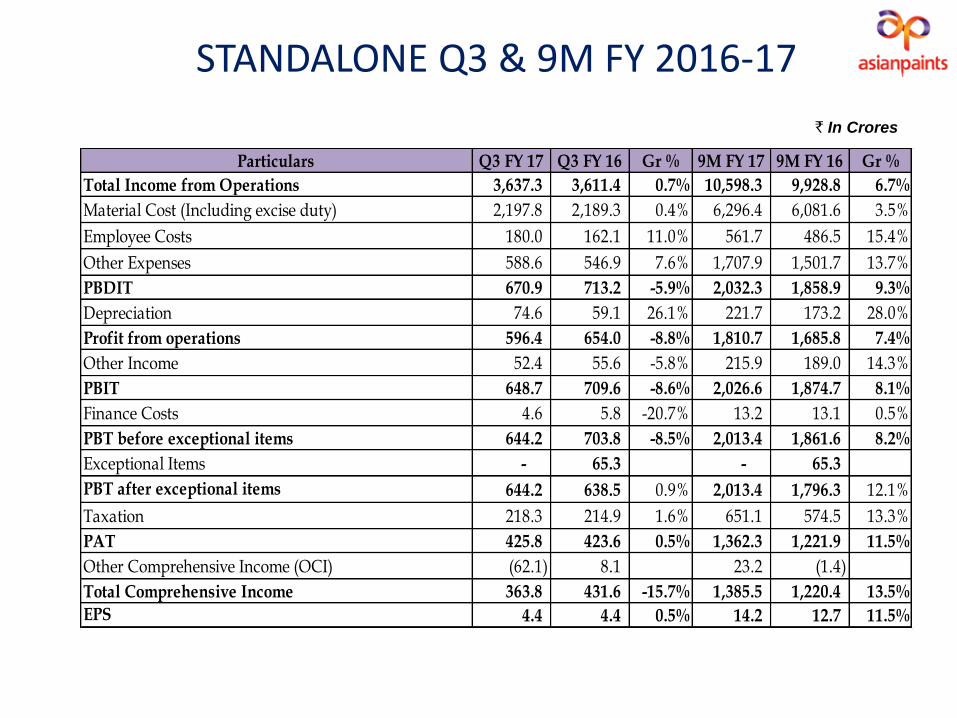
STANDALONE Q3 & 9M FY 2016-17
` In Crores
Particulars Q3 FY 17 Q3 FY 16 Gr % 9M FY 17 9M FY 16 Gr %
Total Income from Operations 3,637.3 3,611.4 0.7% 10,598.3 9,928.8 6.7%
Material Cost (Including excise duty) 2,197.8 2,189.3 0.4% 6,296.4 6,081.6 3.5%
Employee Costs 180.0 162.1 11.0% 561.7 486.5 15.4%
Other Expenses 588.6 546.9 7.6% 1,707.9 1,501.7 13.7%
PBDIT 670.9 713.2 -5.9% 2,032.3 1,858.9 9.3%
Depreciation 74.6 59.1 26.1% 221.7 173.2 28.0%
Profit from operations 596.4 654.0 -8.8% 1,810.7 1,685.8 7.4%
Other Income 52.4 55.6 -5.8% 215.9 189.0 14.3%
PBIT 648.7 709.6 -8.6% 2,026.6 1,874.7 8.1%
Finance Costs 4.6 5.8 -20.7% 13.2 13.1 0.5%
PBT before exceptional items 644.2 703.8 -8.5% 2,013.4 1,861.6 8.2%
Exceptional Items - 65.3 - 65.3
PBT after exceptional items 644.2 638.5 0.9% 2,013.4 1,796.3 12.1%
Taxation 218.3 214.9 1.6% 651.1 574.5 13.3%
PAT 425.8 423.6 0.5% 1,362.3 1,221.9 11.5%
Other Comprehensive Income (OCI) (62.1) 8.1 23.2 (1.4)
Total Comprehensive Income 363.8 431.6 -15.7% 1,385.5 1,220.4 13.5%
EPS 4.4 4.4 0.5% 14.2 12.7 11.5%

38
CONSOLIDATED Q3 & 9M FY 2016-17
` In Crores
Particulars Q3 FY 17 Q3 FY 16 Gr % 9M FY 17 9M FY 16 Gr %
Total Income from Operations 4,354.0 4,245.2 2.6% 12,668.5 11,787.9 7.5%
Material Cost (Including excise duty) 2,621.5 2,581.4 1.6% 7,542.0 7,227.9 4.3%
Employee Costs 264.3 241.8 9.3% 821.1 721.8 13.8%
Other Expenses 691.8 636.5 8.7% 1,995.9 1,766.1 13.0%
PBDIT 776.3 785.5 -1.2% 2,309.6 2,072.1 11.5%
Depreciation 85.5 69.4 23.2% 255.4 203.4 25.5%
Profit from operations 690.8 716.1 -3.5% 2,054.2 1,868.7 9.9%
Other Income 41.5 42.0 -1.3% 192.5 165.8 16.1%
PBIT 732.3 758.1 -3.4% 2,246.7 2,034.5 10.4%
Finance Costs 9.2 7.6 20.5% 21.6 25.8 -16.3%
PBT before Exceptional Item 723.1 750.5 -3.6% 2,225.1 2,008.7 10.8%
Exceptional Item - 52.5 ##### - 52.5 -100.0%
PBT after Exceptional Item 723.1 698.0 3.6% 2,225.1 1,956.3 13.7%
Taxation 246.5 227.4 8.4% 727.5 616.5 18.0%
PAT 476.6 470.6 1.3% 1,497.6 1,339.8 11.8%
Share in profit of associate 12.7 11.4 11.3% 39.0 27.5 42.0%
Net Profit after taxes and shares in profit of associate 489.3 482.0 1.5% 1,536.6 1,367.3 12.4%
Minority interest 23.1 13.0 78.1% 59.4 40.9 45.5%
PAT after Minority interest 466.2 469.1 -0.6% 1,477.2 1,326.5 11.4%
Other Comprehensive Income (OCI) (149.6) 25.0 ##### (68.2) 37.6 -281.4%
Total Comprehensive Income 339.7 507.0 -33.0% 1,468.4 1,404.9 4.5%
EPS 4.9 4.9 -0.6% 15.4 13.8 11.4%
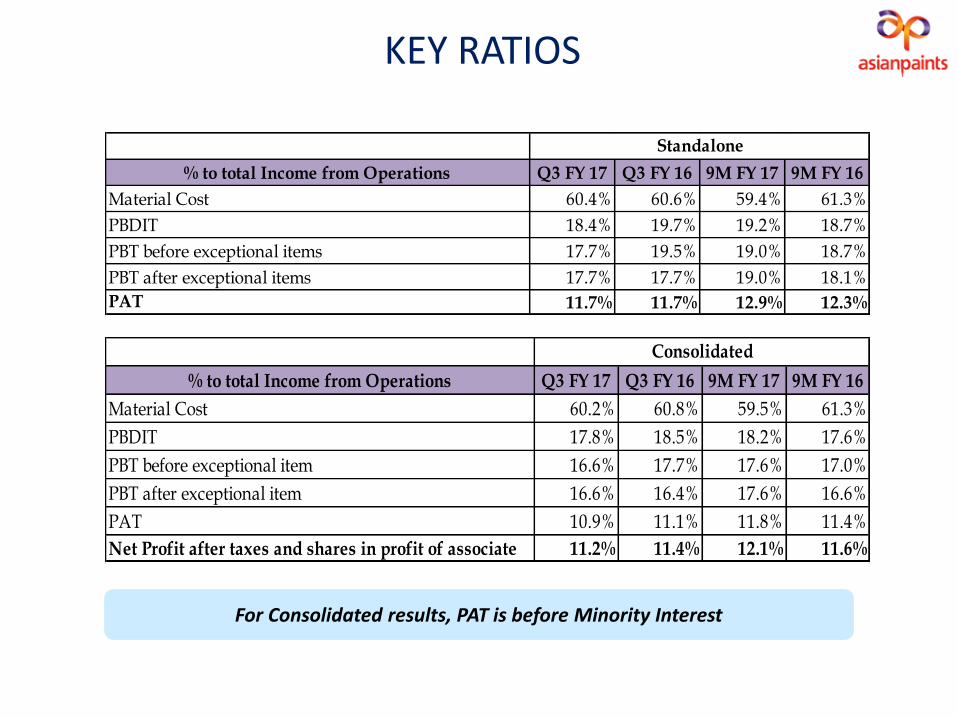
KEY RATIOS
39
For Consolidated results, PAT is before Minority Interest
% to total Income from Operations Q3 FY 17 Q3 FY 16 9M FY 17 9M FY 16
Material Cost 60.2% 60.8% 59.5% 61.3%
PBDIT 17.8% 18.5% 18.2% 17.6%
PBT before exceptional item 16.6% 17.7% 17.6% 17.0%
PBT after exceptional item 16.6% 16.4% 17.6% 16.6%
PAT 10.9% 11.1% 11.8% 11.4%
Net Profit after taxes and shares in profit of associate 11.2% 11.4% 12.1% 11.6%
Consolidated
% to total Income from Operations Q3 FY 17 Q3 FY 16 9M FY 17 9M FY 16
Material Cost 60.4% 60.6% 59.4% 61.3%
PBDIT 18.4% 19.7% 19.2% 18.7%
PBT before exceptional items 17.7% 19.5% 19.0% 18.7%
PBT after exceptional items 17.7% 17.7% 19.0% 18.1%
PAT 11.7% 11.7% 12.9% 12.3%
Standalone