i/i UNCLASSIFIED EEEEEEEEEEllE NARVAL JAN RESEARCH … · D 1473 sITI o F I NOV 06 IS OSSOL, TE S/N...
20
HD-AlEA 6 UHF (ULTRA HIH FREQUENCY) PROPAGATION MEASUREMENTS(U) i/i NARVAL RESEARCH LAB NASHINGTON DC F D QUEEN ET AL. 31 JAN 84 NRL-MR-5271 UNCLASSIFIED F/G 20/14 NL EEEEEEEEEEllE EIEImE
Transcript of i/i UNCLASSIFIED EEEEEEEEEEllE NARVAL JAN RESEARCH … · D 1473 sITI o F I NOV 06 IS OSSOL, TE S/N...
HD-AlEA 6 UHF (ULTRA HIH FREQUENCY) PROPAGATION MEASUREMENTS(U) i/iNARVAL RESEARCH LAB NASHINGTON DC F D QUEEN ET AL.31 JAN 84 NRL-MR-5271
UNCLASSIFIED F/G 20/14 NLEEEEEEEEEEllEEIEImE
I Q LA I
'liaii-m
11.1164L
MICROCOPY RESOLUTION TEST CHARTXATIW4AI UREAUJ OF StANDARDS-1963-A
lis
NRL Memorandum Report 5271
UHF Propagation Measurements
F. D. QUEEN, P. A. MINTHORN, A. E. MARCH,AND D. C. HUT
Target Characteristics BranchRadar Division
IM
0January 31, 1984
NAVAL RESEARCH LABORATORYWashington, D.C.
Approved for public release; distribution unlimited.
DJICFILE COPY 9
SECURITY CLASSIFICATION OF !MIS PAGE 'Wen DeI E nered)
REPORT DOCUMENTATION PAGE READ !NSTRUCTIONSBEFORE COMPLETING FORM
I REP2RT NUMSER 2. GOVT ACCC"5NO IIENT'S CATALOG NUMOER
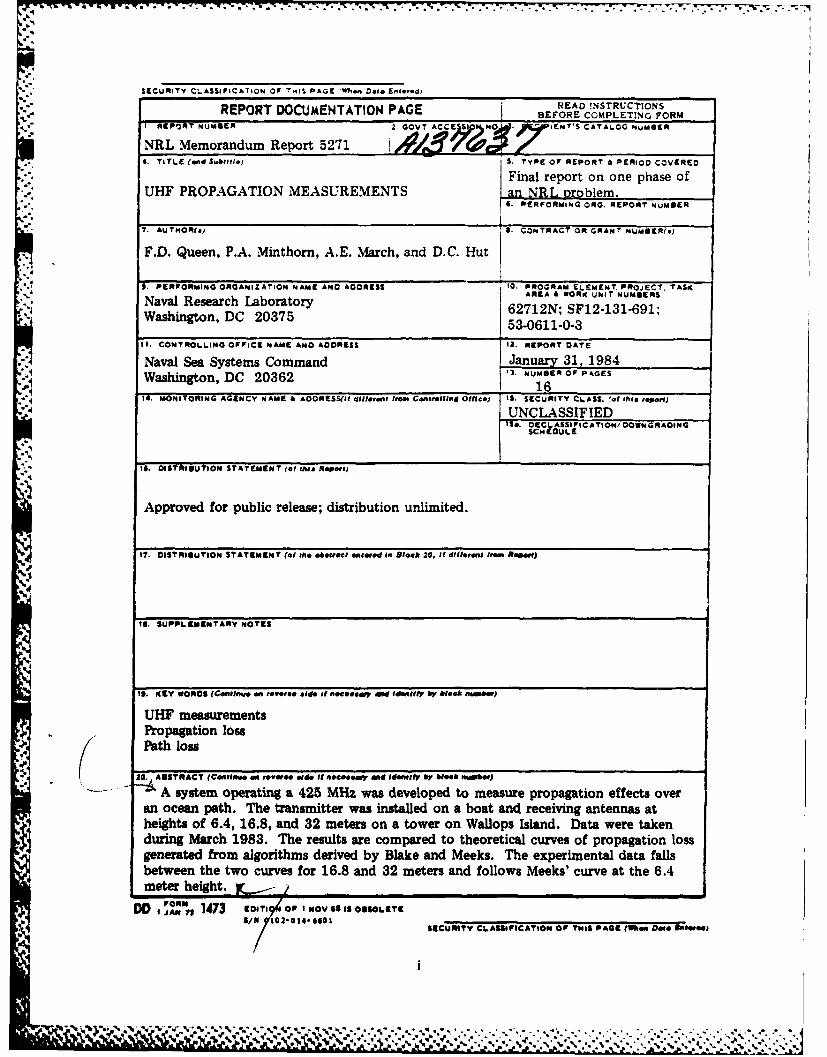
NRL Memorandum Report 5271 _ ___._____
4. TITLE (and Subtitte) S. TYPE OF REPORT a PERIOD COVERED
Final report on one phase ofUHF PROPAGATION MEASUREMENTS an NRL problem.
6. PERFORMING ORG. REPORT %UMIER
7. AUTNOR', 6- CONTRACT OR GRANT NUMSEftR )
F.D. Queen, P.A. Minthorn, A.E.Mach, and D.C. Hut
I. PERFORMING ORGANIZATION NAME ANO ADDRESS 10. PROGRAM ELEMENT PROJECT. TASK
AREA A dORI, UN IT NUMOERSNaval Research Laboratory 62712N; SF12-131-691;Washington, DC 20375 5 1- 3r "* 53-0611-0-3
I. CONTROLLING OFFICE NAME ANO ADDRESS 2Z. REPORT DATE
Naval Sea Systems Command January 31, 1984D 20362 3. NUMOER OF PAGES.ashigton DC 036216
4. MONITORING AGENCY NAME A AOORESS(II different from CControlllng Ofi|e) IS. 16 of I9 report;
UNCLASSIFIEDIS&. DECLASSIFICATIONi DOWNGRAOING
SCHEDULE
16. DISTRIOUTION STATEMENT (of tlh Report)
Approved for public release; distribution unlimited.
I,. COSTRIOUTION STATEMENT (at the abestect allered In block 20. It diftermit trem AeH)
116. SUPPLEMENTARY NOTES
It. IVEY WORDS (Colne on revre, side if ntessa, dad idenfy by bloak m )bet)
UHF measurementsPropagation lossPath loss
20. AESTRACT (Cmlinue W roe*W side It necesBary dad IdeIify by block nuinoee)
-- A system operating a 425 MHz was developed to measure propagation effects overan ocean path. The transmitter was installed on a boat and receiving antennas atheights of 6.4, 16.8, and 32 meters on a tower on Wallops Island. Data were takenduring March 1983. The results are compared to theoretical curves of propagation lossgenerated from algorithms derived by Blake and Meeks. The experimental data fallsbetween the two curves for 16.8 and 32 meters and follows Meeks' curve at the 6.4meter height. y _ • I
D 1473 sITI o F I NOV 06 IS OSSOL, TES/N 014* 601 SECURITY CLASIFICATION OF THIS PAGE (SWhge Dole Bitter")
% . % % !. . --- .

CONTENTS
INTRODUCTION .................................................. 1
THE MEASUREMENT SYSTEM ...................................... 1
ACQUISITION OF DATA ............................................ 2
RESULTS ........................................................ 2
CONCLUSIONS .................................................... 3
ACKNOWLEDGMENTS .............................................. 4
REFERENCES .................................................... 4
APPENDIX A - DETERMINATION OF THE FREE SPACE RANGE OF THEMEASUREMENT SYSTEM ........................................ 12
APPENDIX B - DISCUSSION OF SIGPLT PROGRAM .................... 13
Accession For
NTIS GRAiikDTIC TAB 0Unannounoed 0Justifioatio
Avi -and/or-
%- .%

UHF PROPAGATION M.EASUREMENTS
INTRODUCTION
A measurement program was carried out to verify the accuracy ofpropagation loss predictions at a frequency of 425 MHz. For this experiment,primary interest was in the intermediate region (near the horizon), between
*the interference and diffraction regions. There has been uncertaintyregarding the validity of estimates of propagation loss in the intermediateregion due to the necessity of interpolating between calculated values inthe interference and diffraction recions. Depending on the geometry of thesituation, the nearest points which could be calculated with assurance, andwith ease in the interference and diffraction regions might be separated byseveral nautical miles, so that over a large range interval near the radarhorizon, estimates were only obtained by interpolation. During the courseof the investigation, the writers became aware of an algorithm described byM. L. Meeks [1], which permits accurate calculations to be made more easilyat much nearer ranges in the diffraction region and even into the inter-mediate region. Thus, the range interval in which interpolation is requiredis reduced or eliminated. Experimental data are compared with calculatedvalues obtained using the Meeks approach and using a simpler computer pro-gram developed by L. V. Blake [2].
The measurements covered a one way path over the ocean. The trans-mitter was installed on a 65 foot Navy patrol boat and receiving antennaswere installed on a tower on Wallops Island at heights of 6.4, 16.8, and32K (21, 55, and 105 feet). The tower was located 144M (475 feet) fromthe edge of the water.
The experiment was planned to cover ranges from several miles fromshore to a distance where all signals were lost. Because the LORAN Cequipment on the boat was inoperative, it was not possible to obtain rangeInformation far beyond the horizon. Range measurements obtained wereprovided by NASA using radar tracking of a C-band beacon installed on the
* boat.
THE MEASUREMENT SYSTEM
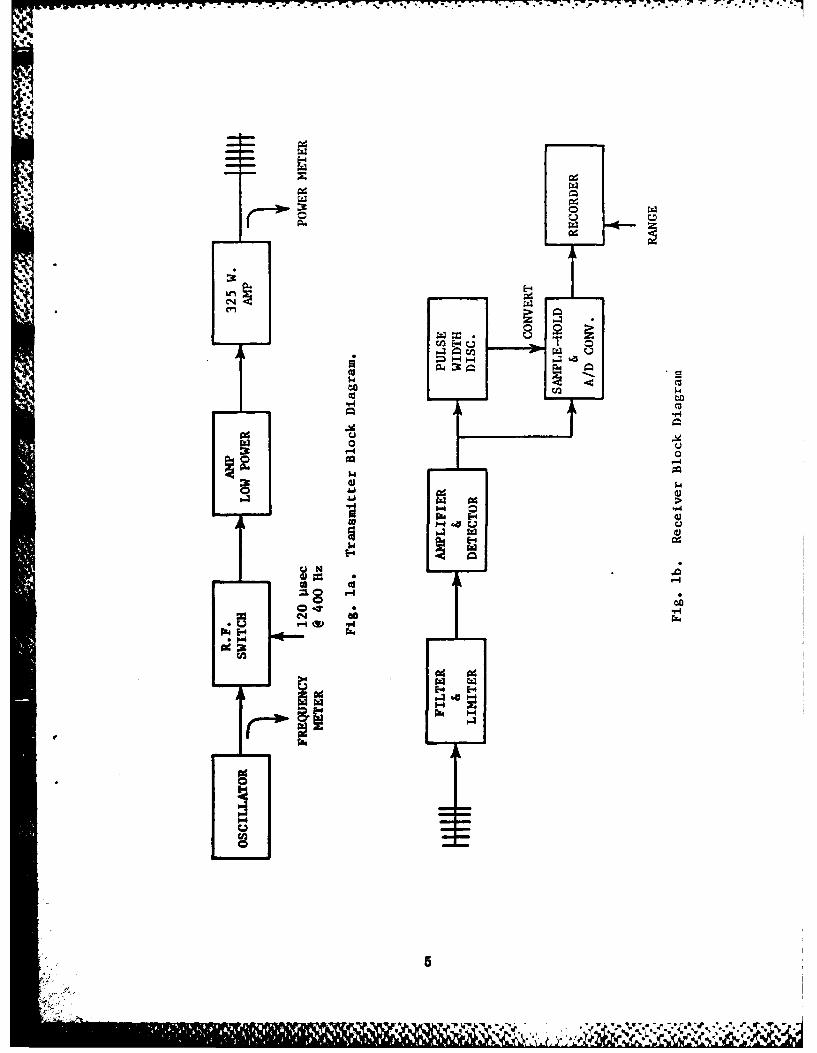
The system operated at 425 MHz and horizontal or vertical polarizationcould be used. The transmitter block diagram is showr. in Figure la. TheR7 switch passed a 120 uisec sample of the CW oscillator at a 400 Hz rate.The output amplifier was capable of 300 Watts peak output, but a 2.5 dBloss In the cable to the antenna was incurred because of the below deck
Ibuu pp ~owod November 8, 1988.
- 4. . A. - A..*- -,
transmitter location. The antenna was a six element Yagi with a gain of8 dB and a 60 degree beamwidth. The height of the antenna above the waterwas 4 meters (13 feet).
Antennas identical to the transmitting antenna were used at thereceiving site. A diagram of one of the receivers is shown in Figure lb.The leading edge of the detected pulse envelope keyed a pulse width dis-crimination circuit. Only pulses of duration greater than 80 P sec couldpass to the recording system.
ACQUISITION OF DATA
Data were taken on March 29, 30, and 31. Data were recorded fromoscilloscope readings during the data run. During the measurement period,tides were low in the late afternoon (3:00 PM). This restricted dataacquistion times because the boat had to be at the dock before low tide orwait until well after dark, which the boat crew was reluctant to do.
A total of four data runs were obtained. On the first day waves ofup to nine feet were encountered and it was difficult to keep the boatoriented so that the transmit antenna was aimed toward the receiving anten-nas. On the second and third days the wave heights were in the three-footrange.
The maximum ranges obtained with the beacon track were 22.7 n.mi. on
day one, 16 n.mi. on day two, and 18.8 n.mi. on day three.
RESULTS
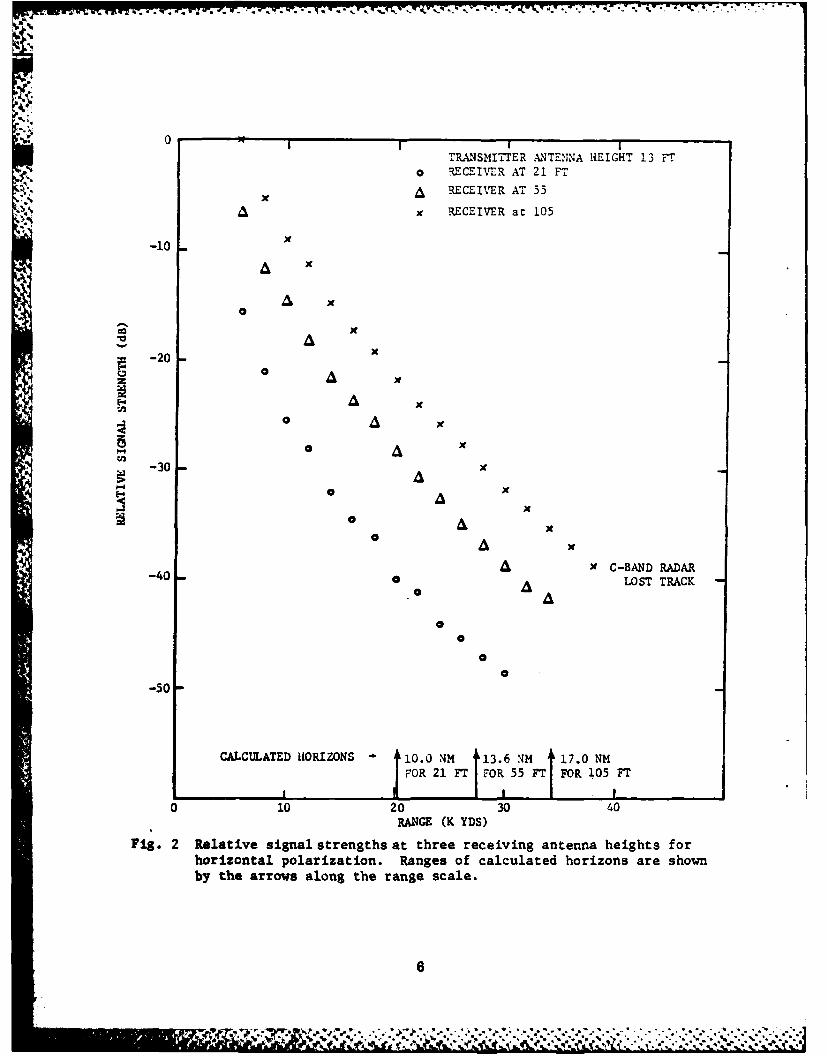
The data for the outbound portion of the data run taken on the thirdday are shown in Figure 2 for the three antenna heights. The signal levelis decreasing with R-4 (one way path) to a range of approximately 18.3 kM(20 kyds). The exponent increases to -4.8 at the maximum range of measure-ment which is about 1.8 n.mi. beyond the calculated horizon.[31
The goal of the measurement was to compare the experimental resultsto those predicted. A plot of signal strength versus range (called SIGPLT)was generated using a computer program by Blake [2]. The program calculatesthe pattern-propagation factor F in the radar equation (modified here for theone-way path) which accounts for the fact that propagation between the twoantennas may not be free-space propagation.* F is determined for eachrange from inputs of the antenna heights, the frequency, polarization, andwave height. The signal levels are then computed from the equation
SdB = 20 log (FRo/R)
*A complete discussion of this subject is contained in Ref. 4
2
where R0 is the free space range. The calculation is performed to a rangewhere the difference in path length between the direct and reflected waveis a quarter-wavelength. For the 70 cm wavelength, the range is 0.78 n.mi.To obtain signal levels between this range and a range in the diffractionregion where the signal level can be calculated, an interpolation is per-formed.
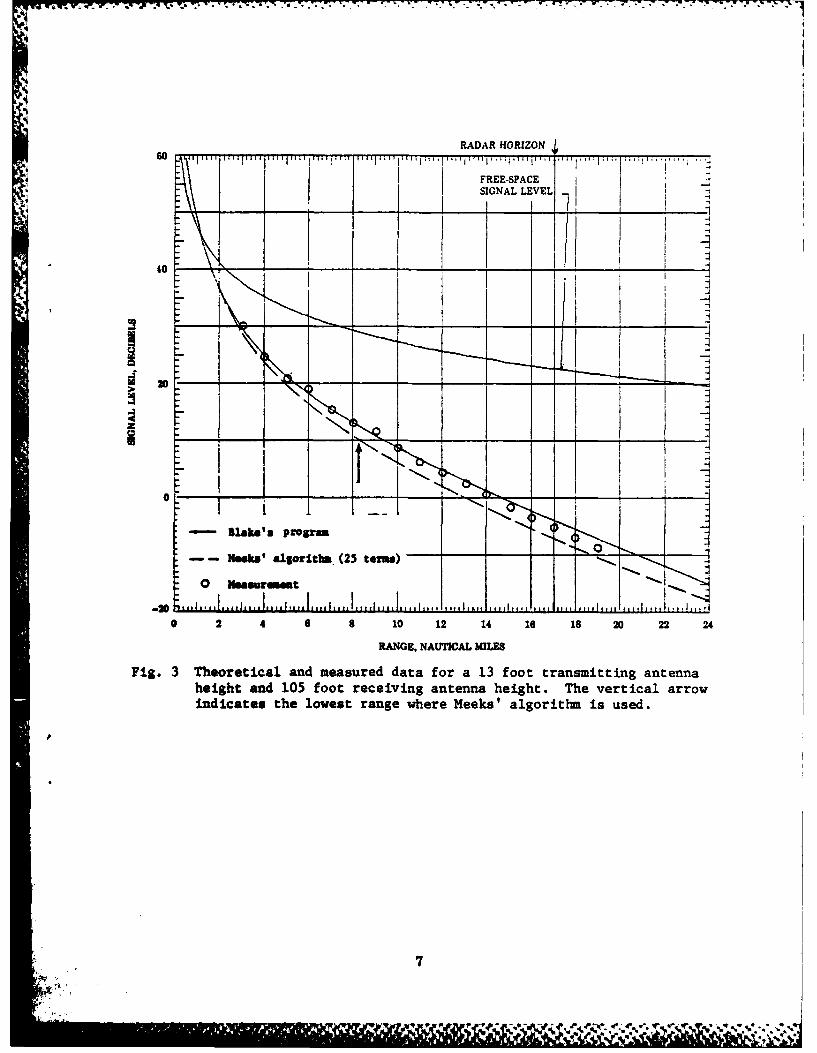
One of the inputs to SIGPLT is the f ree space range. The free spacerange of the experimental system was determnined by laboratory measurementas 230 n.ini. (Appendix A). To relate the curves of Figure 2" to Blake'scurve this free space range is used. The 0-dB signal level in Figure 3corresponds to minimum detectable signal which is the signal in free-spaceat the maximum range of the system. In calculating the maximum range ofa system, a visibility factor (signal-to-noise ratio) is specified. If oneassumes a probability of detection of 0.5 and a false alarm rate of 10-6 thevisibility factor is 11.2 dB for a single pulse (Ref. 4 p. 2-19). Therefore,for a plot of the experimental system with a free space range of 230 n.mi.,the range at which a curve of Figure 2 should cross the 0-dB level is therange at which a signal 11.2 dB above noise was received during the measure-ments. For the 32M (105 ft) antenna height the range for the above conditionwas 14.2 n.mi. Finally, to plot the curves of Figure 2, which are in rela-tive signal strength, on the SIGPLT's of Figures 3, 4, and 5, the signallevel at 14.2 n.mi. was read from Figure 2. This value of -30.4 dB thencorresponds to 0 dB on SIGPLT and all relative values must be increased by30.4 dB. The values thus obtained are plotted as circles on Figures 3, 4,and 5.
Included on the figures is a curve based on application of thealgorithm by Meeks. For these curves, represented by the dashed line, theinterference region was calculated as is done for SIGPLT to the point inrange where the path difference between the direct and reflected waves is aquarter wavelength. The diffraction and intermediate regions are calculatedusing Meeks program to a range where the series does not converge. (Theseries involves Airy functions of complex argument). The signal level fromthe last range of series convergence to the range where the interferencecalculations was terminated is found by interpolation (Appendix B). As thecalculation Is performed for decreasing range, the line of sight betweenthe target (in this case a receiving antenna) and the transmitter clearsthe earth's curvature. Meeks points out that the series may convergeslowly or perhaps diverge when the above condition is reached.
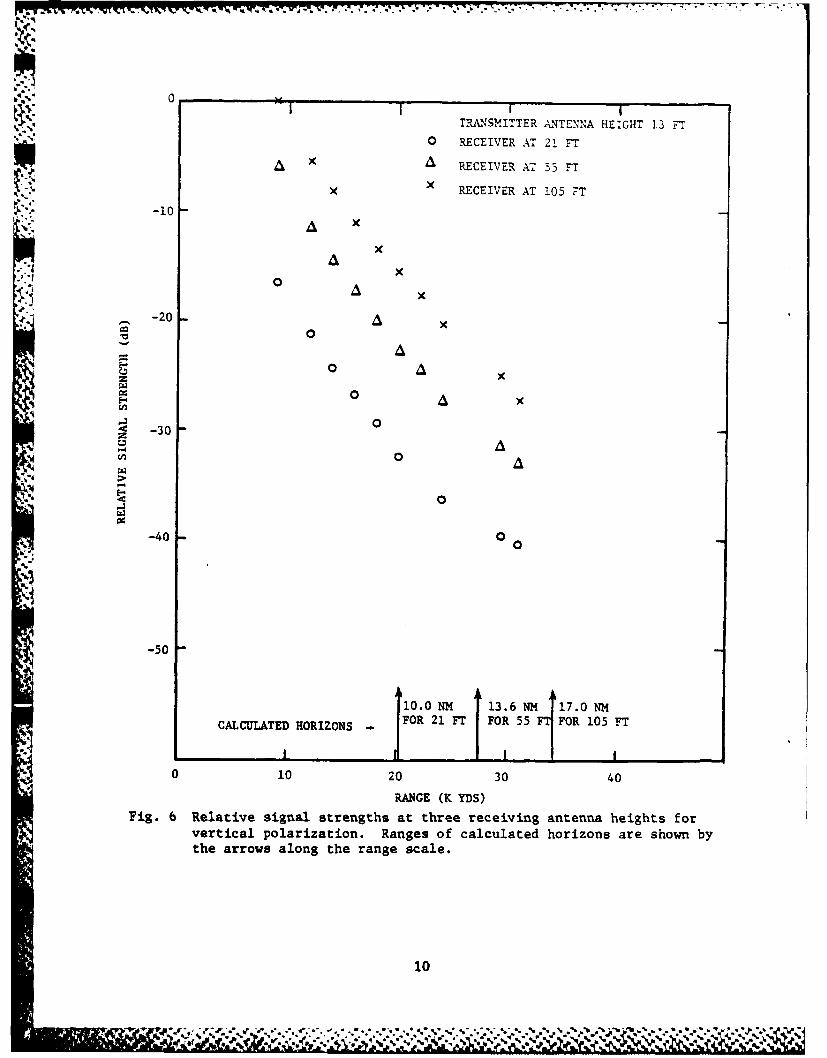
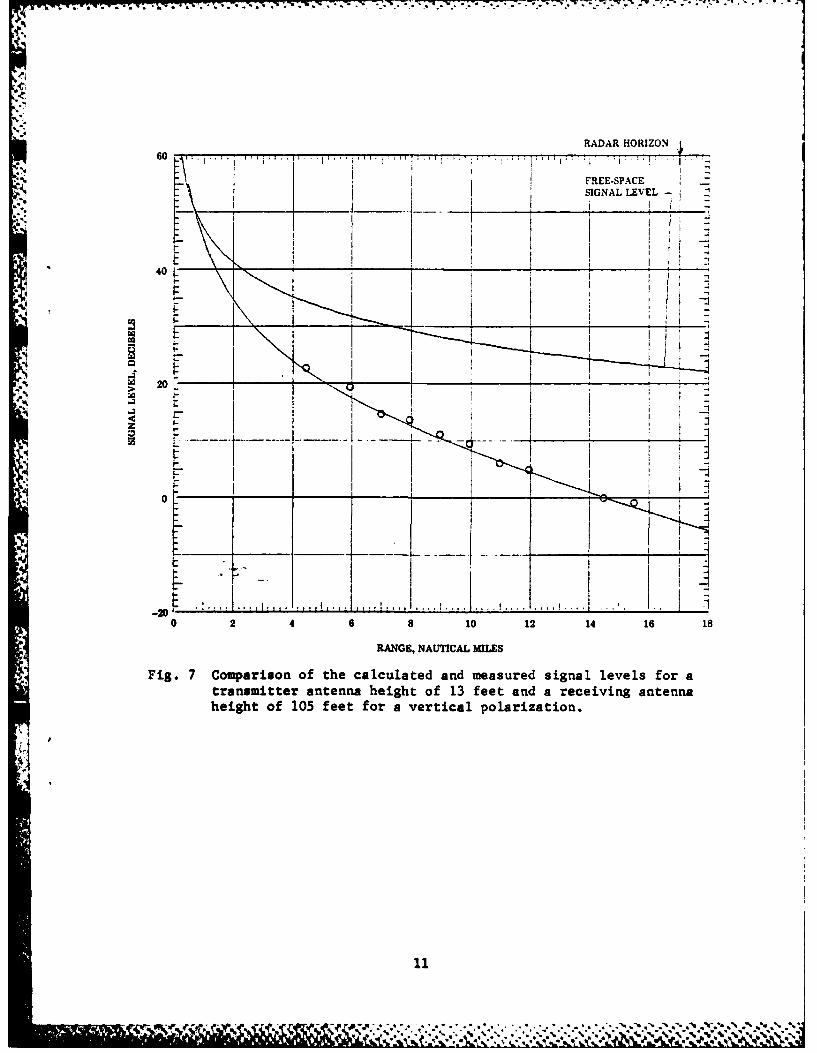
f The data for vertical polarization are shown in Figure 6. The cor-responding SIGPLT for the 32K4 height is shown in Figure 7 with the measureddata plotted as circles. The range measurement for the 12 dB S/N was
* slightly above 14 n.mi.
CONCLUSONS
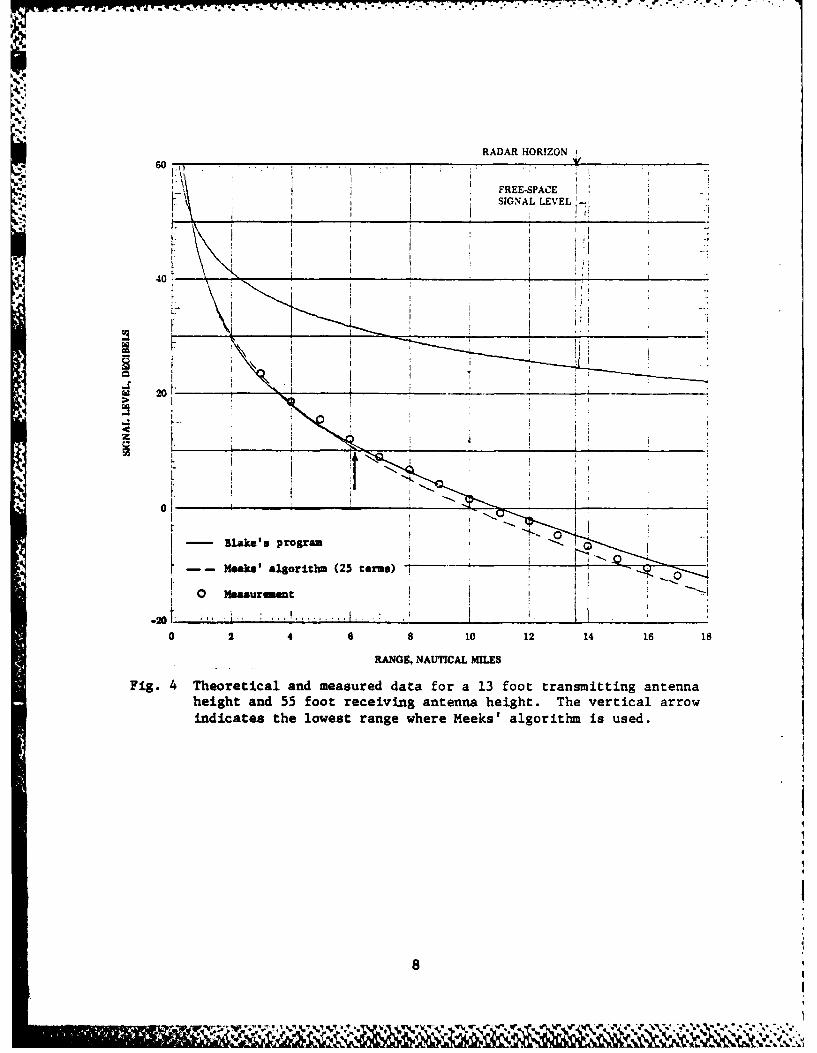
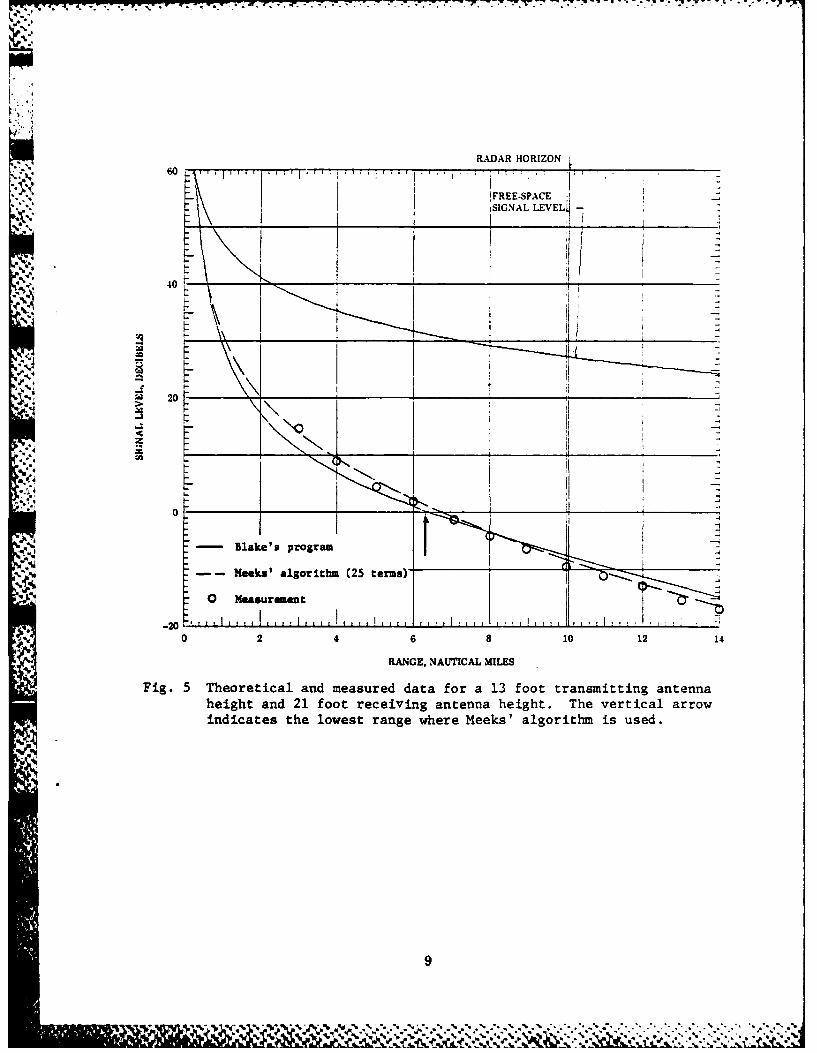
The results show that the experimental data for horizontal polariza-tion tends to follow Blake's data for the 32M4 (105 ft) antenna height andMeeks' for the 6.IeM (21 ft) height. For the 16.2M4 (55 ft) position thedata falls between the two curves as the range increases to the range atthe horizon.
Y"8

E " These results indicate that for very low antenna and target heights
the Meeks' algorithm provides slightly better agreement with measurements.
ACKNOWLEDGMENTS
The authors gratefully acknowledge the assistance of "Mr. RaymondAtkins of NASA at Wallops Island for providing support for the measurements.The assistance of the Commander and crew of the patrol boats of SecialSquadron 20 of the Little Creek Amphibious Base, Norfolk is also gratefullyacknowledged.
REFERENCES
1. M. L. Meeks, Radar Propagation at Low Altitudes, Artech House, Inc.,1982.
2. L. V. Blake, "Machine Plotting of Radio/Radar Vertical-Plane CoverageDiagrams," NRL Report 7098, June 25, 1970. AD709897
3. M. I. Skolnik, Introduction to Radar Systems, page 513, McGraw-Hill BookCompany, 1962.
4. M. I. Skolnik, Radar Handbook, McGraw-Hill Book Company, 1970.
4
.E-
4'-4
-:49
00
04
cto
E-4 E-
1-p4
zc
PooI
"lam
7. 7. -. '. % -
0TRANSMITTER ANTENNA HEIGHT 13 FT
0 RECEIVER AT 21 FT
RECEIVER AT 55
x RECEIVER at 105
-10 xo 'i x
A
S-20
o A
0
-30 -Ax
-20
A Ax0
x
0 A
;% X C-BAND RADAR-40 0 LOST TRACK0 A
0
00
0
-50
CALCUJLATED HORIZONS 10.0 NM 13.6 XM '17.0 NMFOR 21 FT FOR 55 FT FOR 105 FT
I II0 10 20 30 40
RANGE (K YDS)
Fig. 2 Relative signal strengths at three receiving antenna heights forhorizontal polarization. Ranges of calculated horizons are shownby the arrows along the range scale.
6
., v ., .,., ';o.:. . ,;, . -'.-. . ..-. . .-. ,... .-.... . • . ... .*....-,. S..
RADAR HORIZON
4 FREE-SPACEII SIGNAL LVEL j___ 1
* 20
-- Kiks's palgrtw(5tr.) - __
0 Nmaaurint
0 2 4 6 8 10 12 14 16 18 20 22 24
RANGE, NAUTIAL M=LE
Fig. 3 Theoretical and measured data for a 13 foot transmitting antennaheight and 105 foot receiving antenna height. The vertical arrowindicates the lowest range where Meeks' algorithm is used.
7
Ing . ~--~-T~.**, -- '
'n'rU r. ... n &. . o o . - -.
RADAR HORIZON
60 V :V
I- I FREE-SPACEJ __< . ,I.... .. . __...._!__ _ _.
4
0 .. SIGNALUTICAL.MILE
[i I
i t l eeks' algoritim (2 tse).
I t.I__ __ _ __ __ _ '_ _
: RANO!, NATIA MILES1
Fg 4Thoicalan .asre dat fo a 13 fottanmtignen
hegtad5 otrcevn nen egt.Tevria ro
!l o li .=--,'x I !' ,
RADAR HORIZON
!FREE-SPACE +
iSIGNAL LEVEL I
40
20-
z
0
-Blake's program
M eeks' algoritm (25 terms)
0 Measurement
0 2 4 6 8 10 12 14
RANGE, NAUTICAL MILES
Fig. 5 Theoretical and measured data for a 13 foot transmitting antennaheight and 21 foot receiving antenna height. The vertical arrowindicates the lowest range where Meeks' algorithm is used.
9%
i Masreen
0~ * '. 4 81 2 14.~'.-- *' .
V KW kI R I I 7
STRANSMITTER ANTENNA HEIGHT 13 FT
0 RECEIVER AT 21 FTA xA RECEIVER AT, 53 FT
S x RECEIVER AT 105 FT
-10
xAx- 00 A x
-20 A x0
0A0_A
:z
Ax
0-30
0A
.4 0
rz
-40 0 0
-50
f10.0 NM 13.6 NM 17.0 NMCALCULATED HORIZONS FOR 21lFT FOR 55 FTj FOR 105 FT
10 20 30 40
RANGE (K YDS)
Fig. 6 Relative signal strengths at three receiving antenna heights forvertical polarization. Ranges of calculated horizons are shown bythe arrows along the range scale.
10
%- . ., .-. .. .. .... '...I .*** V.~
RADAR HORIZON
{ FREE-SPACE -
{ SIGNAL LEVEL -
* 40 ~
2-
I
Z
0
-2
_ _ ..I * t t ' I ' ' t { ' ..................
0 2 4 6 8 10 12 14 16 18
RANGE, NAUTICAL MILES
Fig. 7 Comparison of the calculated and measured signal levels for atransmitter antenna height of 13 feet and a receiving antennaheight of 105 feet for a vertical polarization.
11
,.,..,
Appendix A
DETERMINATION OF THE FREE SPACE RAINGE OF THEMEASUREMENT SYSTEM
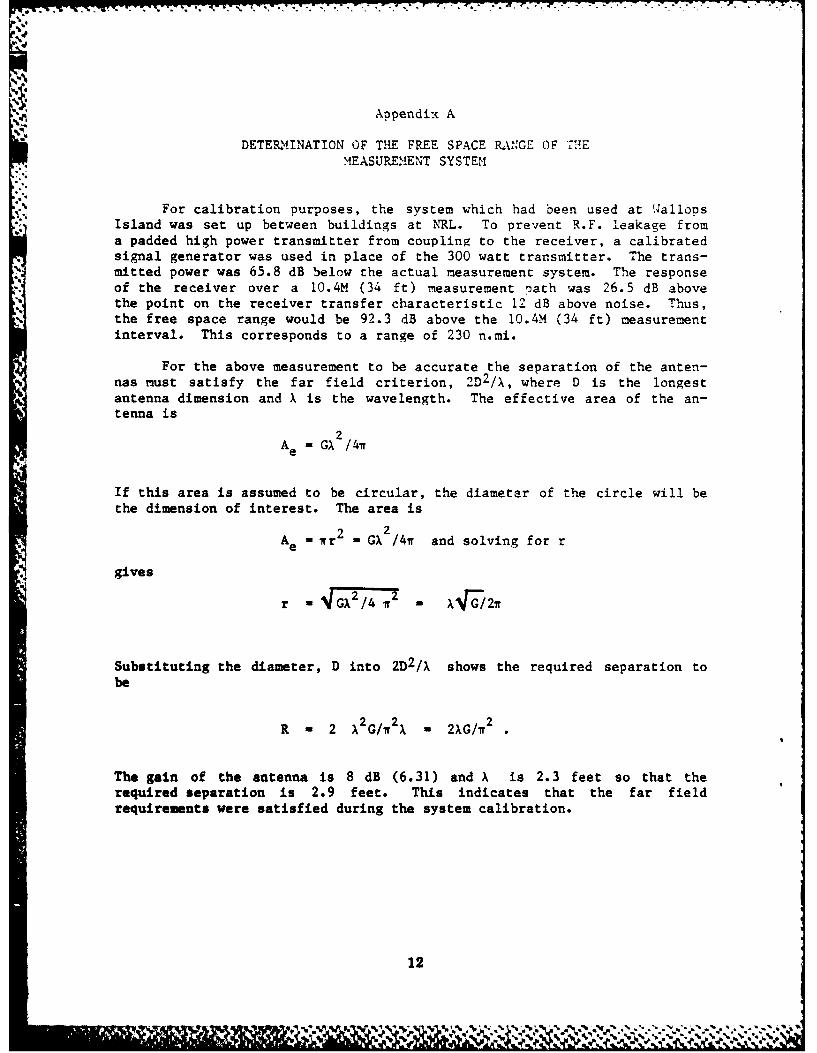
For calibration purposes, the system which had been used at WalloDsIsland was set up between buildings at NRL. To prevent R.F. leakage froma padded high power transmitter from coupling to the receiver, a calibratedsignal generator was used in place of the 300 watt transmitter. The trans-mitted power was 65.8 dB below the actual measurement system. The responseof the receiver over a 10.4M (34 ft) measurement oath was 26.5 dB abovethe point on the receiver transfer characteristic 12 dB above noise. Thus,the free space range would be 92.3 dB above the 10.4M (34 ft) measurementinterval. This corresponds to a range of 230 n.mi.
For the above measurement to be accurate the separation of the anten-nas must satisfy the far field criterion, 2D2/X, where D is the longestantenna dimension and X is the wavelength. The effective area of the an-tenna is
2Ae - GX /4ir
If this area is assumed to be circular, the diameter of the circle will be
the dimension of interest. The area is
Ae - wr2 = GX /4n and solving for r
gives
VG/4 w2 X NFG / 2w
Substituting the diameter, D into 2D2/X shows the required separation tobe
-2 2 2 2R - 2 X2G/w2X - 2XG/ 2 .
The gain of the antenna is 8 dB (6.31) and X is 2.3 feet so that therequired separation is 2.9 feet. This indicates that the far fieldrequirements were satisfied during the system calibration.
12
- -- -. . .. ~---I~ Ve
Appendix B
DISCUSSION OF SIGPLT PROGRAM
BLAKE'S PROGRAM -
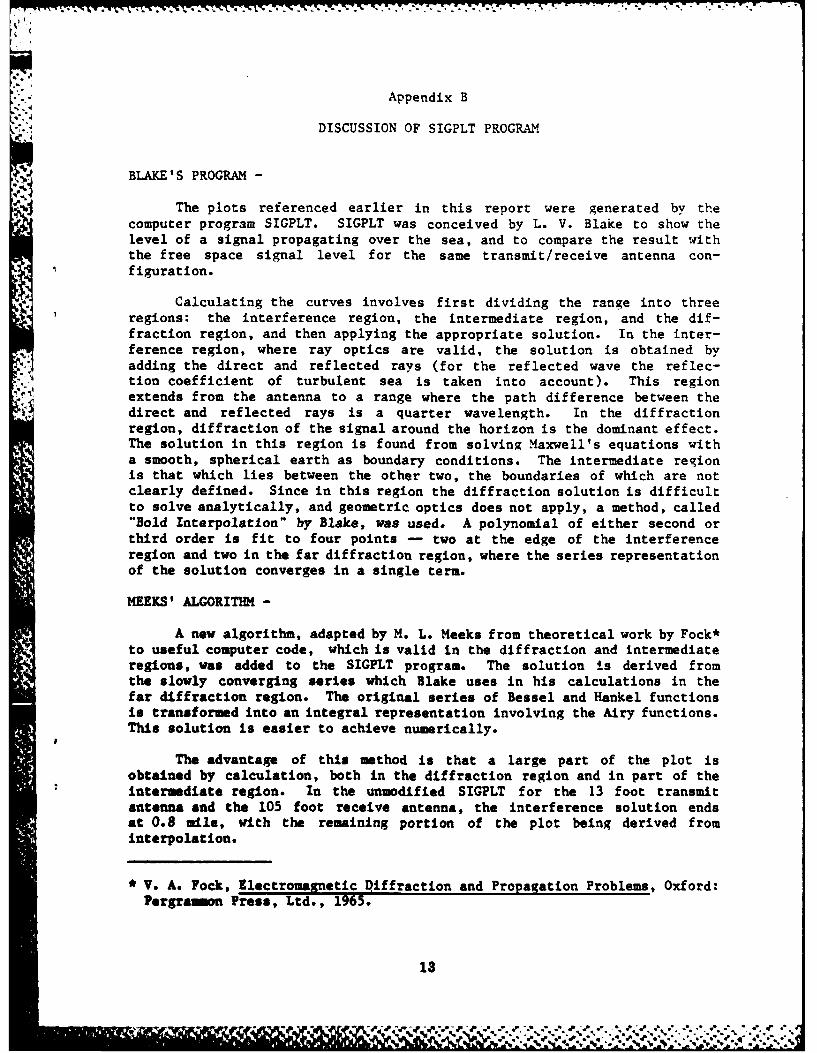
The plots referenced earlier in this report were generated by thecomputer program SIGPLT. SIGPLT was conceived by L. V. Blake to show thelevel of a signal propagating over the sea, and to compare the result withthe free space signal level for the same transmit /receive antenna con-figuration.
Calculating the curves involves first dividing the range into threeregions: the interference region, the intermediate region, and the dif-fraction region, and then applying the appropriate solution. In the inter-ference region, where ray optics are valid, the solution is obtained byadding the direct and reflected rays (for the reflected wave the ref lec-tion coefficient of turbulent sea is taken into account). This regionextends from the antenna to a range where the path difference between thedirect and reflected rays is a quarter wavelength. In the diffractionregion, diffraction of the signal around the horizon is the dominant effect.The solution in this region is found from solving Maxwell's equations witha smooth, spherical earth as boundary conditions. The intermediate regionis that which lies between the other two, the boundaries of which are notclearly defined. Since in this region the diffraction solution is difficultto solve analytically, and geometric optics does not apply, a method, called"Bold Interpolation" by Blake, was used. A polynomial of either second orthird order is fit to four points - two at the edge of the interferenceregion and two in the far diffraction region, where the series representationof the solution converges in a single term.
MEEKS' ALGORITHM -
A new algorithm, adapted by H. L. Meeks from theoretical work by Fock*to useful computer code, which is valid in the diffraction and intermediateregions, was added to the SIGPLT program. The solution is derived fromthe slowly converging series which Blake uses in his calculations in thefar diffraction region. The original series of Bessel and Hankel functionsis transformed into an integral representation involving the Airy functions.This solution is easier to achieve numerically.
The advantage of this method is that a large part of the plot isobtained by calculation, both in the diffraction region and in part of theIntermediate region. In the unmodified SIGPLT for the 13 foot transmitantenna and the 105 foot receive antenna, the interference solution endsat 0.8 mile, with the remaining portion of the plot being derived frominterpolation.
*V. A. Fock, Electromagnetic Diffraction and Propagation Problems, Oxford:Pergramn Press, Ltd., 1965.
13
u w v vI , w 9 . *u jo,, . . . . .. . .-.. - .. .• . . . -. - " ' -. -. . . o o "". - " ".
.w- *%-
The disadvantage of this method is its computation cost in :ertainconfigurations. 3ecause the solution is in the form of a series, each ternof which must be found by integrating the differential eauation defininzthe Airy function, the computational cost can get quite larze for certainconfigurations which require that the integration contain many more steps.
14
% %

V P~
4,
I
I
'A
C-
mp
I
* - - . . . . - -
* C - *%~****C~*
* C ~ * ..... C- . -. 2 - . - - - ... . -
.~ .. -. C- . . . . . .* .* * . . . C * - * -
S - C~ * *