
iI - wegemt.com€¦ · steam lines (doing no work in the turbine) and that all steam and water...
323
iI WEGEMT, 5TH, 1981' Berlin Advanced Ship Powertplant Design~and Operation Vol I Paper No Lecturer Title Al Grossmann, G. Calculation of heat balances. A2 Armstrong G. The influence of type of fuel on ship and engine design. A3 Winkler, W. Design of modern marine boilers. A4 Geisler, 0. Reheat systems, general considerations. A5 Norberg, L. An advanced high. temperature reheat steam, cycle utilizing FR dombustion. A6 Casey, J.P. An advanced marine steam propulsion systeml A7 Grossmann, G. Bled steam reheat, attached auxiliaries. A8 Volker, H.H. Experiences with steam plants on ships. Winter, H. & Calculation of load capacity of marine, propulsion A9.1 Michaelis, K. gears. A9.2 Hiersig, M.H. Design of gears for ships. A9.3 Stannowski, H. Design of pumps and piping systems. Bremen, W. A9.4 GroBmann, G. Scoop systems for central heat exchanges for ships. VOL II Bl Thompson, R.V. Introduction to marine control systems. B2 Engja, H. Control systems for diesel engines. B3 GroBmann, G. Milde, W. & Control systems for steam plants. Xuan, H. B4 Droste, W. Control of electric power generation. B5 Engja, H. Computer/Microcomputer for ship systems.
Transcript of iI - wegemt.com€¦ · steam lines (doing no work in the turbine) and that all steam and water...

iI
WEGEMT, 5TH, 1981' Berlin
Advanced Ship Powertplant Design~and
Operation
Vol I
Paper No Lecturer Title
Al Grossmann, G. Calculation of heat balances.
A2 Armstrong G. The influence of type of fuel on ship and engine
design.
A3 Winkler, W. Design of modern marine boilers.
A4 Geisler, 0. Reheat systems, general considerations.
A5 Norberg, L. An advanced high. temperature reheat steam, cycle
utilizing FR dombustion.
A6 Casey, J.P. An advanced marine steam propulsion systeml
A7 Grossmann, G. Bled steam reheat, attached auxiliaries.
A8 Volker, H.H. Experiences with steam plants on ships.
Winter, H. & Calculation of load capacity of marine, propulsionA9.1 Michaelis, K. gears.
A9.2 Hiersig, M.H. Design of gears for ships.
A9.3 Stannowski, H. Design of pumps and piping systems.Bremen,
W.
A9.4 GroBmann, G. Scoop systems for central heat exchanges for
ships.
VOL II Bl Thompson, R.V. Introduction to marine control systems.
B2 Engja, H. Control systems for diesel engines.
B3 GroBmann, G.Milde, W. & Control systems for steam plants.
Xuan, H.
B4 Droste, W. Control of electric power generation.
B5 Engja, H. Computer/Microcomputer for ship systems.

" 2.
. Paper No. Lecturer Title
•l,C2 Bauer, W Future fuels for marine diesel engines andlubrication of modern diesel engines.
C4 GroBmann, G. & Bunkering for fuel oils with high viscosity andHadler, C. and high pour point.
C5 Armstrong, C. Energy saving systems.
C6 Macchi, E. Organic rankine cycles for heat recovery
VOL III D1I Wojik, K. Crosshead two-stroke engines and associated plant
D2 Gallois, J. Medium speed diesel engines.
D3 Jost, V.M.W. High speed diesel engines.
D4 Armstrong, G. Energy requirements for auxiliary systems.
D5 Langseth, K. Testing of diesel enginess and components.
D6 Pauer, W. Engine diagnosis systems.
D7 Maccaferri, L. Gass turbine applications.
Grossmann, G. Ship, propeller and engine characteristics.
E2 Schanz, F. Controllable pitch propellers.

Fifth WEGEM TGraduate SchoolAdvanced Ship Power Plan tDesign and Operation
() Paper Al
Calculation of heat balances
by
o. Prof. Dr.-Ing. G. Grossmann
1. Introduction2. General Equations2.1. Main Boiler2.2. Turbinbs2.2.1. Turbogenerator2.2.2. Turbofeedpump
2.3. Condensate and feed water heater3. Heat Balance Calculation4. Heat Balance with more than 2 Unknowns5. Working with the Heat Balance Equation

WETG 81-Al-I
Direct Calculation of a Heat Balance
1. Introduction
The following paper describes a method for the calcula-
tion of heat balances in. a once through way without
the need of any interation. It ds suited for computer
as well as for pocket computer.
2. General Equations
The aim of a heat balance is the calculation of the
overall steam flow from the boiler, the fuý! flowim8 , necessary to convert the feed water into steam,
and the individual steam flows to the different tur-
bines, heaters and other auxiliaries. For all steam
using-components there are equations defining their
steam consumption. These equations have to be set
down first.
Fig. 1 shows the energy flows into or out of a marine
boiler.-An energy balance around the boiler yields.
Input: Feedwater: . rohVK
Fuel: MB (HU+ 1t CpB)
Air: 8 ht CMB bmf 11L cpL
Output: -Steam: rnDZhKE-Exhaust: rn(b~of In~i~~
t hrhýCK flow'jb~) PRadiation: MBa
In this balance there are only two unknown factors:
the steam flow mD, and the fuel flow rn
nt'-b0[n1b~j 2.1.7B "'U + '8 CpB" b]ln L CL - C [- L~ ) f pA 0.)=21
moz (hKE- hvK)
In this equation, the air demand is0,296 HU 10 -31,362 [St mr/Kg) 2.2.
3-=0,383 HU 10 .1, 761 [Kg/Kg]I

WEG 81-Al-2
in standard m3 (at 1 bar and 0°C) per kg fuel or inkg/kg7 The minimum exhaust gas volume isbAo = 0,36 9 HU 10-3 S /Kg 2.3.
=Mi, + ,-g/Kg]I
With the effectice heating valueHUEF=(HU + bMip fL L-(bAo0[o-1IbLMi A-a ) 2.4.
and the specific energy increase of the water
7- - A h..h h 2.5.:j : VK
the fuel flow m.B becomes
MB =muz A/HUEF 2.6.
For-a-reheat boiler, where mDRE is reheated with
equ. 2.6 becomes . .E";A ; • "RE'D8 HUEF LORE HUEF 2.7.
2.2. Turbines
2.2.1. Turbogenerator
The power of a steam turbine without any bleed points is
Fig. 2 shows the definition mPT= . H 2.8.of Hftand '?iT . R t can T '-
S.st
be taken from the hs-dia--h
gram :when the steam con- .,rditions before and behind P• 4
turbine- are given. When z.T1
the turbine'has to drive Ia generator with the elec- $ -
tric load PE and the gene-rator efficiency Y6 , thenthe steam consumption ofthis generator set is
4PEmDT G= 2.9.
H1ST ?IrdbIrsf
i,

/WEG 8i-AI-3
The electric load needed for a certain turbine plant
has to be defined from experience. For a.25000 1Q,
plant with electric boiler fans , electric vacuum pumps
and air condition it is P = 750 KW¢e at MCR.
2.2.2. Turbofeedoumo ThSP
The power needed for the PIIP
pump to increase the
pressure- of the feed flow
...mSp =mD D by Ap[bari is N iSP
Fig. 3
1OS Vp -- -2.10.
This has.-to be delivered by the turbine.
Pj- 15p,17 S H~p2.11.
Equations 2.10. and 2.11. give the steam consumption
§ f .the !e 'ds -mp. ........... - .-.. .
.. .. DSP u•HisP 2iSp QMSp qP .
or-the specific steam consumption per kg feed water
100 AP p 2.13.
Whkn the feed pump is driven by an electric motor,
dsp becomes
SR0 Arc V"~ =0 -~ • 2.14.
dp=HITG 'JIT612MTqG 1 2p
or main turbine driven.100 P Vsp 2.15.
In all cases, the pressure head of the pump is
Ap = PKE- P ADE + APv 2.16.
The steam flow -to all other auxiliary turbines can
be calculated with either equ. 2.12. or 2.9.

WEG 81-AI-4
2.2.3. Main turbine
The main turbine has to deliver the required powerP to the propeller. Besides this it delivers bleedsteam from several bleed points for the preheating of :4the condensate and the feed water and other serviceslike seawater evaporator, steam-steam generator,
airheater. ..
When at the bleed point iwith PA, and hA. the steam hVr-flow ThDAi is taken out ofthe turbine, this steam does. V.no longer deliver its ener-
11EF-gy -to the turbine. The powerP1 , delivered by the tur- h
bine becomes "zsr .'41
2.17. P _
From equ. 2.17. the re- hNrquired steam flow mDVT tothe turbine is
IF 4
2.18.•PT HA i
PT /(HEFIM is the non bleed steam flowmDVTo ofthe turbine and HAi/HEF--ei is the replacement factorof-the bleed• point i, showing-the. amount of additionalsteam (.- over mDVTO ) which is needed to achieve Pr atthe propeller. i
+2.19. .
mD V T =mOVTO ÷ JmAi ei2.9
2.3. Condensate and feed water heater
A steam heated water pre-.heater is shown in Fig.5 i ' v w'
12W
Fi9 5
d:

WEG 81-Al-5
. hsp I - SP2VVI MW h - 2.20.
d ~ vw -D'W _P -P .2.21.1h/W hVWi KVW
In equ.. 2.21. resp. in Fig.5 the pressure pVWi is
equal to or smaller than the pressure PAk of the
corresponding bleed point. (This means, that the heater
number-is the same as the bleed point number.)
3. Heat Balance Calculation
For the in Fig. 6 shown simple steam cycle the follo.-
wing equations are know.
Fuel consumption fB_•Oz A 3.1.
HUE_'N moyr- mDTA3 .3
Steam to feedpump MOSp =mOZ dSp 3.3.
PE 34Steam to generator turbine m 'r ,TG1rTG 3.4.
100 8Ap VspSpecific steam con- .dp HisP iSP,?MSP qp 3.5.
sumption of feed pump,
-When we postulate, that all the gland.: steam, which
is condensed in the gland condenser, leaves the main
steam lines (doing no work in the turbine) and thatall steam and water losses are considered steam losses
ýDVER , which covers some of the small heat losses,
the following mass balances can be made.
Mass balance before main turbine.
r'?DZ - O',P- mOVER-'Tgrg- "OST- 'DSP - 'DVT 3.6.
Mass balance around deaerator
mDz - moS, - rDE4A -mOTG = 'le 3-•5.7.

WEG 81-Al-6
Mass balance around main condensor. (For control only)'DKO 'D mWR 'DhSt OVE, K 3.8.
In addition to these equations, there is the energybalance around the deaerator. This balance includesthe gland condenser and the air ejector condenser.hur_ hEA --oSphNSP* husA hA3 * ThuvTQ + mhwR TGWR
4mDTh¶-hST+ T-mK hK iIThWR Ahw = Energy supplied by gland condenser
with L A h,.IT cp,,It;f 2570 -420 KJ/Kg
musT Ahs/ = energy supplied by the air ejector
condenser withA/5sT 2600 J/KgJIK
Equations i -3 .m9' show, that there are only two realunknown factors in' the system:
6DE and roDEA
All other factors are either proportional to oconstant Equatiohs 3.2 ,3.3,and 3.6 provide. oroDE (I+ must 3.10.
Equations 3,7, and 9i, ,I, -h d (h -h )- ( -h 3.11.B~A K SP NSP K BRA 'A3.K. m (07 , P7-K Dk/, WR 05 DST ST
* I
hEA- t hK -h NSP -K"
•"hT-h! K . A7 Kh EThl ___ A/i A/mDT.- + nb••,+ nb0TýhA . h ý3h 1143 hK
With the following abbreviations
12/ =~ -d sp
hA3 K hA- 3 K
" m " hw " "hsrT5nhh. moWR• 'D mST "hl
• . o
hA 3 hK hA3 -hK TA3
fl/] I- dSp A =roI,,oT Tra + T vG2" ` 'ThP

1• •WEG 81-Al-7
Equations 3.10. and 3.12. become
moE [1- mOEA e3 A 3.13.
moE [21-rn 3.14.
Of fEA.
These equations give us with the following equationsmoz (A-Be' )1([11-121Ye)3.9
E :21-B 3.16.roDEA = o [2 S""E /.
the solution of the heat balance calculation in a
very general form.
To show-how easy heat balances can be handled with the (above equations, we will add an air heater, heated
with steam-from . A, and an evaporator VD, heated with
steam from bleed point A4 (Fig.8). (The air ejector
is ommitted in this cycle and replaced by an electric
driven vacuum pump, which has to be considered, when
defiiing the electric load PE . This should be increased
by 25-35 KW!)
The steam-consumption of the air heater is
mow UhA 2 -%J VL§ L(NL tVL) 3.17.
witht... L' q.,,n and r 8mB A/ IHU~ff(
A p~k CP I AtL ) bjL 10nn dL
.•"LU, ,L EF hA3 - hKA3 9 D LU 3.18.
Equ.3.18. shows, that mDLU is proportional to the
-main steam flow mDr . The heating steam to the eva-
porator ' VD is constant.
Now the power equation 3.2. becomes:PT
H mOTO = mwVT-wDLU2 - POEA3 - OVDO4HEF '2H,
and the heat balance around the deaerator (3.9. resp. 3.11.)
DE -A K ,ohNSP,- -6K' KLKIDEAh3 KJ

WEG 81-Al-8
And the mass balance at the deaerator
m., 0-dSp-T h- mrEA- •ora - 'K
Mass balance before turbine
Of -SP DWR OVER O- mOm
With this, we can easily see the values for our main
factors.SP2L 0V7 Own.
A hD o-h hm T-h62 E- SP hK U KIL L hK[21dEAdSPh dLU
N3'- +0hA'-
+ Al7h A3 -_hK h -hKAS ~ A K AK
Now weycamn-also venture on a definition of these
four factors of eau. 3.15.
A mDVTO +mOTO + mOVER+ mOWR + lIoD e4
represents-the theoretical non bleed steam flowof the turbine plus all constant steam flows, which do
not flow through the turbine, or which flow only par-
tially through the turbine, leaving it at a bleedpoint. In'the letter case, these flows have tb be
multiplied with their respective replacement factor ei(In --our--example : MvDV e4!
A=-m +Ei . 3.19.
[1] represents the steam flows, which are
proportional to the main steam flow mDj -and which are
n6t flowing through the main turbine (here: dsp) or
which-flcw only partially through the main turbine
(here dLeU ). These flows are here represented by
their specific steam consumption d = mox/rmZ . Whenflowing through the main turbine to a bleed point,
they have to be multiplied with their respective re-
placement factor ei CHAi/HEFIll 1- Ed -Zd. a 3.20.

WEG 81-A1-9
h -hBrjgNTG K, AWR
represents the steam flow, by which the deaerator make
up steam is reduced; because some constant steam flows
contribute energy to the condensate or to the deaerator.(Here: TG-steam mom and gland steam mow )
3.21.
A hCONS
h -h h _-d NSP d hKNLU-h P[2 ½ dEA "SP,./ dLU• hAP3_h K ý0 -_hK.represents the theoretical dearator specific make .up
steam dEA , necessary to warm up mDE from hK to h EA".
(from7 - to foEA ) reduced by the contribution of ener-
Sgy otthe'-othýer specific steam flows to the deaerator.I4hi 3.22.[21: dEA d" A -h ' .
'7AOEA hK
If the heat balance is provided with the necessary
figures of the steam conditions and the state lines -
of the turbines; then all our. datas needed for our
basic factors A, B, 11 and [2] can be reached. from-the
heat balance and equation 3.15. and subsequently
equations-3.16., 3.3., 3.1., 3.6., 3.7., can be solved .
without any iteration! t
4. •Heat-Balances with more than 2 Unknowns
The above equation system works beautifully with all
kind of systems, even reheat systems, where-the steam
flows can be seperated into either constant flows or
flows which are proportional to the main steam flow
mor (A high pressure feedwater heater, heated
from A, would be proportional to mDZ , see equ. 2.21.)
Things become more complicated,, when we introduce low
pressure feedwater heaters which are proportional to
the condensate flow $K Fig.8.

WEG 81-AI-10
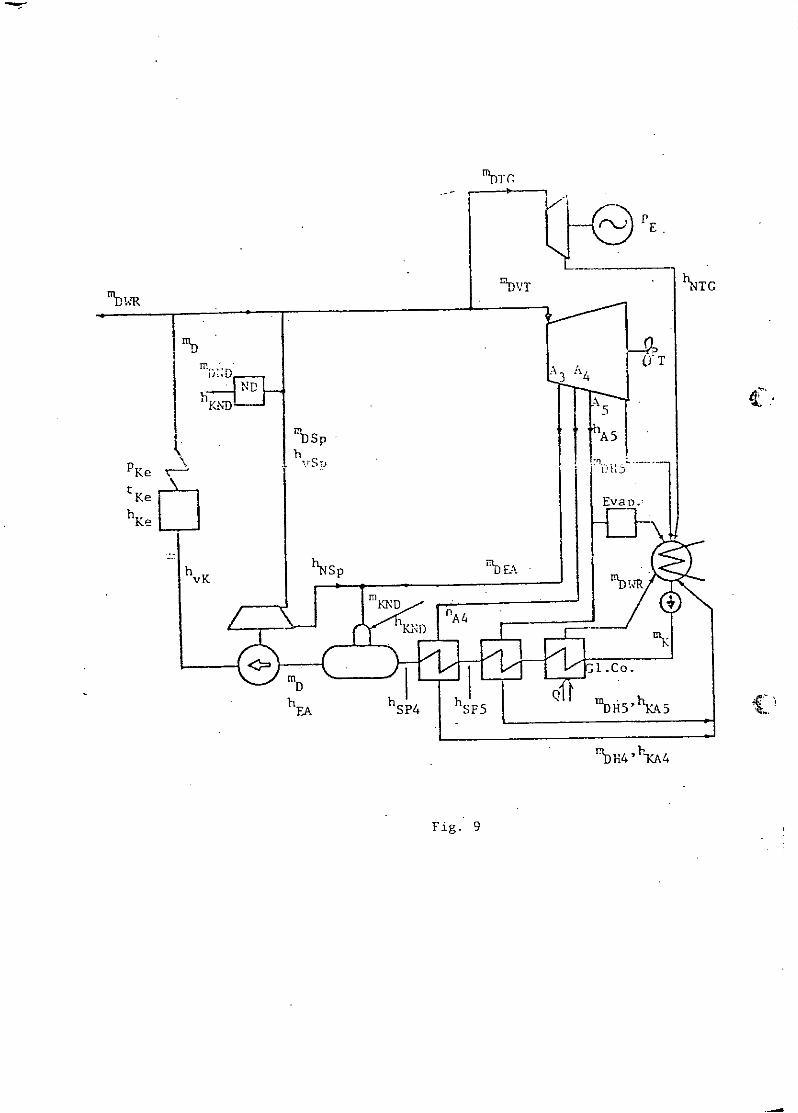
The cycle from Fig.9 has two more variables: Theheating steam 'DH4 and mOHS for the feedwater (orcondensate) heaters 4 and 5. This steam comes from thebleed points A4 respectivly A5. The pressure at thesebleed points Pi gives us the saturation temperaturei , the feedwater temperature behind the heater
' • is always below the saturation temperature tKAitsp 4 t - . P4 4.1.c
1(44 j h p4 4 pW• I --- 2 - 5 °C •..
sP5 --AS -z ,; h5sP z45 'p W
These temperatures are indepent of the steam flowmDH I or -the condensate flow MK as long as we consider
C = const., which we can do for a reasonable load range...The necessary heating steam for each heater can now
-be calculated
Heater 5.iuHSr•s-hK 5 rnKt h5•-hK) -h nDW A•% 4.2.
mDH -5 -hKp4)g *K K)1~ AtHm -h .5Ahwp "i S-_ fM -s n d. -m,• 4.3. "• DHS- b "w-_h m Ds h h
•~ -h-h K H5A5-.KAS. KAR -5TK4
Heater- 4.
I-- J=m (h -h.-. 4 Anl/(~4 KA4. K S04 *g'5
• h g' -L -h,=nH4 K. ,ý4 - nKd,4 4.5.
TA K444
The power equation for the cycle of Fig.8 becomesp .4.6.
HUEF 7M : 'orro0 ThDVT "DEA 3 - DH4e4 -oH5eS D1VD e5.
Heat balance around deaerator. (Now the temperatureand the enthalpy of the condensate at the deaeratorentrance is known. It is fP4 respectivly hSp4 ) -
4.7.rn h . .~ l .n li ir
EA qb~hSP'mD,4A.) SP4A ONDtKNOR

7WEG 81-Al-I1
The condensat flow we get from the mass balance at
the deaerator.
• -- mDBZ i-fi - ' r-V m Q -, DL•U 4.8.
mDND = const. = heating steam to LP steam generator
Equ. 4.7., 4.8. and 3.3 we getMDA 2 (• d h~ p-•--p 4 , hKND- hsP4 121- B 4.9.
EA SP4A3 -SP4 AAd -i (2 B4
Equ. 4.9.-is essentially the same as equ. 3.12..
Only hK is replaced by hs5p4!!mk = mDýN-dSp :'-dLU , - 21 8 -rnBNO 4.1o. C.
,MK ,bZ 131 -m- [21 ,-B - C, C1 : MD,
m Th (l- i-Al - -• 4.11.tNVT DE 5:0 OW?? BA/B 07
Equations 4.9., 4.10. and 4.11. inserted in 4.6., with
4.10. inserted in 4.3. and 4.5. and then also in 4.10.
result in.
rnBTo=17J~flJ inwp -moNo -inBTc 4.12.
12-B)(D731- 'i 0 [21- 8-C
[e d (m [3) -rn [21 + B- C 1-9p -5 H5DI WR 5 hASK4
.7 e DVI)
mOTO m..R mDN5 + mOTG mDVo - B(e3- e4dH4 -esdHs) 4
.r 541-1 O4d +.esds)C2 e5
(li [1 2 -d 14 Se dH )-[31 (e 4 tIH jqýdH5 I

WEG 81-A1--12
Equ. 4.13. gives us the solution for
4.14.A- B e3 - 'dH. • dH 5 e- eH 4. ¼S ( d-5 L3
rn(z17 -[2]'( 3-jd,14 -9,d11) -13( d••H ..edH I- l3.j%t z11 S11 -12 S
e i 4 -
Equation 4.14. allows the calculation of practicallyall heat balances. (The exceptions are cycles withbleed steam reheat, as there an additional variable
is introduced.)
The new factors are:Cr 4.15.C1 =M DND
Constant steam flows which are going directly intothe-deaerator, so H4 and H5 do not have to supply
energy for their heating.
t3] l -dS-,f(-i-d 112 .. J 4.16.
represents the influence of steam flows proportionalto kDr (here the di -values), which are going directlyinto the deaerator, and are therefore not heated up
in H4 and H5.__hW . 8g 4.17.
represents the influence of constant steam flows,which-supply heat to the condensate before heaterH5, by-this decreasing the heating steam qVH5
[3- hm -/x 4.18.
represents the influence of steam flows proportionalto m'pa , which supply heat to the condensate eitherbefore heater H5 or in it. (To my knowledge, thishappens only, when steam air heaters, supplied withheating steam from the deaerator steam void, areinstalled. In this case, the specific steam consumption
of the air heater becomes
U l A CP _ VL tvL 4.19.d/L U bLHn/ HUE F h -_, _ hVL
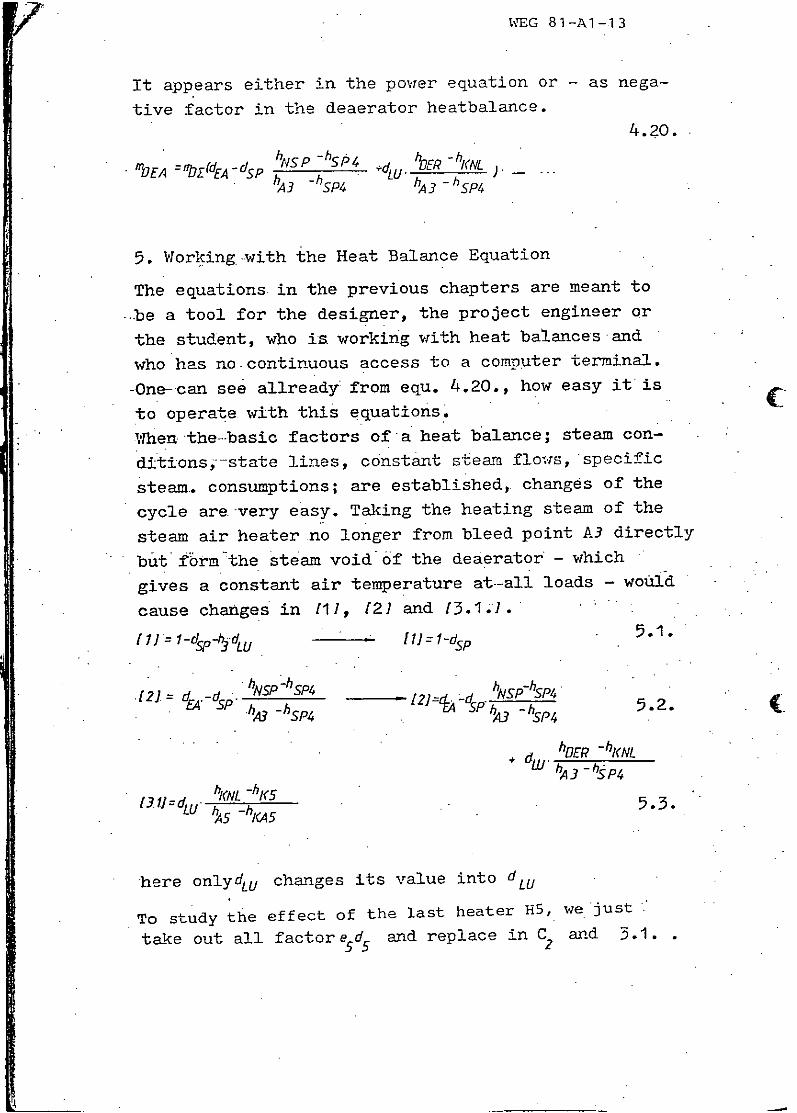
WTEG 81-Al-13
It appears either in the power equation or - as nega-
tive factor in the deaerator heatbalance.
4.20.
h -hp -h' 1JEA =frx(dA-dsp hA -hT tiP4
hA3 hsp4
5. Working with the Heat Balance Equation
The equations in the previous chapters are meant to
-be a tool for the designer, the project engineer or
the student, who is working with heat balances and
who has no continuous access to a computer terminal.
-One-can see allready from equ. 4.20., how easy it is
to operate with this equations.
Wh•en the--basic factors of a heat balance; steam con-
ditionsvstate lines, constant steam flows, specific
steam.. consumptions; are established, changes of the
cycle are. -very easy. Taking the heating steam of the
steam air heater no longer from bleed point A3 directly
but form the steam void of the deaerator - which
gives a constant air temperature at--all loads - would
cause changes in 111, (21 and (3.1.1.
11 J s--dSp-jdLu . 1 =1_dSp 5.1.
d -d hNSp. hsp4 -d hhsp-h121= 14- SP hA3 -h5 p4 - I2JýAýdMp NSP%- 5.2. (
d•. hDER -hKNL3l -t)SP4
(lI hKdLu 1kNL -hK5 5.3.
here onlydLu changes its value into d LU
To study the effect of the last heater H, we. just
take out all factored and replace in C and 3.1.55 2

WEG 81-Al-14
Changing the stack temperature of the boiler changesonly 1Y.## and there only the value.
(A 0 ÷(n- 1 bAlk/N 'PA t "A
As explained already in chapter 2, an attached gene-rator would only change noT6 by going to HiS and Ri from
HiST6 and 77 TG . As this changes only the factor Athe difference in m., can be calculated immediately.
A; - MD- OT6(A4TrACHED)or - [ij-tzj'i... ) -(3](... ) -j3.1.j[.. )
If there is a computer on hand which ban solve linearequation systems with more then 10 unknowns, then the
equations--have only to be lined up in matrix form,:which will be solved by the computer then.For the cycle of Fig.6 the matrix is written down here.Still the main problem is the determination of theturbine state lines and the individual coefficients.• If this has to be done by the student, it is just* as easy to calculate m~y according to equ. 4.14.
*D mDV ' Ir "'JA I mgSp ma,4 I hH 5 W'K ifMT I mm0 Thorn TaWR ImoNo Im 9DVM.0 before .•turb. 1 - 1I-
Power-equation I .Jg? -- 'k5 IIPo••.*qo~..1 •r _•e -J' - -__ A
HS decerat ar - hA -h h,3 4 0Feed pump. -dp I
HA beater 4 4..hc h__
B heaoter5 . %-h4 M _4-h I
&a deaerato_ -I I I -lunknown voriable (const steam flows

'DTC Turbo generator
PVTC hh VT
*~' STe ______ - C rcins
ReVE
P~e Eonetorcoc
Feed pump DeeaorGad od
Pv~~~~~ig 6e.hI A

exoutGU g as
A3 BAýnle
A nKe
semA looses
es:,ýKe
C fge ' nkte radial jonlooses Of toiler
In;(e--and eng ire
f eed wat er
VL "LnLu'T'spyvges air preheate Qfan
VKePVK&, 'We IE6 Z n), (Hy -c4 b
M
fuelpirheat er
A t= 800C (max)b u nker
fheali1

AIS
FigZ7
'flGES / %TIb
2: t
tt
t Ln~ u mD.Fig., 8
h-h
'D WR ___________
NDD
%DSp 1A
h l h .
h h %w.' hKA4
vKFig. 9

A4 5 Part Divsdm02966

Fifth L4EGEM TGraduate SchoolAdvanced Ship Power PlhDesign and Operation
Paper A2
The influence of type offuelon
shipand engine design
by
Dr. G. Armstrong
. 1o . Introdqiction
2. Coal Options.C 3. Technical aspects
3.1 Spreader stoker3,2 Pulverised fuel3.3- Fluidised bed combustion4. Classification Society Requirements4.1 Storage4.2 Fuel handling.4.3 Ash handling404 Combustion of coal5. Coal Burning Economics5.1 Bunkering and energy storage5.2 Economic comparisons

WEG 8l-A2-l
The influence of type of fuel on ship and engine design
1. Introduction
Some 90% of ships at sea today are propelled by diesel engines,and in the present economic climate there is little to favour agenera] return to oil fired steam propulsion. The applicationof future liquid fuels to diesel engines is considered elsewherein this course, and this lecture will consider the technical andeconomic aspects of a return to coal firing of steam plant.
Quite obviously the question does not depend on ly on relative fuelcosts-: a coal burning ship will be more expensive than an oilequivalent and will have greater bunkering limitations imposedupon it, both operationally and in the ship design, to name but afew of the parameters. Further, as the optimum speed of a shipcan be shown to be that at which the running costs account for halfthe total operating costs, the economic speed increases if the fuelcosts reduce, and thus the economic speed for coal fired ships willbe greater than that for oil fired. This, in turn, has implicationsfor the basic ship dimensions and hence price. The influence oft~ype of fuel is such that for a similar duty the coal burner will beradically different from the oil burner, and comparisons can only bemade on the basis of an overall life cycle study in the particularcircumstances.
2, Coal Options
Three groups may be identified
(i) Raw Coal
- stoker or pulverised fuel fired boilers/steam turbine
(ii) Coal/Oil Mixtures
for existing diesel engines or oil fired boilers
(iii)Coal derived liquids
-to fuel existing diesel engines
For marine applications the technology for group (i) is probably themost readily adaptable. Coal/oil mixtures have the advantage over rawcoal of possessing similar storage, handling and combustion, properties

HEG 81 A2-2
to oil, and a 50/50 mixture requires similar storage space to oil
for the same energy content. The main problems, however, are
coal ash abrasion and erosion of burners, burner coking and the
fouling of burners and boiler surfaces. Tests have been carried
out on diesel engines with some success, but extensive testing to
determine wear rates will be required. Coal derived liquids, of
course, remain a possibility as a fuel for existing engines, and the
liquefaction processes under development can produce a wide range
of liquid fuels. The main problem of coal derived fuels appears
to be economic rather than technical and their widespread use for
marine propulsion is probably a longer term option than the
combustion of raw coal.
For immediate application, the combustion of raw coal is thus the
most favoured option.
3. Technical aspects
3.1 Spreader Stoker
Figs.l&2shows.the mode of operation of a spreader stoker and
travelling grate, in which the grate moves at between 1 and 5 metres/
hr in the opposite direction to that in which the coal is being
thrown--from the over-throw. rotor. Between 60% and 80% of the total
ash--is deposited in the grate dump hopper beneath the grate, with the
remainder leaving the furnace with the flue gases as flyash. This
is-colledted by a cyclone separator. It is likely that due to port-restrictions facilities for ash storage must be provided to await
disposal at sea.
-Combustion air, in direct proportion to the amount of coal being
burned,is delivered beneath the upper portion of the grate and as
overfire air above the coal bed. The latter creates turbulence and
-ensures that the combustion takes place in the furnace, Although
overfire air cuts down unburned coal-loss from the furnace, it does
not completely eliminate it, and pits are placed after the superheaters
to catch the so-called fly carbon whereupon it is reinjected into the
overfire air.
The forced draught fans are sized to take into consideration all
the air side losses from the FD fan discharge through the stoker.
It does not include any flue gas side losses. The furnace and flue
9As side are kept at a slightly negative pressure by inducsed draught
fans to einminaze the i Itrazion of soot and riyash -Into te ehyine

'.4
C'4
'4N '44 *1
4 -'4
'4 '4'4 I.,
~~IiI'4 4
0 4 0 -
L2U-
C ill
II
*tVHflI'
H
<V(9
.4
tci b
'C '3'4 ci '4I..
0

A lk i 71
.IuA IN S ER FEDRIAT BOEE FIG. 7,
WEG 31 A2-3
room. The induced draught fans are thus sized to overcome the
gas side resistances of the boiler, economiser, dust collector
and stack. This is referred to as a balanced draught system.
Boiler control is based on modulation of undergrate air which
controls the heat release. Changes in coal feed rates rdpidly
affect the heat release from the furnace due to coal fines burning
in suspension. Foster Wheeler claim as little as 4 minutes to
shutdown after the air supply is turned off, although facilities
for steam dumping would be required to prevent complete
extinguishing.
Excess air varies from about 27% at maximum load to 90% at 20% load,
which, together with the requirement to limit gas side velocitiesto 15 - 20 m/sec (compared to 30 m/sec in an oil fired boiler) leads
to a furnace whose volume is about three times that of theequivalent oil fired boiler.
3.2. Pulverised fuel
The general characteristics of this method of firing are similar to
those of oil. The coal is crushed from 30 mm lumps to face powder
consistency in pulverising mills and injected into the boiler where
the particles burn in suspension.
-Furnace--volumes are larger than even the spreader stoker (750 KJ/m3 /hr
release rate compared with 950 KJ/m3 /hr for the spreader stoker and
3000 KJ/mr3 /hr for oil) to ensure that combustion takes place in the
furnace. In contrast to the spreader type, 80% of residual ash
must be-collected as flyash with only 20% as bottom ash.
Turndown ratio is limited to 2.5:1 as the velocity in the coal
delivery pipes to the burners must be sufficiently high to ensure
entrainment but low enough to avoid erosion, Thermal inertia is,
of course, much lower than the spreader stoker, and permissible rates
of change of power; both increasing and decreasing, are as for oil
fired plant.
Pulverised fuel burning plant is well established ashore and has
also been installed for marine application, althongjh this is the

WEG 81 A2-4
exception rather than the rule. Perhaps the principal
disadvantage of pulverised fuel systems concerns the question
of safety, and the risk of spontaneous ignition. This can be
largely overcome by pulverising the fuel on the boiler front
imnediately prior to combustion, thus eliminating the
requirement for pulverising facilities ashorg or the need for
inerting the pulverised fuel bunkers. The mills themselves must
have a turndown ratio comparable to that of the boiler, and there
is probably little risk of explosion within the mills fuel rich
atmosphere. The mills are,however, fairly large items and are
noisy ip operation.
3,3 Fluidised bed combustion
A substantial disadvantage of both pulverised and spreader plantas far as operational flexibility is concerned is their inability
to accept types of coal which differ widely from that for which
they were designed. Coal is notoriously variable in its chemical
make up and changes in calorific value, ash softening temperature,
'ize, Wetness and impurity content present difficulties for the
designer.
Fluidised bed units, however, can accept wide variations in fuel
quality due to the lower combustion temperatures and rapid mixing
of the fuel and air.* In particular, in terms of the total bed
content,. less than 1% is combustible and hence most material in
the fuel.is no disadvantage an 18% - 20% ash content merely Cmaintains the bed depth by offsetting losses by.elutiration. Sulphur
dioxide :emissidn' can be reduced by up to 90% by the addition of
limestone or tblomiie to the bed (for a 40% sulphur content in the
fuel, 0.2 kg limestone/kg fuel yields 50% SO2 reduction).
The low combustion temperatures yield advantages in NO pollutantxreduction and in non fusion of fuel ashes and hence less abrasive
material. Alkali metal retention is a further advantage, and
tests have shown that with a residue containing 120 ppm vanadium
and 75 ppm sodium 97% of the former and 85% of the latter were
retained, This feature can be of considerable benefit in avoiding
corrosion wýhen burning residual fuel oils,
Econ o m iser T o
n g
U ~SulphuricAi
Fobn Recver
f~e enrafr niAsh.
ATMOSHERI ?L./HD ig

WLG 81 A2-5
Fluidised bed cycles
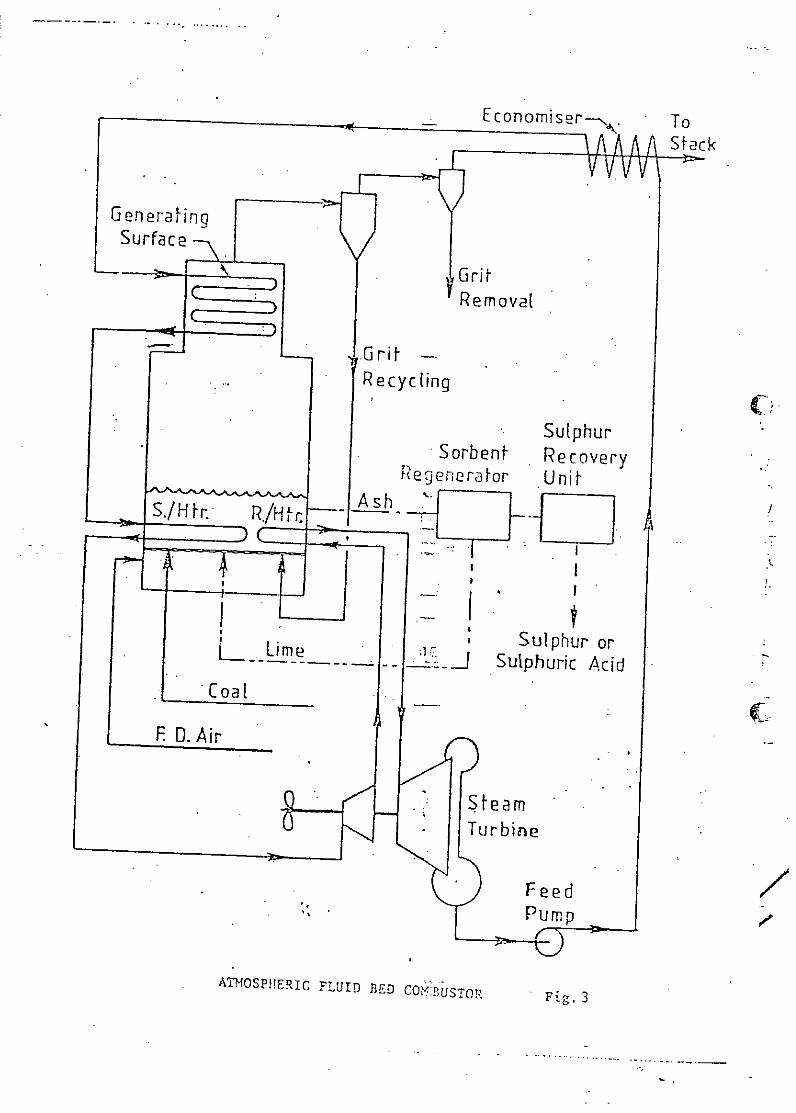
Many combinations are possible, which fall broadly into twogroups
1. Atmiospheric fluid beds, in which the pressure of 1250mmn w~g. in the bed arises from normal system resistance overheating sur faces and through the bed (Fig. 3 ). This isthe simplest cycle, and the fluid bed acts as a combustor forsteam, generation. Prototype designs include bed containmentwails of the fully water cooled membrane type with evaporativesurfaces and superheater and reheater if applicable being
C immnersed in the beds. Some heat exchange surfaces will benecessary. in convection zones to cool the flow gases before theeconomi ser.
2. Pressurised fluid beds, operating at 6 - 8 bars , in whichhigher-rates of heat transfer are possible. These mayincorporate gas turbines (Fig. 4 )or a combination of steamand gas turbines (Fig. 5 )
4. Classification Society Requirements
1. R. Guidance notes for the burning of coal in ships boilers
The Guidance notes imply the use of spreader stokers althoughC pulverised fuel systems and FEC units would also be considered.
-The following points are of particular interest
4.1 Storage
1. There should be *a minimum of two bunkers provided, of course,with fire protection, detection and extinction equipment. Ideallythis should depend on CO 2 but other systems may be acceptable.Adequate clearance space to be provided between heated surfacesand coal bunkers.
2. There should be one daily service hopper per boiler capableof holding sufficient fuel for twelve hours operation at fullpower.

0LA
0 --
LUj
Li
En.

SulphurSorbenf~ Recovery
Evaporator/ -. Regenerator UnitSuiperheaferAs
R e heitI.
Coal I Sulphur or
CleanedCombustion
Ga urbine Fe
C ompressorPRESSURISD FLUID BED COH'mUSTOR Fig. 5

WEG 81 A2-6
4.2 Fuel Handling
1. Duplicate coal feeder systems should be provided unless
the boiler is fitted with an alternative method of firing. This
alternative should be sufficient for propulsion purposes.
2. Adequate access facilities should be provided to clean
blockages and for maintenance.
4.3 Ash Handling
1. Transport:arrangements can be:pneumatic or water slurry and
may form a common system. Both bottom and fly ash collection
facilities should be provided.
2, In the case of pneumatic systems, storage of heated ash
is not-permitted, and in the case of water slurry systems, particular
attent-on must be paid to corrosion inhibition.
3. Both pneumatic and water systems must be provided with two
separate supplies of air or water as appropriate.
4.4 Combustion of coal
1. Balanced-draught systems should be such that there is a negative
bias in the furnace to prevent flue gases or ash from escaping into
the engine room.
2. A minimum ash content in the fuel of 8% is suggested to protect
the grate.
5. Coal burning economics
Basic transport theory shows that the optimum speed is that at which
the fuel cost is approximately one half of the total operating cost.
A coal burning ship will thus have a higher economic speed than the
equivalent oil burner.
5o. Bunkering and energy storage
Let V = ship speed
D = voyage length
t = passage tire
2 energy stored as FuJel in bunkers

- EG 81 A2-7
CV calorific value of oil fuel0
CV calorific value of coalC
/eo density of oil
/o bulk density of coal
Vol bunker volume
W bunker wt
Shaft power P - V
Dand E = Pt when t =
E z. V2 D0
o for the same voyage length-(D constant) the stored
energy required increases with the square of the ship
speed.
A recent study by Meek and Williams (Ref. 3 ) shows that the
optimum speed for coal burning ships can be almost 20% higher than
the equivalent oil burner under certain circumstances.
Assuming, therefore, a 20% increase in speed for the same voyage,
the energy required for the coal burner Ec in terms of the oil
burner is given by
Ec (1.2)2 1.44
E0
Now E = CV x W CV x // x Vol.
Coal characteristics are notoriously variable, but for bituminous
coal, a calorific value of 29 MJ/kg and a specific gravity in bulk
of 0.65 may be assumed. (The specific gravity in bulk varies with
coallump size - the figure quoted is for lump size of 30 mm).
Hence for equivalent ships
Wt of bunkers
CVc cx . . 1.44 x CV° x W o
"- 1 42
fl = fo44 x x ti
:Z,

WLU dl AZ-6
Hence the wt of coal bunkers can be twice the equivalent oil
weight.
Vol. of bunkers
CV x ftc x Vol c =l44 x CV° x x Vol o'c 009
Vo c = 1.44 x 4 2 x 0.95X Vol
3 x Vol
Hence the volume of coal bunker can be three times the equivalent
oil volume. Further, this analysis does not include provision
for shaped bunkers for emptying into coal conveying equipment, and
the loss of flexibility provided by double bottom bunkers.
5.2 Economic comparisons
The above factors obviously weigh against the coal burner.
Additionally, the capital cost of the spreader stoker, boiler and
coal conveying devices is appreciably higher than an equivalent oil
fired marine boiler, and certainly much higher than the corresponding
diesel engined vessel. However, weight for weight, coal can be
1/5 or 1/6 the price of oil.
The detailed study by Meek and Williams looks principally at bulk
carriers in the range 16K to 120K dwt. Smaller vessels down to
8500 dwt were also considered but only in the most favourable
circumstances could these compete with the equivalent diesel: i.e.o
high utilisation and load factor, short turnaround in port, and very
favourable oil/coal price ratio.
In the comparisons between coal firing and diesel, both ships were
assured to be operating at their economic speeds. Where there
were significant variations in speed the basic hull form was
optimised for the appropriate conditions, as increased design speed
implies a longer finer ship with a smaller block coefficient.

WEG 31 A2-9
Deadw.;eight vs Range
The characteristics of coal fired ships in comparison to diesel ships
become immediately apparent from Fig. 6 in that a coal fired ship
of a given size has an optimum range. At ranges below the optimum
the ship is effectively over capitalized and the relatively low sea
time/port time ratio does not allow the lower fuel costs to offset
the high first cost. Above the optimum, however, the increased bunker
weight reduces the cargo carrying capacity and the % saving in RFR
again falls.
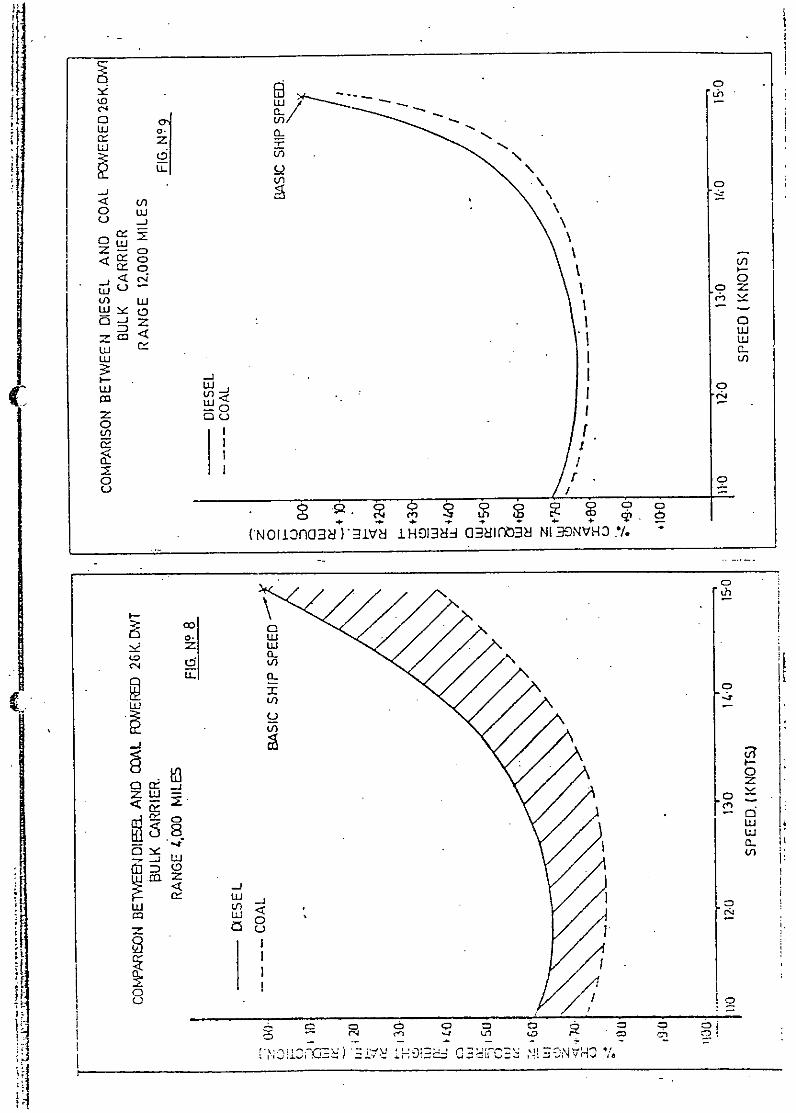
Fig. 7 shows that for short range coal fired ships there is little
point in going above 60,000 dwt and even for longer range (12,000 mm)
the reduction in RFR over about 80,000 dwt is small.
RFR vs speed for different ranges
Figs. 8,9,10 show how the effect of increased range beyond the opttiurm
diminishes profitability. At 4,000 miles the coal fired vessel is
more profitable at all speeds; at 12,000 miles the advantage is only
marginal, and at 20,000 miles the diesel is economically superior.
Fuel cost escalation
The above comparisons were made on the basis of present day operating
costs. If it is assumed that coal prices follow the general level of
inflation but oil escalates at 21% poa. above the general inflation
rate, Meek and Williams' analysis indicates that the coal fired ship
will enjoy a considerable monetary advantage over the equivalent diesel
powered vessel: in the case of a 76K dwt at its optimum range of 12,000
miles the improvement in RFR is approx. 19%, and for a 16,600 dwt at
its optimum range of 4,000 the RFR is reduced by -14%. (Fig. 11).

Mc: I.
t-)-
1t-1
CD
t2 co
LU-
C:
0LJ 40
>-IAO-IODJO 'Z N IL-N!2tf'/ý

Fig. 7
VARIATION OF REQUIRED SREIGHT RATE WITH OWT FORCOAL POWERED SHIPS
(EACH SHIP OPERATING AT MOST ECONOMIC SPEED.).------ RANGE 4000 MILES-
RANGE 12000 MILES.s
40
t~r
•3 5
30 "
10-
; OWT 1-1 IES,lH
4 In'S'
coz
0 LL0
D wU
C)J
< 0n
w
LU 0
LLJ 6U
4) ICCP3 -w
z~ 0-2J Z , tttC Z U ZZ ~ N r ~ I
i]0
H<

Lni
U-1 L-
to C o
w '-) uu uN
~LU
U'DI'
0.icC-o
co Do) <
o IL 0
C-)C?
+ I -* * -rC T I-f l:;~do
UNoUIcm]HYThV8 ii+D9au GoD~fo:3 NI ICNVR3 V.

I .a.
Fj CAL ITHFUEL OIL ESCALATING AT 2112 %p~a
74g&~CGNERL LEVEL OF INFLATION.~~ 16600 OWT BULK CAR RIER.
0 RANGE 4000 n.m.
Fig. 11
DISE
10
LL7
r OA
z30-
Cn
110 1- 3- 40 50 * 70 1-EE KNT)

References
1). Trends in propulsion machipn-y
U. . .Th •:As . O ;. ,,c'p[on. P L. King, I. Brown and
J. Broughton
Paper C82 Symposium of Future Advantages for
Marine Propulsion 5 Mar 1931 I. MAR.E.
2.!. I•y;tnce ,,tes for the Burning of Coal in Ships "ilers
Lloyds Register of Shipping.
3) Proceedings of the Second International Coal Fired Ships
Conference. New York, October 1980
Sponsored by 'Shipping World & Shipbuilder and
Polytech International' (Marine Consultants).
4). Design of a Coal Fired Steam Power Plant for a Containership
J. Femenia
SNAME Shipboard Energy Conservation Symposium Sept 1980.

S
0
S

Fifth WEGEM TGraduate SchoolAdvanced Ship Power PlantDesign and Operation
Paper A 3
Design of modern marine boilers
by
Dr.techn. W. Winkler
1. Introduction
2. The physical basis of boiler design2.1 Heat balance and efficiency of steam generators
2.2 Mechanism of heat transfer and heat bank design2.2.1 Radiative heat transfer in a furnace
- 2.2.2 Convective heat transfer in a heat bank2.2.3 Heat bank design and heat bank characteristic
2.3 Fluid mechanics in boiler design
.2.3.1 The pressure loss of a thermal system2.3.2 Stability of flow in a boiler2.3.3 The principles of natural circulation
2.4 Design of components and choice of material
2.4.1 Determination of the design temperature of heated tubes
-2.4.2 The choice of material
2.5 The influence of corrosion and erosion on the heat bank design3. Boiler and firing systems
3.1 Evaporation systems
3.1.1 The natural circulation system
3.1.2 The forced circulation system
3.1.3 Once-through-boilers
3.2 Firing systems
3.2.1 Oil fired marine boilers
3.2.2 Coal fired marine boilers

Fifth WEGEM TGraduate SchoolAdvanced Ship Power PlantDesign and Operation
3.2.2.1 Stoker boilers
3.2.2.2 Boilers with fluidized bed combustors
3.3 Auxiliary machines
3.3.1 Turbomachines in the boiler
3.3.2 Air preheaters
3.4 The main control systems
3.4.1 The load control system of a drum boiler
3.4.2 The feedwater control system C3.4.3 The steam temperature control system
3.5 Special problems in marine boiler design
3.5.1 Reheat systems
3.5.2 The part load and emergency characteristics of fluidized beds
4. Conclusions $
5. -References

WEG 81-A3-.l
Design of modern marine boilers
1. Introduction
Steam has been associated with self-propelled ships for about
150 years. From the beginning of this century we have been
using the Clausius Rankine Process in steam power plants on
board ships. Fig. I shows the thermodynamics of this well-known
process in a simple steam power plant in an enthalpy-entropy
..diagram. The purpose of this lecture is to tell you something
about the design of fossil fired steam generators in power
plants on board ships. This means that our interest in the process
is restricted to the path from point 1 to point 2 in Fig. 1.
2. The physical basis of boiler design
2.1 Heat balance and efficiency of steam generators
The heat flow in a steam generator' can be illustrated by the
so-called Sankey diagram. Fig. 2 shows an example of this diagram.
The input heat flow Qi in the furnace is defined by the sum
of the fuel heat flow m* . Hu, the recycled heat flow from the
air heater QAH and the cold air heat flow QAC* With the
abbreviations used in Fig. 2 we get:
O2,. = m H, AH + OAc .(2.1.1)
The distribution of heat absorption in the boiler is symbolized
by the- individual heat flows of the heating surfaces. Because
of energy conservation the input heat flow must be equal to
the sum of the output heat flows. These are the generated heat
flow QG, the recycled heat flow from the air heater QAH' the
cold air heat flow QAC and the sum of the losses 1 in our system.
Therefore we can write:J
QA =AC ' +(2.1.2)

WEG 81-A3--2
AOILE -2
P0
s0.s 3-3
STAMPOWE PLANTTE
Fig.M1
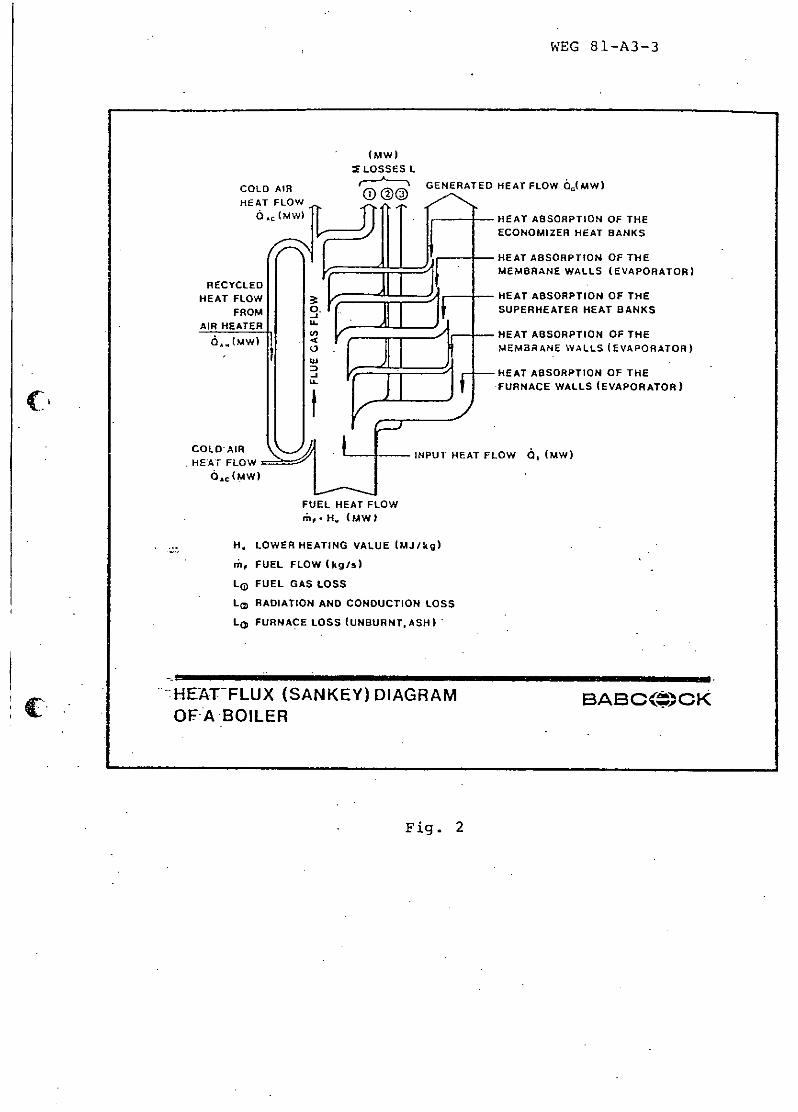
WEG 81-A3-3
(MW)2LOSSES L
COLD AIR GENERATED HEAT FLOW OG(MW)HEATOLOW C0 ©©
6,(MW) "HEAT ABSORPTION OF THEECONOMIZER HEAT BANKS
-HEAT ABSORPTION OF THEMEMBRANE WALLS (EVAPORATOR)
RECYCLED
HEAT FLOW - HEAT ABSORPTION OF THEFROM 0.SUPERHEATER HEAT BANKS
AIR HEATERw ZEEJ HEAT ABSORPTION OF THE
6- (MW) 4MEMBRANE WALLS (EVAPORATOR)
HEAT ABSORPTION OF THEFURNACE WALLS (EVAPORATOR)
COLDAR INPUT HEAT FLOW 05, (MW)HEAT FLOW
FUEL HEAT FLOWH. (MW)
H. LOWER HEATING VALUE (MJ/kg)
rm, FUEL FLOW (kg/s)
Lo FUEL GAS LOSS
L 0 RADIATION AND CONDUCTION LOSS
Lo FURNACE LOSS (UNBURNT.ASH)
'-HE-AT-FLUX (SANKEY) DIAGRAM BABC('0CKOFA BOILER
Fig. 2
WEG 81-A3-4
The boiler efficiency 1 is defined by the ratio of generated
heat flow and fuel heat flow. Eqn (2.1.1) and eqn (2.1.2) lead
to
1 -) (2.1.3)
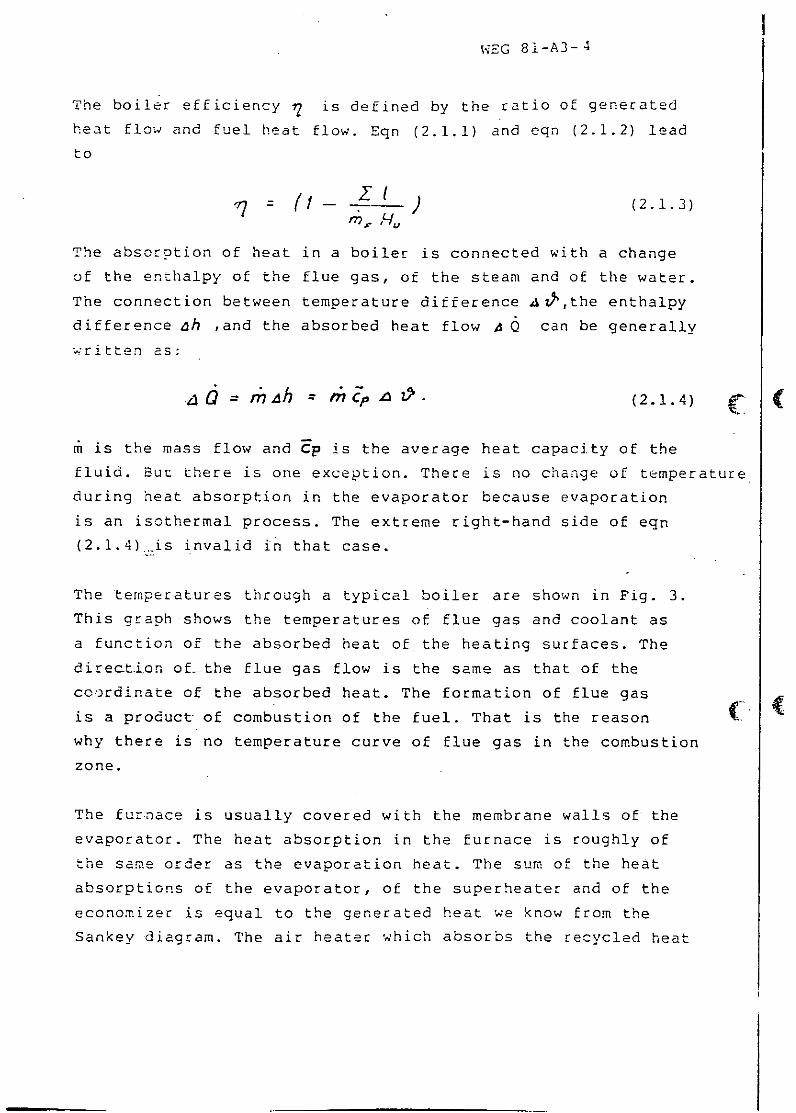
The absorption of heat in a boiler is connected with a change
of the enthalpy of the flue gas, of the steam and of the water.
The connection between temperature difference AtY,the enthalpy
difference ah ,and the absorbed heat flow A Q can be generally
written as:
4Q M* AII = P' (2.1.4) CP (
m is the mass flow and Cp is the average heat capacity of the
fluid. But there is one exception. There is no change of temperature
during heat absorption in the evaporator because evaporation
is an isothermal process. The extreme right-hand side of eqn
(2.1.4) Js invalid in that case.
The temperatures through a typical boiler are shown in Fig. 3.
This graph shows the temperatures of flue gas and coolant as
a function of the absorbed heat of the heating surfaces. The
direction ofrthe flue gas flow is the same as that of the
coordinate of the absorbed heat. The formation of flue gas
is a product of combustion of the fuel. That is the reason (
why there is no temperature curve of flue gas in the combustion
zone.
The furnace is usually covered with the membrane walls of the
evaporator. The heat absorption in the furnace is roughly of
the same order as the evaporation heat. The sum of the heat
absorptions of the evaporator, of the superheater and of the
economizer is equal to the generated heat we know from the
Sankey diagram. The air heater which absorbs the recycled heat
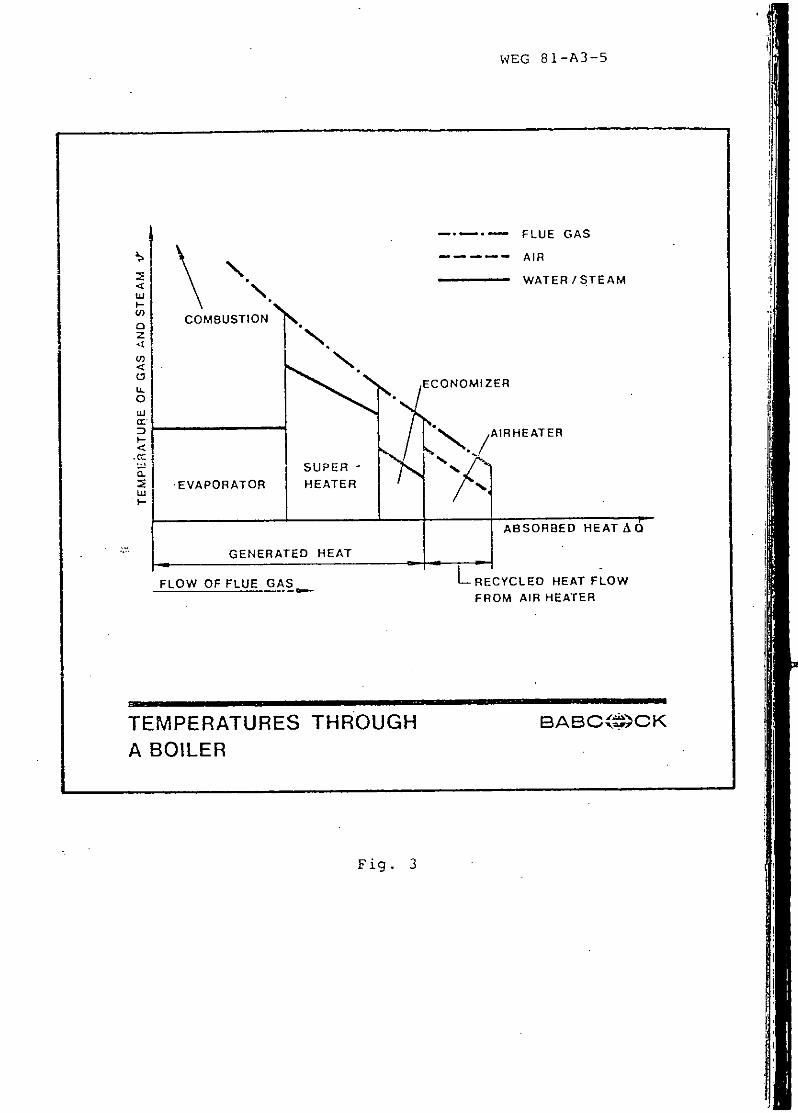
WEG 81-A3-5
... FLUE GAS
AIR
WATER/STEAM
COMBUSTION
.. ECONOMIZER
0
/~ARHEATER
i EVAPORATOR HEATER
ABSORBED HEAT AG
GENERATED HEAT
FLOW OF FLUE GAS. LRECYCLED HEAT FLOW
FROM AIR HEATER
TEMPERATURES THROUGH BABC*tOCK
A BOILER
Fig. 3
WEG 81-A3- 6
flow is usually the last heating surface in the boiler. The
purpose of this diagram is to obtain more precise information
on the course of the temperature differences in the boiler
and by means of that to learn more about the heat transfer
conditions for heat bank design. For example, it is thus easy
to understand one effect of air heaters on the cold end of
the boiler. On the one hand a high feedwater temperature is
needed for obtaining good thermal efficiency of the turbine
process. On the other hand a low waste gas temperature is needed
to achieve a low flue gas loss. The use of an air heater is
a good method of achieving both conditions.
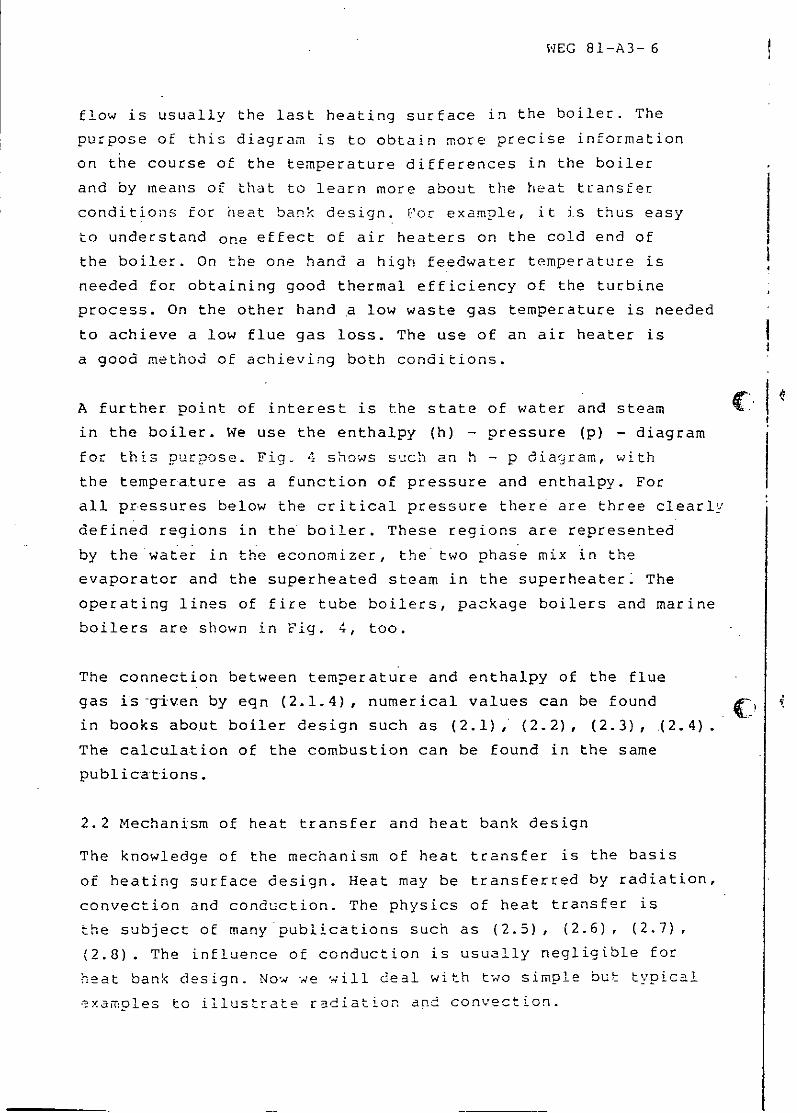
A further point of interest is the state of water and steam CI
in the boiler. We use the enthalpy (h) - pressure (p) - diagram
for this purpose. Fig- 4 shows such an h - p diagram, with
the temperature as a function of pressure and enthalpy. For
all pressures below the critical pressure there are three clearly
defined regions in the boiler. These regions are represented
by the water in the economizer, the two phase mix in the
evaporator and the superheated steam in the superheater; The
operating lines of fire tube boilers, package boilers and marine
boilers are shown in Fig. 4, too.
The connection between temperature and enthalpy of the flue
gas is-given by eqn (2.1.4), numerical values can be found 4.
in books about boiler design such as (2.1), (2.2), (2.3), (2.4).
The calculation of the combustion can be found in the same
publications.
2.2 Mechanism of heat transfer and heat bank design
The knowledge of the mechanism of heat transfer is the basis
of heating surface design. Heat may be transferred by radiation,
convection and conduction. The physics of heat transfer is
the subject of many publications such as (2.5) , (2.6) , (2.7),
(2.8). The influence of conduction is usually negligible for
heat bank design. Now we will deal with two simple but tvoical
examoles to illustrate radiation and convection.
WEG 81-A3-7
R- 7
25-0
IPA C RAITICOLERSIN1 000 -
--
MARFINET BOILERS
SPECIAL BOILERS
50tI II .I I i
0 50 100 150 200 250 300 350PRESSURE ~bar
INDUSTRIAL - AND MARINE - BOILERS B8 )CIN THE h-p-DIAGRAM AC4:K
Big. 4

WEG 81-A3-8
2.2.1 Radiative heat transfer in a furnace
Radiation governs the heat transfer in a boiler furnace. The
absorbed heat a 6 of a furnace can be calculated by the Stefan
Boltzmann law. In furnaces we can write a simolified form:
AQ ./- ()J. (2.2.1)
Fig. 5 shows the connection between the terms of eqn (2.2.1)
and the real conditions in the furnace.
The emissivity of flame E F is a function of the average mean
beam length of the flame If and the fuel used. The dimensions
of the furnace and the design of the burners give the mean
beam length of the flame. The different curves for each fuel
are the consequence of the different C/H ratio of these fuels.
The C/H ratio is a measure of the quantity of radiating soot
particles in the flame.
The emissizvity of the walls E W is a function of the wall
temperature and of the wall material. One can see that a slag
covered wall at a high temperature has a smaller emissivity
than a clean steel wall at a lower temperature. This means
that we get a lower heat absorption 0 6 in slagged furnaces
for two reasons. On the one hand there. is a higher wall temperaturt
caused by the heat resistance of the slag layer and on the
other hand this higher temperature leads to a lower emissivity
of the walls F too. The eqn (2.2.1) shows that the heat absorption
becomes less in both cases.
C in (2.2.1) is the Stefan Boltzmann constant. The view factor
WF can be calculated for a given shape of flame and furnaces
as shown in (2.8) or (2.9). A graphic method was given by NuBelt
(2.10) in 1928. The heating surface AW of the furnace is given
by the furnace construction. TF is the average flame temperature
in Kelvin degrees and T W is the average wall temnerature in

WEG 81-A3-9
GEOMETRY OF MILD STEEL
-COAL FLAME AND5QUALITY OF
O FUEL/•t . .SL ADT TEMPERATURE OF WALL •r
AVERAGE MEAN BEAM LENGTH
OF FLAME L,
TEMPERATURE AND
MATERIAL OF
WALL
2IFURNACE
GEOMETRY OF FLAME WAL
I AND FURNACE
-9 KLAME?
x0
RADIATION HEAT TRANSFER IN FURNACES BABC(k)CK
Fig. 5

WEG 81-A3-10
Kelvin degrees (T1, = + 273). The average flame temperature
TF can be found as shown in (2.11).
2.2.2 Convective heat transfer in a heat bank
Generally we can write
. A -((2.2.2)
for the absorbed heat z Q of a heating surface element in the
flue gas flow. a is the heat transfer coefficient, A is the
heating surFace, ^9a is the average temperature of the flue
gas and 1is the average temperature of the wall of the element.
Convection governs the heat transfer in relatively cold heat Cbanks such as-economizers or air heaters. The methods of calcu-
lating the convective heat transfer are based on the laws of
similitude first given by NuBelt (2.12) in 1915. In boiler
design we can use a simplified form (2.1) to calculate the
convective heat transfer coefficient of a single tube:
0,287 636 03164 -0,234 0,6 do ," (2.2.3)
a60 5 CoI7vA Gos 760. jo *
'1Gos is the coefficient of thermal conductivity, Cp Gas is theheat capacity, qr., is the viscosity and 4 is the mass flowdensity-of the flue gas. The outer tube diameter is named dout*
Fig. 6 shows how to work practically with, the equation in boilerdesign. First we calculate the convective heat transfer coefficientof air as given by eqn (2.2.3). The convective heat transfer
coefficient of air c is used as a reference number..air
We have to correct this number for different flue gases. Wedo this by a multiplicative term called fGas to take into
consideration the different matter constants. This term isa function of the average boundary layer temperature 19 and
the percentage of water XH20 and carbon dioxide XC0 2 in the
flue gas. We now calculated the heat transfer coefficient of

WEG 81-A3-11
-,, GAS DUCT
I.L AVERAGE BOUNDARYLAYER TEM.P. r.
REL. LONGITUDINAL PITCH
0tGAS CONy. (11 AIR $GAS
tGEOMETRY
CONVECTIVE HEAT TRANSFER BA BC (4') K
Fig. 6

WEG 81-A3-12
a single tube. But in a real boiler there is a tube bundle
and not just a single tube. Many exoeriments and measurements
led to a multiplicative correction term to use the single tube
solution for the tube bundle. This correction term f eometryis a
function of the relative longitudinal pitch and the relative
latitudinal pitch. Fig. 6 shows a principal graph of fceoetr
The product of these three terms is our required convective
heat transfer coefficient coGs cony for a tube bundle in a flue gas
duct.
2.2.3 Heat bank design and heat bank characteristics
Fig. 7 shows how to proceed when designing heating surfaces.
The first design step is to calculate the heat balance for
the -heating surface. Then we know the logarithmic temperature
d if ference
Al = ,- - -vt,)(2.2.4)
and the range of temperature for the required matter constants
as we see in Fig. 7.
The heat transfer on the gas side is a combination of radiation
and convection. It is useful to define a radiative heat transfer
coefficient. If we combine eqn (2.2.1) and (2.2.2) we get for
a radiating gas the heat transfer coefficient
EO.• 7601- rw C0 / too (2.2.5)
The indices are changed from F (Flame) to Gas in eqn (2.2.5).
The heat transfer on the gas side can now be defined by
C4 ne- ,4L+ a r .(2.2.6)

WEG 81-A3-13
RANGE OF TEMAP. ht AT ADSORPTION .%OHEATTRANFER(DEMANDED)I
HEAT BALANCE
I 2
FLUE GASGAS
STEAM
A5NBEHA
NE-AT TRANSFER COEFFICIEN
T
A
ILn
Fig. 7

KEG 81-A3-14
The heat transfer on the steam side of the tube is governed
by convection. The calculation is described for example in
(2.1), (2.2) , (2.13).
The conductiv.e heat transfer is dominant in the tube walls.In Fig. 7 A is the coefficient of thermal conductivity ands* is the corrected
, do- I d (2.2.6a)
2 d;
wall thickness of the tube. d is the outer and d. is the innerdiameter of the tube. The correction of wall thickness is
necessary because there is a circular and not a plane shape.
The heat t-ansl.•e. coeffi!cients on the gas sid•e, -n the steamside and in the wall can be combined and we obtain
= 'ffl" + -1 (2.2.7)
The surface needed can be calculated by
A - (2.2.8)kA*
The calculation of heating surfaces is usually carried out
for 100 percent load. The part load characteristic of the
live steam temperature is very important for boiler operation.
Therefore we must check how the heat bank works under part
load conditions. Fig. 8 shows the influence of radiation and
convection on the part load characteristics of the steam outlet
temperature of a heating surface. Because it is usually valid
S < ' s$ea,., ; /5* (2.2.9)S

WEG 81-A3--15
HEAT FLUX
RADIATION CONVECTION
O 0
(LOAD LOAD
Li
0x
. LOAD
ISTEAM TEMPERATURE IN HEAT BABC,#)CKBANKS AS FUNCTION OF LOAD
Fig. 8

WEG 81-A3-16
AGas is the leading term in eqn (2.2.7). This is the reasonwhy the gas side heat transfer is the leading influence for
the part load characteristics. The heat flow in the heating
surfaces i s the result of radiation and convection on the gasside. The average gas temperature and the mass flow density
of the flue gas both decrease with decreasing load. The steam
outlet temperature always decreases with decreasing load if
the heat is transferred by convection but always increases
with decreasing load if the heat is transferred by radiation.
In practice there is always a combination of radiative andconvec.ive heat transfer. A proper choice of this combination
during heat bank design makes it possible to obtain a relatively
constant live steam temperature.
2.3 Fluid mechanics in boiler design
The main aims of fluid mechanics in boiler design are to achieve
a stable flow through the heated components and a low pressure
loss of the system. The basis of all calculations is thecalculation of the pressure loss of a thermal system.
2.3.1 The pressure loss of a thermal system
Fig. 9 shows the principal way to calculate the pressure loss
of a thermal system. The pressure loss of a flow in a tube
elementccan-be calculated by eqn (2.3.1)
4P f..V (2.3.1)
is the resistance coefficient of the tube element. V is
the average specific volume of the fluid and $ the mass flow
density of the fluid in the element. We can write for one tube:
(2.3.2)d' 7r

NEG 81-A3-17
J b.
ApA p - ; ±
2
- 4wP
h- -O-A
- CRIT ICAL POINT
PRESSURE-LOSS IN HEATED SYSTEMSBAC)K
Fig. 9

WEG 81-A3- 18
m is the known mass flow and d is the inner diameter of the
tube. The heat absorption A Q of the element is known. In the
element z p/V is constant for one mass flow II. The average
specific volume V is a function of the average enthalpy hin In
hm + (2.3.3)
and the average pressure pm of the fluid. We obtain
Pn :P; AP (2.3.4)
as average pressure in the element from (2.3.1) with an estimated
V I . is the pressure at the inlet of the system. This averagem 1
pressure p is the system pressure for determining v again.
This iteratio2ý can be carried on until the difference between
the two V of the two last steps is less than a permissible
variation and we obtain the pressure loss of the tube element.
This algorithm is applicable to each thermal system and is
the basis for further discussion.
2.3.2 Stability of flow in a boiler
A stable flow through the heated tubes is necessary to achieve
adequate cooling of the heated components. Therefore it is
important to examine the flow distribution in the single
parallel tube systems and in the headers. First we will
discuss what may happen in one single heated tube.
The largest change in the specific. volume occurs in a heated
tube with water at the inlet and superheated steam at the
outlet, as known from the evaporators of once through boilers.
This means that there is a very great influence on the pressure
loss of a tube between inlet and outlet header due to this
change in the specific volume. Let us assume that there is
a given geometry of one tube and a fixed enthalpy and water
pressure at the inlet.

WEG 81-A3-19
HEATED TUBE
Ap UNHEATED TUBE
//
A/ I /
2/
rilrm 3 rho rn
CHARACTERISTICS OF B ABC(l)OK(PRESSURE LOSS IN HEATED TUBES
WITH TWO PHASE FLOW
Fig. 10

WEG 81-A3- 20
The pressure loss characteristic of this tube is a parabolic
one if the mass flow is varied and the heat flow is zero. We
get a curve like that numbered with (1) in Fig. 10. Curves(2) and (3) are characteristics with an increasing heat flow
6 Q. Thc: curve (3) shows an example withL a very strong andsudden of the specific volume along the heated tubeand we get a saddle in the curve.
The consequence of this saddle is that there are three differentsolutions for mass flow mi for only one pressure loss a p1in the tube. The pressure loss b p1 is defined as the pressureloss between the inlet and the outlet headers if there is a
tube bundle. Some tubes may have a mass flow m 3 (1) and the Crest of the tubes may have a mass flow m (3) if there are
mass flow m(2) i o tbethree mass flows possible. The mass flow mn3 ( s not stable.The out.... enthalpy otf the flow in tubes with the mass flow
m1 (3) is much higher than the outlet temperature of the rest.This means that there is no guaranteed cooling of the system.
These problems are discussed comprehensively, for example, in
(2.14), (2.15) , (2.16), (2.17).
2.3.3 The principles of natural circulation
The large difference in the specific volume of water and steamcan be used to guarantee the flow through the vaporizer tubeswithout a pump. Fig. 11 shows how the natural circulation works. (Each natural circulation system consists of a separator (usuallya drum), downcomers filled with steam free water and heatedfurnace tubes filled with a steam-water mix. The average density
of water fcr is of a much greater order of magnitude than
the average density p of the two phase flow in the furnace
tubes. Because there are communicating tubes a state of equilibrium
can only exist if there is a pressure loss in the system. This
means that there must be a flow in the system. We can write:
H
PDC . p H - 9 = 4 AP.AIC,) (2.3.5)
0

WqEG 81-A3--21
RIESH CI
00
TUBES i m Q
STEAM'
0STEAM-FRPEEuSUEBC00LED BURaNERS 3
WATERfw 0
(D) STEAM SEP. & RISERS
(1% FUaN. TUBES
(D3 SUPPLIES a oOWNCOhAERS
p 0 < g.H)gfoP dIHtEraacTICTrN+APSHOCIC ALPACCEL.
DOWNOOMER HEAD - GRAVITY HEAD =FLOW LOSSES
PRINCIPLES OF BABOC( K- )CNATURAL CIRCULATION
Fig. 11

WEG 81-A3-22
as the conditional equation of a natural circulation system.±he abbreviations in eqn (2.3.5) are the same as used inFig. 11. The terms of eqn (2.3.5) are drawn for an exampleof a 180 bar pressure boiler on tihe right hand side of Fig. ii.Correct design of downcomers, fu.rnace t"ubes, risersand steam separators is the basis for adequate cooling of theevaporator tubes. A description of the design of naturalcirculation loops can be found for example in (2.2), (2.3),
(2.4), (2.18).
2.4 Design of components and choice of material
The thermal design and the examination of the flow in the systemyield the input data for the design of components. The mostimportant components in boilers are heated tubes. The designof a heated tube is a good example of the design of boiler
components.
2.4.1 Determination of the design temperature of heated tubes
Fig. 12 shows the temperatures inside and outside of a heatedtube. The medium temperature of the wall wall/mediur is the
characteristic temperature for the design.
We know the heat flow, the temperature of gas •Gas and steam
steam and the heat transfer coefficient cGas and csteamfrom the thermal design. For the heat flow we can write (
, ('°c - @WoI1/c,) (2.4.1)
qstea 46qs : (J.or- "% , •(2.4.2)
= .s'- Qt'am )(2.4.3)-- + -- +
C, A•€1 •S4
,td

wEG 81-A3-23
OF tOGAS ,WALLGAS1'
THEO ETIAL AW WALL TEMERTUE AAMC()CK

WEG 81-A3-2 4
These equations and eqn (2.2.6a) lead to
Ilf 9 ./wo, 4%,14/GS - 17 W U I (2.4.4)
SWall/Medium is the theoretical design temperature of the
wall. But in boiler operation there are some effects that cannot
be defined by exact mathematical equations. Therefore it is
necessary to add safety margins in eqn (2.4.4) for obtaining
the design temperature.
Fig. 13 shows how we obtain the main deviations from the theoretict•
values and how we arrive at the safety margins. The three
dimensi.onal flow and the te-.wperatu re prof ile of the flue oas
lead to deviations of o Gas and t9 across the flue gasGas " Gas
duct compared with the average design values. Fouling of the
heat banks leads to additional deviations of a Gas and tGas*Devatioso ~ ado
Deviations of steam steam are mainly caused by the
flow distribution in the headers, different flow resistances
in the single tubes and the tolerance of the regulation system.
In addition, the deviations of the steam and gas side are matched
by the mechanism of heat transfer.
The safety margins are defined as d3 l for deviations caused
by fouling and tolerances of calculation and regulation, as
,a 9 for deviations between the single trains of a heat bank2
and the mean value and as & V 3 for deviations between the single
tubes of one train of a heat bank. We can now write
wall/design = wall/medium f 4-+ X (2.4.5

WEG 81-A3-25
At
THREE DIMENSIONAL FLOW FLOW DISTRIBUTION IN THEAND TEMPERATURE PROFILE HEADERS.DIFFERENT FLOWOF FLUE GAS RESISTANCE OF THE TUBES
a GAS 0 GAS ýTA
INFLUENCE OF FOULINGTOLERANCE OF CALCULATION DEVIATION OF REGULATION
-O *A *A.- . AO
WaALL/DESIGN - WALL/MEDIUM A 11)1 + A,52 + A03
DESIGN TEMPERATURE OF . BAB (.)OCKHEATED TUBES
Fig. 13

WEG 81-A3- 26
The emoirical safety margins a 0 0, 2 and o -3 are the result
of many years' experience in boiler design.
2.4.2 The choice of material
The design temoerature is one parameter for choice of the materialneeded. The second parameter is the maximum stress in the component.We get the design stress c for a tube from:
p __ (2.4.6).
T (d, d;~)
The yield stress and the 200,000 hr rupture stress of a materialare the boundary conditions for eqn (2.4.6). Both are a functionof the temperature for each steel. For example, Fig. 14 showsthe tv;t.c.a. t...ing curvc-Žs of th:se functions for two steclsA and B. The yield stress limits the allowable stress of lowtemperatures while the 200,000 hr rupture stress limits thestress allowable at high temperatures. The left hand partsof the dcurves in Fig. 14 are the limiting curves due to theyield stress while right hand rapidly descending parts ofthe curves are due to the 200,000 hr rupture stress. Eqn (2.4.6)gives the design stress of the tube. The needed design temperatureis known by ean (2.4.5). The tolerable design temperatureof steel A is smaller than the needed one as we see in Fig. 14.That's why steel B is required. But if we use steel B a larger (9design temperature or a larger design stress is tolerable.
Since the design temperature is limited one can take advantageof the better strength property of steel B. This means thata smaller wall thickness due to eqn (2.46) is permissible.
The choice of material is regulated by the different codesas (2.19), (2.20), (2.21).

WEG 81-A3-27
2
DESIGN PRESSURE GEOMETRY
7STEEL ASTEEL B (REQU-IRED)
L
U)mr
I WýALL/DESIGNA B
WALL/DESIGN ýWALL/DESIGN
DESIGN TEMP.
NEEDED
CHOICE OF MATERIAL B A B C (ý) COK
Fig. 14

ýfT3G 81-A3-28
2.5 The influence of corrosion and erosion on the heat bank desiqn
All the fuels used, except natural gas, contain corrosive
components. Best known is the dew point corrosion caused by
the sulphur in the fuel. But corrosion also occurs on hot tubes
at the ends of furnaces. Let us discuss these problems with
a coal fired boiler as an example. Fig. 15 shows these boundary
conditions for coal fired boiler design. Coal ash corrosion
may occur in the hot zone of a boiler. The thermal design of
the first heat banks after the furnace is determined by the
curve between the stable and the instable region of flue gas
and metal temperature (2.2).
To avoid dew point corrosion in the cold zone it is necessary
to ensure that the metal temperature is higher than the dew
point temperature during operation. The dew point is a function
of the sulphur content of the fuel and the firing system used
(2.22).
All solid fuels contain ash of different composition. This
means that erosion may occur in the boiler. But it is not only
the percentage of ash in the flue gas that causes erosion.
It is important to restrict the flue gas velocity to avoid
erosion. This is one reason why the flue gas velocity in coal
fired-boilers is less than the velocity in oil or gas fired
boilers and we get larger units with coal firing systems with
the same capacity. The topic of corrosion and erosion is discussed,
for example in (2.23), (2.24), (2.25), (2.26), (2.27).

WEG 81-A3-29
&IOT ZONýE (END OF FURNACE) COLD ZONE (AIRHEATER)
1300-
1300 CORROSIVE SOE
oZONE 15
1200 ___
1100.
5I0 - S A A FURNACE50-
S00 550 600 650 700 5
SULFUR CG.T EN r OF FUEL
COAL ASH CORROSION DWON ORSO
FFOR HEAT BANK DESIGN
CORROSION IN COAL FIRED BOILERS BABO (=) K
Fig. 15

WEG 81-A3-3 0
3. Boiler and firing systems
The application of the physical laws is the first condition
oar correct boiler design and construction.
The second condition for a good design is to devote attention
to boiler operation and maintenance. Both conditions together
lead to the various boiler and firing systems we will speak
about now. The main principles of boiler design are the same
for marine boilers as for utility boilers, see (3.1), (3.2),
(3.3).
3.1 Evaporation Systems
Boilers are distinguishable by their evaporation systems.
The most important systems we have to know are the natural
circulation-'system, the forced circulation system and the once
through boiler. More detailed information can he found for
example in (3Z4).
3.1.1 The natural circulation system
The natural circulation system is the oldest evaporation system.
We illustrated how natural circulation works in the last chapter.
The loop of a natural circulation system is shown in principle
on-the left-hand side of Fig. 16.
The feedwater pump, F.P., pumps the feedwater through the
economizer to the drum of the boiler. The drum is the separator
of water and steam and therefore an important but bulky component
of the natural circulation system. Usually drums of modern
boilers are fitted with special steam separators such as cyclones.
The right-hand side of Fig. 16 shows the mass flow through the
evaporator mEV as a function of load. mst is the live steam
mass flow. The shape of the mass flow mEV is caused by the
connection between heating and the change of density of the
two phase flow in the evaporator tubes as a function of load
(see egn (2.3.5)).

WEG 81-A3-31
SH
pST E
DRUM
CEEC ON0MT -j
MEV LLU)
LOAD
THE LOOP OF A BA BC (O) KNATURAL CIRCULATION BOILER
Fig. 16

WEG 81-A3-32
The main advant;ages of a natural circulation boiler are that
the feedwater q;ality can be relatively low, that there is
no pressure los: in the evaporator and that no start up system
is needed to co;l the evaporator. The main disadvantages are
tha.t the system is sensitive to fouling, that sliding pressure
operation is litidted by the allowable temperature gradient
in-the thick wa.ds of the drum and that the operating pressure
is sub-critical A description of natural circulation boiler
design can be found, for example, in (2.2), (2.3) and (2.4)
sliding pressur. operation is discussed in (3.5) and (3.6).
3.1.2 The forcrd circulation system
FPlc. 17 shows the loop of a forced circulation boiler. This .
loop is very si:xilar to the loop of a natural circulation boiler.
The:gravity heatI is increased by the head of a circulation
pump C.P. in ' roced circulation boilers. That means that a
larger pressure loss of the system can be chosen than for a
natural circulation boiler. The design of these boilers is
not- restricted by the conditions of natural circulation as
we know from eqsi (2.3.5). The pumping head of the circulation
pump is an additional term on the left-hand side of this eqn
and equalizes an- additional pressure loss of the system. The
right-hand side of Fig. 17 shows the shape of the mass flow
through the evanorator mE and the live steam flow An as a
.function of load. The maximum of mEV is at minimum load. This
is caused by th,ý decreasing percentage of steam in the evaporatort'"
tubes at dedrea.csing load. ......
The advantages ;:nd disadvantages of the forced circulation
system are the same as we know from the natural circulation
boýiler. Compare' with the natural circulation boiler there
it<nearly no rertriction in tube design of the furnace caused
by. the loop. Bu! additional expense is incurred due to the
circulation pum';, its stand-by pump, a special flow control
system for pump, and evaporator and due to the additional power
consumption. Th- design of forced circulation boilers is described
for. example in -2. 2), (2.3) and (2.4) again.

p.- WEG 81-A3-33
SHI
cECON0MSU)
F.PP c/n
LOAD
THE LOOP OF A BABO(,!)CKFORCED CIRCULATION BOILER
Ficg. 17

WEG 81-A3-34
3.1.3 Once-through boilers
The left-hand side of Fig. 18 shows the loop of a once-throughboiler. During normal operation the feedwater flows throughthe economizer to the evaporator and leaves the evaporator
as slightly superheated steam.
The sediment bowl is between the evaporator and the superheater
and is not in operation at normal load conditions. Once-throughboiler operation is defined by the condition that the massflow through the evaporator AEV equalizes the mass flow tothe superheater ms.
.The.minimum load of once-through boiler operation is limitedby the cooling conditions of the evaporator tubes in the furnace.If the load needed is less than this minimum load the sedimentbowl and:.the circulation pump go into Operation anti the allowableminimum mass flow through the evaporator is secured.
The main advantages of once-through boilers are that the boileroperates very fast, that sliding pressure operation and super-critical operation is possible, that the system is not verysensitive to fouling and that the bowls are small componentscompared with drums. The main disadvantages of a once-throughboiler are that the feed water quality must be very high andthat there is-a pressure loss in the evaporator. Once-throughboilers, very suitable for large units, are not so important (for marine-installations. More about once-through boilers canbe found, for example, in (3.7).
3.2 Firing systems
The boiler construction is mainly influenced by the firingsystem used. The fuel can be solid, liquid or gaseous.Oil and coal are the main fuels used on board ships.marine boilers are therefore designed for these fuels.More is said about these fuels in (3.3).

WEG 81-A3-35
S H
C. cP m rEv rýnEV- inST is
I CO
cn
F.RP LOAD
(THE LOOP OF A SBA80(O)CKONCE THROUGH BOILER
Fig. 18

WEG 81-A3-36
3.2.1 Oil fired marine boilers
Oil has been the most important marine fuel since the 1920's.
Fig. 19 shows a typical modern oil-fired marine boiler.
The drum axis is parallel to the longitudinal axis of the ship.The membrane wall consists of evaporator tubes. The burners
ace installed on the top of the furnace in the first pass.
The flue gas flows down from the burners through furnace and
screen into the second pass. The second pass houses the super-
heaters and the economizer. The air heater is mounted between
the boiler outlet and the stack. The main advantages of oil
fired boilers are easy handling of the fuel, relatively little
fouling in the furnace and heat banks, low erection costs and-
the low bunker volume needed as a result of the high lower .
heating value of the fuel. The main disadvantages of the oil
firing system are the rapidly increasing fuel costs. Oil-fired
marine Lojlers and tl!eir firing equipment are described, for
example, in (2.4), (3.1), (3.2) and (3.3).
3.2.2 Coal-fired marine boilers
Fig. 20 shows the possible flow states in the furnace as a
basis of process technology of firing systems for solid fuels...!.
The flow velocity of the combustion air in a stoker is relatively'.
small. A stoker is simply a fixed bed of coal and ash particles. N
The pressure-drop in this fixed bed is less than the pressure
on the-bottom caused by the weight of the particles. If the
air velocity is increased the pressure loss increases, as the
pressure loss of air equals the pressure on the bottom. At
that point the bed becomes a fluidized one. The stage of
fluidization can be maintained over a range of increasing
velocity until the particles are discharged. During the
fluidization stage the pressure loss in the bed equals the
pressure on the bottom, this means that the pressure loss in
the bed must be constant. The effect of increasing air velocity
is only an increasing bed height during fluidization. The pressure
loss increases with increasing air velocity not before the
discharge point is reached. The particles leave the bed because-
the pressure loss in the bed overcomes the pressure on the
b.ottom. The pneumatic discharge is realized in Pulverized coal
firing systems. Th2 pulverized coal firing system is very im- .

WEG 81-A3-37
BURNER..~
LPLAN TUBE
FURNACE SCNDARY -SN
OIL FIRED NATURAL SAB'Z()OKCIRCULATION BOILER
Fig. 19

wzEG 81-A:3-38
11111H
...I.
. .
FLIIZN DICAG
POINTPON
U)J0 .
w FIXED BED IFLUIDIZED BED DISCHATIC
-J I PIJ1-'ERIZEL COAL-
III STOKER IFBC I FIRING SYSTEM
REL. FLUID VELOCITY
PROCESS TECHNOLOGY OF BB(OFIRING SYSTEMS FORSOLID FUELS
4
Fig. 20

WVEG 81-A3-39
portant for utilities due to its very good combustion efficiency.
But this technology requires a complicated coal and ash handling
system and its use is therefore questionable in marine in-
stallations. The stoker and the fluidized bed combustor are
the firing systems that might lead to a renaissance of coal
on board ships. Generally we can say that coal handling is
more complicated than oil handling, but the advantage of coal
is that it is cheaper.
3.2.2.1 Stoker Boilers
Fig. 21 shows the conception of a natural circulation marine
boiler with spreader stoker tiring equipment. The axis of the
drum is again parallel to the longitudinal axis of the ship.
The membrane walls consist of evaporator tubes supplied with .
water from the downcomers. The spreaders are mounted in the
front walls. The moving direction of the stoker is against
the direction of casting. In contrast to this, a travelling
gate removes the coal from the feeder. one side wall is designed
as a dividing wall to the second pass. The second superheater
is fitt~d in the second pass while the first superheater and
the economizer are fitted in the third pass. The flue gas
flows from the third pass through the air heater to the stack.
The ash is collected in the ash hopper under the stoker and
between the second and the third pass.
Some stokers are fitted with fly ash recycling to improve the
C c-ombustion efficiency.
The advantages of stokers are simple and reliable construction,
a wide control range and a low power consumption. The disadvantages
of stokers are the sensitiveness to the quality of coal and
the worsening of the combustion efficiency as a result of a
high ash content and small particles less than 1 mm in the
coal used. More detailed information can be found in (2.2),
(2.3) and (3.9).

WqEG 81-A3--40 -
ttT
CPREADER SH I--,
STOKER. ... ..
NATURAL CIRCULATION BOILER B ABC0CKWITH SPREADER STOKER
Fig. 21
I4EG 81-A3- 4 1
3.2.2.2 Boilers with fluidized bed combustors
Fig. 22 shows an example of a natural circulation marine boiler
with a fluidized bed combustor. The drum axis is parallel to
the longitudinal axis of the ship. The wall design is a con- P
ventional one with evaporator membrane walls. The fluidized
bed is fitted with evaporator and final superheater tubes.
The first and second passes house the first superheater stages.
The third pass houses the economizer and air heater tubes.
The bed is divided by membrane walls into four sections to
equalize the disturbances on the free surface of the fluidized
bed which are caused by the rolling motion of the ship. These
membrane walls consist of forced circulation. evaporator tubes.
A new component in boilers is the ash cooling system under
the fluidized bed. The dry cooling of ash is necessary for
ash handling in pneumatic conveyors. There are different coal
feeding systems in operation. Coal can be fed by spreaders, J
pneumatic conveyors or feed screws. Like stokers some fluidized
bed combustors are fitted with fly ash recycling to improve
combustion efficiency.
The main advantages of marine fluidized bed combustors are qthe wide range of feedable coals including ones with high
ash
content or waste oil and the low pollution combustion. The
main disadvantage of fluidized bed combustors is the relatively
high power consumption compared with stokers. The problems
of fluidized beds on board ships are described, for example,
in (3.10) or (3.11). A general view and a synopsis of the process
technology can be found, for example, in (3.12) and (3.13).
3.3 Auxiliary machines
The design of boilers is not complete without the design of
auxiliary machines such as fans, pumps and air heaters.
Correct design of these components is very important for boiler
operation, boiler availability and power consumption of theunit .! 4-i

WEG 81-A3-42
<I-v-
AIRHEATER
i~I ~ - ~SH2 SHI
. c½. > .A.N L_
I ___-______li._ I ,"•.. ECON
IEV SH3
4 i__ -- -" B ÷ _
FLU]DI .Z . D ý PARTITION WALLSBED _ .
COMBUSTOR
FLUIDIZED BED BOILER BABO4•)CK
Fig. 22

WEG 81-A3-43
3.3.1 Turbomachines in the boiler
The turbomachines used in the boiler are the fans and the pumps.
Flow to design the turbomachines can be seen from the example
of a pump. The principles of pump design for a thermal system
are shown in Fig. 23- We know the pressure characteristic of
the boiler from our design calculation. The mass flow and the
pressure needed before the boiler at maximum load define the
design point of the system. The pumping head of the available
pumps is known from the pump characteristics given by their
manufacturer. The choice of pump must guarantee a reserve
of
pumping head as defined by the individual design codes such
as (3.14). The pump design is described, for example, in
(3.15) and (3.16).
The design of the forced draught fan and the induced draught
fan is similar to the pump's design.
Knowledge of the increasing pressure loss and waste gas temperature
at the end of a long operation period is important for defining
the design point. The design of axial fans for power stations
is dealt with, for example, in (3.17).
3.3.2 Air preheaters
In boilers air heaters are used to reduce the waste gas temperature
as discussed in 2.1 and to preheat the combustion air to obtain
better ignition conditions in the furnace. Fig. 24 shows the
two main principles of heat transfer used in air heaters.
The recuperative air preheater shown on the left-hand side
is usually a tube system comparable with the heat banks in
the boiler. In our example we have a tubular air heater with
the air inside and the gas outside of the tubes. There are
also designs with the flue gas inside and the air outside of
the tubes, but the disadvantage of these designs is a worsening
of the tube cleaning possibilities, Steam-heated air heaters
are recuperative air heaters, too.

WqEG 81-A3-44 A
A* PUMPING HEAD
- --- -- - -
V .DEIG-PIN* ~ RESERVE~
RE E
(DEINPOESI ECANCERSI
OF THE THERMAL SYSTEM
MASS FLOWm *
PUMP -DESIGNTFOR A BABC(;)CK(I THERMAL SYSTEM,
Fig. 23

WEG 81- A 3- 4 5
The regenerative air heater is shown on the right-hand side
of Fig. 24. A regenerative air heater consists of a rotor and
a stator. The rotor is fitted with the sheet package heating
surfaces. The stator is divided into a gas and an air section.
The slow rotating rotor is heated by the flue gas and cooled
by the air during its run through both sections.
The regenerative air heater is most used because there
are
important advantages compared with the tubular air heater.
The regenerative air heater requires only a small
space, is
easy to service and to protect from dew point corrosion.
Further
information can be found, for example, in (3.18).
3.4 The main control systems
The optimum control of the boiler is the basis of reliable
boiler operation. The main control systems
we will deal with
are the-feedwater control system, the steam temperature
control
and the load control system. Boiler control systems are
described
in more detail in (3.19) , for example.
3.4.1 he load control of a drum boiler
The load control system is needed to ensure the required steam
generation for turbine and auxiliary systems. The boiler
load
is defined by the rate of the generated steam.
Fig. 25 shows the principle of the load control system. The
live steam flow is measured at the boiler outlet. This measurement
is corrected by pressure and temperature measurement.
The measured
live steam flow is compared with the desired figure. A deviation
leads to a triggering of the fuel feeding system.
More about load control and special problems can be found,
for example, in (3.20).
3.4.2 The feedwater control system
Fig. 26 shows the basic circuit arrangement of the feedwater
control system. The purpose of the feedwater control system
is to secure the feedwater supply as a function of steam
production and drai level. The main principle Ef feedwater
control is the mass flow conservation off feedwatlt and steam.
WEG 81-A3--46
AI PEEAE
RECUPERATIVE REGENERATIVE
AIR PREHEATER AIRPREHEATER
t jGAS
______________ AIR
STEAM l
AIR
0 _______ HITTGAS AIR
PRINCIPLES OF AIR PREHEATERS A0=-K
Fig. 24
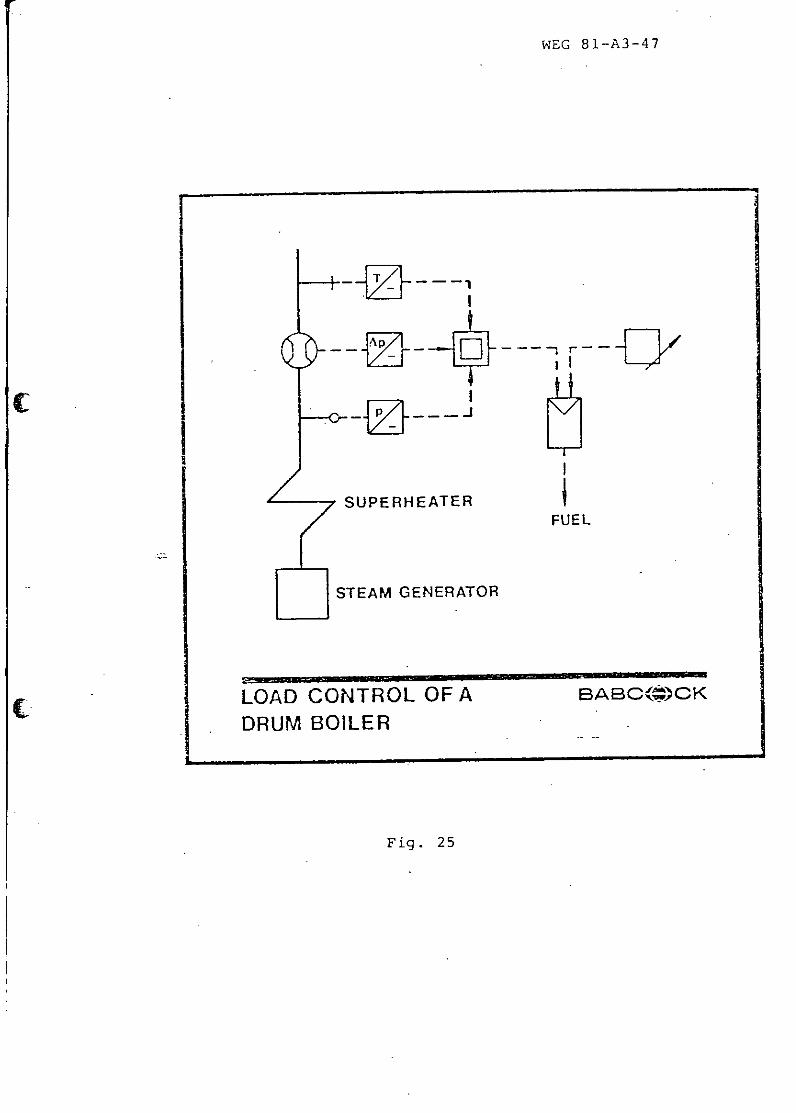
WEG 81-A3-47
SUPERHEATER FFUEL
STEAM GENERATOR
LOAD CONTROL OF A BABC()OCKDRUM BOILER
Fig. 25

WEG 81-A3--48
41 -STEAM FLOW
f -T
EVAPORATO LEVEL
FEE WAERCNRLMAV
FEUWTE
FLOWTE
~~~~FEEDWATER CONTROL SYTMO ALVEC~C
DRUM BOILER
Fig. 26

WEG 81-A3-49
The feedwater flow is measured before the feedwater control
valve. The live steam flow measured by an orifice gauge is
corrected by the temperature and pressure of the steam. The
steam flow and the feedwater flow are compared. The feedwater
control valve is triggered if there is a deviation. But there
is a boundary condition too, because the drum level has to
remain constant during operation. The drum level is measured
and corrected by the drum pressure. This measured value is
compared with the set value of the level. A deviation also
leads to triggering of the feedwater control valve.
3.4.3 The steam temperature control
The purpose of the steam temperature control is to ensure
defined temperatures on the superheater outlets. The live
steam temperature has to be constant during operation.
Therefore the main purpose of this control system is to ensure
a constant live steam temperature. The live steam temperature
can be controlled by the typical control processes such as
spray attemperators (3.21) or heat exchangers on the steam
side and flue gas recirculation (3.22) on the gas side.
A circuit arrangement in Fig. 27 shows the control principle.
In this example the temperature control is secured by heat
-exchange between the outlet steam of superheater 1 and the
boiling water in the drum. The live steam temperature is
measured and compared with the desired figure. The three-way-
Cvalve -is triggered to increase or to decrease the steam flow
through the bypassed heat exchanger if there is a deviation.
The steam temperature measured before the final superheater
is used as disturbance for the disturbance variable compensation
to make the control system faster.
A similar solution of the control system can be used in the
case of spray attemperators of flue gas recirculation. The
system triggers the spray valves or the recirculation fans
in these cases.

WEG 81-A3-50
H SUPER-HEATER 2
I. I
FTI
I
SUPERHEATER 1
DRUM
-ATTEMPERATOR
STEAM TEMPERATURE CONTROL BABCO4)CK
Fig. 27

WEG 81-A3-51
3.5 Special problems in marine boiler design
The rising prices of fuels are leading to an increasing interest
in reheat systems to obtain better process efficiency and in
fluidized bed firing systems to burn inferior coal. Therefore
we should discuss both systems in a little more detail. Further
information is given, for example, by Hodgkin (3.23).
3.5.1 Reheat systems
Reheat systems are standard ways of increasing the process
efficiency in modern power plants of electric utilities.
A lot of publications such as (3.24), (3.25) and (3.26) deal
with reheat.
On board ships there are different load conditions that lead
to different solutions in boiler design compared with utility
boilers. During manoeuvering, the reheat turbine is shut down.
Thus the reheat system is shut down and the cooling of the
reheater tubes is interrupted.
One way of protecting the reheater tubes is shown in Fig. 28.
Fig. 28 shows an oil-fired two pass boiler with reheater. The
furnace with screen is designed as we mentioned earlier. The
second pass is divided into two separate passes fitted with
dampers at their outlets as shown on the left-hand side of
.Fig. 281 The left-hand side pass houses the first superheater
stages. The right-hand side pass houses the final superheaters
and the-reheater. The economizer and the air heater are mounted
in the flue gas duct between the boiler outlet and the stack.
During manoeuvering, the flue gas damper on the right-hand
side is closed by the control system and the heating of the
reheater is shut down. The second effect of the dampers is
the possibility of controlling the live steam temperature
by the control of the flue gas flow in the single passes.
The case of both passes being closed at the same time is
interlocked.
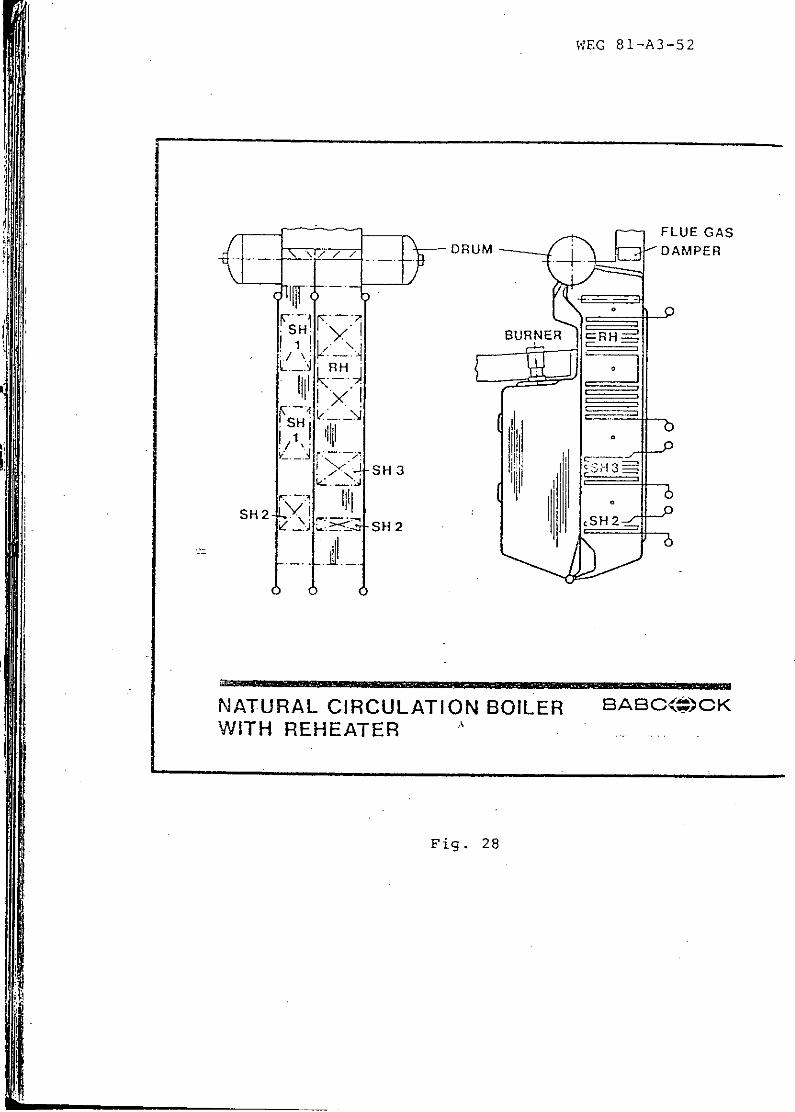
WEG 81-A3-52
FLE AIDRUMIDMEqT / ;RA UNR=HIX
S H
* l__iFý1 Y..N
SH21'YS H 2 ŽSHSH2
NATURAL CIRCULATION BOILER BABO(;#)CKWITH REHEATER
Fig. 28

WEG 81-A3-53
Another way of protecting the reheater tubes is to use highly
heat resistant materials. This can be done in fluidized bed
boilers, for example. One example is shown in Fig. 29. The
fluidized bed boiler shown in Fig. 22 can be fitted with a
reheater. Then the fluidized bed in the reheat boiler is fitted
with evaporator, superheater and reheater tubes. In that case
the heating of the reheater cannot be shut down as in the case
of the oil-fired boiler. We are forced to use heat resistant
material. This can be done because the temperature in the
fluidized bed is much lower than the flame temperature in
oil-fired boilers. The problems of marine reheating are
discussed, for example, in (3:27), (3.28) and (3.29).
3.5.2 The part load and emergency characteristics of fluidized
beds
The knowledge of the part load characteristics of fluidized
beds is important for design and operation. As an example,
Fig. 30 shows the part load characteristics of a fluidized
bed boiler. We have submerged heating tubes in a fluidized
bed as designed to obtain the operating temperature in the combustor
at full load and we need a defined fuel feed flow to obtain
a defined load. On the other hand we have to ensure a defined
bed temperature at any load. At any load there is only one
area of heating surface that will ensure a defined temperature
at this defined load.
These conditions are plotted on a graph such as Fig. 30. The
load is a function of the ratio of submerged surface to installed
surface and the bed temperature is a parameter. In our example
the boiler needs the full surface at 930 0 C bed temperature
to operate at full load.
With this diagram we can show how part load control works.
We can achieve one defined load by a variation of bed temperature
at a defined heating surface or by a variation of the heating
Surface at a defined bed temperature. Therefore the boiler
can be controlled bv:

WEG 81-A3-54
ECON
ATY 2
I.I
Fig. 29

WEG 81-A3-55
100-
0oc,80-\ ___ _ _ _ _
40-
200-
2.u0 __ _ __ __ _ _ _ _
0,2 0,4 0,6 0,8 1,0A SUBMAE RGED
HEAT BANK RATIO AS TALLEDA INSTALLED
PART LOAD CHARACTERISTIC 8AB8<0)CKOF FBC
F .
Fig. 30

yE:G 8l--A3-456
- a vat jation of the ced temceratur:e or
- a variation of the heating surface
for cart load operation.
I Var iation of temperatLCre is very easy but limited by the
comzustion concitions ( rper•ai g temperature of the bed
S00 1000 0 C).
Variation of: the heating surfaces -an be effected by a variation
of the bed surface or by a partitioning of the bed into small
single beds and a shut down of the single beds step by step.
Part load operation is described, for example, in (3.30).
The main emergency interlocks of fluidized bed boilers are
similar to those of conventional boilers. However, the heat
accumulation of the combustor requires different solutions
for fli~o e o]~•to -) ec submer~ged -~tn ubes
in the bed during shut down. This can be done by a combinationof an emergency feedwater supply to cool the tubes with emergency
forced draught fans to cool the bed material.
4. Conclusions
High efficiency, high availability and low plant costs are
the main aims in boiler and plant design. We discussed the
basis of boiler design and how donventional modern boilers can
help us to reach these aims by using reheaters and new coal
firing systems such as fluidized beds.
The main principles we have learned about boiler design we
can use for the design of boilers for combined cycles of steam
and gas turbines, too. As references for this technology one
can use, for example, (4.1) and (4.2).

;qEG 81-A3-57
(2.-1 EDB-P: [ianrluch Wa !me u nld St rdmu nc; s tech n i k
VU Ika-n Verflag . Essen 19 795.
(2.2) Babcock & Wilcox: Steam its generation and use.
Babcock & Wilcox. New York. 1978.
(2.3) M. Ledinegg: Darnpferzeugung. Dampfkessel. Feuerungen
einschl. Atomreaktoren. Springer-Verlag. W~ien-New York.
2nd ed. 1956.
((2.4) K. TIllies: Schiffskessel.
Friedr. Vieweg & Sohn Verlag. Braunschweig. 11960.
(2.5) G-rbber-Erk-Grigull: Die Grundgesetze der W~rme~ibertragung.
Springer-Verlag. Beriini-G6ttiaigeri-Hfeideiýberg. 1963.
(2.6) F. Hell: Grundlagen der Wdrme~bertragung.
VDI Verlag. D~isseldorfi. 2nd ed. 1979.
(2.7) A. Schack: Oer industrielle Wfrmeijbergang.
Stahleisen Vanl. Dusseldorf. 7th ed. 1969.
(2.8) VDT W~irmeatlas. VOL Verlag. Ddsseldorf. 3rd ed. 1977.
(2.9) H.C. Hottel, A.F. Serof'im-: Radiative Heat Transfer.
McGraw Hill. New York. 19,67.
U(2.10), W.NuI~elt: VDT-Z. 72 (1928). p 673.
(2.11) H. Waldm-ann, H. Huschauer: Verfabren zdr Berechnung der
Verteilung von Temperatur und W~rmestromdichte in Feuer-
r~iumen von Grof~dampferzeugern. VDI-Berichte 211 (19714).
p 44 - 58.
(2.1,2) W.Nufleit: Das Grundoesebz des Wtirme~berganges.
GIes.-Ing. 339. (1915). p 4177 - 82 and p 490 - 492
(2.13) Ws.Kays, ,M.E. Crawfford: Convective he-at and mass transifer.
McGraw Hill-. New Yr.1930.

WEG 817A3-58
(2.14) R. KeEer: Str6mungsverhiltnisse im Zwangsdurchlaufkessel.
Siemens Schuckert Werke. Erlangen. 1958.
(2.15) P. Profos: Die Stabilisierung der Durchfluf3verteilung in
Zwanglaufheizflchen. Energie 11 (1959). p 241 - 247.
(2.16) V. Zeman: Probleme der Strbmungsstabilitat in Verdampfern
von Dampferzeugern im Bereich unterkritischer Drdcke.
Energietechnik 24 (1974). p 159 - 165.
(2.17) K. W6rrlein: Instabilitaten bei der Durchfluf3verteilung
in beheizten Rohrstrangen von Dampferzeugern. VGB Kraft-
werkstechnik 55. (1975). p 513 - 518
(2.18) M. Wiener: Latest developments in natural circulation
boiler design. Babcock & Wilcox Technical Paper. 1977. Ci(2.19) TRD (Technische Regeln fUr Dampfkesseli). VdTUV Essen.
last- ed.
(2.20) ASME Boiler and Pressure Vessel Code. Sec. I and II.
The American Society of Mechanical Engineers. New York.
Last ed.
(2.21) Germanischer Lloyd: Vorschriften fUr Kiassifikation und
Bau von stihlernen Seeschiffen. Germ. Lloyd. Hamburg.
Last ed.
(2.22) H. Lobscheid: Babcock Handbuch Dampf. Deutsche Babcock &
Wilcox Dampfkesselwerke AG. Oberhausen. 4th ed. 1965.
(2.23) F. Umland: EinfluB von Brennstoffverunreinigungen
auf die Hochtemperaturkorrosion metallischer Werkstoffe.
VGB Kraftwerkstechnik 59 (1979). p 206 - 211.
(2.24) D. Lampert: Tieftemperaturkorrosion bei rauchgasbeheizten
Speisewasservorwirmern. BWK 31 (1979). p 218 - 221.
(2.25) J. Rolker: Untersuchungen zur Schwefelsaure-Taupunkt-
Bestimmung in Rauchgasen. VGB Kraftwerkstechnik 53 (1973)
p 333 - 339.

WEG 81-A3-59
(2.26) W'. Fehndrich: Verschleifuntersuchungen an Kesselrohren.
VGB Kraftwerkstechnik 49 (1969). p 58 - 70.
(2.27) E. Raask: Erosion durch Aschepartikel in kohlegefeuerten
Kesselanlagen. VGB Kraftwerkstechnik 59 (1979).
p 496 - 502.
(3.1) G. Wiese: Neue Wege im Schiffskesselbau.
Jahrbuch der Schiffbautechn.Ges. 61 (1967).
(3.2) Babcock Report No. 37.
Modern Marine Boiler Plants.
(3.3) Babcock Report No. 38.
Construction and Operation of Modern Marine Boilers.
(3.4) H. Martin: Grundsatze fUr die Auswahl geeigneter
Verdampfungsverfahren. Internal Babcock Report. 1980.
(3.5) O.G. Hammar, R. Jung: Das Verhalten des Naturumlaufes
in Wasserrohrkesseln bei fallendem Kesseldruck.
BWK 7 (1955). p 1 - 10.
(3.6) E.G. Lansing: Variable Pressure Peaking Boiler,
Operation, Testing and Control. Journ. Eng. Pow. (1975).
p 435 - 440.
(3.7) R. Dolezal: Durchlaufkessel. Vulkan Verlag. Essen. 1962.
(3.8) R.A. Grams, W.L. Sage, G.W. Geyer: Fuels for marine steam
propulsion. Babcock & Wilcox Technical Paper. 1974.
(3.9) VGB-Technische Berichte "W~rmekraftwerke": Rostfeuerungen.
VGB Essen. 1972.
(3.10) H.W. Bredin: Fluidized Bed Combustion ... a new era in
ship propulsion. Mech. Eng. (1979). p 30 - 32.
(3.11) D.R. Cusdin, M.J. Virr: A marine fluidized bed
waste heat boiler. Trans I. Mar.E. (1979). Vol. 91. p 1 - 12
(3.12) L. Reh: Str6mungs- und Austauschverhalten von wirbelschichten
Chem. Ing. Techn. 46 (1974). p 180 - 189.
(3.13) J. Werther: Strdmungsmechanische Grundlagen der wirbel-
schichttechnik. Chem. Ing. Techn. 49 (1977). p 193 - 202.

WEG 81-A3-60
(3.14) TRD 401 (Technische Regein furc DampferZeUSer) VdTUV Essen..
LasLt ed.
(3.15) Balcke: Richtlinien u. Unterl-agen fNr die Projektierung
,yon Pumpezi. IMnschinerlfabr.Lk Ballcke Frankenthal.
(3.16) G. Schilg:*Turbomaschiflef im Kraftwerk.
VEEB Verlag Technik. Berlin. 1978.
(3.1P7we A OEnginelering. (179 .xa p an fo0 boi53.s
(3.7) P.Jwevras:gi Selection of99 axa fan fo boiers
(3. 18) K.Veser: Pege-nerativ-LUft¶7OCdrfl.,;re- an blgefeuerten
4 ~Kessein, VGB Kraftwetkstechflik 59 (1979). p 53 - 58.
(3.19) G. Klefenz: Die Regelung von Dampfkraftwerkefl.
Bibi. Inst. Mannheim. Bd. 549. 1973.
(3.20)......GatEeld'er, L. Gross: weitbereich LeistungjSregeluflg
eines Tromrnelkessels-Efltwurf, Realisierting und Betriebs-
erfahrungen. BWK 27 (1975) . p 379 - 382.
(3.21) 0D. Kbhler, W. Schinkel: vergleich von Methoden fijr die
Berechnung von Einspritzkuhlern zur Regelung der Darnpf-
teinperatur. nnergietechnik 30 (1980) . p 135 - 139.
(3.22) J.D. Andrew, A.M. Freudberg, P.M. Koch:
Gas Recirculation and Its Relation to Boiler Design
and Operation. Combustion (1959).- p 38 - 44..
(3.23) A.F. Hodgki n: Marine boilers for very advanced purposes.(
The institute-of marine engineers. 1978.--
(3.24) K. Knizia: Die Thermodyflaffik des DampfktaftptozeSses.
Springer-Berlin Heidelberg New York. 3rd ed. 1966.
(3.25) W. Krtiaer: wirtschaftlichkeitsvergleich zwischen Emn-
spritzregeltung und au~enliegendefi W~rmetauschern.
Siemens. Erlangeni. 1967.
(3.26) H. Eydamn: Betriebsbewahrunfg und Aussichten der doppelten
ýWjschenu~berhitzu~ng. VGB KraftwerkStechrlik 58 (1978).
p 884 - 889.

WEG 81-A3-61
(3.28) AEG, Babcock, Blohm & Voss, Howaldtswerke-DeUtsche Werift,
Kraftwerk-UflIOn: Marine Turbine Reheat Plant.
AEG-Telefunken. Hamburg
(3. 29) 0. Geif3ler: M6alichkeiten zur Verbesserung des Wirkungs-
grades von Schitfsdampfanlagefl nit zwischenbiberhitzung.
Schiff & Hafen. 27 (1975).-
(3.30) W. Winkler: Dampferzeugung fjr. innerstidtische Heiz- und
Heizkraftwerke - emn Markt fUr Rost- und wirbelschicht-
feuerungen. Internal Babcock Report. 1981.
(4.1) P. Grell: Entwicklung eines neuen Kesseltyps.
Hansa-Scbiffahrt-Schiffbau 108 (1971). p 619 - 622.
(4.2) H. Br~ckner, E. Wittchow: Kombiflierte Gas-/Dampfturbiflefl-
prozesse: wirtschaftliche Stromerzeugung aus Gas und Kohle.
BWK 31 (1979).- p 214 -213.

WEC 81-A3-61
(3.28) AEG, Babcock, Blohm & Voss, Howaldtswerke-Deutsche Werft,
Kraftwerk-Union: Marine Turbine Reheat Plant.
AZG-Telefunken. Hamburg
(3.29) 0. Geif~ler: Mdglichkeiten zur Verbesserung des Wirkungs-
grades von Schiffsdampfanlagen mit Zwischentiberhitzung.
Schiff & H-afen. 27 (1975).-
(3.30) W. Winkler: Dampferzeugung fur. innerst~dtische Heiz- und
Heizkraftwerke - ein Markt f~r Rost- und Wirbelschicht-
feuerungen. Internal Babcock Report. 1981.
(4.1) P. Grell: Entwicklung eines neuen Kesseltyps.
Hansa-Schiffahrt-Schiftbau 108 (1971).- p 619 - 622.
C(4.2) H. Br~ckner, E. Wittehow: Kombinierte Gas-/D~arpfturbinen-
prozesse: Wirtschaftliche Stromerzeugung aus Gas und Kohie.
ENK. 31 (1979) . p 214 -218.

0
0
0

Fifth V/EGEi TGraduate School,Advanced Ship Power PlantDesign and Operation
Paper A4
Reheat systems, general considerations
by
Prof. Dr.-Ing. 0. Geisler
T.U. Hamburg-Harburg
CA
1. Introduction2. Influence of the steam conditions on the
thermal efficiency of marine steam plants2.1 Influence of the live steam pressure2.2 Influence of the live steam temperature2.3 Influence of the condenser pressure3. Regenerative feed water preheating4. Reheat of the steam5. Auxiliary engines6. Design of the astern turbine7. Fuel consumption8. Design of a marine steam plant with reheat (example)
1. Introduction
In order to improve the economy of steam turbine propulsion
for merchant ships there have been developed modern reheat
steam plants with high thermal efficiencies. The steam cycles
of these marine reheat systems include high steam conditions
and high regenerative feed water preheating with rotating
air heaters.
2. Influence of the steam conditions on thethermal efficiency of marine steam plants
The energy output dL t (in differential form) of a closed
steam turbine cycle operating in steady state conditions is
dLt = dh - dq
where h is the enthalpy and q the heat energy.
As in a closed process after every complete cycle the same
conditions (pressures, temperatures) are reached again it
is possible to say
fdh =o o()
with this we find
dLt = f-dq (2)
or
.. .. (3)Lt qin -qout(
respectively. This means that the output of mechanical energy
is equal to the difference between the heat energy which is
put. into the system and the heat energy taken out of it.
As the heat energy thermodynamically can be expressed by the
equation
q f TJds (4)
it is possible to find out for every change of conditions the
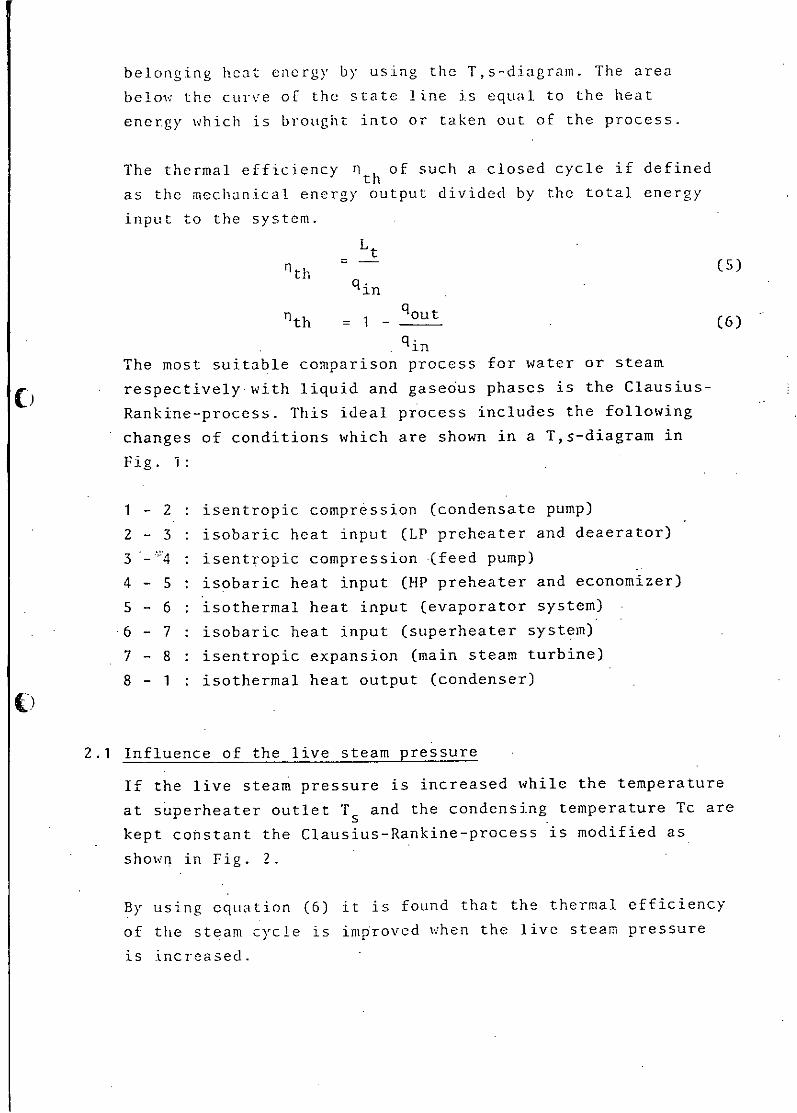
belonging heat energy by using the T,s-diagram. The area
below' the curve of the state line is equal to the heat
energy which is brought into or taken out of the process.
The thermal efficiency nth of such a closed cycle if defined
as the mechanical energy output divided by the total energy
input to the system.Lt
nth (5)qin
nth 1 q out (6)qin
The most suitable comparison process for water or steam
(') respectively with liquid and gaseous phases is the Clausius-Rankine-process. This ideal process includes the following
changes of conditions which are shown in a T,s-diagram in
Fig. 1:
1 - 2 : isentropic compression (condensate pump)
2 - 3 : isobaric heat input (LP preheater and deaerator)
3 -4 : isentropic compression (feed pump)
4 - S : isobaric heat input (HP preheater and economizer)
5 - 6 : isothermal heat input (evaporator system)
•6 - 7 : isobaric heat input (superheater system)
7 - 8 : isentropic expansion (main steam turbine)
8 - 1 : isothermal heat output (condenser)
2.1 Influence of the live steam pressure
If the live steam pressure is increased while the temperature
at superheater outlet T s and the condensing temperature Tc are
kept constant the Clausius-Rankine-process is modified as
shown in Fig. 2.
By using equation (6) it is found that the thermal efficiency
of the steam cycle is improved when the live steam pressure
is increased.
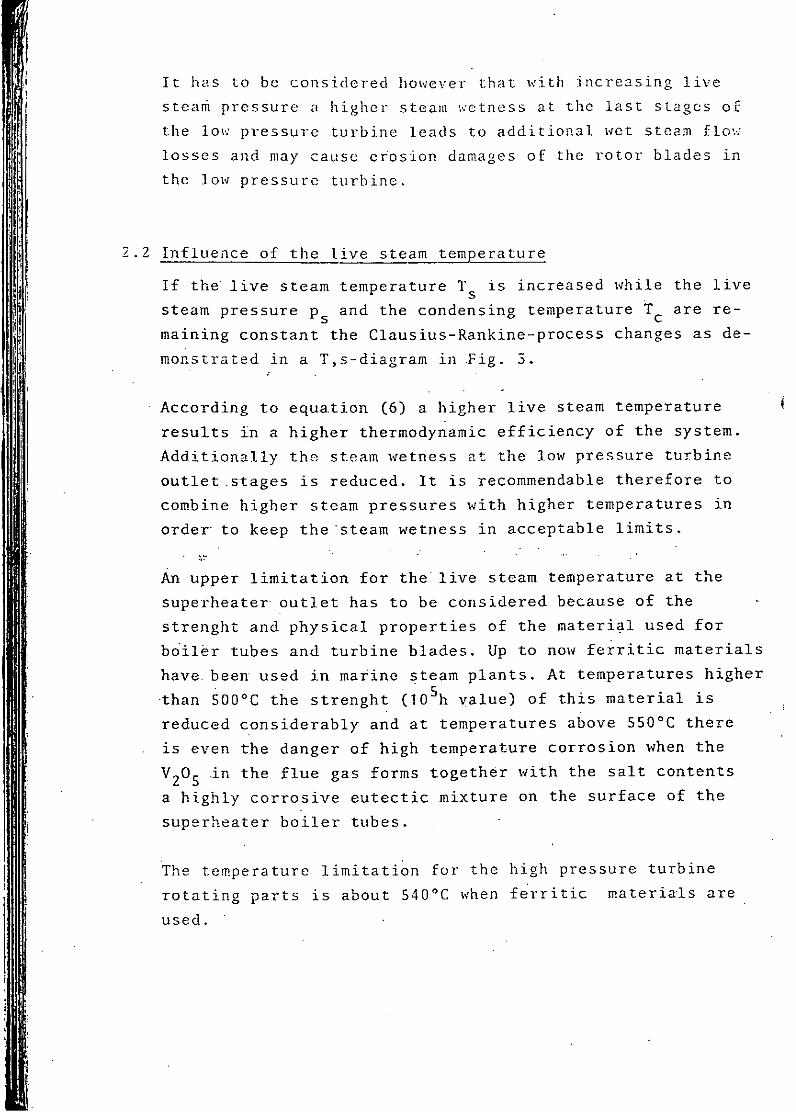
It has to be considered however that with increasing live
steam pressure a higher steam w,.,etness at the last stages off
the lot pressure turbine leads to additional wet steam flow
losses and may cause erosion damages of the rotor blades in
the low pressure turbine.
2.2 Influence of the live steam temperature
If the live steam temperature Ts is increased while the livesteam pressure ps and the condensing temperature Tc are re-
maining constant the Clausius-Rankine-process changes as de-
monstrated in a T,s-diagram in Fig. 3.
According to equation (6) a higher live steam temperature
results in a higher thermodynamic efficiency of the system.
Additionally the steam wetness at the low pressure turbine
outlet.stages is reduced. It is recommendable therefore to
combine higher steam pressures with higher temperatures in
order-to keep the-steam wetness in acceptable limits.
An upper limitation for the live steam temperature at the
superheater outlet has to be considered because of the
strenght and physical properties of the material used for
boiler tubes and turbine blades. Up to now ferritic materials
have. been used in marine steam plants. At temperatures higher
than 5000 C the strenght (10 5h value) of this material is
reduced considerably and at temperatures above 550'C there
is even the danger of high temperature corrosion when the
V 20 S in the flue gas forms together with the salt contents
a highly corrosive eutectic mixture on the surface of the
superheater boiler tubes.
The temperature limitation for the high pressure turbine
rotating parts is about S40 0 C when ferritic materials are
used.

2.3 Influence of the condenser pressure
If the condenser pressure is decreased the Clausius-Rankine-
process is modified as shown in a T,s-diagram in Fig. 4.A lower condenser pressure leads to a higher thermal effi-
ciency. This influence is relatively strong because of the
great distance between the isobaric state lines in the wet
steam area. At live steam conditions of 62 bar and 510°C
for instance a decrease of the condenser pressure from 0,06
to 0,05 bar results in an improvement of the thermal effi-
ciency of about 1,S %. A limitation is here given again by
the allowable steam wetness (X2 >0,88!) in the low pressure
turbine.
A lower condenser pressure also leads to a higher specific
volume of the steam which correspondingly requires higher
flow areas, dimensions and investment costs of low pressure
turbine and condenser. This has to be investigated very care-
fully in order to find the economic optimum in any case.
.3. Regenerative feed water preheating
The regenerative preheating of the feed water is a method
to improve the thermal efficiency of marine steam plants.
The feed water is preheated by. condensing steam taken from
extractions at the main engine. The preheating is carried
out in several stages. Normally the increase of the feed
water temperature in every preheater is approximately the
same.
Eig.. S shows the simplified steam cycle of a marine steam
plant with 3-stage preheating of the feed water (2 LP pre-
heaters, I deaerator), Fig. 6 a plant with a 5-stage rege-
nerative preheating (2 LP preheaters, 1 deaerator, 2 HP
preheaters).
The thermodynamic calculation of steam cycles with regene-
rative preheating sihows very clearly that the thermal effi-
ciency of the system increases with an increasing number
of preheaters.

Iýn case of high feed water preheating by steam extraction
from the main turbine the necessary preheating in the
boiler is reduced and it is not possible to cool down
sufficiently (boiler efficiency) the exhaust gases. This
solution therefore requires a rotating air heater where the
combustion air is preheated by the flue gas or the flue gas
is cooled down by the inlet air respectively.
An advantage of high feed water preheating for the design
of the main turbine is the fact, that due to the extractions
the steam flow through the low pressure turbine is reduced
which results in smaller dimensions and costs for low pressure
turbine and condenser.
The optimum number of preheaters for a steam plant may be
found with the help of a diagram (Fig. 7) showing the in-
fluence -of the number of preheaters on the relative preheating
effect and the degree of preheating.
Thezrelative preheating effect is defined as the improvement'
of the thermal efficiency (compared with the Clausius-Rankine-
process without preheating) related to the maximum possible
improvement of the thermal efficiency which would be reached
in-an ideal regenerative cycle with an unlimited number of
preheaters. In other words the relative preheating effect
indicates the percentage of utilization of the maximum possiblf
preheating effect.
The thermodynamically optimum distribution of the preheating
range on each preheater can be calculated exactly by an exer-
getic investigation of the cycle. Normally the temperature
differences of feed water inlet and outlet are about the same
for all preheaters. Due to the provided extractions at the
main turbines there are sometimes deviations from this rule.
The degree of preheating e is defined as the temperature in-
crease of the feed water related to the maximum possible one
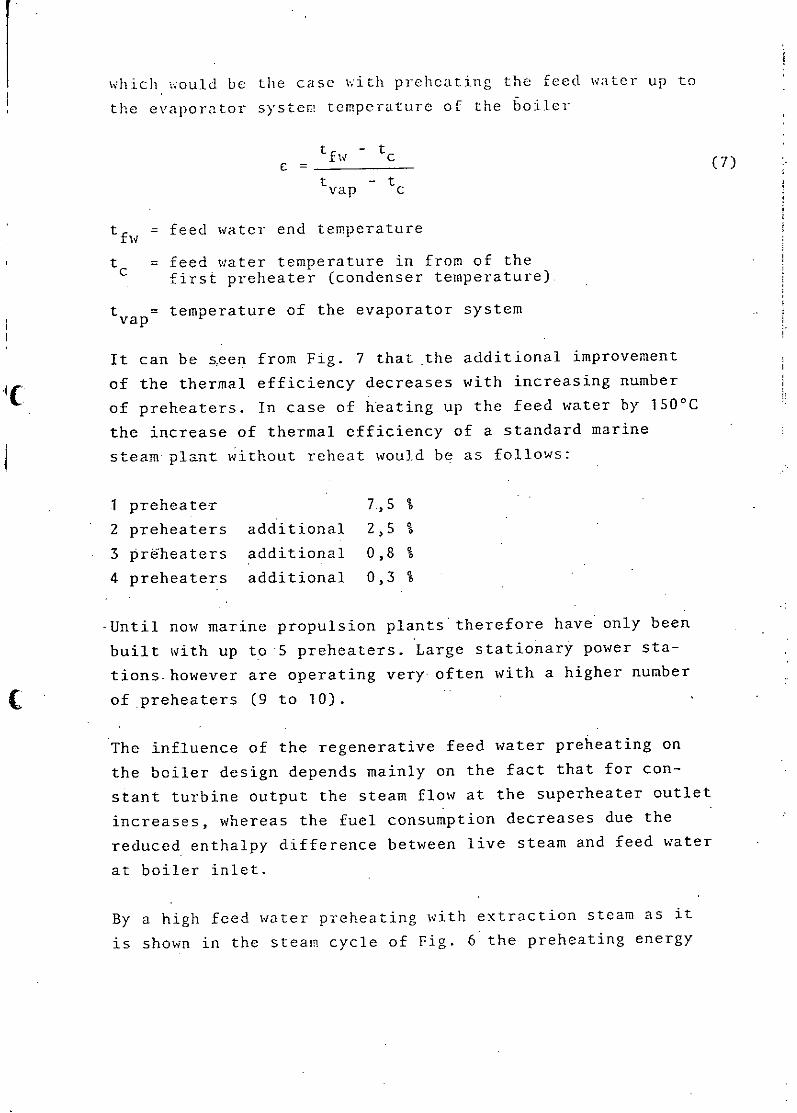
which would be the case with preheating the feed water up to
the evaporator system temperature of the boiler
tfw- t cE w (7)
t -tyap c
tfw = feed water end temperature
t = feed water temperature in from of thec first preheater (condenser temperature)
t = temperature of the evaporator systemyap
It can be seen from Fig. 7 that the additional improvement
of the thermal efficiency decreases with increasing number
of preheaters. In case of heating up the feed water by 150'C
the increase of thermal efficiency of a standard marine
steam plant without reheat would be as follows:
I preheater 7,5 %
2 preheaters additional 2,5 %
3 pr~heaters additional 0,8 %
4 preheaters additional 0,3 %
-Until now marine propulsion plants therefore have only been
built with up to 5 preheaters. Large stationary power sta-
tions, however are operating very often with a higher number
of preheaters (9 to 10).
The influence of the regenerative feed water preheating on
the boiler design depends mainly on the fact that for con-
stant turbine output the steam flow at the superheater outlet
increases, whereas the fuel consumption decreases due the
reduced enthalpy difference between live steam and feed water
at boiler inlet.
By a high feed water preheating with extraction steam as it
is shown in the steam cycle of Fig. 6 the preheating energy

in the liquid phase required froiil the flue gas is reduced
strongly. As already mentioned earlier it is therefore
necessary to use the exhaust gas energy for preheating the
combustion air. Plants with 4 or 5 preheaters (including "
the deaerator and 1 or 2 HP preheatcers) are equipped nor- .
mally with a rotating ai r heater in order to cool down the', ;
boiler exhaust gas sufficiently. This arrangement results ,
in a high thermal efficiency of the system as the advantages!
of maximum boiler efficiency and maximum possible preheating.o14
effect can be realized at the same time. The investment costIV.I
however and the dimensions of a rotating air heater are rela
tively high compared with a plant using a steam air heatei- t '
There is also the disadvantage that in a flue gas air heater*
there exists the danger of low temperature corrosion when...•
the exhaust gases are cooled down below the dew point of,.:,,;
suiphuric acid. The temperature of the inlet air of for ij.:.
stance 35°C is far below the dew point temperature of abolit,
110 to 1400C (depending on the sulphur contents in the fuel),.
Even if the mean flue gas temperature at the air heater out-
let is above 140'C there is a certain danger of local corro
sion.
The formerly provided tube type air heaters very often hd.
to be replaced after 2 to 3 years. In modern steam plants,.
it has become a common solution to install rotating airI hea
ters with ceramic heat storage elements. These elements are,
alternating heated up to the flue gas and cooled down by
the combustion air. In the presently existing designs either
the rotary symmetric carrier of the heat storage elements'OT
the air and gas ducts are rotating.
A thermodynamically less favourable solution is a steam
cycle with steam heated combustion air preheater as shown.,
in Fig. 5. This arrangement offers the advantage however'O
much smaller air heater costs and dimensions. There is alsO7..-
no need for expensive HP preheaters. The final preheating"
stage in these plants is Formed by the deacrator with temp 0.
raturcs of about 1 40 0 C. The danger of low,.. temperature
-. I

corrosion consequent] y does not exist here. As the dea-erator temperature is kept constant independently from the
lead oF the main engine the feed water inlet temperature atthe econjomiser wili also remain constant at 1140'C duringall operating conditions. Cooling down the exhaust gasesin the economiser below the dew poing of suphuric acid
is therefore not possible.
4. Reheat of the steam
A reheat of the steam leads to a further improvement of the
thermal efficiency of steam plants, because also reheatingis-a measure to assimilate the Clausius-Rankine-process to
the Carnot-process which allows the highest possible thermal
efficiency for given temperature levels concerning the heat
in- and. output to and from the system. Besides of this directefficiency improvement there is another indirect advantage
because reheat plants can be operated with higher steam
pressures. To explain this in Fig. 8 there are shown the
¼.. changes of conditions referring to ideal steam cycles with
and without reheat.
Considering that due to the danger of blade material erosionthe-steam wetness at the LP turbine should not exceed a cer-
-ta:in value (for instance 12 %) the live steam pressure in
plants without reheat may only be increased if at the same
time the temperature is increased too. Opposite to that inreheat plants the pressure in front of the HP turbine may be
increased considerably without reaching the steam wetnesslimitation.
The marine steam propulsion plants with reheat built and
operated until now are working with live steam pressures of
about 100 to 110 bar and temperatures between 510 and 520°C.The economically optimum intermediate pressure for reheating
-i the steam back to the full live steam temperature has turned
zI

out to be in the range of
p, 0,2 .... 0,2S Ps (8)
The pressure drop in the reheat section of the boiler and
in the connecting pipes between engtine and boiler is about 4
PRH = ( 0,06 .... 0,10 )'P RH .(u
Further increasing fuel prices will certainly lead to higher. Vf
steam pressures and temperatures being the optimum conditio& -'
for marine propulsion plants. 4Ž
For comparison purposes the diagram in Fig. 9 illustrates
the expansion lines of a marine reheat steam plant with live.
steam cf 14ZS bar/5250 C and a plant without re(heat and live '
steam of 60 bar/510GC- From this drawing it can be seen very:t
clearly that besides of the direct efficiency improvement I
(about 3 to 4 %) by assimilating the system to the Carnot- %t-
proc&ss there is also an indirect gain by increasing the steam
pressure in front of the turbine and decreasing the steam wet
ness in the LP turbine.
There are various technical possibilities to realize steam
reheat in marine propulsion plants The following solutionsý,
have already been built or investigated carefully.
1. Reheat by flue gas in the main boiler
2. Reheat by flue gas in a separate reheat boiler
3. Reheat by superheated live steam in a heat exchanger
4. Reheat by condensing live steam in a heat exchanger ij'
S. Reheat by condensing extraction steam in a heat exchanger
The plants already in service are equipped with steam reheat',
by flue gas in the main boiler (solution 1). In this caseth'
total steam flow is taken back to the boiler from the HP turT.-
bine outlet, reheated to the full live steam temperature an&

then expanding further through tie intermediate and lowpressure turbines. But there were also designed modernmarine propulsi on plants basing on the other solutions men-tioned above. The characteristics of these proposals will
be described in the following papers.
Opposite to the large stationary power stations the marineengines until now have only been equipped with single stage
reheat.
Fig. 10 shows a usual arrangement of a marine propulsion
steam cycle with reheating the steam by flue gas in the
main boiler.
The live steam required by the main and auxiliary turbines
is produced in the boiler. The main steam flow expands inIthe HP turbine down to the reheat pressure and subsequentlyis reheated to the full live steam temperature again in thereheat section of the main boiler, expanding then throughtheIP and LP turbine to the condenser pressure and conden-
sing in the sea water cooled main condenser.
in-the low temperature range the condensate serves as a coolantfor the ejector group, the sea water distilling plant and thegland steam condenser. This measure helps to reduce the fuelconsumption and has already been introduced successfully into
marine practice. The possibility of cooling the lubricationoil. with condensate has been dispensed with in order to avoidany operational problems. The further preheating of the conden-sate or the feed water respectively is provided by means of.two LP preheaters supplied with extraction steam from the LPturbine and the deaerator which works at a pressure of 3,5 bar.Behind the feed pump there are two more HP preheaters which aresupplied with extraction steam from the IP turbine and the HPturbine outlet. The final feed water temperature is 224 0 C.
ill

The steam/steam generator is supplied with heating steam
from the HP turbine outlet as well. The o-xhaust steam Dine
of the feed pump turbine is connected to the deaerator
whereas the turboalternator is of condensing type with the
exhaust steam condensed in the main condenser.
On the basis of this steam cycle (Fig. 10) the influence -
of the live steam conditions on the specific fuel consump-
tion of the plant has been investigated. The diagram in
Fig. 11 shows the results for an output of 30 MW at the
propeller shaft. The specific fuel consumption can be re-
duced for instance by 1,7 % if the steam conditions areraised from 100 bar/520°C to 12S bar/S35°C. This ho-wever .. t
is connected with higher investment costs. The optimum steam. .4
pressure and temperature in any case should be selected in
a close cooperation between shipowner, shipyard and engine
manufacturer.
.4i
S. Auxiliaries
Turbogenerators have already been equipped with multistage ,•
high-efficient auxiliary turbines in the past whereas the '('
feed pumps in marine steam plants without reheat were drivenf'l.
by single stage Curtis turbines of simple design. Turbine j:
and feed pump were arranged in a common and very compact
casing. This solution offered the advantage of small weight,.,,
dimensions and costs and was economic in spite of its low A
efficiency. (4
In plants with reheat which normally are provided only for
ships with a relatively high demand of propulsion energy thz'
required power from the feed pump turbine increases propor-
tional to the boiler pressure. It is much higher therefore
as in plants without reheat. As the feed pump is operated
continuously a multistage feed pump turbine now in many cases:
is the economically superior solution. For modern marine r
steam plants with reheat it is proposed to choose identical. '
higih-efficiencY auxiliary turbines. This would not only
VA

improve the total ther-mal efficiency of the plant but also
offer advantages concerning the operation and maintenance
of these auxiliary turbines and probably reduce the necessary
number of spare parts. The sectional drawing in Fig. 12 as
an example shows such a multistage auxiliary backpressure-
turbine with reaction stages and nozzle group control. Tur-
bines of this type with a high internal efficiency of more
than 70 % and a heat-elastic design with rotary symmetric
internal casing (guide blade carrier) have been used already
on many steam ships and are available therefore.
Another method of improving the performance of the system
is the direct drive of alternator and feed pump by the main
engines through the main gear. As f&r as the total thermal
efficiency of the system is concerned this solution with
attached auxiliaries is preferable. But it requires additional
ins.est.ents due to the necessity of operating alternator and
feed pump also in harbours. When the main engine is stopped
both auxiliaries are driven by single stage stand-by-turbines
which are idling under vacuum during normal sea operation.
The rtheat system with attached auxiliaries is described in
detail in one of the following papers.
6. Design of the astern turbine
The astern power available at the propeller shaft during the
stopping manoeuvre is expressed as
PAST = mAST*AhisASTniSnmn S - PLAH (10)
where mAST is the steam rate,A hisAST the isentropic gradient
.and n iAS the internal efficiency of the astern turbine. For
the product of mechanical efficiency nm' gearing efficiency n
and mechanical efficiency of the shafting nSH, a value similar
to that for ahead running can be inserted, e.g.
qm'nG qSH = 0,96 (11)
M, S'H

[t is [ur-t'her assumed that the steam rate mAST is the same
as the steam rate mea 1 required in ahead operation with closed
extraction at nominal ower 1 Al' and also that the power loss
by ventilation in the ahead turbine during astern running,
g r b eg]leted. In that case the astern powerPVAH cenr]! a '-
Is obtained, f•roT.
AhisAST iASTP A =S P %HPAST : AH "12y.•
AhisAH iAH
It should be noted here that both the internal efficiency -
and the isentropic gradient AhisAp apply for maximum
ahead power with closed extraction, because - as far as rege-
nerative feed water heating is concerned. - only for the opera- "OP."
ting point similar conditions as during astern running can be
assumed.
Provided that for non-reheat plants we canoaSsume a live steam
condition before the turbine of 62 bar/S100 C and a condenser
pressure of 0;05 bar, and on reheat plants 120 bar/5250 C and
0.05 bar', and reheating to 525%C at 22,5 bar at the inlet to
the I.P. turbine as well as a condenser pressure of 0.25 bar.
in astern running, we obtain the following values for the
ratio of the isentropic gradients in Eq. (12):
Plants without reheat:
AhisAST - 0,85
Ah isAH .
Plants with reheat: AhisAST0.
7 sAS 0,72 (14).
isAHThe internal turbine efficiency during operation
with closed .
extraction is taken as
082niAH 08
corresponding to a specific steam consumption of 3.4 and
2.7 (kg/1Wh) respectively for plants without and with reheat. I.:
2.7 'k• wh) ]•A
.r

:Il
The internal efficiency of the astern turbine cannot be regar-
ded as constant for all plants since it depends largely on the
turbine design. Whereas in the past marine turbines have been
built with single- and multi-casing astern turbines of both
impulse and reaction types, in modern plants considerations
of costs and space have led to astern turbines accomodated in
the L.P. casing of the ahead turbine. The blading consists of
two 2-row Curtis wheels in series, or one 2-row Curtis wheel
followed by a single-row impulse stage.
For the two arrangements usual today (C2 + C2 or C2 +A),
and.another relatively simple but more efficient design withtwo Curtis wheels and a following impulse stage (C2 + C2 + A)
the efficiency was calculated for the power range now of inter-
est and the steam conditons already mentioned. From the re-
sults shown in Fig. 13it can be seen that niAsTdepends both on
the blading arrangement and on the peripheral velocity of the
rotor blades.
A certain efficiency can thus be achieved with a simple blading
arrangement and high peripheral velocity or with a higher number
of stages and correspondingly lower peripheral velocity. Here
it should be kept in mind that with respect to strength and
vibration the rotor and guide blades should be calculated both
for astern running conditions (high temperatures and high steam
forces, but low centrifugal forces) and forahead running con-
ditions (low temperatures and no steam forces, but high centri-
fugal forces).
7. Fuel consumption
The fuel consumption is the decisive factor for the operating
costs and the overall economy of a marine propulsion plant.
The diagram in Fig. 14 shows the range of specific fuel con-
sumption values of present and future marine steam plants
without and with reheat. As the drawing indicates the specific
Fuel consumption decreases with increasing output of the engine.
Ii

*0
The steam plant is theiefore especially advaintagGous for ships -•
wtth highn. machiner-y power. Fig. 14 also shows very clearly that .os -Ouc the fue1 consu"p-
,with rehe",t systems it is pass ible to reduce
tion of marine steam plants considerably.
8. Design of a marine steam plant w.ith reheat (example).
Axccording to the t introduction of 7
steam reheat causes modifications at boiler, main and auxiliary -
turbines.
The reheating of the steam by flue gas in the main boiler re-.
quires for instance a separate reheat sector with controllable
gas flow. This is necessary because during manoeuvering and
astern operation there is no reheat provided.
Oil fired marine boilers with flue gas reheat of the steam are I
successfully in service since many years. Fig. 15 shows in two.•'
sectional drawing the structural design of a boiler with reheat..
Several steam assisted burners are arranged on top of the com- %..,-
bustion room, which enables the lengths of the flame to be dimef'
sioned in such a way that an almost stoechometric combustion is.
attained.
The gas-tight combustion room is enclosed by tube walls
of the%'
evaporating system working with natural circulation.
In the
lower part these tubes are fanned out to allow the flue gas to..,
flow to the second pass of the 'boiler. The outside walls of the,
second pass, in which the reheat surfaces are located, consisti';{"
likewise of tubes belonging to the evaporator system.
The secona
pass is divided into two passes by a further tube wall. The hean
ting surface parts I and II of the live steam superheater ared,
arranged in the first pass. In the second pass there are locate.:4
the third part of the live steam superheater (III) and the re-..
heater (R11). All parts operating with high pressure steam are So,
designed that no austenitic materials are required. -

The live steam tenperature is regulated by means of two water
injection coolers, one between surface I and II and the other
between II and III. The steam temperature at the reheater out-
let is regulated by means of flue-gas dampers. The arrangement
of the live steam superheater part III in the second pass in
front of the heating surface of the reheater ensures that in
any case even in the event of failure of the damper control,
the flue gas is adequately cooled in the heating surface III.
Therefore the uncooled tubes of the reheater cannot be damaged.
An economizer is fitted above the superheater and reheater sur-
faces. The combustion gas is further cooled in a rotating rege-
nerative air preheater, the enamelled heating surfaces of which
allow gas outlet temperatures of about 110'C. The boiler effi-
ciency amounts to 90.7 %, this value applying to the upper
heating value, as is usual for marine steam plants.
The main turbine plant consists of the high-pressure, inter-
mediate-pressure and low-pressure turbines, manoeuvring valve,
condenser, main gearing and the internal piping. The main
dimensions of the propulsion plant depend primarily on the
design chosen for the propulsion turbine, on the arrangement
of the condenser in relation to the low-pressure turbine and
on the gearing type.
Especially with high steam conditions it would seem logical to
choose a three-casing design with a larger number of stages
and a correspondingly higher internal turbine efficiency. The
saving of fuel costs achieved justifies the additional expen-
diture for construction.
A further essential advantage of the
three-casing design is that the high-pressure and intermediate
pressure turbines can be of very simple construction and that
during operation the two turbine casings do not influence each
other, neither thermally nor mechanically.

1i, stationa.r plants the three-casing type has proved success
fully for decades as the standard construcLtion because such'
plants alw.ays operated at higher steam conditions due to higher .outputs and because stationary plants up to notw. have been de-
signed in accordan.c with economic criteria to a far greater
extent than marine propulsion plants.
Fig. 16 shows as an example the HP and IP turbine of a reheat
plant which has been designed by a group. of German shipyards,
boiler and engine manufacturers (AEG, Babcock, Blohm + Voss,
HDW, KWJ).
A double-shell construction in conjunction with a symmetrical j
double admission was chosen for the high pressure turbine. CI.IConsequently both the inner and outer casing shells could be.
designed. with a comparatively small wall thickness and a con- Jstruction with high thermal elasticity is obtained, which is .
unaffected by the rapidly changing load conditions that occur.
during manoeuvring. '"to.
The intermediate pressure turbine has a single shell only due
to the considerably lower steam pressures. However also here
a uniform temperature distribution is achieved by ring channels 5.
at the inlet and outlet section as well as at the bleeding point.
The high pressure and intermediate pressure turbines as well as j-,,-
the bearings, of the shafting, are mounted on a common very
solid base frame, as can be seen from the longitudinal section.,-
The common centre bearing casing is the fixed point for both
turbines in axial direction. The shafting has three bearings.
Two journal bearings are located in way of the high pressure
rotor, .and the third journal bearing at the after end of the
intermediate pressure rotor.
The design of the low pressure turbine for marine steam plants "
with reheat can be largely adopted from usual plants without
reheat. In many cases it will even be possible to provide a
smaller model because of the smatlier steam volume flow. In
sonic cases it is atlso possible to increase the speeds of the
Low," pressure turb)'nc5s com.pared to plants ,;ithjout o. . . , 3 the

steam wetness ;n the last stages is lower due to the different
steam process.
As regards the location of the condenser in steam plants today
the main condenser is to be found transversely in front of the
low pressure turbine (single plane arrangement), as well as
transversely underneath. There are plants with scoop cooling
and with cooling water pumps. With regard to the design of
steam plants with reheat there are no special difficulties to
place the condenser as the amount of steam to be condensed is
in any case smaller than in plants without reheat having the
same output.
While Fig- 17 shows a reheat turbine plant with the HP-IP-
turbine of Fig. 16, a scoop condenser below the LP turbine
and a reduction gear of the "locked tran"-type, in Fig. 18
there can be seen a design of the same engine in single plane
arrangement including a condenser with cooling water pumps
and a reduction gear of the "articulated"-type.
The drawings demonstrate the high design flexibility of this
steam plant and the possibility to adapt it to different types
of merchant ships.
.1it
Ii
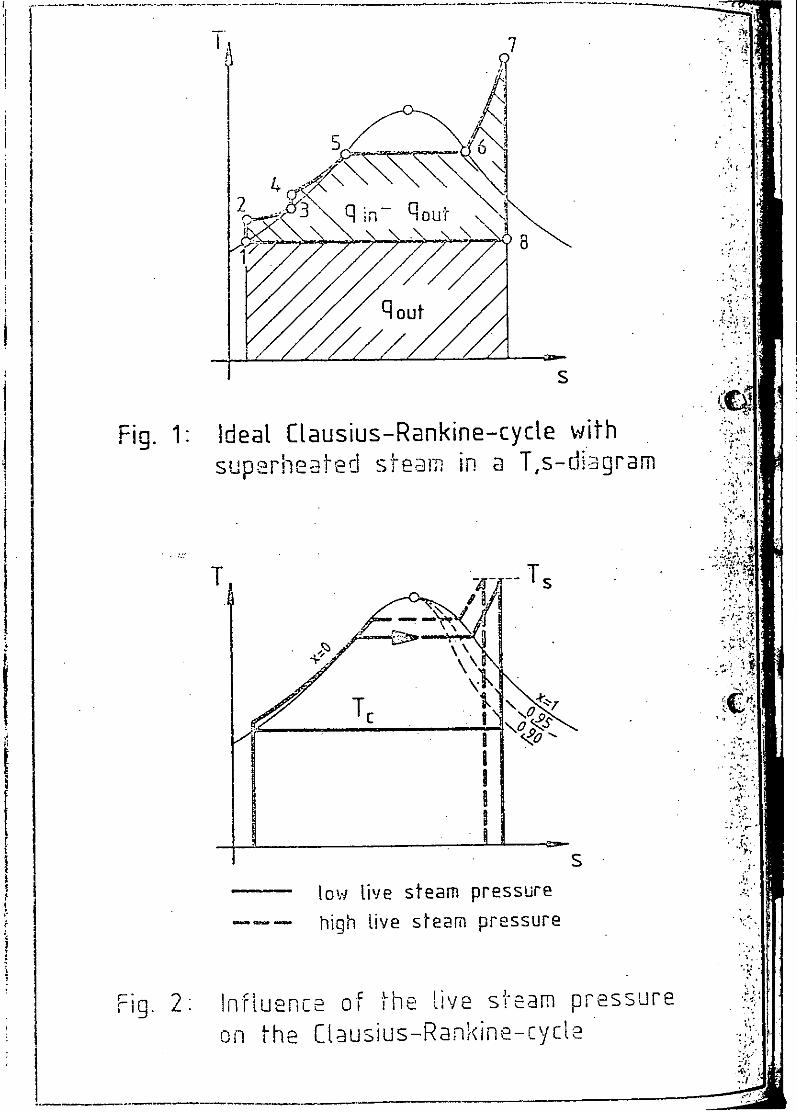
7
8
q US
Fig. 1: Ideal flausius-Rankine-cycle withsuenhea-teri steam. in a T, s -d:ar
Sup-~~ Ift ar
T Ts
T ?O
Stow ive tea presur
- low live steam pressure
Fig. 2:Influencz of the i've ste-am PressureOn- tIh-eC [a u siU s -PRain in e -cYCiL2

Ap
Tc1I Ii
III II .S
slow live steam temperaturehigh live steam temperature
Fig. 3 Influence of the Live steam temperature- on the Clausius-Rankine-cycle
T _ __ __ Ts I15
lop
low condenser pressure Shigh condenser pressure
Fig. 4: InfLuence of the condenser pressure
on the [Lausius- Ranki,,ne-cycte
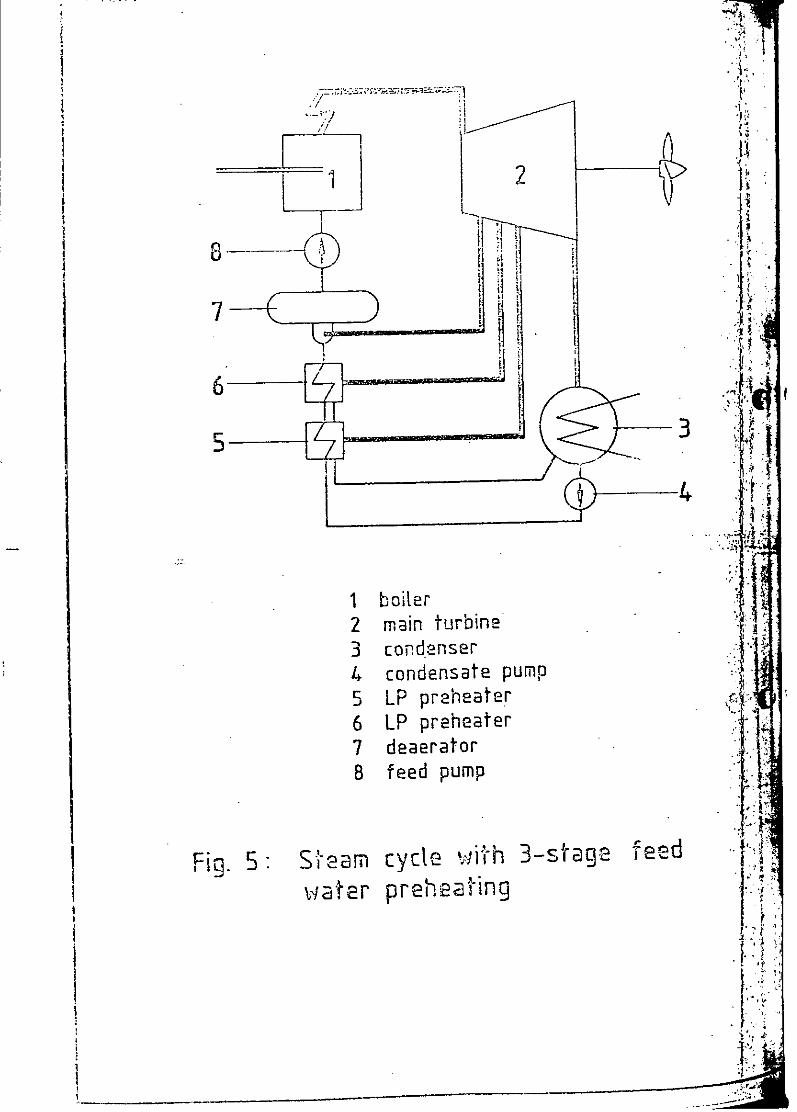
22
74
1-1
boiler
..1
.121,
2 main turbine*i3 copo, dnser4 condensate Pump"5 LP preheate~r •6 LP preheater7 deaerator
8 feed pump-
Fig. s Sea1m cy1e ,,ih B-sta9 fewat5 LPr preheating6 LP prheater.

F 1 2
---- JI.10--
6
* i,
5.
1 boiler .7 LP preheater2 HP turbine 8 deaerator3 LP turbine 9 feed pump4 condenser 10 HP preheater5 condensate pump 11 HP preheater6 LP preheater
IG. 6 Stem cycts Sith 5-stge f---waierpreh2afing

.. . ........ -.. -
100I I /
80
-3360
c,-t-4-
ci 20
ra "
0 20 40 60 80 100
degree of preheating Li.4
number of type ofpreheaters preheaters
n=1 Dn =2 LP + Dn 3 LP + LP + D or LP + D + HP
n =4 LP + LP + D + HP or LP + HP+ HP+ .;n=5 LP + LP + + HP +HP
LP = low pressure preheater0 = deaeratorHP = high pressure prehea3rer
_Ir _ s

T
*-Ts r TRHII
'I
Tc A\C\
9
S
steam cycle without reheatsteam cycle with reheat
Fig. 8: Influence of steam reheat on theC[ausius-Rankine-cycleF-. -.
'I

C. L
'cZ 0 ctv9 50
" I \
SI .A
Iv I
Si U
Q-c
entropy- s
marine steam plant with reheatmarine steam plant without reheat
Fig. 9: Expansion lines of main proputsion turbineS
in the h,s - diagram.

7I.
4--0Li
=Ma Ina.] --- r
CL L
F -- 7
a-_
-J-
Li
-cu4-
I -CI
4--4

0,240 4i•I p: 30 MWps 120 b1r 7
0 0,235
.- .. ' .ILii
Li4oJI
'1•
a0,230 5 5
510 i15 520 525 530 3
live steam temperature [LC]
0,240-
A9LAP= 30 MW '
s = fzfj= 5350C
CAI 0,235 'p-Ef
o.t.ri4-.,
I
4.) 0,230~
100 110 120 130 140 1
live s,22 ,, pressure [ba]j J.
Fig. 1i lnflbuenlce of the tiye steam conditions on [i.
'PS D L i fu en -CidsU*I po n s•~ u n: .
o• ,
n . . ." . . . . .. .

-I K
Fig. 12: Sectional drawing of a multistage
auxilliary turbine
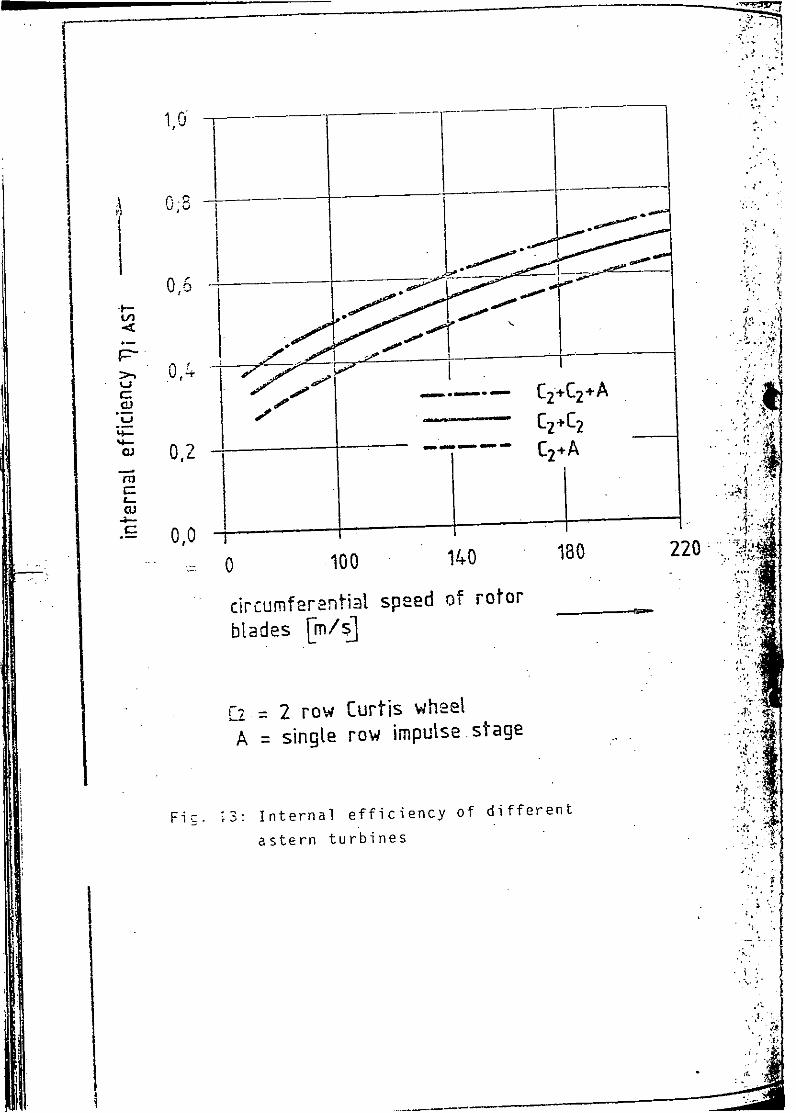
0,6
2+2+
C2aC
0,2 C+
75
CU
-s 0 0 100 140 180 220
ciCrcumferentialt speed of rotor >4
blades Em/si
E2 2 row Curtis whe-el I
A =single row impulse stage I
F.= :Internal efficiency of d ifferent
astern turbines
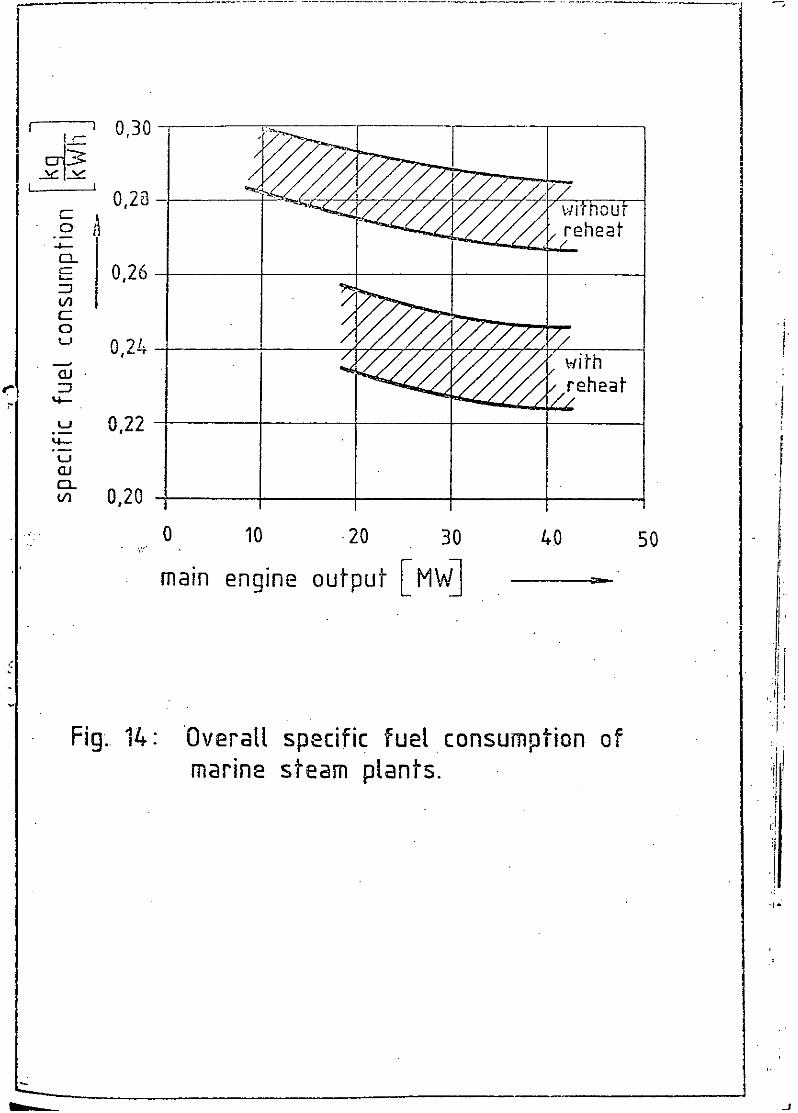
0,2a ____
witou0~
90,26 -(A30
QA
Lij
-0-
cn 0,20 -
0 10 ý20 30 40 50
main engine output [MW]
Fig.. 14: Overall specific fuel consumption of .marine steam plants.

4ra
~~ci-. - ---- --. 0
IL ,iFi1- I,,,,.
~. "I i.I:.1¾- I
>-t-7 Ut~JRi ~ '\'n_____ ____ ____ _ CV
... _ _ ..... .. 0 J
it________
I i_ _ _ __ _ _ _ _ __ _ _ _

'Ii jr~ zv~
2r~Thf<..&.fl% <AK~ s~44 /
~'L sz~jj2 c~P L_
7>7
-A
_________ t -.-r-..--~.-4 _______ I~
LAI/C~\-0
--. C-
--..-- .4-
0
-nC
r
e
0
Dl
21
C--o
-0
.4-
'.4C)
_________ Ln
SO
~cS42 ~p-A-s '&.
I I' ii I-c~ ~zŽ~-C. - - I.
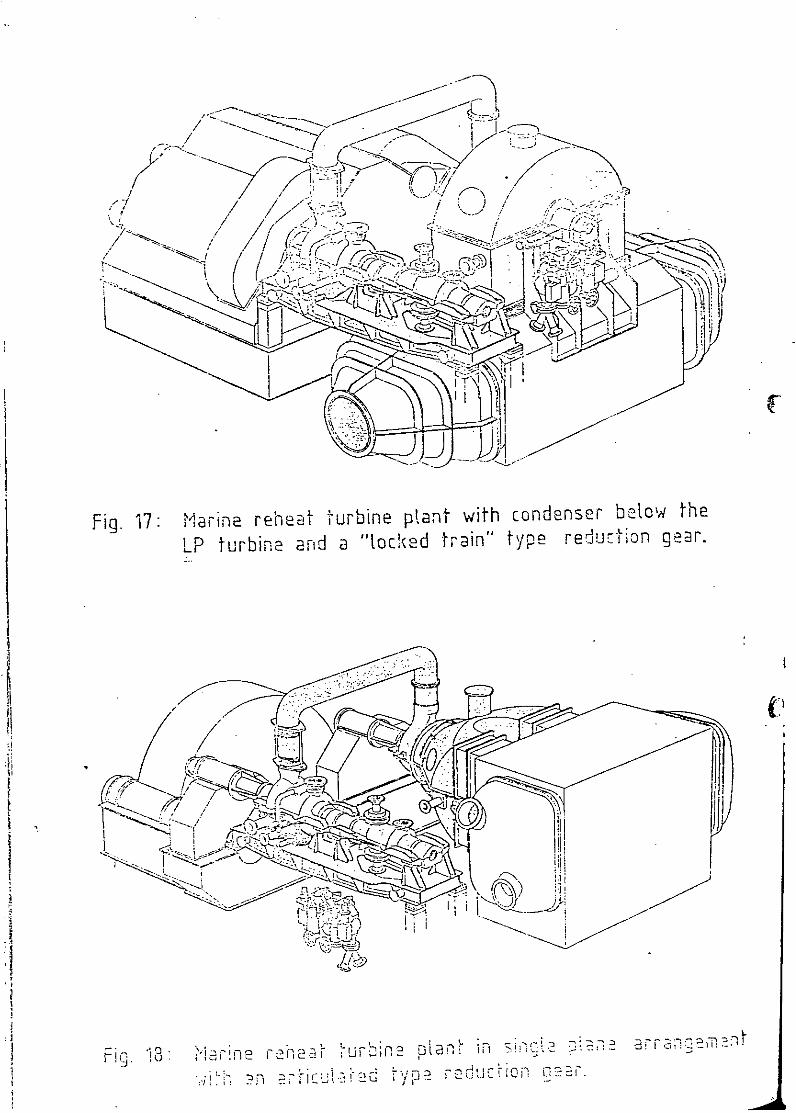
-I
-- -,
Fig.~~~ ~ ~ 17 iaiarha ubn tatWhcnesrbtwtl
W,< -ubn an--lce tan ye reuto er
..........
Ks>.
Figq. 17 `aie eea ur-bin plant with condnse NOW o thengLPI trieada tced trai" yp rdurio gor


Fifth WEGEM TGraduate SchoolAdvanced Ship Power Planbesign and Operation
() Paper AS
An advanced high temperature reheat'steam
cycle utilizing FB combustion
by
Lars Norberg
STAL-LAVAL,Sweden
j
1. Purpose
2. Background I
3. Diesel competition
4. World fleet development5. Fuel utilization -6. VAP system and technical data7. Fluid bed superheater / reheater
8. Steam flow diagram and heat balance9. VAP application for coal-fired ships10. VAP installation

STAL- LAVAL PM VAP 51/81Tjs t lat,,, Rog Sid! aVAP 1-06- 30 lU 430530Utfardare, tf -r
S .Norberg, 1534 /bhAN ADVANCED HIGH TEMPERATURE REHEAT STEAM
CYCLE UTILIZING FB COMBUSTION.B Las Norber STAL-LAVAL Turbin AB)
PURPOSE The purpose of this lecture is to describe to you a newsteam propulsion machinery which has been developed bySTAL-LAVAL Turbin AB in Sweden during the last five years.I will attempt to give the main technical and economicaldata for this machinery and also put it into its perspectivein a competitive and rapidly changing environment.
22BACKGROUND It took about one decade before the western world reallyunderstood that oil is a limited resource. In 1969 KingFig. 1 Hubbard published his well-known curve (Figure 1) over
the predicted oil consumption and since then the consumptionto reserve ratio has been gradually decreasing from 36 yearsto 28 in one decade. The oil producing countries (OPEC)did grasp the significance of these facts very rapidlywhereas the western countries had a tendency to concealit to themselves, as it was far from encouraging. Theoil had all since the Second World War given steadilyincreasing quantities of concentrated and easy handledenergy at gradually decreasing cost. It had in realitybeen the motor for industrialization and world economy.For the shipping industry the oil had an enormous importancefirst as energy source and then as a bulk commodity tobe transported. From 1950 to 1980 world annual oil production 6(excl. communist countries) increased from 3.3 milliontons to 86 million tons which means an annual increaseof 16.5 % per year in average and oil transport representedFig. 2 almost 70 % of total marine transport volume. (Fig. 2).The implication of the formation of OPEC and the oilembargo in 1973 is visible in the curve and it indicatesthat this violent action only will have the consequence 1!that the long time trend will coincide with King Hubbard'sprediction.
But the turbulent oil situation since 1973 has had manyconsequences. One important conclusion has been thatit is prudent to pay more interest to alternative energyFig. 3 sources. And, as is well-known, coal reserves are muchmore abundant than oil (Figure 3). If the coal resourcesin the communist countries and the expected findingswhich are not yet localized are taken into account thecoal reserves are 40 times bigger than the oil reserves.It is obvious that this will mean that coal will havean ever increasing role to play in the shipping industry,both as a commodity to be shipped in great quantitiesand as an energy source for propulsion. I will come backto coal as energy for propulsion later on.

S-TA L- LAVA L PM VAP 51/81
2
3DIESEL COMPETITION One very import:int factor for the steam turbine builder
is the competition with the diesel motor. This is a fight
Fig. 4 which has been going on for many decades (Figure 4) and
as the diesel &1ready from the introduction has always
had the best efficiency it has been a natural claim that
the diesel is the superior propulsion system. But as
about 50 % of the world merchant fleet tonnage is propelled
by steam turbir cs it is obvious that steam propulsion
is still a very important technology. But it is also
obvious that the drastic increase in fuel cost has had
an immence importance for the evaluation of propulsion
Figs. 5, 6 cost. (Figures 5 and 6).
4WORLD FLEET The traditional, application for steam propulsion has
DEVELOPMENT been large oil tankers, ING-carriers and to some extent
OBO-carriers, bulk carriers and large container vessels.
Fig. 7 As can be seen from next figure (Figure 7) the tanker
fleet is almost exactly 50 % of the total world fleet.
But the potential steam turbine world market is (in percent
of total tonnage)
Tankers 51
OBO-carrier's 5Bulk carriors 18
Total 74 %
that is a very big share of the propulsion system market.
55;tEL UTILIZATION In 1973 the diesel and turbine had a certain difference
in efficiency vhich is best illustrated in the Sankey
i'igs. 8, 9 diagrams in Fij.ures. 8 and 9. Note that these figures
apply to "propu.lsion only" but include the necessary
* auxiliary power for the propulsion system. That should
of course be ar obvious conclusion, but in marine tradition
it is not so b cause there are usually two ways to express
the fuel econoi y of a propulsion system. For marine steam
turbine plants the most common figure has been gram per
shafthorsepowerhour or lately g/kW'n (kg/MWh). For diesel
motors it is cc' nlmon to state the fuel consumption at
the test bed. j-id at the test bed the fuel is usually
diesel oil and the auxiliary power is seldom stated.
And the ignorar;. may compare the turbine plants g/shph
with the diesel motor g/shph. Further confusion has been
brought about Lt different praxis about heating values
(HHV or LHV) ar.bient temperature, cooling water temperature,
etc. These cont. adictions have been eliminated in these
Sankey diagram,:, And the result is that the relation
between the turbine and diesel fuel consumption was 1.21
in 1973. This Ilgure assumes that the auxiliary power
is taken from t.e main engine through some kind of mechanical
drive. The use a dieselalternator will be to the disadvantage
of the diesel a a turboalternator to the disadvantage
of tLi, turbine.

STAL- LAVAL
PM VAP 51/81
The-above factors will mean an equivalent fuel consumptionof 1.036 ' 1.11 K 1.05 A 0.1984 = 0.2396 kg/kWh and witha high heating value of 43091 the "efficiency" is 34.9 %and the effective fuel cost ratio (turbine/diesel) is0.95 to the advantage of the turbine tanker.
The diesel builders will point at the further possibilitiesfor improvements which are possible for the diesel. Byderating and decreasing the propeller speed the factor0.95 can possibly be brought back to 1 but then the specialadvantages of a steam plant on a tanker must also beconsidered. The conclusion is, however, that the steamplant is still a quite competitive propulsion systemfor tankers, big bulk carriers and LNG ships. The mostdrastic cost impact will, however, introduction of coalas fuel has for propulsion economy.
I have only dealt with the propulsion economy. But themost interesting comparison is of course total fuel economy.We have at STAL-LAVAL made a total cost comparison forFig. 11 VLCC's which appears from Figure 11. At equal fuel quality(price factor 1.00) the VAP turbine plant is superiorto the diesel for ship sizes above 200 000 tdw in thecase where diesel generators are used. If the dieselplant uses shaft driven generator the break even pointmoves to 240 000 tdw-and waste heat recovery system canfurther improve diesel economy and move the break evenpoint to 260 000 tdw.
Shaft driven generator can of course also be used ona turbine ship and in fact there is a standard arrangementfor a power take off from the first reduction gear inFig. 12 the VAP system (Figure 12). Ideally a CP propeller shouldbe used when a shaft driven generator is installed. However,such a propeller is hardly economically justified onbulk ships with low propeller speed. instead the problemcan be solved by introducing a DC-generator and DC-motordrive to all pumps, fans in the main propulsion system.For the other electric power customers which need constantspeed or frequency a DC-AC converter must be installed.
The improved efficiency for the diesel motors has hadlower exhaust gas temperatures as an obvious consequence.This reduces the available exhaust heat and especiallyin ballast the power from the turboalternator might beunsufficient to cover all needs for electric power. Ashaft driven generator is then the preferred solution.
If the turbine can use cheaper fuel than the diesel, "then the turbine will be superior to the diesel overa much greater range of ship size. In the diagram (Figure 11)we have assumed a fuel price difference starting at 3 percentthe first year of service and continuously increasingwith 3/4 of a percent per year up to 12 percent the 12thyear of operation. Then the break even point is movedto 110 000, 150 000 and 170 000 tdw respectively.
The part load characteristics of a VAP plant compareswell with a diesel.

SrTA L- LAVA L PM VAP 51/81
3However, for many ships in 1973 especially in bulk ships
the propeller speed can influence the propulsion economy
considerably. If the diesel motor standard speed was
110 RPM and the AP turbine 85 to 80 RPM the fuel consumption
ratio was reduced to approx. 1.10 per nautical mile.
And this difference, which according to figure 5 meant
a cost increase for the ship of 1.5 % compared to the
diesel propelled ship. And this was compensated by higher
availability and lower maintenance cost but also various
gains when it comes to cargo pumping, tank cleaning,
ballast pumping, etc.
The task for the turbine builder in 1975 seemed to be
to reduce fuel construction by approximately 10 % in
order to become competitive again. And in early 1976
the VAP project was started with the aim to reduce all
purpose fuel consumption from 200 g/shph for 175 g/shph
(a 12.5 % reduction). The project was successful so far.
The VAP standard heat balance - as will be shown later - C)
gives 172.4 g/shph. So far the VAP development was successful.
And the thermal efficiency will be 36.7 % according toFigure 9. And as there still is a possibility to gain
propeller efficiency by utilizing low propeller speed
the VAP plant would certainly be superior to the standard
diesel from 1973. However, the diesel had also margins
back in the sleeve and an intensive development work
started also among the diesel designers and the 199qdiesel is expected to have an efficiency of 42.2 %
according to Figure 9 and the ratio between turbine anddiesel fuel consumption is 1.15 which is of course a
small improvement from the 1973 figure 1.21.
There are further a number of factors which must be considered
in a technical-economical evaluation:
1. The lubricating oil consumption of the diesel corresponds
to a fuel cost increase of 3.6 %.
2. If the diesel has a propeller speed of 91 RPM and
the turbine has a propeller speed of 65 RPM thiswill give a factor for necessary power for a big
VLCC of 1.11. In ballast condition this figure is
still bigger.
3. The fuel oil qualities have been deteriorating over
the last decade and the oil companies offer a lower
price for the low grade fuel oil which can be used
in boilers. This difference is at least 5 % and itis expected to rise in the future, as the lighter
derivates are increasing in sales. This tendency
is very pronounced in the United States as can be
Fig. 10 seen from Figure 10 and the rest of the world is
expected to follow the same pattern.
1) Diesel test bed consumption 136 g/shph diesel oil. For comparison with
turbine this must be recalculated to seagoing condition.
0.136 n 1.36 = 0.18496 kg/klh 10200Add 2 % for auxiliary power and recalculate to heavy oil 9700 1.0515
thus fuel conc. is 0.1984 kg/kWh. High heating value 43031 kW/kg gives • : 42.2 %.

STA L- LAVA LPM VAP 51/81
5
6VAP SYSTEM AND The VAP plant is a complete propulsion system includingTECHNICAL DATA boilers, turbines, gears, all piping and auxiliaries-
and control systems. It has been developed by STAL-LAVALin Sweden during the years 1976-1981 and this springa first prototype turbine was subject to test run inour workshops with excellent results. The prototype wasfor the 20 MW frame size. The VAP standard includes twomain frame sizes 20 MW and 33 MW and the complete mainturbine unit is built up from the followihg main components:
HP turbineIP turbineLP turbine
High and intermediate press gearLP gear (primary reduction)Intermediate reduction gearFinal reduction gear(.7 Thrust bearing (with built-in journal bearing)
Fig. 13 The frame sizes appear from the diagram in Figure 13.
The VAP steam data are the following:
VAP 20 MW VAP 33 4W
Steam pressure of 126.0 141.0turbine inlet flange(bar)
Steam temperature 602 602(°c)
Steam pressure at 29.4 31.5IP turbine(bar)
Steam temperature 602 6020 CC°c)
Cond. pressure 0.0507 0.0507(bar)These steam data have been chosen after careful technical-economical optimization where we have attempted to considernot only fuel and capital cost but also the influenceof steam data on availability and maintenance cost. Itis obvious that today the fuel cost has a tremendousinfluence on total cost as can be shown in the followingexample for a VAP 20 M.1 plant:
Propulsion plant first cost 16 MSAnnual fuel bill 6.36 m$
(Assuming 20 MW; 8 000 h/year and 170 S/ton) with anamortization factor of 0.131, (assuming 10 % interestand 15 year amortization) we arrive at a present valuefor the fuel of 48.5 MS or three times the hardware cost.

STAL-LAVJA LPM VAP 51/81
7FLUID BED SUPER- One very important feature of the VAP plant is the useHEATER/REHEATER of fluid bed combustion for a topping superheater and
the complete r.heat•r. It has always been consideredalo:;ost imoossible tc': "ve at hig-her steam temperaturesthan 538 0 C in conventional oil-fired boilers. Abovethat temperature vanadium corrosion tends to attack thesuperheaters severely. However, there were indicationsthat corrosion attack was less severe in a fluid bedeven at higher steam temperature. Long time full scaleand 10 000 hours rig tests at STAL-LAVAL confirm thatin an oil-fired sand bed tube wall temperatures up to300 °C can be accepted without risk for rapid corrosion.COf course at this temperature and full boiler pressurea heat resistant steel must be chosen - in our case ahigh nickel-chromium alloy, Hastalloy 800 H. This materialis of course quite expensive but as the heat transfercoefficient for tubes submerged in a fluid bed is 3 to C
(- 5 times higher than for tubes in a convection heat exchanger,the total cost is still acceptable.
8STEAM FLOW DIAGRAM The flow diagram (Figure 14) shows the VAP standard arrangement.AND HEAT BALANCE Many features are quite normal, like many other reheat
plants, the turbine arrangement has 3 separate turbinesFig. 14 each with its own optimized shaft RPM. The titanium tube
condenser with mechanical vaccuum pump, the feed heaterarrangement with two LP-heaters, one deaerator and twoHP-heaters is also normal. The generator is driven fromthe main gearing and has a back-up turbine with automaticstart. Optional a separate turboalternator can be providedbut the fuel will increase by approx. 0.5 %.
The most important special feature in the VAP plant isthe boiler arrangement. The main boiter is a non-reheatboiler and is therefore rather conventional. The steamoutlet temperature is about double the pressure which (J.up to now has been regarded as standard for marine plants.But if only the feedwater quality is properly watched,this should not present any particular problems. A number
Cof precautions have been taken to avoid seawater leakageinto the system:
a) The condenser has titanium tubes.b) The make-up water from the evaporators has to pass
a demineralizing filter.c) An autochemist is provided to monitor the feedwater
condition automatically and continuously.
The main boiler has also one special feature as the exhaustgases from the bed are discharged into the main boilerafter the furnace but before the superheater.
The steam from the main boiler goes to the manoeuvringvalve which opens for steam to the astern turbine or
0alternatively for the ahead turbine. in the later case
the steam has to pass the FB superheater which increasessuper-neat temoerature from 500 or to 602 °.
C.

STA L- L&VAL
PM VAP 51/81
7
The position of the manoeuvring valve before the bedis a specially intere.._ting feature. At a sudden stopof the main engine, the steam and air flow are shut offand the bed will slump. The bed mass will heat the tubingto the sand temperature 850-900 °C. But this presentsno problem for the 800 H material as it is virtuallyfree from stresses when the steam is shut off. Therefore,no cooling steam is necessary for cooling the coils.Steam to the TA is also deverted from the main flow at500 °C. Thus only the main turbine is subject to the600 0C steam temperature. The HP- and IP-turbines aretherefore manufactured in high nickel alloys. To limitcosts and also get reasonable blading proportions inspite of the high steam pressure, the turbines have beendesigned with small diameters and high rotational speed.Thus these turbines have better thermodynamic efficiencesthan the previous AP-turbines in spite of the fact thatthe volume flows have been reduced by about 60 %.
The heat balance calculations for a standard VAP 20 MWplant for maximum power operation at normal seagoingFig. 15 condition for a bulk carrier is shown in Figure 15. Theall purpose fuel consumption is 234.4 kg/kWh (providedthe high heating volue is 43031 kJ/kg).
9VAP APPLICATION FOR As the oil prices have been escalating during the lastCOAL-FIRED SHIPS few years a very serious interest in coal-fired ships
has arisen.
If we assume that the coal has a heating value that is62.2 % per kg compared to oil, we can calculate the equi-valent coal price. Today we can assume:
Bunker C 170 $/tonCoal 30-50 $/ton (30 in Australia, 50 in
Northern America)Coal oil equiv. 48-80 $/ton oil equiv.
There has been a tendency to choose very conservativesteam data for coal ships. The steam temperature hasoften been lowered compared with oil plant praxis. Butthere are obiously no problems to maintain VAP standardsteam data 131 bar and 500 °C for a stoker fired marineboiler. And the experience with coal-fired fluid bedboilers is more extensive than with oil-fired fluid beds.Thus the complete VAP standard can be maintained evenfor coal firing and the heat balance is modified (relativeto the oil-fired plant) only in three respects:
1. The boiler efficiency is lowered from 90 % to about 84 %.2. The power for the propulsion plant is increased considerably
from 500 kW to about 1000 kW.

STAL-LAVAL
PM VAP 51/81
8
3. The air temperature to the stoker is limited which
reduces the possibility to use a rotary air heater,
instead an economizer can be used. But this eliminates
the fifth feedwater heater with a loss in cycle efficiency
as a result.
Fig. 16 This figure (Figure 16) shows a heat balance for a 16 MW
coal-fired.VAP plant. The total heat consumption is 3.311
kW/kW prop - whereas the heat consumption for an oil-fired
VAP is 2.802 kW/kW prop or the coal over oil ratio is
1.18 so the equivalent fuel cost is 57 to 94.4 S/ton
oil equivalent. This means that the fuel cost will be
34 to 56 % of that of the oil-fired ship, the average
is 45 %. As the fuel bill on the oil driven ship was
(3 times higher than the capital cost, it is obvious that
the capital cost can be doubled for a coal plant and
there will still be a gain.
Capital Fuel Total C i
Oil plant 1 3 4
Coal plant 2 1.35 3.35
In the example with 16 MS capital cost this means a saving
in present value of 10.4 M$.
Of course the coal-fired plant will be more costly than
an oil-fired plant. However, the above figures are very
conservative. The cycle efficiency can be improved by
introduction of a 5th stage feedwater heater and a rotary
air heater. However, the final feed temperature must
be kept lower than in the oil-fired plant as the maximum
air' temperature from the air heater to the grate should
be below 177 0C and there is therefore room for a small
economizer in the system.
In the plant it is the coal-fired boiler plant which
is more expensive than the oil-fired boiler. First the
coal-fired stoker boiler has, a furnace volume which is
60 % bigger than the oil-fired plant.*And to the boiler
cost must also be added cost for coal bunkers, coal handling
equipment and coal crushing equipment. This might double
the cost for the boiler plant, but it will not double
the total engine room cost. It is obvious that all the
above data are very conservative.
We have at STAL-LAVAL made calculations for the required
Fig. 17 freight rate for a bulk carrier. (Figure 17). These calcu-
lations were made 1980 but are still valid if only modified
for the dollar value fluctuation. VAP 1 indicateý the
curve for a VAP plant as it can be offered today with
stoker fired boilers. VAP 2 is based on the calculated
cost for an integrated fluid bed boiler where both evaporation,
superheating and reheating occur in the same boiler,
which of course must be sectionalized so that the high
atemperature tub banks can be shut off during manoeuvring
2in the same manner as when a separate FB superheater/reheater
His used.
4,

STAL- LAVALPM VAP 51/81
9
It is the firm conviction of my company that the VAPplant offers a very competitive alternative for marinepropulsion as it utilizes both oil and coal in a veryefficient way and compared with the coal-fired non-reheatplants which are offered today it gives a 15 % lowercoal consumption. And this figure can hardly be neglectedin a time of high energy costs. Especially as the cost pfor the VAP plant does not exceed that of a conventionalplant. The heat transfer surfaces are smaller than inthe loW efficiency plant and the cost of the main turbineis lower than the traditional STAL-LAVAL AP plant whichhas been considered very cost effective.
However, the introduction of coal-VAP will certainlytake some time. First the logistic system for coal bunkeringin various parts of the world must be built up and theconservatism which hesitates to utilize 600 0C steamtemperature must be overcome.
10VAP INSTALLATION For the VAP installation in the ship the module-building
concept has been used. The engine room outfit has beenbuilt in form of a number of shop-assembled modules.This has four basic advantages:
1. It reduces the outfitting time in the dock.
2. It ensures good cleanliness of the systems, as itis much reasier to maintain cleanliness during shopassembly than when the components and piping areerected onboard.
3. It reduces cost, as workshop work is more rationalthan dock work.
4. It ensures strict standardization as temptation totaylor-make the design of the piping, etc., is eliminated.

PM VAP 51/81
I I . I 250 10
J.-BC PERCENT (64 YEARS!- b~
t -80 PERCENT (58 YEARS) 1II477f
30
-~ IL
20'
FIGURE1. WOL I POUTO(Ac oKigHbar099

PM VAP 51/81
1.D Volum'e/4wtor 'C ~13.000
12000
22.000
90.00) 1
9.000
6.000
7. 000
4.0001
FIGURE 2. MARINE TRANSPORT WORK

PM VAP 51/81
Coal equivalenttons/year
5 per year
COAL
1800 1200 2100 2200 2300 AD1970 3
FIGURE 3. CYCLES OF WORLD CRUDE-OIL ANDCOAL PRODUCTION.
(Acc. to King Hubbard 1969)
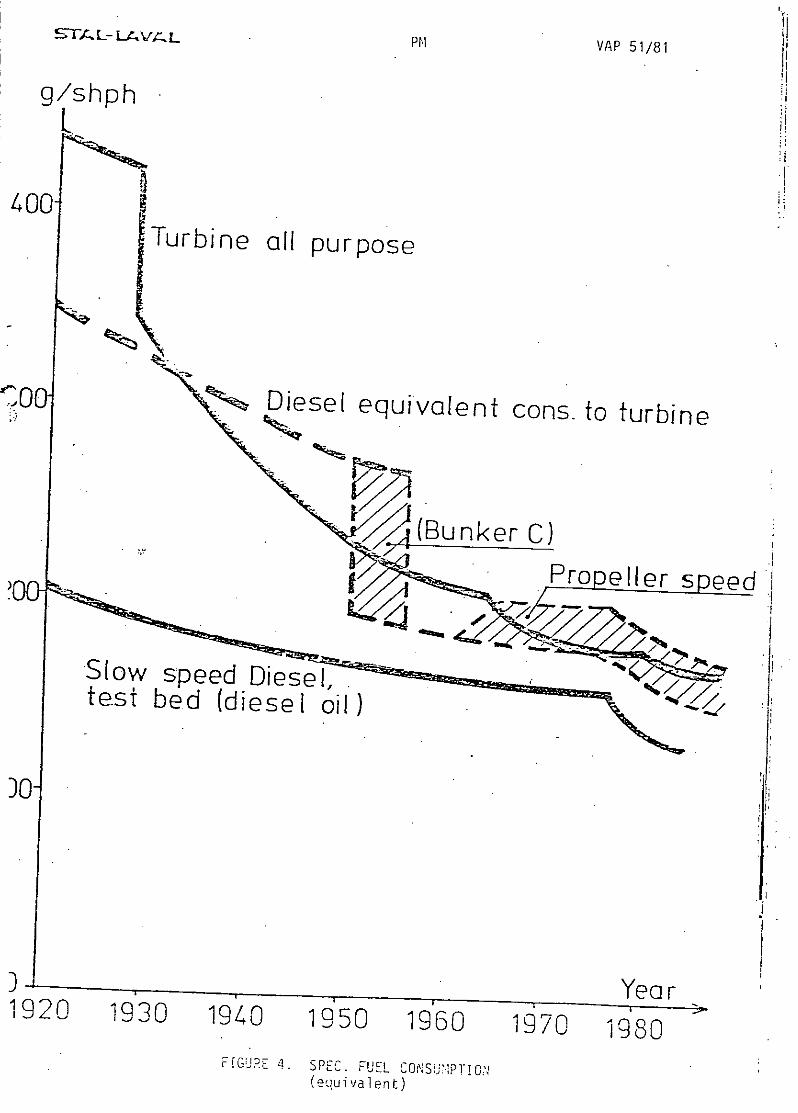
•TA-" U- LAVAL PM VAP 51/81 U
Ii
g/shph
400 ."
Turbine all purpose
c0 Diesel equivalent cons. to turbine
t j >(Bunker C)
Propeller speed
Slow speed Diesel,test bed (diesel oil)
L Yea r1920 1930 1940 1950 1960 1970 1980FfGURE 4. SPEC. FUEL CONSUY,, PT0,
(equivalent)
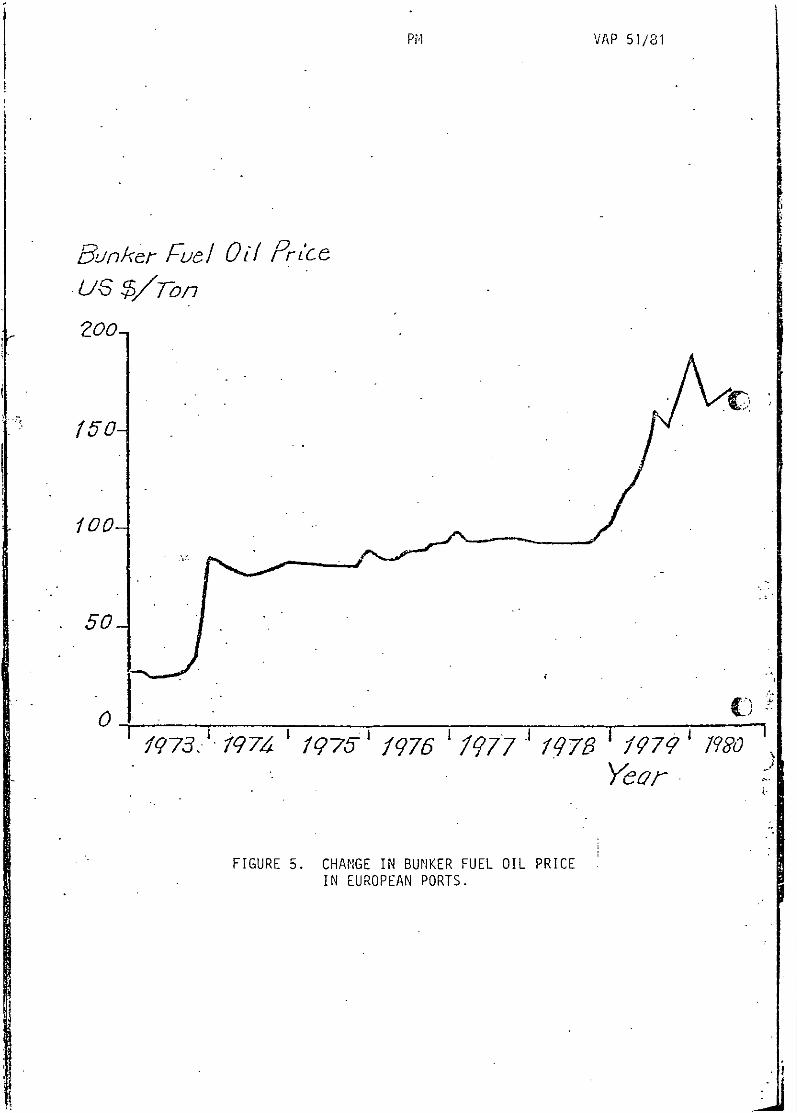
PM VAP 51/81
&jnoker Fuel Ol PrW'ce
200-
50-
M973: /,74 1975- /976 1977 fq/ 76 15?7- 1'/?08Yeor
FIGURE 5. CHANGE IN BUNKER FUEL OIL PRICEIN EUROPEAN PORTS.
I*1

PMl VAP 51/81
7777s ~ t
0/ 2 ookl3
FIGU/ 6.% COST ISTRIUTIO
Tdow 65 70 7
FIGURE 7. WORLD TONNAGE

PM VAP 51/81
R'is
T7 o Wa/c Th 7
797
0 4 -. E 56. o1979 7~~a [tofc6e -7,7t 7>ta~e 7ao
~:uE8. SANKEY DIAGRAMS. PROPU.LSIONl ONLY

PM1 VAP 51/81
OEGD Europe oil demand barrel shapeMillionton nes800
distillates
~1Il Middle_ _ _ _ _ _ _ _ _ _ _ _ _ _Fuel o il
1976 85 20
USA Oil demand barrel shapeMilliontonnes1000
'\V't'\Gases
$Light Cdistillates
Mid die1 -. distillates
I W U~lIFuel oflrS~Others
10976 1985 2000
FIGURE 10
PM VAP 51/81
Annual' costdiffereno-0
diesel gen.
AG ~ f t g, en.
5tA
AI
adoit tonal.=54 VAP. saving.oil price
I difference-7/74
DY/fF I GURE 11. COST -:.-RISCIN FOR 'IeC'~s

PM VAP 51/SI
VARP- H1Shc/I Orr for
-J.
FIGURE 12

PM V;I- 51/81
VAP standard (sfro/ified)ViI,:P I
C1
VAP2 ) L331
A TIO T3 Z TI!21tT'J I T22JI T17
{• IG 125 /T2i2
F61750 16 200
F& 200 F& 250
_ /1!
V1 15 6
15 160 TB 200
TB 200T [85 250
F[IGU<C. •3. 'lAP PIP[. 1 fiUR5 .N.E CG:-2,DC'.ENFIS

niEm 93era o m g
I 4L
B U,
ox -~ -I
1o mi- S I IZI
< < :n-V Uu-)(.
~ I C
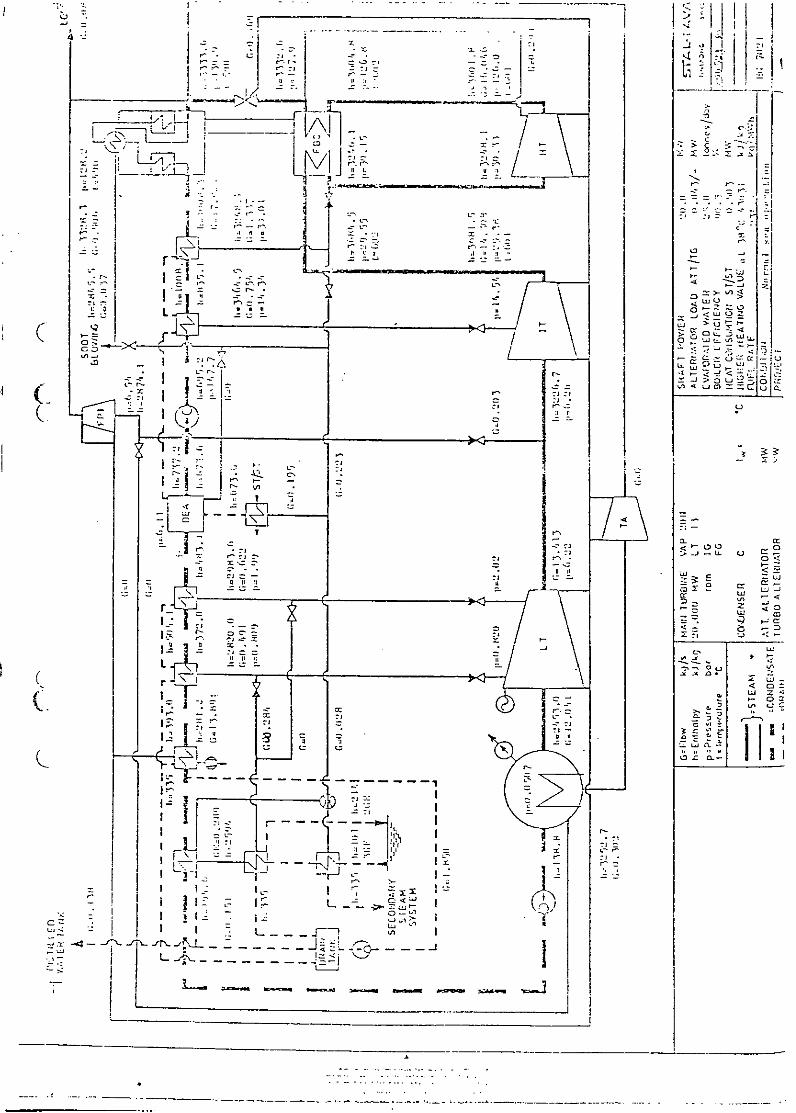
C, I I ''' I' I I Ia i
.- -'KtI Li II :1 C 2: '-Zn s
_______ ,J ~ L~1 IIk-fl____
I_ ____
- - Ii~~j~zI~t; ->
41~Ci
~ -n -&
o ~> LO 44I. C
z ~ <Li 0- ~cit _____________ / - -CL. O~
o~wu~.A -I-
uts
~i;III I
Liill I
ut4LJC1CCCi o.
I I'Qt2 I
I I
Ii
V3- Cr<-0t3>4.-,tJ.
',r r-j- C
'I -Li 4=-~ - C Cui-5. - a,-
Li-i
2- Lii
4;, _____
-5- inLi.,
CtLi.. - Ca
0Ž L~ CC
-- 0_ w cj ~At H:~
'v-NI
Jr
'Ii I----
'I -I ill' I -
ii' K
Ii K- IrCC K' K~-~ ~
-. ~---'~~fldN.,~C -S--- I
- - ~ - - - ~a- ~J I___ ________
_____ II
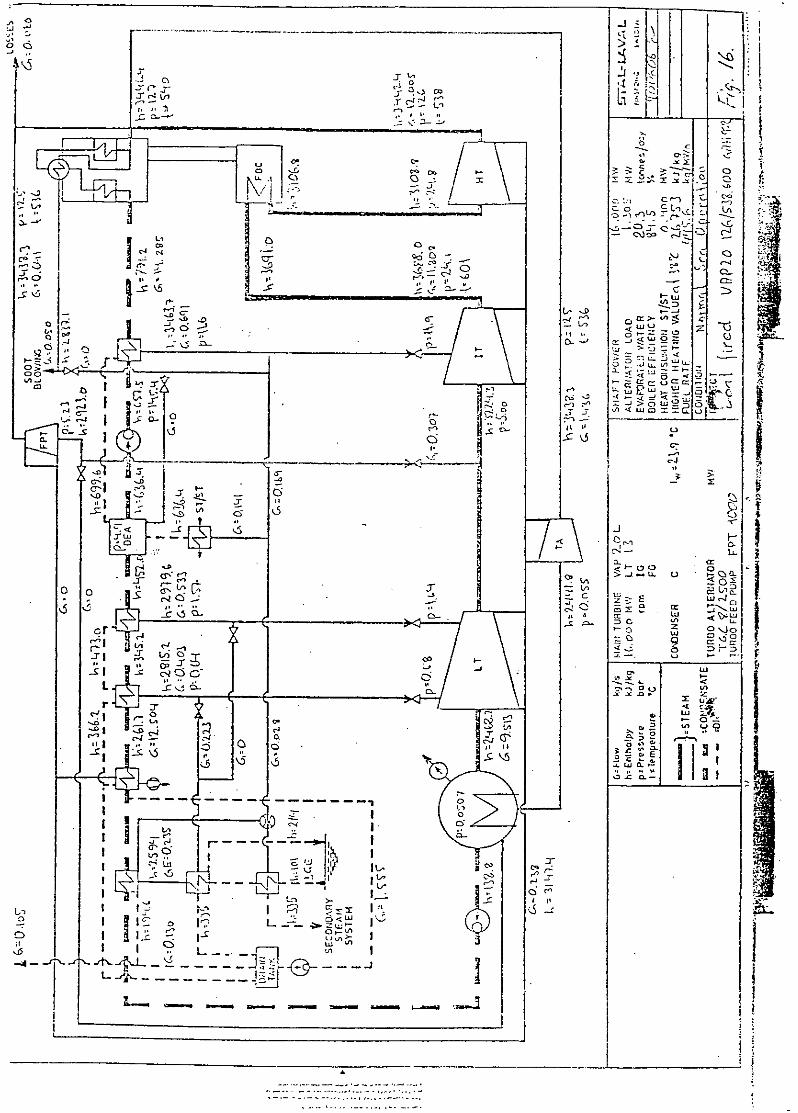
Ct-oj 0
OJ .. .; i15 t
S m Y c4 i -C(I
--Cr- rc
LII
CS JL' JoC- - - --O
Sc;Y
-Dc

VAP 51/81
RER
( I DIESEL
12
11
VAPi1
10
ýVAP 2
12 1416C KNOTS
FIGURE 17. REQUIRED FREIGHT RATE

0
0
0

Fifth WEGEMTGraduate SchoolAdvanced Ship Power PlantDesign and Operation
Paper A6
An Advanced Marine Steam
Propulsion System
by John P. Casey
Presented by Dr. Uzcan Tuncel
1. Introduction2. Cycle and Performance3. Boilers4. HP Turbine and IP Turbine.5. Consideration of Turbine Arrangements6. LP and Astern Turbine7. Booster Feed Pump8. Main Boiler Feed Pump9. Main Condenser
10. Feedwater Heaters11. Water Treatment12. Attached Auxiliaries13. Conclusion

;IEG 81 A6-1
AN ADVANCED MARINE STEAMPROPULSION SYSTEM
JOHN P. CASEY
PRESENTED BY DR. OZCAN TUNCEL
GENERAL ELECTRIC COMPANYMEDIUM STEAM TURBINE DEPARTMENT
LYNN, MASSACHUSETTS, U.S.A.
(
WEGEMT FIFTH GRADUATE SCHOOLADVANCED SHIP POWER PLANT DESIGN
TECHNICAL UNIVERSITY OF BERLIN24TH AUGUST TO 4TH SEPTEMBER 1981
______

WEG 81 A6-2
An Advanced Marine Steam Propulsion System
John P. CASEY
PRESENTED BY DR. OZCAN TUNCEL
Developments aimed at the propulsion of ships in- the 1980's must includeconsiderations of the challenging environment that can be anticipated then and afterwards.Energy conservation will pervade every decision the shipbuilder, owner and operator makesrelative to design and operation of ships. Steam propulsion equipment and systems are beingstudied and designed today to meet the many challenges of the 1980's. The General ElectricCompany, U.S.A., in cooperation with the Maritime Administration of the U.S. Department ofCommerce and other steam plant component suppliers, has recently completed a design studyof an advanced reheat marine steam propulsion plant that is in every way responsive to theanticipated demands of the applications mentioned. This paper reviews in detail the results ofthat design study, and demonstrates thet continuing versatility of stear- plant designers in(responding with theright solution at the right time, whatever the challenge.
1. INTRODUCTION 2. CYCLE AND PERFORMANCE
Today's changed economics are providing strong The MST-23 advanced reheat plant has steamimpetus to "adcancement in marine steam propulsion condfitions at the turbine inlet of 2400 PSIG (169plant design. Traditionally the marine steam plant has ATO) 1050°F (5660 C) with one stage -of reheat tobeen the beneficiary of the extensive technological 1050°F (5660C). The thermodynamic cycle Figure 1,base existing in land central station utility practice, consists of one or two main boilers delivering steam towhere economic forces have always encouraged a wheat cross-compound turbine exhausting to theoptimum performance using the most modern design main condenser at a design pressure of 1.5 inches Hgaconcepts. The power plant described is yet another (.052 ATA). Six stages of feedwater heating includeexample of how proven land experience can be two low pressure, one deaerating and three high ?judiciously adapted to the peculiar requirements of the pressure heaters. Two boiler feed pumps are used, amarine environment, providing a step improvement in booster pump taking suction from the deaeratingp ti)rmance and reliability without extensive heater and discharging to the high pressure heaters, 3.opmental testing to prove the concepts. followed by the main feed pump discharging to the• The advanced reheat plant described herein is boiler at a feed temperature of 545 0 F (2850C). Anthe result of a design study undertaken by the General attached auxiliary package consisting of the shipElectric Company, U.S.A., in cooperation with the service generator, main feed pump, auxiliary turbineMaritime Administration of the U.S. Department of and combining gear is part of the system, which willCommerce. (1) Identified as MST-23, it joins the be further described herein..world-renowned family of GE prototype marine The performance of MST-23 is shown in Figurepropulsion plants such as MST-13, MST-14, MST-19, 2 for a range of 40,000 to 60,000 SHP. At the studyetc. design point, 50,000 SHP, the all-purpose fuel rate is
0.370 lb/shp-hr (166 gr/shp-hr) including an electricalload of 1640 KW.
The means of achieving improved performancein a marine power plant are well understood and* Medium Steam Turbine Department, include, in addition to the ;nherent improvement thatGeneral Electric Company, Lynn, Mass. USA comes from increasing power (volume flow effect):

WfEG 81-A6-3
0 W i m l i i aOe
• 3.....................- ....... .
fl-UR I
.300MST 23103. BOIL
USE PURPOSE Ul L RA*
SA The boiler design for ST-23 was provided by.370- Babcock and Wilcox (Operations) Limited, London
.- and the description following is based on their public
disclosure of that design (2)..360- The boiler is of membrane construction with
-160 water-cooled, roof-fired furnace, capable of operation40 so 60 with a minimum of excess air. The reheater is integralaP/1ooo with the boiler and is capable of being by-passed or
inactivated when required, such as maneuvering,FIGURE 2 operating astern, or in-port during standby.
The boiler efficiency is 90.7%. based on 5 %excess air, a stack temperature of 240°F (1160C), 1 %a. raising steam conditions, temperature and pressure R + U losses and the SNAME standard fuel (3).
b. regenerative heating of feedwater and combustion air The large furnace dimensions recquired to permitC. reheat complete combustion result in low specific furnaced. improving the efficiency of achieving auxiliary ratings and correspondingly low exit gas temperature.
services such as pump power and electrical load The low heat content of the products of combustionAs evident in the following description of the leaving the furnace means that the heat absorbed byplant design, each of these methods was addressed and the furnace exit screen and by the water-cooled
utilized for MST-23. The choice of steam conditions convection pass enclosure walls is sufficient to preventwas based on the abundant experience in land central the desired steam temperature from being obtained; itstation utility plants operating at the same or higher was decided therefore to utilize steam as the coolingpressures and temperatures. Since the power levels and medium. Steam from the drum is led first through theflows in a land plant are typically an order of enclosure walls and the heat absorbed adds to themagnitude higher than a marine plant, special steam temperature allowing the required finalchallenges were encountered in adapting the land temperature to be achieved in the subsequentexperience to marine. The main boiler feed pump, for convection banks, Figure 3.instance, is discharging to the same total head as in a Use of steam-cooled enclosure walls alsocentral s-ation, but the volume flow seen by the pump influences the design of the boiler circulating system.is about one-tenth the central station flow. On the A naturally circulated system is preferred and toother hand, the relatively small size of the marine obtain satisfactory water supplies to the heatedhardware simplified some of the design challenges circuits at a drum pressure of 2700 PSI (190AT)related to pressure parts, such as turbine casings and requires careful design. The adoption of steam-cooledsuperheat piping, enclosure walls in the convection passes simplifies this
2

I.•E'G-CI 1-A6- 4
FIGURE 3 FIGURE 4
since the circulating system reduces to only the four shore plants, consists of a co-extruded seamless tube,furnace enclosu're walls, Figure 4. With only four the inner core of which is composed of a highheater circuits to consider, and utilizing the head temperature strength alloy, while the exterior claddingavailable when the boiler is made tall enough to is a high temperature corrosion resistant alloy. Theaccommodate the convection surface required, it was two alloys are bonded metallurgically providing goodfound possible to provide a downcomer/feeder/riser heat transfer properties and ductility. In tubular formsystem capable of giving good distribution of boiler the material is suitable for cold-forming, machiningwater to them. To provide a sufficient margin to cover and welding. Huntington Alloys, Inc., Huntington Westunpredicted variations in operating conditions it was Virginia U.S.A. produce a duplex tubular productconsidered desirable to introduce rifled tubing into the "INCOCLAD 671/800H" meeting this d-scription (4).heated circuits. Commonly used on high pressure as shown in Figure 5.nj al circulation utility boilers, the bore of these To limit the effect of the extra cost of suchtu _s is furnished with a spiral ribbing similar to the tubing, its use will be confined to those localitiesrifling in a gun barrel. The effect is to impart a where essential, Figure 6.spinning motion to the mixture flowing along the In addition to the three special featurestube, increasing the density and cooling effect at the mentioned:tube inner surface. Rifled tubes delay the onset of a. steam cooled enclosure walls,departure from nucleate boiling under conditions b. rifled boiler wall tubes,causing burnout of plain bore tubes. Their use c. composite superheater and reheater tubes,provides suitable circulation characteristics, without two stages of steam temperature control are usedmechanical assistance, for all steady state and transient Figure 7. Otherwise, the boiler design retains theloadings when the boiler is operated at 2465 PSI (173 essential features of the B&W (LTD) MRR boiler,AT) superheater outlet pressure, successfully in service.
The tube metal temperature challenges, being acombination of high temperature creep at the inside 4. HP TURBINE AND IP TURBINEdiameter and gas-side corrosion at the outsidediameter, are combated by the judicious use of a The design selected consists of separate cylindercomposite tube material in the superheater and the high pressure (HP) and intermediate pressure (IP)reheater. This tube material, currently in limited use in turbines coupled together at approximately mid-span
3

JB 1,Z G 31-A67S
SPTRAY[ TA
-EQ!.tE-r ATrE'a SURFACE
C$I ., .P
FIGURE 7
in a mid-standard-type bearing bracket, Figure 8. The
turbines are arranged in an opposed-flow.manner. Withboth the main inlet and the hot reheat inlet located inthe mid portion of the combined turbine span.
The high pressure turbine consists of six stages:and has a rated speed of 6750 RPM. It develops
approximately thirty percent of the total plant output "
while exhausting through the lower half to thereheater.
The six-stage high pressure turbine rotor ismachined from a forging made of Cr-Mo-V alloy steel,
FIGURE 5 the same material used today on modern GeneralElectric propulsion turbines. The first-state turbineblading is secured to the rotor using a new design,circumferential-type dovetail of the familiar pinetreeconfiguration, optimized for minimum width for thisspecific application of materials and loadings. Bladegeometry design uses the latest aerodynamictechniques to obtain maximum efficiency. Anextensive amount of shaft end packing is used tominimize shaft end packing losses. Additional leakoffsare used to recover shaft end packing flows and obtainuseful output from this steam. All diaphragms,
labyrinth packing, and shaft end packing are designedto be centerline supported and individually adjustable
-. . - fdr optimum running clearances.
I The high pressure turbine rotor assembly.EcONOMI!R REHEATERI includes both the forward and mid bearings, which are
of the tilting pad type. In addition, this rotor includesa tilting pad thrust bearing.
. .The high pressure turbine casing is machinedI PRIMARYSH 11 REHEATEREJ from a Cr-Mo-V alloy steel casting,. a material used
I*..,__extensively in land power generation plants where
improved high temperature properties are required. Itfeatures an integral heat chamber design nozzle box
T-F-RTIRYSH REHEATERffl which is partitioned internally to receive steam from
1S6 i_!• A........i - 4 565% five sequentially operated steam control valves. TheS-0 exhaust end of the casing is integral with the high
pressure end, thus eliminating any vertical steam jointu\ surfaces subjected to high steam pressure. Provision is*
-! PRIMARY SH . made in the casing for extracting steam for feedwaterSECONDARY SH heating from the third-stage shell.
"A. = The intermediate pressure turbine consists offour stages and has a rated speed of Q750 RPM. Itdevelops approximately twenty percen: of the totalplant output, while exhausting through the upper halfof the casing to the LP turbine via the cross-over
FI"GURE 6 piping.

JIEU 81-A6-6
nn] Q.,U~2: nr
FIGURE 8
T he. four-stage Ptubnroris machined speed HP and IP turbines, and in addit ion the initialfrom a forging made from a General Electric costs of the triple reduction designs were greater thanproprietary alloy steel with superior high temperature double reduction.properties. This rotor material is used in land power The cold reheat pressure or HP turbine exhaustgeneration applications that have similar inlet steam pressure was selected to correspond to an HP turbinetemperatures to this plant. As on the HP turbine, the power of approximately 30 percent of the total. TheIP turbine uses another new design pinetree dovetail, optimum two-input gear consisted of each gear trainmodern aerodynamically designed turbine blading, and carrying fifty percent of the load. Since the LPextensive shaft end packing and leakoff connections to turbine delivers fifty percent power and with 30maximize energy recovery. This rotor assembly percent power on the HP turbine, the remaining 20contains the Itbird journal bearing, which is of the percent was specified for the IP turbine.tilting pad type, as well as the output drive coupling The most severe operational duty imposed onto the main reduction gearing, the turbine is that associated with taking the reheater
The intermediate pressure turbine casing uses out of service during maneuvering and then returningthe same Cr-Mo-V alloy steel type casting material as to normal full power with reheat. The separatethe HP turbine. Again, the exhaust end of this turbine cylinder, smaller diameter IP rotor was shown fSr allcasing is integral with the high pressure end, thus practical purposes to be immune from any thermaleliminating vertical steam joint surfaces subjected to damage potential from load changes.high steam pressure.
6. LP AND ASTERN TURBINE(5. CONSIDERATION OFTURBINE ARRANGEMENTS The astern turbine is designed to achieve the
customary astern rating of 80 percent of ahead torqueSeveral alternative turbine gear arrangements at 50 percent 6f ahead speed with A boiler sized forwere studied, ranging from two to three cylinder ahead operation.turbines to double and triple reduction gearing in as It is a two-stage astern turbine utilizing amany combinations as could realistically be imagined, three-row wheel and a two-row wheel. The overall sizeThe details of all the findings are beyond the scope of of the astern turbine selected meets the customarythis paper; for details the reader is referred to the final astern rating with 100 percent of ahead flow, and isreport of the design study (1). small enough (first stage pitch diameter of 46 inches
The three turbine cylinder, two input gear was (1.17 in)) to allow it to be located in a conventionalselected as the final design based primarily on the manner at the forward end of the LP' turbinebetter performance and greater operating flexibility of (integral). In view of the high energy inlet steamthat configuration compared to any other studied, Of (2400 PSIG 10500 17, 160 ATO 5660C) and theall the possible triple gear reduction arrangements, inherent design, the astern turbine blading is smallernone was justified since -in each case the additional (last row blade height of 4.0 inches (102 mm)) thanlosses associated with the extra reduction exceeded that of other units (both non-reheat and moreany performance gains that might be made by higher conventional reheat) with similar capabilities. This
5

WE, 81-A6-7
results in favorable ' astern rotation losses when main feed pump and the high pressure heaters. Theoperating ahead (approximately 1/4 percent), main feed pump, the more critical pump from a designcompared to a typical marine plant (approximately duty standpoint, is assured of a positive suction1/2 percent). pressure as provided by the booster pump discharge.
An existing LP ahead turbine frame, 36 square The high pressure heaters, located between the twofoot (3.34 mi2 ) exhaust annulus area developed within pumps, see only the discharge pressure of the boosterthe last four years, but already in service, can be used pump on the tubeside. Were they located downstreamwith relatively minor modifications. The . first four. of a single feed pump they would see full drumexisting stages are modified and one additional stage is pressure, or higher, with attendant first cost andadded to obtain the desired performance. The normal maintenance penalties.full-power-ahead operating speed is 3000 RPMJ. The The booster pump in terms of flow, total head,current LP turbine casing will readily accept the astern and suction temperature is identical to feed pumpsturbine described here, since it is-smaller than the one currently in use in similar duty in marine plantsit would be replacing. The net lesult is that, despite operating at 850 PSIG 950°F (60 ATO 510 0 C).the extra ahead stage, the overall existing LP span andcasing configuration can be maintained. 8. MAIN BOILER FEED PUMP
7. BOOSTER FEED PUMP The main- feed pump, Figure 10, is a seven stagecentrifugal pump in a barrel construction. It is suitable
The booster feed pump, Figure 9, takes suction for inclusion in the attached auxiliary package drivenfrom the third stage feedwater heater, the deaerator, by the propulsion unit, or for separate mountingand discharges to the high pressure heaters. - driven then by eithera motor or steam turbine.
Conventional practice in commercial marine The main feed pump takes suction from thepower plants is to have one boiler feed pump in the highest pressure heater and discharges directly to thesystem, discharging to the boiler through high pressure boiler. The high feed temperature results in a highheaters, when used. The subject plant, with boiler volume flow through the main pump, compared to thedrum pressure of 2700 PSI (190 AT), demands more booster pump.head or pump discharge pressure than can be gotten in Figure 11 shows the characteristic curves of thea single pump, given the volume flow of the system. main feed pump with super-imposed system head andCentral stations operating at the-same pressure as this flow requirements at 50,000 shaft horsepower. Pointplant have volume flows an order of magnitude A represents the normal full power condition. Withgreater. It is necessary therefore to separate the the pump rotating at 6300 RPM, the flow and headpumping duty into two steps; first through the use of just match the system requirements. Point B representsa booster pump and.then through a. main feed pump. the point chosen as the normal full-power operatingThis arrangement has'side benefits that accrue to the condition when the main feed pump is included in the
FIGURE g IFIGURE 10

12 "7 ,130 p , •'! F ,G 8 1 - A 6 - 8
II
10
00 7B I ID
4 I I
3 0
2 0
0~1 30-0
0 100 200 300 400 -50 600 700 800 900 1000 "00 1200U.S. GPM
FIGURE I1
attached auxiliary drive. It is gotten by running the main feed pump, a standby turbine-driven pump ispump 10 percent faster and by imposing an additional provided to facilitate variable-speed, operation. Ahead (B-A) by throttling in the feedwater regulating turbine driven main feed pump would be operated as avalve. Five percent speed margin is required to variable-speed pump, maintaining a constantanticipate propeller speed mismatch, leaving five differential pressure across the feedwater regulatingpercent speed to provide flow and head margin. The valve.additional head between points A and B representsexcess power during normal operation. . 9. MAIN CONDENSER
To satisfy a boiler overload condition, such asthe 40 percent overload at Point C, Figure 11, it The condenser is designed for use with eitherwould be necessary to increase the speed of the pump downward or axially exhausting low pressure turbines.to 7730 RPM. This could be done, after declutching It is a single pass, scoop circulated design, with a ratedthe auxiliary package, by speeding up the auxiliary back pressure of 1.5 inches mercury absolute (.052turbine. The generator, however, would then not be ATA).operating at synchronous speed and. would have to be 1 hree *basic material combinations aretaken off the line. An alternative would be to operate considered: all copper-nickel parts exposed to seathe pump normally at 7730 RPM while attached and water, aluminum brass, or titanium tubes with1-hrottle to point D, Figure 11, but this Would waste copoer-nickel waterhoxes and tube-sheets suitablyimost as much as is initially gained by attaching the protected to preclude galvanic action between the twopump. Accordingly, the attached pump is not used for dissimilar materials. Tube waterflow velocity variesboiler overload. Instead the standby pump with its with the type of tube material.own independent driver is used to satisfy boiler The condenser hotwell is designed for tenoverload. Point E, Figure 11, represents a condition minute storage capacity, with full exhaust flow and nowhere the plant is operating at 70 percent power, condensate removal.which on a cubic relationship means 88.8 percent Air and non-condensible vapors are removed bypropeller speed. The main feed pump, if still attached, means of two mechanical vacuum pumps; one pump is
- would be rotating at 6160 RPM, delivering the sufficient for normal operation-required flow and head to the system. This operating The main condenser, from a performance andcondition can be met with the attached generator on size point of view, is no different than condensers thatthe line at reduced frequency, or a special gear ratio are currently in service. The special requirements ofcan be provided that will provide synchronous the condenser in the advanced plant are related to thegenerator speed at 88.8 percent propeller speed, stringent requirements for feedwater purity, as
This discussion of main pump speeds and explained in the discussion of that subject elsewhere indischarge throttling holds true for any constant-speed this paper.driver such as a motor. With an electrically driven The most common tube materials in use for

I.EG O1-A0-9
marine condensers are copper-nickel and aluminum level control valve to the first stage heater, which inbrass. Another candidate tube material is titanium, turn, drains thrcgh a level control valve to thewhich has exhibited remarkably good performance in atmospheric drain tank. A drain pump takes suctionland central stations using seawater-cooled condensers from the atmospheric drain tank and pumps thein systems designed and operating at the subject steam condensate back into the condensate systemconditions. The additional cost of titanium over either downstream of the second heater.copper-nickel or aluminum brass must be weighed The deareator, or third stage feedwater heater, isagainst the additional assurance of condensate purity a direct-contact heater designed to completely deaerateprovided by the titanium design. the feedwater at all ratings between 5 and 100 percent
The most probable source of seawater of full power flow. The oxygen content of the feedcontamination of the condensate is the tube area, in when leaving the heater is not over 0.005 cc/liter forparticular at the tube-to-tube-sheet connections and any flow between the minimum and maximum.near the inlet ends of the tubes. One condenser design - Steam supply to the deaerator is from thefeature intended to facilitate condensate monitoring is auxiliary exhaust line, which is maintained primarilyto provide a tray or trough in the shell directly below by turbine extraction steam, but which also acceptseach tube-sheet. Condensate that has collected on the the feed booster pump's turbine exhaust steam- Thetube-sheets and tube ends will collect in the tray, heater receives drains from the fourth stage heater andwhose contents can be passed over a conductivity cell, the low pressure steam generator.and then either spilled into the condenser or piped The storage capacit of the deaerator is tenexternally t h owl.Tesoaecpct ftedartri e
e Atenatother methodtw sele e lminutes supply at full power flow to the. boiler.Another method of selective leak detection is to Material of construction is stainless steel.
isolate all of the condensate between each tube-sheet Three-separate high pressure heaters are arrangedand the first support plates, collect the condensate in te uee
those areas, and pass it over a conductivity cell before booster pump to over 500'F th600 C) before enteringleading to the hotwell. Temperature depression of the tem pump Each heate is ofose elleandisolated condensate is a consideration in such a desi•n, tube, multipass design. The heaters are vertical withand means of reheating might become necessary, such head d esied wh heate am fromas mixing the isolated condensate with the remainder ha onadaesple ihhaigsemfo
the high pressure and intermediate pressure turbines-before the hotwell.
As a protection against complete plant As in the low pressure heaters, two
shutdown in the event of a seawater leak, divided tube-material combinations are available, copper-nickel
waterboxes can be provided, which will permit or stainless steel; the higher temperatures dictating theuse of 70-30 copper-nickel.
continued operation at reduced load while repairs arecompleted. With divided waterboxes, additional The drains from the high pressure heaters are
segregation of the condensate in the tube-sheet trays cascaded: the sixth heater drains to the fifth, the fifth
or isolated areas of the condenser will be required so to the fourth, and finally the fourth to the deaerator.
the side of the condenser with a leak will be known The fourth heater drain is also capable of going to the
immediately. condenser if the extraction valves are closed and thefourth heater shell pressure is insufficient to force the
10. FEEDWATER HEATERS " drains into the pressurized deaerator. At that time. acontrol valve, sensing differential pressure in the third
The two low pressure heaters and the gland and fourth heater shells, is opened automatically toleakoff condenser are supplied either with all sections drain the heater.combined within a single shell, or as three separate Although part of the design of a high pressureunits mounted horizontally in a single frame one power plant, the first two high pressure heaters areabove the other. The units are of the cose-d she!l, very similar in flow, shell pressure, tubeside pressure.multipass design. Two tube-material combinations are and feed temperature to high pressure heaters inavailable; 90-10 copper nickel or stainless steel, the similar service in 850 PSIG 950°F (60 ATO 510 0 C)stainless design offering a higher assurance of-system marine power plants. The top, or sixth heater,condensate purity at a higher cost. however, does have higher design pressures and
The gland leakoff condenser is sized to handle temperatures, than current practice, but even so is well
all air and vapor from the main turbine and generator within the range of current heater design practice.turbine gland seals. It also handles all air and vaporfrom the deaerating heater and the atmospheric drain 11. WATER TREATMENTtank. Drains pass to the atmospheric drain tank. Amotor-driven leakoff exhaust fan is provided for Feedwater, condensate and steam purity mustmounting on or near the gland condenser to exhaust be controlled by both chemical and mechanicalall non-condensable vapors to the engine room. treatment procedures. Because of the high firing rates,
The first and second stage heaters are designed heat flux, and steam output of marine boilers,to receive steam from a low pressure turbine especially at pressures of 2400 - 2700 PSI (169 - 190
extraction and heat the feedwater at the full power AT), total solids must be kept at the lowest possiblerating to within 10°F (60 C) of the steam saturation levels- Demineralization is required for the makeup,temperature. The second stage heater drains through a main stream condensate and side stream condensate.
8

W~EG 81-A6-1C
Feedwater and high heat flux rates, the tubes are extremelysensitive to deposits. Caustic treatments must be
In the marine field, an evaporator will still avoided, since the tubes will be susceptible to causticprovide one source of feedwater. Evaporator gouging failures.manufacturers will only guarantee four ppm total A conservative coordinated phosphate treatmentsolids, in the distillate. In operation, a 'properly using sodium phosphates for pH control and hydrazinemaintained evaporator will produce, at best, for oxygen scavenging is recommended.approximately two ppm total solids in the distillate.This amount of solids in the water is far too high for Condensateuse as an acceptable feedwater for 2400 PSIG (169ATO) operation. Therefore, the output of the Provisions must be made to guarantee the purityevaporator will have to be treated to lower the solids, of the condensate which will constitute a highThis must be done using a mixed bed demineralizer, percentage of the total feedwater. Corrosion in theFigure 12. Probably two mixed beds will be required condensate return system introduces metal oxides intoand provision for regeneration of the resins will have the feedwater, which may subsequently deposit onto be made. A suitable feedwater holding tank must boiler tube surfaces and cause localized overheating.be part of the system. Mechanical filtration ahead of Tlerefore, the main condensate stream will have to bethe mixed bed derhineralizer will probably be required, polished, using a mixed bed demineralizer. Since the
In addition, the pH of the evaporator output resins are 'temperature limited (130 0 F, 540 C) thewill have to be adjusted, using ammonia, and conditioning has to be before the heaters. This willhydrazine will be added after the deaerator to remove remove corrosion products and provide some veryfinal traces of oxygen. temporary protection in case of a condenser leak.
In addition, all side stream condensate must be'oiler Water mechanically filtered (5 microns) to remove oxides.
Internal chemical treatment of boilers 'is Instrumentationdesigned to prevent scale formation resulting fromtrace amounts of hardness in the feedwater and to On-line instrumentation for oxygen.increase the pH of the boiler water to promote the conductivity, hydrazine, and pH monitoring will beformation of magnetite on the tubes. At high pressure essential. Further, control of the treatment should be
tied to the instrumentation via pump actuation. Theinstrumentation output should be tied to recorder andalarms.
I. The cation conductivity at the condensate pumpsuction and discharge and feedwater pump suctionshould be montored continuously to record purity andpossible leaks.
I °Deaeration
Oxygen control is extremely important. A good,-functioning, mechanical deaerator will be required.
The oxygen content of the output water should be nohigher than 0.005 cc/liter. The oxygen content at the
f, IKt..eaerator inlet and outlet must be monitoredtS continuously. Sieps must b:! takon to sample at tilese~ ~*.7 -j J"~t~Ylocations.
CtLL 12. ATTACHED AUXILIARIES
.. nt.0 The MST-23 design includes a new attached
, .auxiliary arrangement, Figure 13. Both the ship service~ 1P2 .generator and the main boiler feed pump can be
tII T'- included in the package, or the feed pump can beseparately mounted with its own driver. The combinedpackage, generator and pump, is made possible by aspecial four rotor combining gear, Figure 14. Input isfrom the low pressure turbine pinion shaft. Twooutput shafts, one for a low speed generator and theother for a high speed boiler feed pump, are provided.Also, connected to the high speed output shaft is theauxiliary turbine which has been especially designed
FIGURE 12 for this service, Figure 15. The turbine has a two-row
9

YE8-A6-11
C1 C L COV'RmNn
VIC. c I 154C1 CN OtRECT CONNE~CT AtJItARY tUftBPE
FIGURE 14r
I CLNEAACL
FFIGURE 14
CLL
FIIGURE 13
1 1 0

WEG 81-A6-12
single stage steam path and a mecharucal-hydraulic The author wishes to express his gratitude andspeed governor operating on bearing lube oil. Note indebtedness to the following firms who assisted in the
that the turbine shaft is double-ended and that the study described and/or whose permission was freely
Thus the boiler feed pump may or may not be the text:included as part of the package depending on thecircumstances of the installation. Babcock & Wilcox (Operations), Ltd.
A dental tooth disconnect coupling is used for Ingersoll-Rand Companyattaching the auxiliaries to the main propulsion unit. Coffin Turbo Pump Division of FMC CorporationThe coupling does not contain any friction Foster Wheeler Energy Corporationsynchronizing elements, but is normally engaged or Huntington Alloys, Inc.disengaged hydraulically on command over a small Drew Chemical Corporationdifferential speed range. Main propulsion and auxiliary Crane Companyspeeds are converted to electrical signals which are Weise Marine Pumpsmonitored and compared electrically. In the allowable and to his colleagues in the General Electric Compae~y,differential speed range, a hydraulic ram is used to USAengage the two sets of coupling teeth.
13. CONCLUSION
An advanced marine steam propulsion systemhas been described which is based on the extensi .vetechnological base existing in land central stationutility practice, having steam conditions of 2400 PSIG(160 ATO) 1050OF (566"C) with one stage of reheatto 1050OF (566 0 C). To a large extent the systemdescribed falls within the realm of existing provenhardware already in service in marine steam plantsthroughout the world. The design considerations REFERENCESnecessary for the boiler, main boiler feed pump, theHP-IP turbine and water treatment to accommodate (11) Contract NOS. 5-38068 and 6-38042the advanced steam conditions have been identified Report NO. MA-RD-920-77056 - June 30, 1977and practical solutions put forth.
VtThe advanced reheat plant described herein in (2) Hodgkin, A.F., Marine Boilers for Very Advancedytanother in the long list of steam plant Purposes, IME London - January, .1978
developments that have taken place since theintroduction of steam as a marine motive force. It and (3) Technical and Research Bulletin 3-11, SNAMEother developments underway today will insure the N.Y. USAavailability of marine power plants in the 1980's and-beyond, ideally matched to the needs of the marine (4) Incoclad 671/800H, Huntington Alloys, Inc.community functioning in- the energy-conscious Huntington, West Virginia 25720, USA -
environment that has already begun to emerge.

A4 5 Part Divides02966

Fifth WEGE/ TGraduate SchoolAdvanced Ship Power PlarDesign and Operation
Paper A7
Bled steam reheat,attached auxiliaries
by
o. Prof. Dr.-Ing. G. Grossmann
,y,-

WEG 81-A7-1
K.-G. Grossmann, C.Eng., F.1.Mar, E., STG*
*This paper describes a marine steam cycle for high steampressure and low fuel consumption. To achieve a good fuel eco-nomy at partial load, the system is designed to operate. frommaximum manoeuvring rate to "full away" with a floating boilerpressure PT- To increase the safety margins of the system andto simplify the feed water control the water level set point isfloating proportional to the steam velocity in the superheatersteam pipe. The theories of the water level and the. boiler pres-sure behaviour are discussed and evaluated for the control sys-tem. Full scale tests at sea trials and dock trials and test onthe small steam turbine plant of the Institut fir Schiffstech-nik were run, to prove the theories and the control philosophy.
1. INTRODUCTION For safe operation, the turbine con-trol system and the boiler control
Due to the sharp increase in fuel system are interconnected. During ma-prices, steam turbine plants for ships noeuvres, the latter ones are control-are in discussion again because of led by the turbine control system.their rather high specific fuel con-sumption. All over the world new 2. SELECTION OF THE REHEAT SYSTEMsteam systems with higher steam pres-sure, slightly higher steam temperatu- Two principle modes of operationres and with reheat are put forward. can be defined:
This paper deals with a steam Mode 1: Manoeuvring and port conditions( plant, which is designed to be self Mode 2: Full away operation.controlling in the "full away" condi-tions, and is verysml'n eib During mode 1 only 50% of the MCR de-tios, nd s vry simple and'reliab-le. To get a low fuel consumption,the mand is needed to cover the manoeuv-plant is run from manoeuvre conditions ring conditions with no extractions(CMR) to maximum continuous rating open and 50% power of the main turbine(14CR) with floating boiler pressure pr at 79% of the propeller revolutions.full open turbine control valves, all (This is for a ship with rather lowbleed points in operation and the main velocity, e.g. tanker. For a fast con-feed pump and the main generator at- tainer ship, the manoeuvre load maytached to the main gear. By this way be even smaller.) The steam demand forthrottle losses are avoided when stea- full astern rises to 70% of MCR on ac-ming at less than full power. In ad- count of the low efficiency of thedition to this the stresses inthe boi- astern turbine, but this power is usu-ler tubes, the main steam pipe and the ally needed only at crash-stops.For mode 2 the steam demand risesturbine inlet are considerably lowered, from 40% up to 100%, with the revolu-
tions going from 73,6% up to 100%. Du-* o.Prof. Dr.-Ing. for Marine Enginee- ring this mode, all bled points should
ring, Technical University Berlin-W. be open.

WEG 81-A7-2
Three conditions can be postulated for an influence on the natural circula-the steam cy'cle. tion.1. The propuision system must be as With the independently fired re-
simple as possible, to provide easy heater, which is always connected toservice and to demand little main- the main boiler, there is a change of
tenance. The elements of the pro- the flue gas flow downstream of thepulsion system must be of proven reheater. This also has an influence
design and of highest quality, on the heat transfer of the whole boi-
2. When in mode 1, the plant should ler.All flue gas reheat boilers needbe able Lo perform rapid load chan- two temperature control systems. Oneges without any risk to the safety controls the superheater outlet tempe-of the system. (This implies an ad- rature, the second one controls theditional requirement for the boiler ratur tle temperatre theThe aturl cicultionmustal- reheater outlet temperature eitherThe natural circulation must al- with dampers at the colder end of theways be guaranteed even with load boiler or by adjusting the fuel supplychanges.) Economic considerations - to the reheater burner. The latter is •such as low fuel consumption - are the biggest complication because itnot of major importance, because needs also an air control system forthe time, in which the ship will the rather small fuel flow to the re-run in mode I is comparatively heat burner. For both burner systemsshort and the boiler load is usu- an excellent combustion with excessally low to medium. • air below 5% has to be achieved to a-
3. For the whole full away range - void corrosion at the boiler outlet.mode 2 - the lowest possible fuel All flue gas reheat systems haveconsumption should be achieved.With a change of the steam temperature atthe exception of the emergency stop the inlet of the medium pressure tur-
all load changes will be rather bine. When switching from mode I toslow. Id the boiler pressure is mode 2, the reheater is activated andraised above 80 bar,with the steam the medium pressure turbine-has to betemperature around 530 0C, some kind heated gradually to full reheat tem-of reheat system will be needed to perature. When going from "full away"
keep the moisture at the exit of conditions to m~anoeuvre conditions,the low pressure turbine withinac- the reheater is closed and the MP-tur-ceptable limits. The choice is be- bine has to be cooled down graduallytween flue gas reheat and bled again. Unfortunately, these load chan-steam reheat. ges may happen very fast, when a crash-
stop is initiated or the turbine trip
2.1 Flue Gas Versus Bled Steam comes. Especially in a crash-stop case
Reheat the boiler state is changed from thefull load condition with reheat rather
With the same live steam condi- suddenly to 75% load without reheat.tions, flue gas reheat offers a gain The temperature changes rise up toin fuel consumption of 180 0C (323 - 5030 C), when normal
b = 7 - 8 g/kWh ý 3.4% steam temperatures are taken. Natural-
when the steam is reheated up to the ly they will be higher with highersteam temperatures. With a steam Lem-full superheater temperature. With alower reheat temperature the gain in perature of 600'C the difference runsfuel, consumption will rapidly go to up to 250'C.uerto. There exists another big problem
zero. on the boiler side. Fig. 1. shows theThe boiler for a steam cycle with boiler of the "Esso Norway", delivered
full flue gas reheat has either two in 1969 with a 100 bar/5100 C and re-parallel secondary passes for the flue heat to 510 0C. This figure shows al-gas - one for the reheater and theother one for the primary superheater ready the difficulties, in building
Sor an indenendently fired reheater. superheater, reheater and economiser- ointo the boiler. The second pass isWhen in mode 1 the reheater is by- nt
sen whinh modea thet rhear disiby- much longer than the furnace. Withpassed which means, that the distribu- higher pressures, the evaporation heattion of the flue gases and the heat becomes still smaller and the heattransfer to the boiler proper is no rre to superheater, economiserlonger symmetrical. This of course has and e
and reheater becomes more, so the de-

-F
WEG 81-A7-3
li
sign problems increase. Naturally they material for the LP-turbine does notcan be overcome, but they need speci- need to be of high heat resistanceal efforts. quality. The reheat temperature also
The figures in table 1 give an decreases with decreasing load, dueindication of the problems involved, to the reduction of the pressure at
the bled points - and vice versa. WhenTable 1 the steam temperature at the reheater
entrance is the same as the condensa-System No 1 2 3 4 5 tion temperature of the first bled
point, the reheater closes down auto-PK (ba4 65 65 100 130 150 matically, as the heating steam is notUE [OC 530 530 530 530 530 longer condensed.
As simplicity of the plant and oftp S C] 138 220 236 236 236 the controlsystem was regarded as the
r [kJ/kg]1544 1544 1276 1113 985 most important point, a bledsteam re-heat cycle was selected. It was also
n~huE [kJ/kg] 710 710 745 764 796 decided, to stick to bormal heat re-&hhUE/r 0,46 0,46 0,58 0,69 0,81 sisting material which is in use al-
ready, and to go to the limits of thisAhsp [kJ/kg] 630 290 444 520 587 material, 13 CrMo 44 or 1OCrMo 910.a hsp/r 0,41 0,19 0,35 0,47 0,61 This defines the steam conditions with
•hzE [kJ/kg] 422 440 441 PKE = 150 bar superheater outlet~ZE42 44 44 KAhZE/r 0,33 0,40 0,45 PT = 155 bar steam drum
AhdlUE+Ahsp P tKE = 530 0C superheater outletr0,87 o,65 0,93 1,16 1, 42092.2 Selection of the Pressure System
uEh SP ZE 1,2 SP 1,87 High steam pressures, as abover 1,26 1,56 1,87 mentioned, certainly increase the pro-
blems with flange tightness,packings,
In comparison bled steam reheat has a pipe line stresses, glands etc. Espe-fuelompaionbsuptin tehean fl as a cially the stresses become a problem,
higher fuel consumption than flue gas when the load is rapidly changed duringreheat. It utilizes practically only manoeuvres. To-reduce these difficul-the pressure - and temperature increa- ties and to lessen the psychologicalse. But the boiler for this system is burden on the engine room staff, thea normal one with a single secondary following is proposed for the highflue gas pass. The space problems for pressure system. ,jjthis boiler are smaller than for the 1. All auxiliaries and all makeflue gas reheat boiler. It is easily up steam comes from a 60 bar branchpossible to build the normal boiler line, which goes offthe main steamfor 20 bar higher pressure than the line just before the main turbine.reheat boiler. With this higher pres- Also the astern steam is taken fromsure, the benefit of the better fuel this line. This leaves us with onlyconsumption for the flue gas reheat one steam pipe with the super highcycle decreases from 3.6% to 1.8 - 2% pressure, running from the boiler(if the cycle is otherwise the same!). (boilers) to the main turbine. All the
A "normal" boiler not only means auxiliary turbines are practically theonly one temperature control system same as just up to now and all the,without dampers but also only one small auxiliary steam lines are desig-south-blower system! and less access ned for the "normal" pressure of 60ban-openings in the second pass. The re- 2. The boiler pressure is floatingheater is heated by bled steam from from 64 bar at manoeuvre conditions tothe first bled point. It is placed in 150 bar at MCR. This reduces the stres-the cross over between the HP-turbine ses due to the steam pressure by theand the LP-turbine. The cross over factor 2.5 and the overall stressessteam is heated up to below the con- are also considerably reduced whichdensation temperature t of the means that the safety of the systemfirst bled point. This means, that the is definetely increased. The floatingreheat temperature is always lower boiler pressure is based on a turbinethan the saturation temperature t ofthe live steam. For this reason t~e with a 360 degree anlet steam admis-sion area.

WEG 81-A7-4
The full inlet area gives an undistur- Table 2 Calculation of natural cir-bed temperature field at the steam in- culationlet, which decreases the thermal stres- ./.ses The throttle valve of the turbine PT/PTO PT WO u fz/mzowill be full open at 64 bar and CMR(Continuous Manoeuvre Rating = lowest bar m/s -power with all bled points still in 1 155 0,734 12,2 1
action). The turbine will then deliver 0,8 125 0,738 16,7 1,094%0,6 95 0,728 23,8 1,1740% power at about 73.5% of the design 0,4 65 0,696 3,8 1,20
propeller revolution. 0,4 65 0,696 36,6
Besides increaskgthe safety, the 0,7 65 0,881 23,2 1,32
floating boiler pressure has another 0,8 155 0,684 14,3 0,940,6 155 0,622 17,3 0,86
benefit. It allows the main feed pump 1to be attached to the main gear during 0,4 155 0,541 22,6 0,74
the whole full away range from 40% po-wer at 73,5% RPM to 100% with 100% RPM.The capacity of the pump decreases lessthan the feedwater demand and the boi-ler pressure decrease with the load (going down. Fig. 2 shows the characte-ristic service conditions of the atta- With a floating boiler pressure theched feed pump.Wihafotnbolrpesete
water velocity w remains practically
23 Floating Boiler Pressure versus, constant, which means that the circu-Nozzle control * lating water volume V stays constanttoo and the circulating water massThe nozzle controlled turbine flow m' is even increasing. The coo-
certainly has at low loads a better ling of the evaporation tubes is be-steam consumption than the throttle coming better with decreasing boilercontrolled tugbine because of the gre- pressure.ater enthalpyfdrop. The gain amountsto3 - 4%. Partially this is offset by 3. SELECTION OF THE STEAM CYCLEthe lower steam consumption of thefeed pump, especially if it is atta- 3.1 Main feed pumpched to the main gear. The nozzle con- As already described, during fulltrol of the main turbine demands afixed boiler pressure. The increased away conditions, the feed water will
be supplied by an attached pump.Thissafety of the floating boiler pressure has no back up turbine; two full size,is thought to be more important than sam drve fe pumps a povidedthe saving in fuel consumption at low steam driven feed pumps are providedload, above all as the fuel consump- for stand by.
tion at low loads for the proposedcycle is considerably lower than that 3.2 Attached Generator, - Floatingof the present steam plants at slow Frequency
steaming. The electric load for the propo-sed system is estimated to be 725 kW,
2.4 Natural Circulation and Floating which can be divided into two groups.Boiler Pressure To group I with 375 kW belongIt is very important, that t~he na- all motors, where the power can be re-
tural circulation always supplies lated to the mains engine power, like
enough water to the evaporation tubes the F.D. Fan motors, the main conden-so that burn outs do not happen. sate pump motor and some more.Table 2 gives the figures for the mean In group 2 is all the other
water velocity w at the entrance into equipment, which needs a more or lessthe evaporation ?ubes and the circu- stable frequency and voltage. The airlation number u =n /flc,* condition-plant, which needs about
a n150 kW, is included with 75 kW to getthe average voyage load.
When we leave the generator atta-ched to the main gear during the whoefull away mode, then the frequencywill float from f = 68 Hz at MCR to

WEG 81-A7-5
f = 50 Hz at CMR. This means that in PKgroup 1 the revolutions of the motors [bar]decrease accordingly.
For group 2 a frequency and vol- 200tage converter will be provided.(Thisis standard practice on motorshipswith shaft driven generators and F.P.propellers.) With 85% efficiency, NCRthis means a generator load of 785 kW. # I cargo oil pump Pressur
For the attached generator a full loss-insized diesel generator and a turboge- 150 MCR losiernerator will be supplied, so no back- boiler pressureup turbine is needed.
By attaching the main generatorto the main gear, the fuel consumptionwill decrease by 2,75 g/kWh.
The diesel generator is activatedand automatically synchronised when
1. the turbine trip valve is acti- 100 '--- -0
vated, 0K?42. an energency stop manoeuvre is,( 2 . ordered,
3. or revolutions lower than Kare ordered. MCR CR stern\'
3.3 Bnijer fans, deaerator and main port (discharging)condensate pump 0
With the main generator atta- so 100 I50ched to the main gear in mode 2, the nio boiler load rn/hifrequency and the voltage will float M.according to the change of the revo- Fig.2 Operation of attached feed pumplutions. Whein a frequency f = 68 Hz is Hselected at 14CR, than the frequency [MM WC]will drop tot = 50 Hz at CMR. This 2fn
~-1l000(
(\ _( . I M C Rsph\ dsaicargo
750 olpump
_ r Ac 2 tons 0HMC
0 1500
e0vo0poralnrte[ph
superheat boiler (dischargitng0f esuperheate n
-250 ,q/
I-b evaporation rate [It-p/hjFig. I Flue gas reheat boiler Fig. 3 Boiler fans with floating
frequency

WEG 81-A7-8
MnD VER/
mDWR HPreheater Lp G main E
:~ondenser "
turbine turbinecodne#mrDVERI•,bn_ ,t,_ o
IAl A2 A3 A4ZA5 hDYD n7SER1
VDevaporator
mD5Ep
condensate jrnv h • •pump
PENT 4 5 KOKMO'~• , rhL)WR mnoV
nOGES VW vwmL " "2 VW: Feed water heater (
deaerator
feed pump
Fig. 5 Steawi cycle
3 .8 Turbine versus Diesel Engine ,1 on the diesel engine will increaseThe fuel cfigures for with rising power. Above 30 MW twinh s seed dconsumption e for diesel engines have to be taken,which
a slow speed diesel engine running on brings the fuel consumption of the
fuel with a lower heating value ofdislpatowsthgerilU.= 40 600 KJ/kg (9700 Kcal/kg) and diesel plant down, as the gear willa • vci Qf about 3 cat and give the desired propeller revolutionsa viscosity gf about 350cStat 53aC now. On the other hand the investment(350 Rs at 1'00'F). costs rise considerably, so the over-
all running costs of the turbine plantLoad % 100 75 50 25 will still be lower than those of theConsumption g/kWh 214 215 219 226 diesel plant. Fig-. 6 shows the fuelCorrection consumption curves as a function offor Ig/kWh lub oil = 5 g/kWh fuel oil the load.
g/kWh 219 220 224 231
Correction for higher propeller revo-lutions (103 RPM 85 RPM)
300 gkhg/kWh 235,5 236,5 240,8 248,5 0 /kWh]
Correction for 400 kW generator load.(0,85% conversion factor for frequency)
mBSPEZ g/kWh 239,9 243 249,8 267,2
2% losses at separation turbine plant
mBSPEZ g/kWh 244,7 247.8 254,8 272,5
The proposed system has a fuel con-sumption, which is slightly better thanthat of the equivalent slow speed die- 250sel engine down to 95% of the power. 7-This indicates, that the 23 MW steam Diesel plant
plant with bled steam reheat will havethe same fuel consumption as the slow 10 Is 20 25speed diesel engine, when running at
Ifull power. As this plant is much [IMW]simpler than the equivalent diesel
plant for a tanker, it will be compe- Fig. 6 Fuel consumption curvestitive even at lower powers. The edge

WEG 81-A7-9
4. CONTROL SYSTEM 4.1.1 Boiler pressure control
Theoretical evaluations show, thatDuring manoeuvre conditions, the the drum pressure p is a better con-
plant should be able to do rapid load trol variable than The steam pressurechanges without any risk, whereas load pK' because the thermal state of thechanges under full away conditions are boiler is not changed with every loadrather slow. The exceptions are the change, as long as the plant is in ma-emergency stop manoeuvre and the tur- noeuvre state with a fixed boiler presbine trip, but these kindbof load sure.changes are fortunately rather seldom When the drum pressure is changed
The usual control point for the the latent heat of the boiler water ispower of the turbine is the revolution changed, it is lowered with a pressureof the propeller. This is a very un- decrease, it has to be raised with afavourable value,, as the turbine pressure increase. This heat has to bepower is proportional to the third supplied in addition to the heat forpower of the propeller revolutions, the steam generation (or it has to beThe manoeuvring range goes from 0 bo deducted with a load decrease). The79% RPM and to 50% of the power and amount can be expressed in kg steam
* roughly 50% of the steam (bled points by the term( closed) whereas the full away rangegoes from 73,6% to 100% RPM with the 4.1 AmD =q"mw "T
steam flow going from 43% to 100% N
and the power going from 40% to 100%. withThe response of the steam genera- dh
tion to a deviation of the propeller 4.2 q = r dprevolutions is depending on the abso-lute value of the revolutions.
It would be much easier for thecontrol system and safer for thewhole plant, if the pressure to theturbine - for nozzle controlled tur- p bar 70 155bines the wheel chamber pressure - q kg/kg.bar 0,00345 0,0045were the control point. When under mw kg 18000 15000full away conditions, the control of m'D kg/s 30,6 27,8the steam pressure to the turbine au- A p bar 2 2tomatically restricts the torque to 6=mDr kg 124 kg 135the main gear, as the turbine controlvalve does not react to a change in Lt s 30 30the resistance of the ship due to AD kg/s 4,14 4,5heavy sea for instance. During the AD Doemergency stop manoeuvre, the steam 'P 2 bar 5 5flow to the astern turbine is kept Am kg 310 337,5A0 2 3160 60,steady, which even a good revolution At 2 s 60 60control system cannot achieve, when AmD2 kg/s 5,17 5,62the ships speed is between 65% and AmD2/m0 0Do 0,169 0,20245% of the desiqn speed.But at the
moment, there seams to be no chance,tochange the turbine control system, sothe turbine is still controlled by therevolutions of the propeller n. Table 4.1 shows, that for a twin boi.
At the boiler, the control points ler system with PT = 70 bar respec-are civdy PT = 155 bar, the difference be-
the drum pressure PT tween steam demand mD and the equiva-
the water level h lent fuel supply mDV becames alrea-dy for a normal manoeuvre executed in
the steam temperature t. a normal time At, 13,6% (16,9%) ofthe full power demand. For a stop4.1 Boiler control at manoeuvring from full away to zero in 60 sec thi•
conditions with fixed boiler difference increases to 16,9% (20,2%;pressure The shorter the time, the more the
fuel system has to lead off the steamsystem.

WEG 81-0-10
In Fig. 7 the dark area is proportio- This additional input has to be main-
nal to m which is only proportional tained during the whole time At.Viceto the cRange of the drum pressure PT versa has the same amount of boilerand not to the time. water to be evaporated first, when
the load is increased and the waterDO level will rise by Ah. (From zero load
P0 to full boiler load, the water levelwould change for this boiler system
with fh = 110 mm in each boiler drum!)The proposed feed water system
for the bled steam reheat cycle willLip. have a water level proportional to
-2--(A+ B') the steam flow mD or - as the steamAflow is usually represented by the'Dsteam velocity. w through an orifice -
\"MIA r(t) •by the steam velocity wD.When the water level set point is
*2 -(A.B9_ ) made oroportional to the steam flow i2 T7E w , then the water volume in the boi-
ler stays constant - with all the ad-
Fuel lead vantages for the fuel supply - andAii the feed water control valve operates
-1 in the same direction as the turbine
TE control valve and not in the opposite_A u direction as it does with a fixed wa-
STV ter level set point. By this arrange-ment the feed water control becomes
Fig. 7 Fuel supply and steam demand faster and more stable.,at fixed boiler pressure-t f4.2 Feed water control under full
Equ. 4.1 shows, that for a constant away conditions with floatingdrum pressure fuel supply and steam boiler pressuredemand are equal. This certainly makethe combustion control better. The Generally the movement of the
closing of a burner can be avoidedin water level in the drum is covered by
a lot of cases. the equation, dh
4.1.2 Feed water control . _ ., dvw vU dmD: vm dv0 4.3-dt wWd-t +dt 0 D d t
The water level in the steam The first term comprises the diffe an- tdrum depends - when feed water flow
and steam demand are in euqilibrium - Ceand betweenthe steamfeed water supply mpractically on the steam volumeV D'enclosed within the boiler tubes.Thissteam volume VD is practically propor dmw 4.4tional to the evaporation. 7t SP
Table 4.2 explains that forthe The second term in equ. 4.3 repre-same manoeuvres as in table 4.1 an sents the change of the water volumeadditional feed water input of about due to the change of the specific vo-the design load has to be brought up lume vby the feed water supply system, when wthe water level drops nh at a load dY= Vwo dvy Vw., dvwdp 4.5
decrease and the water level is kept Mw dt _ ___ p d
constant. dt voil fly cp dtTable 4.2 Feedwater fluctuation for When forthe floating pressure range of
twin boiler (PT = 70 bar) 60 = pT = 160 bar the specific volume
h mm - 55 - 88 of the water is approximated by the
Arnw kg 741 1372 linear equation
At s 30 s 60 s vW =[107Z. 3,85P06 mrnkg 4.6
Amsp kg/s 30,5 22,9 PT in bar
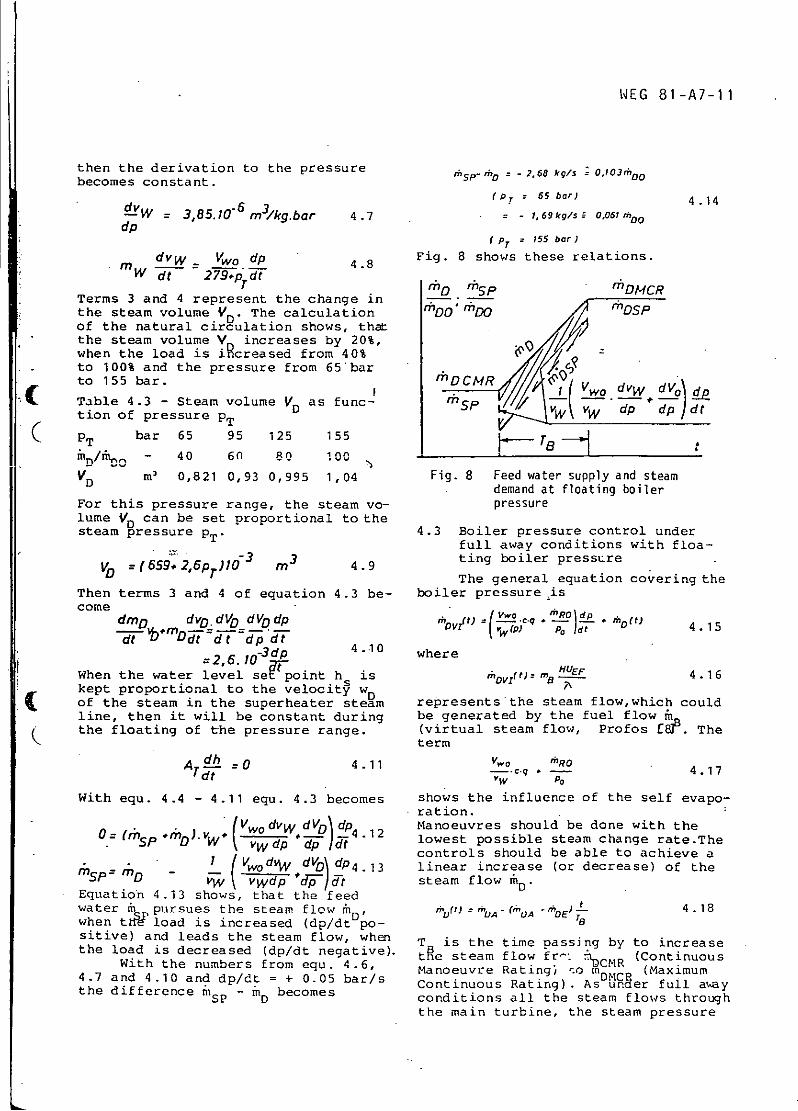
WEG 81-A7-11
then the derivation to the pressure h$p- ro - 2.68 kg/s Z-O.03%DObecomes constant.
(PT 65 bar) 4.14= 3,85.1O 6m 3/kg.bar 4.7 - - 6 69kg/s 0,061'*O
dppPT 55 bar)
" wdvW Vwo dp 4.8 Fig. 8 shows these relations.W 7F 279-T dt riDMCR
Terms 3 and 4 represent the change inthe steam volume VD . The calculation "Do' "0DSp
Dof the natural circulation shows, thathe steam volume V increases by 20%,when the load is iAcreased from 40%to 100% and the pressure from 65 barto 155 bar.
Table 4.3 - Steam volume V D as func- SP ' W dp dption of pressure PT
__
PT bar 65 95 125 155
inn/ih, - 40 60 80 Inn
Vo m3 0,821 0,93 0,995 1,04 Fig. 8 Feed water supply and steamdemand at floating boiler
For this pressure range, the steam vo- pressurelume VD can be set proportional to thesteam pressure PT" 4.3 Boiler pressure control underfull away conditions with floa-
VD§ =(6S926p)O-3 m 49 ting boiler pressLreT 4The general equation covering theThen terms 3 and 4 of equation 4.3 be- boiler pressure iscome Vw0 Rd
dm D dvD.dV0 dVodp .%v/t) =(Pj*p . , dt ( 4.15
=2 , 03 dp 4 ..10 where
When the water level se tpoint h is 4.16kept proportional to the velocit• wD
of the steam in the superheater steam represents the steam flow,which couldline, then it will be constant during be generated by the fuel flow mthe floating of the pressure range. (virtual steam flow, Profos reP. The
term
A dLh = o 4.11 Vwo "4ROT•• -;-.C~q . 4.17
With equ. 4.4 - 4.11 equ. 4.3 becomes shows the influence of the self evapo-ration.
.,( "Vwodvw dVo• dp Manoeuvres should be done with theOz- # mD)vW+\- dp W fN- 4 .12 lowest possible steam change rate.The
W vW dcontrols should be able to achieve aI VwodvW dVt0 dP4 .13 linear increase (or decrease) of the
0SP mo VW\wdp d-p)dt steam flow roD.Equation 4.13 shows, that the feedwater in pursues the steam flow n ,r •"t)r 'VA -&(iVA -7DE) 4.18when tIIV load is increased (dp/dt Dpo-sitive) and leads the steam flow, when T is the time passing by to increasethe load is decreased (dp/dt negative). tie steam flow fr -* .hDCMR (Continuous
With the numbers from equ. 4.6, Manoeuvre Rating; -o mf C (Maximum4.7 and 4.10 and dp/dt = + 0.05 bar/s Continuous Rating). As ur9er full a.aythe difference mSP - in becomes conditions all the steam flows through
the main turbine, the steam pressure

WEG 81-A7-12
before turbine is - according to the Fig. 9 shows the behaviour for a load
law of Stodola [9] - proportional to reduction.the steam flow.
The signal flow diagram of the propo-
sed control system is shown in Fig.10.PVT
('
) o PVTA - (PVTA - PVtE)• 4.19 MB
In the full away area, the boilerpressure PT can be set BR
PT CP.PV 4.20 APrMoP 'C(t)
as the losses are proportional to the WP
steam flow mý, due, to the constantsteam velocity wD
'I V
S0=P )- t4.21
dpP - P•TA "PTE 4.22
d t T•
With equ. 4.22 equ. 4.21 becomes
%Vz (t MA - (i 4A - 'DE)T
4.23
V .09. P01PTA- PTEýw -- ) T
Eau. 4.23 shows, that the fuel flowN A
fa has to lead the steam flow mnD'whentRe load is increased, whereas it fol- MDT
lows mD' when the load is decreased.With T = 1800 s and pT = 65 bar and B
P = l55 bar d /dT is W,05 bar/s andt~e difference Between fuel flow mn
and steam demand m. becomes d
cVI - rod ± +
73 kg/s O.134n'0 0 ; PTr 65borSRV:FEED WATER CONTROL VALVE
.3,03 kg/ •O,1091O0 PT =1 BR :COMBUSTION CONTROL
E :EMERGENCY
mR OR) PTA - PTE Fig. ,0 SIGNAL FLOW DIAGRAM
5. TEST AND SIMULATIONSI, DE A lot of tests on ships as well
'MDVIE as on the model steam plant in Berlin
were run to prove the validity of our
assumptions. In addition to this,com-puter simulations were done with theengine data of one of the steam ships,
with which full scale tests were run.
Fig. 11 shows the simulated loadFig. 9 Fuel supply andsteamdemandat decrease from MCR for the proposed
floating boiler pressure steam plant. One can see that with

WEC 81-A7-13
mhD;mw,"; foVI PK [bar]
0PK 1Fto .. '..--_.. - •/ 2 hw[nmml
1020
-20 550. •• "8.0o.54'0 ""-....."•"... •-• • 132
F.5 .d....e.
-10 -520 1 30
-510 tU • ' '.. ........j
I0 1 2 3 ý4 55 6 7 88 9112 13 14 15 16 1718 [min]
Fig. 11 "Load decrease, Computer calculated
19 min. time for this manoeuvre, no time e.g. 750 §ec. still the drumundue deviations from the normal state pressure followed the set pressure ve-occur. All kinds of manoeuvres up to ry neatly.a turbine trip were calculated this The steam flow was reduced fromway. They all showed that the propo - 80% to 45%, but - on account of thesed control system will handle the rnDsystem safely.
The floating water level and thetime proportional resetting of the p] toosteam drum set pressure were installed [bar]in the control system of the model nT 11 steam flow signal 8steam plant. The results can be seen rib' Din figure 12.
From steady full away at 90 bar drum pressurethe pressure set point p was decrea-sed to 6 bar in t = 1750Ssec. The 180 .. hlittle delay of die real drum pressure tb
P can barely be recognised. The prac-tically constant deviation was pressure set point
PISAP:PTS " PT 7 0,15 bar 40 _l.
With a time constant TM = 570 s for .bar'the model boiler, we had the sane ra- - water level h (floating) 200tio t ,4iT as calculated for the ma-noeuvre 4rom fig. 11, where the time Es] 1500 1000 500 0constant for the real boiler was T=310 s and t = 1080 sec. The load In- Fig. 12 Load decrease, Model steamcrease was done in less than half the plant

WEG 81-A7-14
sinking pressure and the proportional issteam volume increase - the steam ve-locity is reduced only from 80% to "£bsPez: 203,7 g/kWh
60%. This would have been even lessif the superheater temperature control With steam conditions of 170 bar andwould have been activated. But as the 570 0 C it would bewhole test was run without any super- iPEZ=2372 g/kWh
heater temperature control, the tem-perature went below normal with theload decrease and above normal with With 150 bar and 602 0C the fuel con-the load increase. sumption of the bled steam reheat cyc-
The additional steam load of 20% le would beat CMR power shows, that the waterlevel changes proportional to the 236.5 g/kWhsteam mass flow, as longas the pres- mBSPEZsure is constant. The proposed steam cycle has practi-
cally the same efficiency as the6. CONCLUSIONS comparable flue gas reheat cycleswith non attached auxiliaries. (
This paper presents a very simple
steam cycle with a fuel consumption,which is as good as that of a slo%4speed diesel engine. The boiler pres- NOMENCLATUREsure floats from p = 65 bar at mano-euvre conditions to PK = 150 bar at A ; AreaMCR. Excessive wetness at the LP tur- K ; Costsbine exit is avoided by a bled steam p ; Powerheated reheat'r in crossover between T ; Time constantHP-turbine and LP-curbine. Therefore V ; Volumethe boiler is of the normal marine MCR ; Maximum Continuous Ratingdesign, with only one temperature con- CMR ; Continuous Manoeuvre Ratingtrol. To lower the fuel consumption, HUEF ; Lower effective heating valuethe feed pump and the generator are c ; proportional factorsattached to the main gear, when the f ; frequencyplant is in steady steaming conditions. g ; gravity constantin addition to this the evaporator is h ; height, enthalpycooled by the main condensate. m ; mass
An integrated control system for m ; mass flowthe whole plant is presented. At mane- p ; pressureeuvres turbine, boiler pressure and q ; evaporation numberfeed water supply are directly control- r ; evaporation heatled from the bridge. The control point t ; temperature, timefor the boiler pressure is the drum u ; natural circulation numberpressure PT- The water level set point v ; specific volumeis proportional to the steam velocity w ; velocityin the superheater line. When the boi- I ; spec. gravityler is operated with a fixed pressure, A ; difference I A= hUE - hspthe water level is practically propor- INDICEStional to the steam load. With a floa-ting boiler pressure the water levdl A ; begin of a manoeuvreset point is practically constant. B ; fuel
Numerous tests were run on trial D ; steamtrips, at dock trials and at the steam E ; end of a monoeuvre, electricmodel plant of the Institut fUr F ; condensate, state at boilerSchiffstechnik in Berlin, backed up outletby computer simulation both for the 0 ; desiqn pointfixed boiler pressure and the floating R ; pipe,reducedboiler pressure. All tests proved the T ; state at boiler drumfeasibility of the control system for W ; waterthe proposed steam cycle. Z ; circulation
The fuel consumption of this cycle AG ; exhaust gas

WEG 81-A7-15
UE superheater (14) Illies, K., iberlegungen zur An-EA deaerator wendung der ZwischentberhitzungZE reheat in Schiffsdampfantriebsanlagen.SpI feed water Schiff und Hafen 19 (1967)VI virtual (15) Wiese, G., Fernsteuerung, Auto-SPEZ ; specific mation, Zwischendberhitzungi ; isenthropic, general index STG-FachausschuB Schiffsmaschi-k ; boiler nenwesen, 1972m ; mean value (16) General Electric's proposal forr ; real value super powers. Marine Engineers set point, desired and Naval Architect. Nov. 1971(t) time (17) Casey, I.P., Steam Propulsionv ;destillat Economically viable for Powersw water as low as Rower SUP. New York
Section, Naval Architects andMarine Engineers, Sept. 1973
(18) Spears, H.K., Steam PropulsionREFERENCES for modern Ships, Steam Propul-sion confrence, London 18./19.1.
(1) Hodgkin, A.F., Marine boilers 1978for very advanced purposes, (19) Ritterhoft I.Steam propulsion conference Einflue dynamischer Gesichts-London 18./19.1.1978 punkte auf den Schiffskesselent-
(2) Walker, H.O., Computer Controlled wurf, Schiff und Hafen 24 (1972)Optimisation of Marine SteamPlant - IV. Simposio Internatio-nale Sull' Automatione NavaleGenova, Nov. 1974
(3) Kimura;' H., Yamane, K., MarineReheat Plant Development and ItsFuture, IMAS London, April 1976
(4) Larsen, G.A., VAP Turbine PlantSteam Propulsion Conference,17./18.1.1978 London
(5) Wiggins, D.S., Rotary Regenera-tion Air Preheaters for MarineBoilers, International Marineand Shipping Conference, IMASLondon, April 1976
(6) Rein, H., Trans I.Mar. E., 1977Vol. 89, A case study of theeffect of reduced ship speed
(7) Grofmann, G., Condition Monito-ring System for Steam TurbineShips - ICMES 1977, Paris
(8) Profos, P., Die Regelung vonDampfanlagen, Springer-VerlagBerlin-Gbttingen 1962
(9) Stodola, A., Dampf- und Gastur-binen, 5. Auflage, Berlin 1924
(10) Lierse, G., Beitrag zur Berech-nung des natirlichen Wasserum-laufs in Schiffsdampferzeugern.Dissertation TU Hannover 1972
(i1) Kirschstein, P., Esso NorwayDiscussion contribution STG 1969at Schiffbautechnische Gesell-schaft Hamburg 1969
(12) Hara, T., e.a., First KawasakiReheat Plant on S/T Golar Patri-cia. Japan Shipbuilding and Ma-rine Engineering. Vol.6 No.1,1971

WEG 81-App.1
- - i;.ijs , -fu flue gas reltoa t I utu pileDiscussion on paper A.7 ha,, a,-] ht the big reheat stvam
"- •"- - - I ivi s ;,r- no I ,n' er necessary.
Bled steanm reheat,Attached The bled leain reheater also avoids
S..the distribution problem we have,
when a twin boiler system is fitted
auxiaies K.-G.Grossmann to a siriCle turbine.As far as safety is concerned I
Dieter Ulken welcume very much any design which
land based po reduces the ,,nount of controls to a
minimum and at the same time takesstations are well known for the appli-
cation of a floating boiler pressure fact is very ip tatias rgdssysem n dilyserice Obiouly fact is very important as regards our
system in daily service. Obviously crw.Bidnahghpesethere is no need to doubt the advan- crews. Building a high pressuretages. For this reason now and then system and living with it aboard1- this feature reappears in marine ship are two different things. For
thisfeatre rappars n mainethis reason simplicity in connection
engineering without any sign of ever th simplicit i conecwith steamning periods zat a lower
coming afloat.Now Dr. Groglmann has offered a pressure level is most welcome.No r rVan a fee There are two more questions I
complete marine steam plant based onI
this idea which in its overall philo- have:phiso- Is the safety margin big enough to
tsophy for the first time seems toto
have come to maturity. It takes into tart the dieel gneror an tthrow the power on from the shaft
full account the different modes in driven generator, when a crash stop
which a ship is sailed. Is is ordered or when a turbine tripIn his effort to maintain a maX1- happens?
mum of safety and simplicity in spite Would Dr. Grofmalnn also explain theof higher pressures and a reheat tur- behaviour of the water level and thebine Dr. Grofmann has included many feed pump when the plant is under
ideas which are based on fundamental floating pressure conditions or when
experiences gained by the ship-owners a
Not only during slow steaming periods
but also at full power they feel that power?
after some time the efficiency of the
steam dependent auxiliaries is beyond .Iashipyard values. I agree with Dr. K. Thai
Gro3mann that attached. auxiliariescould improve this situation if there Mr. Grossmann's paper iswas not the question of reliability. evidently in conformity with the main
It is a matter of proper design and theme of this Symposium ISME '78
construction to achieve good reliabi- "Advanced Marine Propulsion Systems
lities and even now we would be glad for 1980's". I, as chairman of
Executive Committee of the Symposium,to find better values in some compo- wihtpamysneerpctoMr
nents. The boiler is one of these wish to pay my sincere respect to Mr.
components in particular and I con- Grossmann for his presentation of
Less I would rather prefer a normal such excellent paper.
boiler to a reheat-boiler if I could I would like to hear the
get about the same fuel consumption. author's opinion to the following
Could Dr. Grofmann elaborate, comments:
why the flue gas system has with a (1) w-hen the floating boiler
more or less normal boiler design pressure system is adopted and the
the pressure limit of 130 bar where safet prts of the
as the bled steam reheat system can definitely increased as stated in
go up to 150 bar? 2.2. Fears, however, are entertainedI also think it much safer, that
for failures of the boiler evaporator
the low pressure turbine does not tube due to insufficient water
have the rather drastic tem~perature circulation. Besides, are there no
* Hapag-Lloyd AG, Hamburg,
Fed.Rep.Gerinafy Nippon Kaiji Kyokai, Tbkyo, Japan

WEG 81-App.2
uneasiness for separation of water in j'• I.h a w;.t(cr 1eve' on]y. The 0risý'z:-evaporated steam? er vwnulc like to show that sore orci-
(2) Flue gas reheat system has a nury systems ivith fixed net pointproblem for corrosion of reheat tube have a function of the authors' pro-or of damper in case of astern or posed system.unuse of reheater. Steam reheat ?.Vo-t of the feed water controlsystem solves such problem. In the systems for marine main boilers arepaper, bled steam is used for reheat. enuinned with t,'wo elements controlWhy live steam direct from the boiler device shown in Fig.l or three ele-was not adopted? ments so called. If the control(3) In the high steaT condition action of controller shovm in Fig.lbeyond 65 - 150 kg/cm-, 530 0C, boiler is proportional only, the transferwater treatment problems would be function of water level L(p) to theencountered which would requirespecially trained engineer on boardship. 170 bar, 570 0C or 150 bar602 0C as stated in 6 Conclusion alsowill require special materials. GsCould the author state his opinionon this matter?(4) In ships classed with Nippgn a2p 4 1•4Kaiji Kyokai, some failures haveever been experienced to the clutch 1 d. Lfor main turbine driven feed pumpand electric generator. What type of K](l + lAp) 1/pthe clutch has the author in mtnd forhis design?(5) A turbine manufacturer in Japan controller Ge process %has ever carried out a trial designfor 80,000 DWT Oil Tanker installedwith a reheat turbine and shown that L water level in steam drumcalculating engine room space, fuel Ld; set point of water levelrate, ctew cost, maintenance cost Qv; fer:d water flowetc. including 10 years service, the Qs; steam flowsteam turbine is not always inferior Gs; disturbance functionto the diesel engine. In view of Ki; loon gainsuch economical point, what is the T1 ; integral time of controllerauthor's opinion? K 2 ; compensating gain to Q5
P;TLE, ,12;T2/TL, &, ;Tj/Tý, 2k;Ti/TL
T. Morishita** s;Laplace transform operatorS .s TOL; intrgral time of water level
T2 ,T3 ; time constants of disturbance
ThiF discussion is concerned functionwith the authors' urorosed feedwater control system and the amhiigu- Fig.l An ordinary feed water cont-ous description in 4.1.2. tel system with feedback
Some extracts from the lnst censors of water level andnara.ranh in 4.2.2 are '(,hen the steam flowwater level set roint is made nro-nortional to the steam flow ------and the feed water cotrcl valve ore- steam flow disturbance is given byrates in the same direction as theturbine control valve and not in L(p)/QA(p) Cp(pp+l)/,p+l)(gp+l)onrosite direction as it does w'.ith a (1)fixed water level set noinL ". 'the where,unoeriinec phrase is correct for thefeed water control system fed-back 1 2(}2+Y)/K2-1)
Tokyo University of Mercantile 0z: (K2 - 1 )/KI (2)
Marine, Japan E 1/K I .

WEG 81-App.3
T; t/T. ,t; ti e steam flow increased
K decreased simulationK2<I, O(P< 0 " I_0•,.
K 2>1, c<p>0 +
(a) K 2=0.53
.,. iS. r, - _
I ,-- --
Pig.2 A step response L(t, of feed * -.- , , ....water control system with .. _.- ,proportional control action-controller (b) K2zI.06 _
The water level off-set dp to a -?
step change of steam flow shown inFig.2 is given by Eq.(2) and proper- : i'
tional to the changed amount of steam .- -_flow in the case of 4p>l depending on ,linear calculations. Some experiment-al and simulation results of thestep response shown in Fig.3 shows . . , .that the feed water control valve (t.j.,-.,,-onerates in the same direction as the (c) K2=1.6throttle valve in some casesT' Aferall we can give a function of the Fig.3 Step response tests of feedauthors' proposed system to the ordi- water control system withnary control systems with the fixed proportional control action-set point of water level if Kjand K2 controller and compensatingare adjusted. gain K 2 to steam flow dis~tu-
If the controller is set with a rbance Q$. TL;800 (s), T2;proportional plus integral control 27 (s), T3 ;87 (s), TI;Oaction, it makes the control valve a ;equivalent amount of steamfalso operate in the same transient flow step disturbance 100 %direction as the throttle valve oncertain condition but the off-set ofwater level approach to zero.:
Generally speaking, the constantwater level keening is a more symplecontrol system than one shown inFir-.10 that is fed-back with theturbo-speed deviation AN, and alsoassures the boiler of its safty.agCainst the short water and theevaporated steam with water drops,because the water level .:hould be de-sigvned to satisfy these recuirements.
', •orishita, Tto,"A step-response Testnn. Wate.r Tubc -Poiler Peed-back
Control Systems". Journal of theMarine Enginceing Society in Japan,1972,Vol.7, ;o.l,U27/41

WEG 81-App.4
AIt hor's RepliesF. 0:.,tk:ck
Dr. Orbeck co:Gratulated the author on Considering first Mr. Ulken's
a most interesting paper but felt that the request to clarify the reason, why
latest information had not been used in the theq bled steam reheat cycle allows a
reference to the slow speed diesel ernine in higher boiler pressure than the flue
Section 3.8. For the Doxford 76J4 engine, gas reheat cycle. Figure 13 showswhich is rated at 12000 bhp and 123 rpm the data of Table 1 in a drawing,(M.C.R.), the following figures are typical where the area of the waterwalls is
when the engines are tested on unpurified kept proportional to the heat of
homogenised fuel of a mean calorific value vaporization r and the heating areas
of 9700 kcal/Kg. for the superheater, the economiser
Load 100% and the reheater are designed pro-
Consumption g/kwhr 207 portional to their respective heat
Correction for lub. oil into the enclosive of the waterwalls.
0.8 g/kwhr 4 (Assuming that the temperature distri-
211 bution in the boiler will not differ
very much from the flue gas tempera-
Correction for higher propeller revo- tures of the "Esso Malaysia" or the
lutions and generator loadNorway".) The drawing shows,
211 x 239.9/219z230 g/kwhr that for 130 bar boiler pressure, thewaterwall area will become too small,
It has here been assumed that an engine to house the superheater, the reheater
developing 251H.4 at 103 r.p.m. would have the and the economiser, when as it is
same specific fuel consumption and pro- sufficient for the superheater and the
portionally the same electrical load as the economiser only at 150 bar boiler
76J4 engines. pressure for a "normal" boiler.
2 % losses at separation should not be p uith all attached auxiliaries
added as the engine was tested on unpurified at the main gear, a turbine trip is II;fuel. the most dangerous situation. Studies
A reasonable over all fuel consumption of Stal-Laval [201 and trial trip li
for the slow speed diesel engine would records have shown, that after a
therefore be 230 g/kwhr. turbine trip the propeller RPM will
go down less than 4%/sec. This meansthat the diesel generator has to be
D. Tawse * started and run up to speed and takeover the electric load within 3 sec,
A two pressure level plant operation was if the frequency should not decrease
discussed: one for maneuvering and one for more than 12% (I think, this can be 1;
full power. done)if this is the case, then there
On tankers operating at slow steaming is no need to disengage the generator
with reduced pressures, it is normal to reduce mechanically from the gear, so we
capacity to maintain the same percentage would avoid the trouble of not disen-
steam by volume in the boiler tubes. The gaging or exploding clutches. Cer-
increase in percent steam by volume is due to tainly the automatic controls for the
increased mean specific volumes of the steam- diesel generator must be designed
water, mixture which increases friction losses carefully.
in the generating tubes. The attached feed pump will be
Have you considered this for the ma- "disconnected" on the discharge side
neuvering capacity of the boiler? of the feedwater from the feedwatersystem by a valve. The pump will runidle with a flow circulating via the
free flow valve to the deaerator. The
stand by steam driven feed pump will
pick up the load, which is in anycase rather small because the main
consumer - the main turbine - is
* Doxford Engines Ltd., Sunderland, tripped.
U.K. with this I hope I have ans,:eredalso Mr. Imai's 4th rnuoe:•tjon-
•• Combustion Engineering, Inc.,Conn., U.S.A.

7-rWEG 81-App.5
5.1 r Mn B .C 3.5
Pk 100 eta Pk 730 CIO - "o;I r 513 0C t 530 0C
• t . 530 -C
ECO7 0'
- N7
- rNCoJ 7-....
r . 1306 kJ/kg r . 1115 kJ/kg r ,979 kJ/k .Comparison of AK 378 in2 AK x 323 mn2 A K a 283m 2
3 different boilers dhU:. >.662 kJlkg dhuE= 753 kJ/kg dhuE 784 kJ/kg
P10.4 Au 480 in2 AUC= 530 mn2 Ave 5.52 m2FIG. "13 ,4E 2,uE = 3UESS2 ..dhzE,. 415 kJ/kg dhz -. 433 kJ/kg dhECOs3d9 kJ/kg -
ZE : Reheater AZE * 897 m,2 AZE 930 mn2 AECo0 269 me2
SUE :Secondwry superheater dhEcox 203 kJIkg dhEco; 312 kJ/kgPUE:Prima-y superheater AEa = 1468 mn2 AEco 1 228 m 2
The question regarding the water this disturbs the fuel control Ilevel behaviour during a turbine trip system. It also changes the temperai-,i"and during the floating boiler pres- ture state of the boiler. We have ,.wsure state is asked also by Mr. tried to avoid these difficulties bMorishata, so I will try to give one adjusting the water level set point -ranswer to both questions. proportional to the steam velocity-,
The water level will move during signal
a turbine trip, proportional to the So during the floating boiler .
load, at which time the boiler pres- pressure conditions, the water level• rsure can be considered constant for will stay more or less constant, a .several minutes. This means, when the steam velocity-due to the in-the boiler load changes from 80% creasing mass flow but decreasing(MCR) to 10% at 150 bar, the water specific volume-does change onlylevel will drop about 90 mm . This slightly. With constant boilerrepresents roughly im3 of water or pressure, when the specific volume iS2 -about 670 kg. Even if the fuel pump constant also, the water level willwould stay at NCR-load, which is about change proportional to the steam masS27.8 kg/s, it would take about 27 flow. (This is already partiallysec to fill the boiler up with water realised in the boiler feedwater con-:*to the normal mean water level. These trol of Kockums).670 kg are nearly 3.5% of the whole After a turbine trip, when the,water volume of the boiler. It is boiler pressure gradually comes downabsolutely impossible, to keep the to manoeuvring pressure, the waterwater level constant at a load level will rise again due to thedecrease without an increase of the increasing volume of the steam :feed water flow. But any difference bubbles in the evaporation tubes.between feed water flow and steam This might take more than 15 min - due-,
demand changes the heat transfer at to the time constant T, which is for
the heating areas of the boiler and marine boilers of this size between
Thel'A

VNEC 81-App. 6 4
3,0 s .,1l -:00s. 1231, I'l1 . 1221 I.,.',I1,/. to' prov)d " ' I
,,l,ct an incrcitsu of ,,Lo:ts 30 mun , coo) 1:'" wtr to the .,.Imbrdil wl. 15
but this should not influunce the For the boiler with 155 bar mnax•ji, Ba
fe.ed piump control system, because the drUn-I-rcssure we calculated we=0.7..
steam d(elaond stays constant as long m/s at 80% (MCR) boiler load. This
as the main turbine is not started value would go to we=0.80 m/s at 65
again. In our opinion, the floating bar boiler pressure and 32% (CIR)
water level set point is a better boiler load, which means it stays
solution than the constant water level, practically constant. With fixed V
The proposed feed water control boiler pressure it would go wo=0.76
system is at least as simple as the m/s to wo=0.56 m/s at 155 bar or
old 3 point system, from which it from wo=0.8 4 m/s to 0.62m/s at 125
retains the water level and the steam bar drum pressure. The natural
velocity. As the third signal we circulation is better with the floatingintroduce the feed forward signal boiler pressure. [231from the bridge. This is in accor- Regarding steam temperatures and
dance with the philosophy, that one pressures, we stayed with our proposal
single, overall control system for within the limits of the normallythe whole steam plant is safer, faster, used heat resistanft steels. Themore reliable and gives better per- consumption figures in section 6 wereformance than three individual apd only calculated with the steam con-more or less independent control ditions, proposed by two major turbinesystems, as we now have it. (Practi- manufacturers, to provide a comparison.
cally we have in effect four control Our Institute is of the opinion thatsystems: turbine, feed water, boiler we should not go to austenitic steelpressure and steam temperature., to lower the fuel consumption by a fewIf we can get the fuel oil control g/kwh. We think, that this involves
more stable, we will also have fewer risks that are higher than those offluctuations in the steam temperature. using attached auxiliaries.This becomes more important in these I am now coming to the economictimes, when everybody considers going side of the system (i.e. the fuelnearer to the temperature limits.) consumption). Along with Mr. Imai, I
As Mr. Morishita's and Mr. believe that the bled steam reheatUlken's question have been answered plant can compete very well with thenow, I would like to turn to Mr. diesel plant. It is a very simpleImai's 2nd question. We chose bled system, which means the installationsteam reheat instead of live steam costs are not very high. (At leastreheat for five reasons: (1) It lower than the costs of a flue gasgives us just enough reheat at the reheat plant.) With a fuel consump-turbine crossover, to keep the humi- tion of 234,7 glkwh. (There .s adity at the last turbine stages above typographical mistake in the si-valuesafe limits. 2) The power distribu- on page 29, which I beg the reader totion to the HP-turbine and the LP- excuse. The metric figures areturbine is kept within the 60%/40% correct.) it will need the samelimit, so no IP-turbine is needed (or amount of fuel per mile on a tankera bigger LP-gear!) 3) It is slightly- as the equivalent diesel plant withbut only very slightly-more efficient out an exhaust gas boiler. Most of
than live steam reheat. 4) It avoids the things that we suggested for ourhigh pressure pipes and 5). it in- plant have been used some where elsecreases the steam flow through the already. We can further decrease the
first stages of the HP-turbine, which fuel consumption by lowering thehelps the design of those blades. vacuum to 0.04 bar, which wouldI certainly agree with Mr. Imai's decrease the fuel consumption - notstatement on his third question, that only of our plant but of all proposedthe feed water treatment must be of new steam plants - by another 2.4the highest quality, similar to that g/kwh, with the humidity still withinof the nuclear ships. But this would limits.be good also for our boiler systems With a well designed plant, whichas they are today and-may be- would is simple and reliable, and with aavoid some of the troubles we have good control system, I think steamnow. In our opinion, the circulation micht become competitive again,
oclci tv w o must be kent as h as esijecially ifafurther d.terioretion

Li''
WEG 81-App.7Ii
of the quality of the residual fuel To answer Mr. Tawse's questions:is taken into account. The increase in specific steam volume is .tMany thanks to Mr. Ulken, Mr. combined with a decrease of the steam flow and "Itiai and Mr. Morishita for their accordingly steam generation. This means,
questions, they gave me the opportunity that the absolute steam volume in the boiler '
to explain some points more clearly, stays practically constant. As the frictionlosses are therefore also constant, we have
the same circulation velocities at high loadand at low load, when the boiler pressure is
[20] Gumar Ross, Modern turbine proportional to the boiler load in the "fullmachinery, Stal-Laval marine away" range.
Turbine Symposium, New York, COct. 1975.
[21) Kurt Dohmel, Untersuchung einerintegrierten Schifrsdampf- Alanlagensteuerung, Design ThesisT.U. Berlin, 1976.
[22] Kurt Dohmel, Konzept der jReglerstruktur eines Schiffsr Ptdampferzeugers fur Gleitdr.ack-betrieb, Diplom Thesis, T.U.Berlin, 1977.
[23] Hoa Xuan, Untersuchungen uberden Wasserumlauf bei Schif'fs-kesseln, Design Thesis, T.U.Berlin, 1978. it,
To answer Mr. Orbeck's objections, I '4would like to say, that I know of NO owner,who runs its diesel engine without separator , 4
use. If these units could be omitted forthe diesel engine, this would be a majorplant improvement.
The second point is that the steamplant does not have to match the fuel con-sumption of the diesel engine to be compati-tive. In the old days it was compatitivefor the big ships with a specific fuel con-sumption 55g/kwh higher than that of thediesel engine. Now with fuel prices 3 times •as high as before the oil crisis, if we couldcut the difference in fuel consumption down .,• "
to 3ON=17.5g/Iwh with a rather simple cycle,then the steam plant will be compatitive
again. Any steam cycle with a fuel con-sumption below 247-250g/kwh (if we includethe separation losses) will leave an ad-ditional edge over the diesel ergine withoutan exhaust gas boiler.
With an exhaust gas boiler the c&-.Para-ble figure would be 243-24 6g/'1h.n.

0
0
0

FR..Fifth WEGEMT t!Graduate SchoolAdvanced Ship Power Plant!IIDesign and Operation
tI'
Iii
I •,
Paper A8
EXPERIENCES WITH STEAM PLANTS ON SHIPS
by
H.H. Vdlker, Ing. Grad, VDI, M.I.Mar.E
1. " Introduction2. Choice of Plant3. Change in Operating Procedures and
Plant Modification4. Operational Experience4.1. Boiler Plant4.2. Main Turbine and Gears5. Conclusion
*1I

Paper A 8
I. Introduction.
Escalating fuel oil costs and the wage structure within the
developed industrial countries demand from the management
of every shipping company a critical examination of present
day and future development in ship and plant design. The most
important factors when designing and specifying a new vessel
is the choice of the propulsion, plant.
Many new aspects will be highlighted and discussed -during
the forthcoming 3 weeks here in Berlin and Trieste and we
hope that our experience of the past and present in operating .
turbine installations may provide some valuable guidelines
for future design. It is the intention of this paper to illus- ,
trate how efforts have been made to benefit from experience .
by applying some critical analyses of existing installations
and seeking remedies to their shortcomings. The paper is not
dealing with the question of steam versus diesel plants, it
is our beliefe that the steam turbine cannot be buried yet,
it will again play its part when designing future vessels
for special trades.
Our company is operating turbine as well as motor vessels
and I would like to speak only about our operational experience.,,
with turbine vessels of the size of 200.000 to 320.000 tdw
with 36.000 HP having a simple cycle as can be seen from fol- "!)
lowing heat balance.
2
!:a .fl
•~-j•
: e|
-! •'"I i " - " i'
EEZJ _____ -2

Paper A 8
2. Choice of Plant
The vessels in question were ordered before the 73 energy
crisis in an environment of high freight rates and low fuelcosts (200 WS and 30 $/ton respectively). These factors, influen-
cing the economics of design, speed and plant efficiency-haveresulted in a choice of plant that ensures a high degree of
reliability by deliberately allowing for a low plant efficiency
that can be obtained by a simple cycle in comparison to moresophisticated approaches. Inithose days the advantage of say,
a modern reheat cycle efficiency could be completely lostif the ship incurred off-hire of more than one day pro year,
without taking into account the additional capital elementfor the more sophisticated plant which in itself did not justify
the application of such cycles on economic grounds. Other
reasons to opt for the simple cycle were:
- reduced maintenance efforts
- less severe demands on manning
- less sensitive to off optimum operation and human fall-
ability
The prediction of the reliability of the simple cycle plantcould be confirmed by the actual performance of the vessels.
* Within the present life of 7 years per ship the out-of-service
time due to plant unavailability has averaged 0.4 days per
year only.
* However, the slump in freight rates down to WS 28 owing tothe tonnage surplus of VLCC's as an outcome of the 73 crisis
and the following increases in bunker prices to 230 $/ton
changed the afore mentioned picture completely. Today the
advantage of the better cycle efficiency of a reheat plant
would be lost after nearly two months off-hire per year which
certainly every shipowner would be prepared to tolerate.
-3-

Paper A 8
3
Also whereas in the past VLCC's were designed and operated
at their design speed the decline in the tankermarket has .4'
led to a considerable flexibility demand on operating speeds
resulting in power requirements of as low as 8% of the initiala.
power installed. Clearly, operation at such loads was considered r
to occur only while manoeuvring, therefore priority was given
to reliability rather than efficiency. Substantial design
margins of control valves and relatively simple control arrange-
ments were preferred to obtain a high degree of availability .
while operating at such part -loads. The only feature included .
to at least partially maintain efficiency was a manually con-
trolled nozzle grouping of 16, 11, and 3 nozzles allowing
for power variations of 100%, 90%, 63% and 53% without throttling.t
3. Changeý in operating procedures and plant modifications
The part load efficieny expressed in specific fuel consumption
versus power of the plant in question is shown in fig. 2.
FIGURE 2
SPECIFIC FUEL CONSUMPTIONAS A FUNCTION OF SHAFT ........
POWER (
CD
" 400
0'
* .. 4. 5
zZ 300 "-! "
Ld2
uJ
LiL
2000 20 30 -
SHAFT POWER IO' SHP '4

Paper A 8
4 i
The power range covered by the nozzle grouping indicates a
reasonable efficiency behaviour considering that the electrical
load of the turbogenerator is not included in the specific
fuel consumption. At power below 19000 SHP, however a substantial
deterioration in efficiency can be observed. It is in this
area where at the time and for the foreseeable future the
majority of VLCC's will be operated. Therefore, DSTG studied
in cooperation with Bremer Vulkan and TU Berlin ways-to at
least partly restore the cycle efficiency. First indications
of theoretical investigations indicated a potential of improve-
ment of up to 18% by changes in operating procedures and minor
modifications.
As mentioned earlier considerable design margins for control
valves were incorporated to ensure maximum availability while
,manoeuvring. Todays sea passage power requirements are within
the manoeuvring range which led to the conclusion that a reduc-
*tion of such margins without endangering the plant could result
in fuel.Zsavings. The theoretical studies revealed that a decrease
in throttling losses across control valves of the steam driven
F.D. fan, the feed control valve and the manoeuvring valve
would yield fuel savings of 1% to 5%1 depending on the shaft
power developed. Decreasing the power demand of the steam
driven auxiliaries by reducing throttling losses of the apper-
( t tamning control valves could also avoid damping of excess
process steam which obviously impairs the cycle efficiency
at shaft power where the regenerative feed heating could not
cope with the available process steam.
The effect of reducin g throttling losses on plant efficiency I
is demonstrated by
-Reducing the revolutions of the F.D. fan to decrease
the throttling losses across the control vanes
-5-

K ~Paper A 8 7
-- FIGURE 3
CHARCTEISTIC OF THE FED. FANAS A FUNCTION OF.SHAFT POWEIR .
Q0 0
,0 o
r t0
0. t
-7
Reucn te ichrepresre f l
CHRAT ISHACF THESH
Z.0.detas hetrotin ose crs tefedcotovalve
* 0
I'DSHF POE I H
* U, 6

Paper A 8
-6-
By observing the nozzle group pressure behaviour of both turbine
driven auxiliaries it can be seen that the steam demand could
be reduced by up to 30%, dumping of steam in the I/P range
could be avoided. Also, the I/P system pressure could be kept
lower which in turn increases the adiabatic heat drop across
these auxiliary turbines and; therefore assist in lowering
the steam demand. The I/P System pressure effects the deaerator
outlet temperature. The decrease of the deaerator pressure
reduces the inlet temperature of feed water to the economizer
and thereby the exhaust gas temperature of the main boiler
resulting in a boiler efficiency improvement of up to 0.6%(calculated).
The saving as a result of above measures versus Shaft power
are plotted in fig. 5.
FIGýE 5
IMPROVEMENT OF SFC AS AFUNCTION OF SHAFT POWERAT REDUCED FDFAN REVOLUTIONSREDUCED FEED PUMP OUTLETPRESSURE & REDJCED DEAERATOF
PRESSURE.
1..
SMAfl POWER Ito-SP
For power requirements which are not covered by the nozzle
grouping a reduction. in boiler pressure yields further fuel
savings because of the possibility to further lowering the
Steam demand of the feed pump and reducing the throttling
losses across the manoeuvring valves. A lower limit of 40.5
Bar was maintained to ensure a sufficient pressure drop across
the control valves of the turbo generator to cope with sudden
load changes. The combined effect of the change in operating
procedures on specific fuel consumption are shown in fig. 6.
-7 - K

PaperA8
FIGURE 6 - -
SPECIFIC FUEL CONSUMPTIONAS A FUNCTION OF SHAFTPOWER AT OPTIMUM TUNED
PLANT
z
,o II I i,,
'0400
SHAFT POWER 103 SHP P
-. 2
To improve the plant efficiency further an electric driven.
FD fan for power duties•of up to 19000 SHP was installed,
as well as a pass-in system for excess turbogenerator exhaust
steam into the crossover. The r~esulting savings can be seen
on the 'following graphs. tI FIGURE 7
IMPROVEMENT OF SFC AS AFUNCTION OF SHAFT POWERFOLLOWING IMODIFICATIONS TO • 4
THE STEAM CYCLE,
•4, t,
-a IjN1 N
0'0 20
SHAFT POWER '0SHP
-8-4 Wi,"

Paper A 8
8
Consideration was also given to more drastically modify exiting
steam plant. The replacement of the steam cycle by a diesel,
installing shaft generators, converting to a reheat cycleor fitting a feed pump of higher efficiency have been analysed.Within the remaining life time of the vessels and the forecastof future tonnage values and bunker prices no economic casecould be made. A change to a larger diameter propeller includingpermanent derating of the plant to 25.000 HP is considered
to be marginally economical.
4. Operational Experience
In the foregoing emphasis has been placed on how to improveefficiency of existing plants. What have we'learnt so far
in the way of reliability, controllability and repair costsconsidering also the steady deteriation of fuel quality.
4.1 Boiler Plant
The boiler concept adopted on the VLCC's is a father-son arrange-
ment. The concept was chosen because of
1) Optimal controllability
2) Greater reliability
3) Availability of stand-by boiler
Three problemzareas still exist in boiler design and application:
I) Superheater
Damage to superheater supports and uncooled beams are
problems of the past. The primary cause of superheater
tube failure (Material: I Cr-0,5 Mo or 2.25 Cr-1 Mo) is
high temperature corrosion. This fire side corrosion firstly
detected and measured on several "L" Class boiler results
from the breakdown of the protective oxide layer formed
on the surface of the superheater tubes by chemical reactionswith oil ash deposites. The most aggressive constituents
of the deposites are sodium sulphate, vanadium pentoxide
-9-
Paper A 8 7?
and various sodium vanodates. Improved refinery techniques
are increasing the impurity levels of the fuel oils and
hence aggravating the situation on the vessels.
Measurements of several boilers within the Shell fleet
show that their superheater tube creep rupture life has
been reduced to only 10 years, i.e. have to be replaced .
within 4 years. .. :..... .
What methods are available to reduce fire side corrosion:
a) Periodic cleaning of the superheater surfaces.
The build up of ash deposites on superheater .
elements not only provides an environment leading '
to corrosion, but also interferes with the flow 4
of combustion gases around the heat exchange
surface and decreases the heat transfer. It .. i >
is therefore imperative that .the superheater
surface is regularly cleaned by sootblowing 4.,
while the boiler is in operation and HP water
washing whenever is required. it
b) Additives can control corrosion, but to be totally
effective they have to be used at levels in*
excess of fuel contaminants. Apart from the
high expenses, they may introduce other problems. :,
c) One of the most practical methods of controlling ,
corrosion is to limit the amount of excess air.
By reducing the excess air from 7 % to I or
2 % it is possible to restrict the formation
of vanadium pentoxide, the fully oxidised state "'
of vanadium. Low excess air favours the formation .
of the oxides and therefore leads to a reduction
of corrosion problems associated with vanadium. .
i¼o-S I
I

Paper A 8 V101
Low excess air also reduces the level of SO 3. 'IThe major benefit is seen in the economiser
section. Measurements show that corrosion rates
in this section are neglectable so far.
The objections for future installations should
include careful selection of superheater tube
material, more screen tubes and wider spacing
of tubing should be considered. These may lead
to "over design" and increase the initial cost
but considering the quality of fuel oil in the
future, we feel the additional investment is
well spent.
2) BrickworkIn the present generation of boiler brickwork has been
limited. We can only advocate to eliminate brickwork com-
pletely since brickwork requires continuous attention
during drydocking normally at quite considerable costs.
Furthermore brickwork acts as heat storage thereby impairs
the dynacic capacity of the boiler.
3) Combustion Controll Equipment
As described under the superheater section accurate and
reliable control equipment is essential. We have gained
quite good experience with electronic control equipment.
Our three "L' Class vessels operate unattended for 16 I
hours per day with the approval of the classification ii'
societies and even of the Amt fir. Arbeitsschutz.
The combustion control equipment designed for a turn down
ratio of 1:15 is working sluggish under rapid load changes, I
excess air under part load conditions and shutdowns during
crash stop manoeuvers do occur if not adjusted by hand.
Investigations together with the TU Berlin and Siemens
revealed some interesting features:
-11 -
Paper A 8
a) In the past more or less all ship steam plants
also all our turbine driven tankers used for
the combustion control the superheater outlet
pressure to match ingoing and outgoing energy
streams of the boilers. The configuration was
employed because it was thought that down stream
consumer require constant pressure before their
control valves.
During shipborn trials it became apparent that
the latter argument of requiring a constant
pressure.upstream of control valves for steam
consumers is not valid. Auxiliary steam consumers ,.
on board the ships in questiofl require about
40 bar pressure upstream of their control valves.
If higher pressures are offered these will be
throttled down.
The disadvantage of controlling the superheater
outlet pressure is given by the changing drum- ,
pressure for different loads because of the
change in pressure drop across the superheater '
for various steam flows. The drum pressure indi-
cates the potential energy of the water contained 2"<
in the boiler. If this drum pressure is required
to be variable because of the constant superheater -
outlet pressure, the potential energy of the
water mass has to be changed accordingly. The
potential energy can only be changed by a mismatch
between ingoing and outgoing energy stream and
oil and air flow as the ingoing energy stream.
Assuming a load increase in steam flow this
will reduce the superheater outlet pressure
owing to the increase in pressure drop across
the superheater. The combustion control which A I
senses the reduced superheater outlet pressure
demands a higher than necessary ingoing energy
-12- .............................

Paper A 8-12 -
stream to raise the superheater outlet pressure
to its desired value. This, however, can only
be achieved by raising the drum pressure, i.e.
by raising the potential energy to a higher
level than before the increase in steam flow
took place.
P DRUM
P SUPERHEATER
3 Energy equivalent for raising the drum pressure
2Ni
t
131
lii
-13 -

Paper A 8
-13-
the mismatch of energy streams to change the
potential energy has some impact on the super-
heater outlet temperature, the boiler water
level and the economiser outlet temperature.
During steam flow increases an excess amount
of flue gas energy passes the superheater banks,
the normal equilibrium of energy streams of '
the superheater is disturbed, the temperature
raises. The equilibrium of energy streams of
the economiser-is affected in the same way.
More energy than required is available from ,.
the flue gases. The economiser, in particular". ceconomisers which already contribute to the
evaporation, produces steam. This problem in
combination with the conventional water level
control which leads to decreasing feed. flows .I
at increasing steam flows can result in a situa- .
tion where all water contained in the economiser
is completeley evaporated. Therefore, when the
feed control demands a feed flow, the economiser
has to be filled up before feed water reaches
the drum. This has lead to boiler shut downs
due to low boiler water levels...
Controlling the drum pressure will ensure that "
the potential energy of the water mass in the
boiler is kept constant. The oil. and air flow
can be matched to the steam flow thus, problems
encountered with the superheater outlet control
can be completely avoided. Additionally, the
dynamic demand on the turn down is eased by
constant drum pressure control because no over-
shoot of the oil-air flow compared to the steam
flow is required. If the dynamic turndown is
reduced the probability of loss of fires is.,.*. 4
reduced as well. ., .1ý
14*
- 114 - *
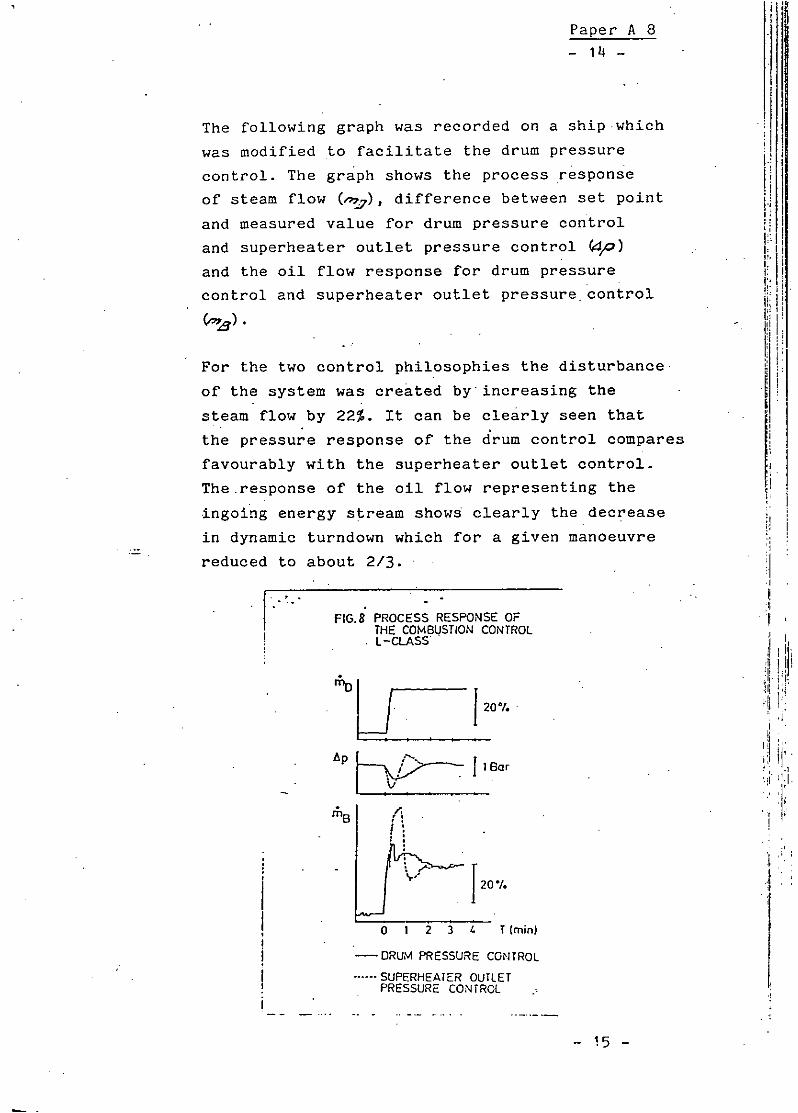
Paper A 8
- 14 -
The following graph was recorded on a ship which
was modified to facilitate the drum pressure
control. The graph shows the process response
of steam flow (I), difference between set point
and measured value for drum pressure control
and superheater outlet pressure control (41)
and the oil flow response for drum pressure
control and superheater outlet pressure control
For the two control philosophies the disturbance
of the system was created by increasing the
steam flow by 22%. It can be clearly seen thatthe pressure response of the drum control compares
favourably with the superheater outlet control.
The.response of the oil flow representing the
ingoing energy stream shows clearly the decrease
in dynamic turndown which for a given manoeuvre
reduced to about 2/3.
FIG.8 PROCESS RESPONSE OFTHE COMSQSTLON CONTROL1-CLASS
jO 20j I'
'I. 1 207I.A I
0 2 T"(min)
-DRUM PRESSURE CONTROLSUPERHEATER OUTLETPRESSURE CONTROL
- 15 -

Paper A 8
-15-
b) All boiler level control systems in the Shell
fleet are based on 2 or 3 element philosophy
as shown below.
The 2-flemeat Control .
•C-d
TA tto'1"
It became apparent that the above control with
some boilers could lead to large variation of
level and to an undesired shut down of the main
boiler in certain circumstances while manoeuvring.
The control of a constant water level by a PI
algorithm in combination with the shrink•and
swell effect can lead to actual water level , 4
excursions exceeding either the low or high
water level safety shut down positions. To mini-
mise the actual water level variation a new
boiler water level control system was studied
involving changes of the set point of the level
control to a proportinal function of steam flow
and oil flow. This enables the water mass in
the boiler to be kept constant or in other words
-16-1 6 •"

Paper A 8
- 16 -
the feed water flow will always be the same
as the steam flow under dynamic conditions.
The physics of boiler water level behaviour
depending on boiler load changes and the differ-
ence between steam and feedflow is described
in several papers of Prof. Grossmann and K.
D6hmel.
The new concept of boiler feed water control
by reference to constant mass instead of level
was introduced on one of our "ILt Class vessel
in 1979.-
It
L-evel
4F
valueP. I
+!
Jll
Tests showed that when the boiler load was changed K
from 44% to 8% and back to 44% the boiler level
variation was 68 mm as compared to 184 mm with
the previous system. This means safe manoeuvrability 1!
in respect of boiler level variation. The additional
hardware required was two proportional amplifiers
and a summation unit. The former are used to
form the variable set points from the available
steam and oil flow signal, the latter to add Ithe set points derived from the two signals.
17-

Paper A8
17.
.10. IU
shrink and swell influence
-100 ý
A feed flow60'
G30 steam flow.
E 20 I
10A"
0 1 2 3 . 5 6$t(muin)
CONSTANT WATER LEVEL C9ONTROL
+100
E _woterle'te( .
- seipuinr
-100
70 I
60
30
E~ 20
t (min)I1
FLOATIN\G WATER LE'/ELCONT2OL

Paper AS8
- 18 -
Both modifications to the combustion control
equipment described above should be part
of future design.
Furthermore, air distribution tests under
full and part load, conditions in wind boxes
and register as well as the right combination
of fuel atomizer, diffuser and burner throats
should be given careful consideration.
Within- the Shell Fleet in particular the
burner management has given serious cause
of concern. Due to a single component failure( boilers were incapacitated for up to 36
hours~which were required to identify the
fault. Such vital systems should at least
be duplicated and having cross checkingfacilities. Also such equipment should
contain visual aids like mimic diagrams
to assist operators in speeding up fault
finding outside the :"electronics"?.
Electronic control equipment of' the next
generation should include fault finding
routines as well as self optimising features
( which we believe can be readily obtained
by the application of micro computers.
4.2 Main Turbines and Gears
Main turbine problems are rarely. heard of. We in our fleet
cannot report a single major failure. Problems of the 60 were I
related to material fatigue at. the blade roots. Some early
indication of arising problems were given by the vibration
sensores fitted. Generally we encountered only one problem.
damage occuring to the turbine internals during the periodical
survey required by the Classification Societies. During the
design stage consideration must be given to internal inspection
of the turbines by endoscops, condition monitoring measures
which replaces the old fashioned inspection by opening up.
- 19 -

Paper A 8
- 19
Turning now to the transmission, in none of the VLCC's have
been any problems with final reduction gears. Failures of
epicyclic gears have been discussed on several occasion. I
would like to refer to the excellent paper read at the Institute
of Marine Engineers on the 26th Feb. 1980 by Mr. Saunders
Davies, Mr. Richards and Mr. Galvin. Generally the performance
of the gears fitted to our VLCC's is acceptable. A few failures
occured on epicyclic gears due to manufacturing, problems and
materials which were off specification. Of great importanceis that the complete gear case is properly vented through
dehumidifier in order to avoid corrosion fatique.
Last not least a few words to the performance of condenser, Cthere we still find problem areas, which are neglected by
all designers. The optimum vacuum is never stated when intro-
ducing new turbine design to the market. We find that all
.our condensers are oversized. Capital investment could be
reduced when designing the condensers to the optimum vacuum;
leaving no.vmargin for fouling. Fouling can according to or
experience be completely avoided by reliable chlorinators.
As tube material Cu/Ni 70/30 has proven itself, only the coating
of the water bo5ces need attention in future. Glass flake epoxy
coating, thoroughly applied, seems to avoid the corrosion
experienced in the past.
However, for the majority of the service time, the propulsion
plants have not operated at their design output. Therefore
our experience can only reflect the behaviour at part load
operation and it is for others to speculate what might have
been the experience if these plants were stressed to the design.
- 20 -

-20-
5.Conclusion
Advanced design, manufacturing and installation tec hniques I
have resulted in improved performance. Our common aim musti
be to design and specify propulsion plants efficient in fuelI
consumption, capable to handle the available fuel of the future,
easy to maintain. Consideration must be given to the performance
and efficiency of the plant during part load. Full automatic
adjustments of all essential parameter during these load changes
are required.Ij
Since the ship and its-selected propulsion plant represent
a large investment and the assured earning capacity, which
is the prime objective of the creation it is economic necessity
that designer and operator work closely together to achievej['
the goal.
Acknowledgement I
I wish to thank D.STG for permission to publish this paper
and my colleagues for their assistance and help. Also I would1
like to express my gratitude to the organisor of the WEGENT
summer school for giving me the opportunity to present thisI
paper.

Fifth WEGEM TGraduate SchoolAdvanced Ship Power Plant IDesign and Operation
Ii
-Paper A9.1
calculation of Load Capacity of
Marine Propulsion Gears
by
Prof. Dr.-Ing. H. Winter and
Dipl.-Ing. K. Michael'is
1. Introduction
2. Loa d Carrying Capacity of Marine Gears2.1. Determination of Effective Tooth toad2.2. Determination of Surface Durability (Pitting)2.3. Determination of Tooth Root Stress (Breakage)
2.4. Determination of Integral Temperature (Scuff ing)3. Example
4. Conclusion
5. Bibliography

WEG 81-A9.1-1
Calculation of Load Capacity of Marine Gears.
1. Introduction
Typical damages of gears are
pitting, breakage and scuf-
fing (fig. 1). In general
the danger of pitting is
greater for through hardened
materials, of breakage for Tyoisuhr
case hardened materials and
of scuffing for case harde-
ned gears lubricated with
mineral oils with few EP-addi- ......:.
dives as e.g. engine or tur- - 3113.01.1
bine oils. Figure 1
In the marine application different calculation methods of dif-
ferent classification authorities are used, as American Bureauof Shipping (ABS) [4], Bureau Veritas (BV) [5], Lloyds Register
of Shipping (LRS) [6], Det Norske Veritas (DNV) [9], Registro
Italiano Navale (RINA) [7] and Germanischer Lloyd (GL) [8].
In the last years in the ISO committee TC 60 effort was put in-to an international standardized method for the calculation ofload carrying capacity of gears. These works have been finished
in 1980 with the publication of the basic rules. The DIN 3990draft standard [2] of 1980 is identical with ISO DP 6336 [1].Derived from the basic standard different application standards
are under work as e.g. industrial gears, turbine gears and ma-rine gears, which last are set up under the control of DavidBrown Gear Industries, GB [3].
The following gives a survey on the principles of the new ISOcalculation method and points out the most important values ofthe method.

WEG 81-A9.1-2
2. Load Carrying Capacity of Marine Gears [1, 3]
The calculation splits into a procedure for each of the three
main damages pitting, breakage and scuffing and shows as a
first part how to evaluate the effective tooth loading.
2.1. Determination of Effective Tooth Load
For all types of damages the
effective tooth load must be
determined. It is calculated A.nJMIO ,r.
from the nominal tangential qrZ.wkflUflru"
*,o zhhNftw.h. fbnnJO~*.tI.W SIn~
load per face width multi- f "f.lzrun# r Sh.4s n. ,,hriNIr
plied with the overload (...) , Kb- - )H -" b- H A " K •P "K H
.
factors K (application fac- ___t...___ + t __.
tor) K (dynamic factor) ,r-dh dp I. h rV Wurtorl uirn.• Ir• phdc~ error,
KB resp. KF3 (longitudinal
load distribution factor Ir.o .d hid , 0. NMI.
for Hertzian stress resp. ProZ., ,0 W.d,-,rflf,,Iht -= = 1.3IO
bending) and K resp. K
(circumferential load distri- Figure 2
bution factor for Hertzian
stress resp. bending).
2.1.1. Application Factor KA
KA takes account of magnitude and duration of external shock
loading of a gear pair from driving or driven machine. For an
exact analysis the actual load histogram of the gear has to be
compared by means of a cumultative loading hypothesis e.g.Miner
rule with the permissible loading from an S-N curve. Because
usually the load histogram is not known guidance for the choice
of K A can be given by regarding the type of driving and driven
machine and the shock absorbing properties of the couplings bet-
ween (fig. 3 for marine main propulsion).

WEG 81-A9.1-3
r.~,~ Plln. An.n i`.4,
S tp e .•n I u +In t o ', A n y l. ' l0< kLii l nn•] .• • I i b . l i 1 ! I• h -+
d+ s,,r $++n ++ An ii l-++ I • •+ tll
---• - -• -, ¶o 0"
Anp V~uld* S'ArtAOchn
111111n0 S."t DnIr.,r Io2 4IS Al-
AI ,. IVl I. I I . ,Y I.I l.3.
FZG.¶U M•nch., CUl0,flt IV IhI9 NV•[kSlir ""s'+ KA Mkt'•IlI j/.'l}
FigureS3 Figure 4
2. 1.2. Dynamic Factor KV
Kvtakes account of dynamic overload due to internal vibra- li
tions which are initiated by tooth errors and the change of. the .i
tooth stiffness during the mesh (fig. 4). According to the basic i
standard three different methods, A, B and C can be choosen for :the determination of K (fig- 5). Method A is always the most
exact procedure, in this case complete analysis of the vibra-
tion system or measurement. Method B is the calculation of a
simplified model with constants from test gear measurements.
ASni hn A: VOII IItc Nit" I'm 1.n 6 I 'M Si q j 1.4) 1.3 F I • I
Si& C~r. Wre 1VrtaAayt~ot.rin U.isa £I.4 vt3flnt 0
W 1.3 La LU 1.1 I.
I '++*''''lAd,, at "i . ..........--
YIF,OC.OqameC R1,. 2qu .m S LVI 1.11h .59t . 1 1,41n LAeaty 1,20fllfm
Viit-•th Ir , Valid . VI 'A rn.IJ fisId of A pl&4iatISubi~l..li,dkjI l Pn . wld lean. o.Auo Is ¶4• t&ai. 0 I ,I + ll , ,
I S tlagodiohlolh' N. -
1* ' .%dhA. v t *C brrttrI4.ku 1>. U4
Figure 5 Figure 6
This method is proposed in the application draft standard for
marine gears. Method C is derived from Method B for a limited
field of application in the subcritical range. Fig. 6 shows
the measurement of K as a function of the reference speed N,
sipife mdl ih ostns rm et er esueens

WEG 81-A9.1-4
which is the quotient of the operating frequency and the natural
frequency of the system. This curve is approximated by the dashed
line, with a linear increase in the subcritical field, a constant
high value in the resonance field, a linear decrease in the tran-
sition to overcritical and a constant value in the overcritical
field.
The dynamic factor is very much influenced by the helix angle,
the quality and the profile corrections (tip relief) of the gear.
For an example in the resonance field, fig. 7 shows the value of
Kv for a spur gear without and with optimum profile correction
compared with a non corrected helical gear. That means an in-
crease in manufacturing effort (better quality, profile modifi-
cation, helical gear) pays well concerning the dynamic factor.
3-f----J --- I._ ISO Cuoltot S I
Spur g.or II -
K , -1 9m lan.. t__ I
f E.. t oftli
ooimoO.v. P1041i Iorhtu, I,...... gflt ***V
1r v x . ... Spur gSta havlng th
. ... optimum 11p rf4ist bo U, coth
I; t otobi. h.,olio gc
05 I IS 1.5 2A0I34 N -
FZG -TU M4 ..... J nom- zJI"GTU
...... LCZ:N:T•ýIN *L LG UJIS MT•I N T 4•:T ý K ,3
Figure 7 Figure 8
2.1.3 Longitudinal Load Distribution Factor K HB, K FB
K HB and K F8 take account of unequal load distribution accross
face width due to flank misalignment (fig. . L The effective
misalignment consists of torsion and bending deflections, manu-
factured helix error and bore misalignment and the bearing de-
flection, altogether reduced by a running in amount (fig. 9).
High precision quality as well as adequate
helix correction to-
gether with crowning, that means again increased effort in manu-
facturing can significantly reduce the longitudinal load
distri-
bution factor.
facewidh du toflak mialinmet (fg. ) .The ffetiv

WEG 81-A9.1-5
FZG-TIJ Munten
! $
-I
Un, .. . ..°'- - °
Figure 9guFigurts10
deress heladc rryingoe cp ity easiy tohal th 2au
ofgo .uality gears. wthdCn adqut corcios L
tedfo th ptc point. Moiiain nth culsrs
Im LIL 5-- S,
duyo- j effcts and frictio-na sherstress Kn,. ko ;Ibe r ltors
Figure 9 Figure 10
fDepending on the tooth stiffness and the applied load K HB and
K F8scan be taken from a diagram resp. a system of equations
(fig. 10)v The longitudinal load distribution factor is one of
the most important values in gear rating, where minor quality
decreases the load carrying capacity easily to half the valued-
of good quality gears with adequate corrections.
2.2. Determination of Surface Durability (Pitting)
The governing kind of stressing is the Hertzian stress calcula-
ted for the pitch point. Modifications in the actual stress
distribution by Elasto-Hydro-Dynamic (EHD) effects and frictio-
nal shear stress is taken into account by empirical factors
(fig. 11). The basic formula shows fig. 12, where the Hertzian
stress is calculated in the pitch point as a function of nominal
loading, overload factors (see 2.1.) and geometry and material
values, which latter two can exactly be calculated along fixed
rules.
HFrtncto mrsnq
I(Io ~ ~ ~ br.oc,~ a.. ;; ;:z: .t_ _
1 .., / IMA23f.7L 7
Figure 11u Figure 12

WEG 81-A9.1-6
The actual Hertzian stress aH
must not exeed the permissible
Hertzian stress a HP (fig. 13).
For gears designed for unli-
mited life, life factor ZN N., ,,.
is to be set unity. Because [
of lack of knowledge size -
factor Zx is also set unity. I A A_
Work hardening factor ZiW G , ,.d
takes account for increased "lot
surface durability of a
through hardened gear when FZG-TU• MMC Zs.X' P"M =...OLT
PmOr1.im .W Pnttrib t mur.
mating with a surface har-
dened gear of smooth sur- Figure 13
face roughness.
The factors ZLt ZR , Zv take account of EHD and friction influen-
ces depending on lubricant viscosity, surface roughness and speed.
The minimum safety factor for high reliability is estimated to
1.25 relating to pressure, which equals 1.56 relating to load.
The endurance limit aHlim can be taken from diagrams(fig. 14) as
a function of heat treatment and hardness. For extreme high qua-
lity materials and controlled heat treatment values near the up-
per limit (ME) can be chosen tsee fig. 15). For minor efforts in
steel composition, heat treatment and control testing the lower
limits are valid (ML). Normal quality material and heat treatment"
allow for medium values in the material fields (MQ). This shows
again that more subtle manufacturing allows for higher limiting
values.
16 tROUIlRtbtNNIKit (toM MO 1j*L
tyl It M sh
PZO-TUIM
z0- utf - '":•"- It ri s.irn ot hoced V,&,O m t, Io•'t,. Il,'tit Iohr
•as., -io * a lit $trajcttrt I to cnLk•h~td tuotyfll liTf oot rs ltnI, •tu !ltlt *otlh Onn
hod ~ ~ ~ ~ ~ ~ ~ - -, -J - -rio -oiuk*O -d -hco -r~f OlýCý ý rr . ,uý Mtud~
I ['"I co canhu,. p.lti., -(r: cmdI rotrl~ crll{• t ot Ontl . .Ioti• or~ ;nnis }lot Iii.
Figure - o -t - - -- -i 5 t h- s-s * -byAý t.dotlt ooi
T --- --- - -Y -
I. F ZG-TU ......ms-911Wn~tl AO rflht I.(ni 0 uW
Figure 14 Figure 15

WEG 81-A9.1-7
2.3. Determination of Tooth Root Stress (Breakage) i
IF s Ys - A V,fl.
Y$ Ste... Cenrct... u'" Abits•SJnnqe 1411 ANqi.
I ~c ~tr - ISO - Suaarte -h,~Id, ,Mkv
Fb9NInn I
n~• . rt C lr dFt r
Mireeion Lataoaf - - a .• . •A. • • '
F., No.... I 16.mS Strem C 17otcmnrtfo
10th.hitoed -
56CLO 1 7
ITt Or.n1.it TMIT Rc* 50.51T
L Figure 16 Figure 17
The calculation is based on the maximum bending stress at the
tooth root when loaded in the highest point of single tooth con-
tact. The nominal bending stress is calculated as a function of
load,stmoment arm and critical section (fig. 16). The local stress
in the critical section can be determined by multiplication with
the stress concentration factor (notch effect). The basic equa-
tion shows fig. 17, where method C with form factor YFa and stress
correction factor YSa calculated for tip loading and recalculation
to the highest point of single tooth contact by Y. is chosen for
marine gears. All Y-factors are geometrically defined and can be
taken from diagrams resp. calculated along fixed rules.
The permissible strength oa can be recalculated from limiting
values found in gear tests (fig. 18).• The life factor Y is setNT
unity for unlimited life. For usual materials notch radii and
roughness relative notch sensitivity factor Y&relT and relative
roughness factor YRelT can be set unity. Size factor Y takes
account of the decrease in bending stress gradient for bigger
modules. The minimum safety factor should not be less than 1.6.
The limiting stress can be taken from diagrams (fig. 19) where
the stress correction factor for the test gears YST has to be
introduced. The same requirements to the material and heat tre-
atment are valid for the choice of a-lim out of the given fields
as it was shown for oHlim-

WEG 81-A9.1-8
I l l i ° ... ....... ...O.,Q -o• i E h 1,ta~hMmln• %d ~
r 0 r•- C Alo y S t . . is
+ I
15 1 MEIII
flL, StttLtfiir "RZ f !
lttskn.,na~~29 mfl
RCu .d.n.d I .. ... '. atldu nCry'!. t
0 00 200 3W0 '0 S SOC 00 7W am 201
&MO-T Mttndd~ rn I"~u Stmfl d TO~ CaýtaS 1,,0 *I lnFZO-TU unchos Zu . d==JJ5 z.n•D E LIP ISO . I -
P Win, PyrMtit rn Pact Strm
Figure 18 Figure 19
2.4. Determination of Integral Temperature (Scuffing) (
A mean, weighted surface temperature on the flank is estimated
to be responsible for scuffing damage (fig. 20). It consists of
a bulk temperature and a weighted mean surface temperature
(fig. 21). The permissible integral temperature can be deter-
mined from a gear scuffing test (e.g. FZG-test A/8.3/90) .de-
vided by a minimum safety factor of at least 2.0 (fig. 22).
3. C,
- A
l1- -n'- una I ~•l•tlim llieli tntUrn~ia • Ir~l~l
annalt- 3.... C .)', .- *-A a c 0 E T..t - It-C -t
,ts,b, d-,,E,,,11.-
tta i~ 37cr Cclktdltjttv M erljllalr ta..lanqthIaflatend tsaltl.*l"'-~1 -O LO~Z: 4~ lV Mket
Figure 20 Figure 21
Fig. 23 shows for the FZG test acc. to DIN 51354 the test va-
lues for the determination of the permissible integral tem-
perature.

WEG 81-A9.1-9
lo a$ l lS' A 9In FZG.eUst
a.,f• ru C73 2 XW .I 1 .1 10 ýAfI
1Cu ,II'A o •" ', W .1 0'[ : -a
I fnt U r .J .• f,,1e Z, ih mr I~ • F rjalu e l ztt 1 .r GItu d A M .la1 " IAt Dim 513 IS 0
-- -M ITTPgO -
Sl ..01 FZG t•s AM.Vn DIN IJWO IISO.VG- n60
I too
rl b*.•H i~¢ ~ rl$• I 2d01'VCSI lerlh luo Tv.nh •, tr 1 00 L 1 10hL SOJn~cnlng Tn T1 TWITUT,
Figure 22 Figure 23
3. Example
The authors would like to thank Zahnrdderfabrik RENK-Augsburg
for providing this example of a single reduction main propul-
sion gear for a cargo ship (fig. 24). Two 8 cylinder combu-
stion engines of 6618 kW each work through an elastic coupling•
on the two case carburized and ground pinions. The through har-
dened and shaved qear rim is shrunk on a cast iron hub. Pinion
speed is 429 rpm, center distance 1875 mm, module 16 mm, helix
angle 9*. Pinion and wheel are situated symetrically betweentheir journal bearings, manufacturing quality was ISO 5. The
gear was calculated according to the classification authorities
ABS, BV, LRS, RINA, GL and DNV and the draft proposal of ISOapplication standard for marine gears (fig. 25). The methods
(II
son gear fo, rSadRN ar cargo si(fg24.two 8M cylinder G conbu
on the twoe c a r and.ground pinons T
speed.is 429 rpm . , center.distance.187 m module 16 ... e
oF B, aA A4raings, Ga. ...... lay. taa ,IL
Figur 24 Figure~ 23Ouc~bduoRdE b i f b

WEG 81-A9.1-10o
A direct comparison of stresses and factors is impossible be-cause of different philosophies where e.g. the safety factorsare already included in the strength values.
So the comparison was made for the permissible and the actualtransmitted load seperately for pitting, breakage and scuffing.The white bar in fig. 25 means permissible load in %, that is100 %. The hatched bar gives the actual transmitted load. Aslong as the hatched bar is smaller or equal the white bar thegear is of sufficient dimensions. This is the case for ABS,BV, RINA, GL and ISO, where the latter includes also the scuf-
fing criterion.
LRS shows a possible pitting danger if strictly calculated alongthe rules. For good surface finish however LRS allows for up to33 % higher permissible load. Taking account of the shaved gearteeth the dotted line in the bar is valid, that means suffi-cient capacity. DNV rating shows critical loading with respectto pitting and breakage. This comes from the very high K H8' K F8_values K H3ýK F3= 1.62.while an exact analysis of the deflec-tions figures out KHfl8 1.15, the application draft standard incomparison gives K Hn 1.14. Included in the ISO rating are sa-fety factors for Eertzian stress SH= 1.25 (equals 1.56 relatedto load), bending S F= 1.6 and scuffing S5S = 2.0.
A comparison of the results shows good correlation between thedifferent calculation methods of the classification authoritiesand the new ISO proposal. So an ISO application standard for ma-rine gears could be a valuable means of unifying the differentcalculation procedures. At the same time this procedure givesthe manufacturer the chance that improvements in the manufac-turing process like high geometrical and surface quality, longi-tudinal and profile tooth corrections, material and heat treat-ment control etc. can be introduced into a calculation procedureand this can be figured out in safety factors as it is known
from practical experience.

WEG 81-A9.1-11
4. Conclusion
The basic principles of the proposed ISO application standard
for marine gears were shown, the possibilities of introducing
manufacturing improvements were pointed out. By calculation of
an example the different calculation methods according to the
classification authorities were compared with the ISO method,
and good correlation was found. An ISO application standard
for the calculation of load carrying capacity of marine gears
could help to unity the different calculation procedures of
the classification authorities, a first step in this direction
was made by Det Norske Veritas and Germanischer Lloyd, which
have partly introduced ISO calculation procedures.
5. Bibliography
[I] ISO TC 60, DP 6336: Basic Principles for the Calcu-
lation of Load Capacity of Spur and Helical Gears,
1980.
[2] DIN 3990, Teil 1-4: Grundlagen fUr die Tragfahigkeits-
berechnung von Gerad- und Schrigstirnrddern, Entwurf
Marz 1980.
[3] ISO TC 60/WG 6, Document 231: Draft Proposal for the
Calculation of Stresses and Power Capacity of Marine
Main Propulsion Gears, 1979 with additional comments
of 1981.
[4] American Bureau of Shipping: Rules for Building and
Classing Steel Vessels, 1980.
[5] Bureau Veritas: Rules and Regulations for the Construc-
tion and Classification of Steel Vessels, 1977.
[6] Lloyd's Register of Shipping: Rules and Regulations
for the Classification of Ships, 1978.
[7] Registro Italiano Navale: Rules for the Construction
and Classification of Ships, 1978.
[8] Germanischer Lloyd: Vorschriften fUr Klassifikation und
Bau von stdhlernen Seeschiffen, 1980.
[9] Det Norske Veritas: Rules for the Construction and
Classification of Steel Ships, 1978.

0

Fifth WEGEM TGraduate SchoolAdvanced Ship Power PlantDesign and Operation
Paper A 9.2
Design.of.gears for ships
by
Professor Dr.-Ing. H. M. Hiersig
1. Introduction2. Systematic classification
2.1 Single reduction gears2.2 Distributing and summarizing gears with
multiple power paths2.3 Variable-speed'gears
2.4 Auxiliary.gears
3. Light weight design
4. Constructional details of ship's gears4.1 The gear wheels
4.2 Shaft supports'
4.3 The casings
WEG 81 A 9.2 -1
1. Introduction
The toothed wheel gear has unquestionably become established in prefe-
rence to belt-drives, hydrostatic gears and electric.transmission in
power transmission systems of ships. In spite of the disadvantage of
fixed gear ratios, variable at best in stages, and several other unde-
sirable characteristics such as, for example, noise emission, toothed
wheel gears are always the natural first choice. The reasons for this
are: high specific output, i. e. small dimensions, weights and moments
of inertia, and unequalled efficiency. The gear losses are almost
negligible, as also is the heat generation from toothed wheel gears.
The ship's propulsion itself poses a challenge to the engineering and
technology of the toothed wheel gear: the strict requirements of reli-
ability and availability for continuous operation, the power 9utputs
to be transmitted and the output torques and, finally, the imperative
need for quiet running, all necessitate expert knowledge on the part
of the design and manufacturing engineers. Those few manufacturers who
were capable of constructing this type of gear have become somewhat
exclusive. Large investment is needed in particular in the area of
mechanical and inspection equipment, as this is essential to meet the
high engine speeds and considerable outputs produced.
More recently, however, two factors have contributed to the decrease
in the number of turbo~gears of the original type being used in ship
gear construction. The relatively high fuel consumption of oilfired
steam turbine systems Ccoal-fired ones are now being reconsidered)
encourages a switch-over to diesel engines as propulsion machinery.
On fast ships, space for the machinery system is limited. This reason
alone calls for the application of another technology for the toothed
wheel gear, and to bring about a conversion to case-hardened wheels.
Only in this way can a noticeable reduction in the dimensions of the
gearing be achieved. For this, there are numerous examples in defence
technology, involving the use of gas turbines, often combined with die-
sel engines, as -propulsion machinery. In the course of time, this will
also apply to steam turbine propulsion systems, where the steam is
produced in nuclear reactors.

WEG 81 A 9.2 - 2
GTS "Finnjet", however, is one instance in civil shipping where the
two turbo-gearboxes are fitted entirely with spur gears which are
case-hardened and ground at the tooth flanks.
This was necessary to keep the gearbox weight to a minimum, despite
the output of 2 x 37.500 hp. It is well known that with high ship's
speed, the propulsion power depends considerably on the weight and
displacement. See fig. 1
The output required would have necessitated through hardened wheels
of around 4000 mm in diameter, where as the modern wheels which
transmit the same power measure only 2600 mm and have a small tooth
width. There have always been arguments against case-hardened toothed
wheels which assert that case-hardening leads to severe brittleness
and that the high specific tooth loads could eventually cause damage.
Nevertheless, the good record of availability of this ship, engaged
on its daily- schedule, confirms irrefutably the reliability of this
technology and the soundness of the construction concept of this type
of g4ar.
• W,
r4t
L
Fig. 1 Spatial representation of a three-stageNavilus-turbo-gears (GTS "Finnjet" 37.500 HP,i = 3800/171)

WEG 81 A 9.2 - 3
In view of the fuel prices, the "Finniet" will symbolize a specialcase by which other vessels, and in particular freighters, cannoteasily be compared. On these latter ships, conversions are currently
being carried out from gas turbine propulsion to medium-speed diesel
engines, an indication that the diesel engine (medium or slow-speed)
is favoured. Hence, gears for propulsion systems with diesel engineswill be given preferential treatment in the following exposition.
2. Systematic classification
There is a bewildering variety of gears which transmit diesel engine
outputs to propellers. A systematic summary will therefore help to
clarify the general survey.
2.1 Single reduction gears
Fig. 2 shows schematic diagrams of the various single reductiongears. The basic forms (G 1.1 and 1.4) with cylindrical and conicalwheels, which may be either without stages (G 1.1.1) or in stages(G 1.1.2 and 1.4.2). Designs with internal gears CG 1.2.1 and 1.2.2),seldom made nowadays, represent a transition to the planetary im-portant as components of propeller drive, and elsewhere in power
systems technology.-
2.2 Distribu ting and summarizing gears and~gears with multiplepower paths
Fig. 3 provides a general survey of distributing and summarizing
gears and such with multiple power paths. The distributing gears
(G 2.1.1., 2.1.2 and 2.1.3) are of vital significance to vessels
and in naval ships in which two controllable-pitch propellers are
driven by a single engine. In this case, a simple machinery system
is combined with high manoeuvrability. To avoid lateral drift, an
intermediate wheel CG 2.1.2) must normally be provided to make the
two propellers counter-rotate.
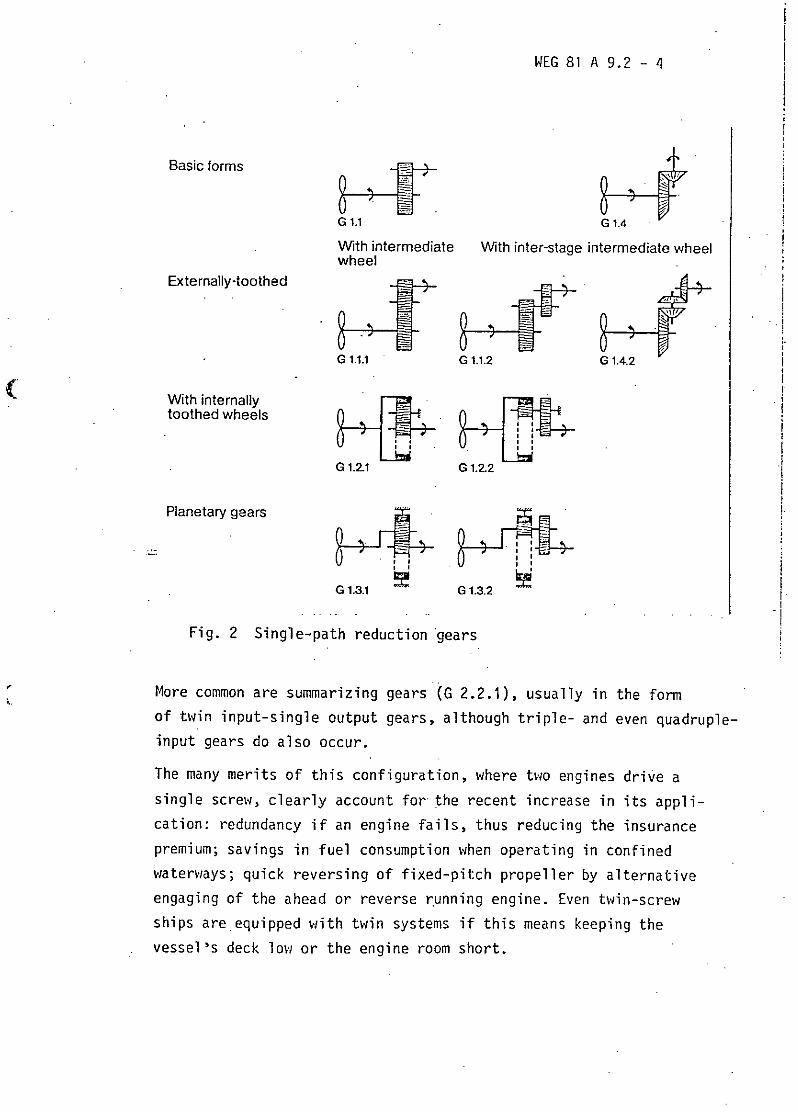
WEGSI1 AY9.2 -4
Basic forms
G 1.1G 1.4
With intermediate With inter-stage intermediate wheelwheel
Externally-toothed
( ~~~~~With internally 0110120..toothed wheels
vtv 4 LG01.3.1 G1.3.2
Fig. 2 Single-path reduction gears
More common are summarizing gears (G 2.2.1), usually in the formof twin input-single output gears, although triple- and even quadruple-input gears do also occur.
The many merits of this configuration, where two engines drive asingle screw, clearly account for the recent increase in its appli-cation: redundancy if an engine fails, thus reducing the insurancepremium; savings in fuel consumption when operating in confinedwaterways; quick reversing of fixed-pitch propeller by alternativeengaging of the ahead or reverse running engine. Even twin-screwships are equipped with twin systems if this means keeping the
vessel's deck low or the engine room short.

WEG 81 A 9.2 - 5
With intermediate With inter-stagewheel intermediate wheel
Distributing 0
G 2.11 G 2.1.2 G 21.3
Summarizing_
G 2.2.1 G 2 2.2 G 2.2.3
Two power paths
G 2.3.1 G 2-3.2 G 2.3.3
Planetary
G 2.4.1 G 2.4.2
Fig. 3 Distributing and summarizing gearsand gears with multiple power paths
If the two engines in a twin-system require a substantial distance
between shaft axes, e. g. in the case of vee-form or crosshead
engines, the distance can be bridged using intermediate wheels
(G 2.2.2) for small gear ratios and, for greater ratios, inter-
mediate stages (G 2.2.3) as well. As a rule, summarizing gears
are provided with clutches which facilitate the engaging and
disengaging of one of the engines.

14EG 81 A 9.2 6
Ships' gear dimensions can be considerably diminished by way of
power branching. As shown in G 2.3.1., the output can be divided
over two intermediate wheels which mate with a common large wheel.
Should one wish to profit from the advantages offered by the coaxial
type of construction, G 2.3.2. with a ring gear on the output shaft,
and G 2.3.3 with an externally-toothed spur or helical gear, can
be applied. In these latter two configurations, the output is
distributed across two, three or five branches before merging
again at the output wheel. Where greater gear ratios are involved,
epicycling or planetary gears (G62.4.1 and 2.4.2) are used, the
planet carrier combining the multiple power paths.
2.3 Variable-speed gears
Several gears used in ships can be classed as (.atiable-speed gears,
see fig. 4. Their clutches, symbolically represented by discs,
enable engines with unequal powers and speeds to be engaged or
disengaged. These types of "father and son" systems (G 3.1.1 and
'4 .1.2) are encountered both in fishing and other marine vessels.
'They allow the engines to drive the propellers at full engine power
but at different speeds, thus providing $two ranges of operation.
*When, however, neither a reversible engine nor a controllable-
pitch propeller is fitted, reversal of the direction of rotation
must be performed by the variable-speed gear..
Reserve-reduction gears have either a reversing pair of wheels
(G 3.3.1) or one reverse pinion, arranged as an intermediate wheel
(G 3.3.2), unless they are designed as planetary gears with a
*Ravignaux Stage (G 3.3.3), where two planets are geared together
in each case. This same method can be used to construct three-
speed gears, which normally consist of two ahead stages and one
astern stage CG 3.4.1 and 3.4.2). In principle this can also be
applied to planetary gears (G 3.4.3), although these are seldom
produced for such purposes.

WEG 81 A 9.2 -7
With alternativegear-ratios
With two stages
G63.2.1 G3.2.2 Ga32.3
With reversal of thedirection of rotation
*(reverse-reduction 4-Ngear) L0v1
G 3.31 G3.3.z Ga 313.31
With rever sal of thedirection of rotationand two stages
G3.4. G3.4.2G3.3
Fig. 4 Variable speed gears
2.4 Auxiliary gears
Finally, auxiliary gears complete this tableau of possible ships'
gear constructions. See fig. 5. The fact that it is an advantage
to have electricity produced by the main engine, owing to its small
consumption of fuel of inferior quality, has meant that auxiliary
gears have become increasingly important. Here, shaft generator
gears (G 4.1) operate continuously with the propeller shaft (the
so-called secondary PTO), whilst primary output shafts (G 4.2.1
arid 4.2.2) are driven by the main engine, even in cases where the
propeller is idle, e. g. in harbour.
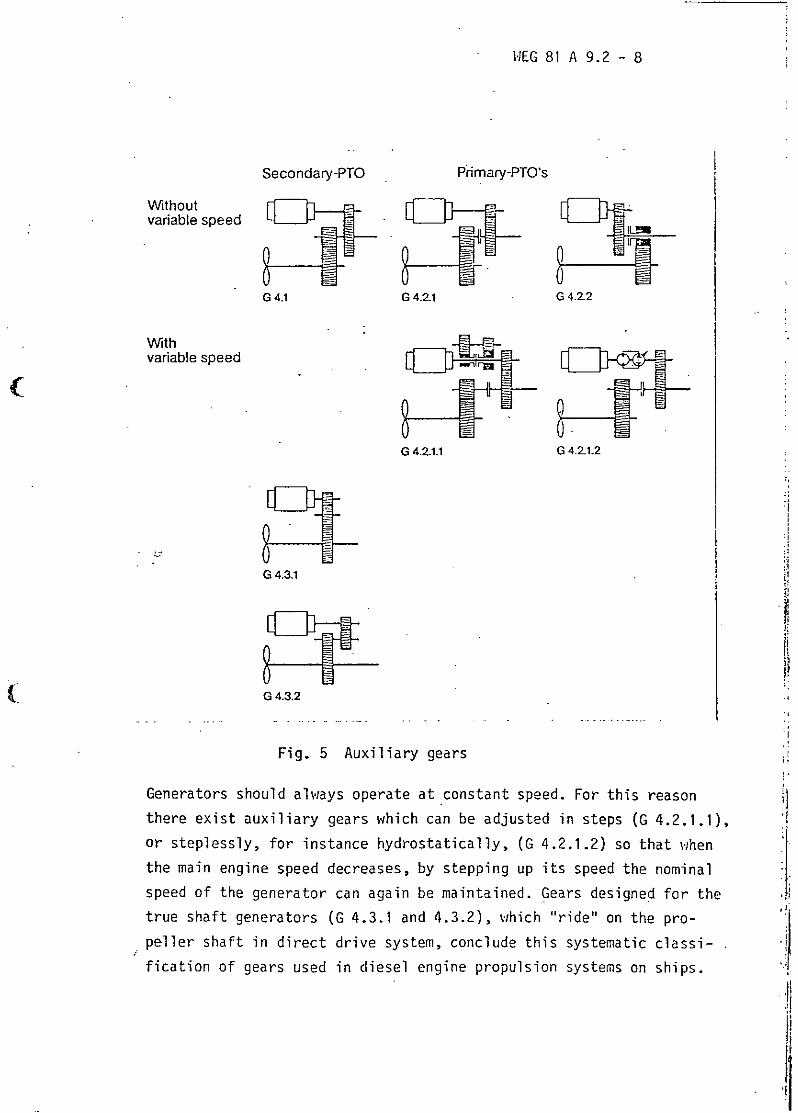
WEG 81 A 9.2 - 8
Secondary-PTO Primary-PTO's
Withoutvariable speed
G 4.1 G 4.2.1 G 4.2-2
Withvariable speed [3
G 4.2 1.1 G 4.2.1.2
.I
G 4.3.1
111
G 4.3.2
Fig. 5 Auxiliary gears
Generators should always operate at constant speed. For this reason
there exist auxiliary gears which can be adjusted in steps (G 4.2.1.1),
or steplessly, for instance hydrostatically, (G 4.2.1.2) so that when
the main engine speed decreases, by stepping up its speed the nominal
speed of the generator can again be maintained. Gears designed for the
true shaft generators (G 4.3.1 and 4.3.2), which "ride" on the pro-
peller shaft in direct drive system, conclude this systematic classi-
fication of gears used in diesel engine propulsion systems on ships.
4i

WEG 81 A 9.2 - 9
3. Light weight design
Planetary gears allow space concentration and light weight, if proper
calculated. However, planetary gears are not suited for low ratios.
Their economical relevant region begins with ratios larger than 3,5.
Often and - as a rule in connection with slow-speed diesel engines
low ratios under 3 are required. The first choice then is an off-set
gear unit, which has to have a certain volume V belonging to the two
meshing gears, fig. 6
2 11 d2 ri 2 + I
As there is the possibility to bring two or more pinions to mesh with
the gear, the volumina of gear and pinions together can easily be
reduced, fig. 7..Two power paths lead to2 i2 + 5)2 (25
V II = d22 -,--b ½ ' UiT )2
and three to2i +17) (3)VIII :d 2
2 •1 b- (-7),(3
Multiple power paths- or locked train gears need an equal power distri-
bution to the different paths, fig. 8. In planetary gears floating sun-
pinions are commonly used, in order to give freedom to centerise the
pinions between the planets (8a). Other solutions use the axial forces
of the input pinions with double helical toothing which has an axially
adjustable position (8b). If the helical angles are opposite but equal
the axial forces have to have the same.size. In the case of unequal
power distribution the then also different tangential and axial forces
result in axial displacements until the transmitted power of the gear
trains becomes equal again.
Another solution (8c) uses the elastic equilibration by springs, which
allows for a power distribution which will be not absolutely equal but
gives sufficient results. The torsionally elastic "quillshafts" are
well known in turbogears of the locked-train-design. But, also in gears
for diesel power these elastic elements have been applied successfully.
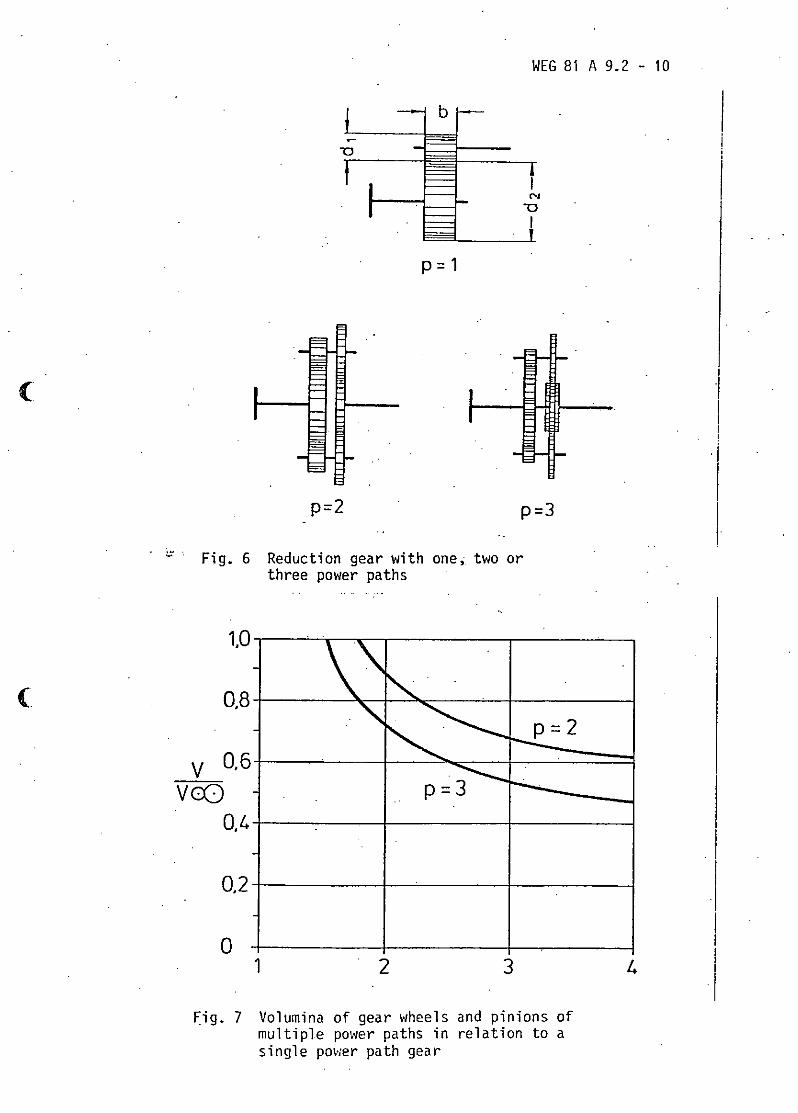
WEG 81 A 9.2 - 10
fPp=1
(°
p=2 p=3
Fig. 6 Reduction gear with one, two orthree power paths
1,0-
(0,8-
1 2
•C - P=3p=
0,4-
0,2-
02 3
Fig. 7 Volumina of gear wheels and pinions ofmultiple power paths in relation to asingle power path gear

WEG 81 A 9.2 - 11
Al J;l L , I• > Ii
•T I a b
II. JL
_L L L AI ý
AL IL
Ic i di
Fig. 8 Design solutions to equilibratethe transmitted power
Recently in another proposal the axial forces are compensated partially
and the rest is left to pressure springs (8d).
An example for the application of quill-shafts is shown in figures 9
and 10. There are two power paths acc. to fig. 8c. The space saving
design of this configuration leads to a very low height of the gears taxis. This avoids any intersection of the double-bottom. Thus, the
thrust bearing could be combined with the gear unit itself. Gears of
this kind are since long time and successfully in service.
In fig. 7 is emphazised the advantage to use not only two but three
power paths, as it is the rule with planetary gears. As the part of
material costs in the total costs of a marine gear will in future
increase substantially the designer will be even more challenged to
cultivate light-weight-design. This does not mean the machining of
filigrane parts, but the reduction of the weight of the purchased
raw-material. Obviously, this is well to realise with three power paths.

WEG 81 A 9.2 -12
0R
Fig. 9 Marine gear with two power pathsand quillshafts
Fig .10sVewnt a marin gear with pwr
distriution
P = 200 ,i= 3/8
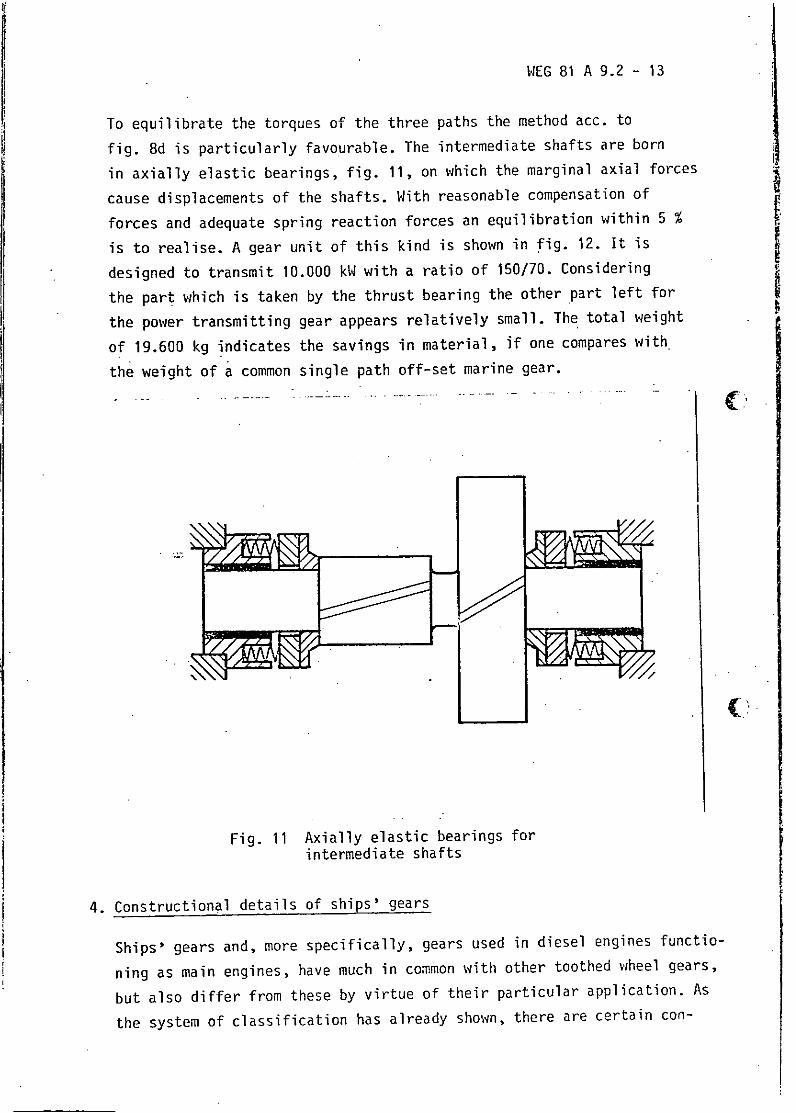
WEG 81 A 9.2 - 13
To equilibrate the torques of the three paths the method acc. to
fig. 8d is particularly favourable. The intermediate shafts are born
in axially elastic bearings, fig. 11, on which the marginal axial forces
cause displacements of the shafts. With reasonable compensation of
forces and adequate spring reaction forces an equilibration within 5 %
is to realise. A gear unit of this kind is shown in fig. 12. It is
designed to transmit 10.000 kW with a ratio of 150/70. Considering
the part which is taken by the thrust bearing the other part left for
the power transmitting gear appears relatively small. The total weight
of 19.600 kg indicates the savings in material, if one compares with.
the weight of a common single path off-set marine gear.
• ~(!
Fig. 11 Axially elastic bearings forintermediate shafts
4. Constructional details of ships' gears
Ships' gears and, more specifically, gears used in diesel engines functio-
ning as main engines, have much in common with other toothed wheel gears,
but also differ from these by virtue of their particular application. As
the system of classification has already shown, there are certain con-
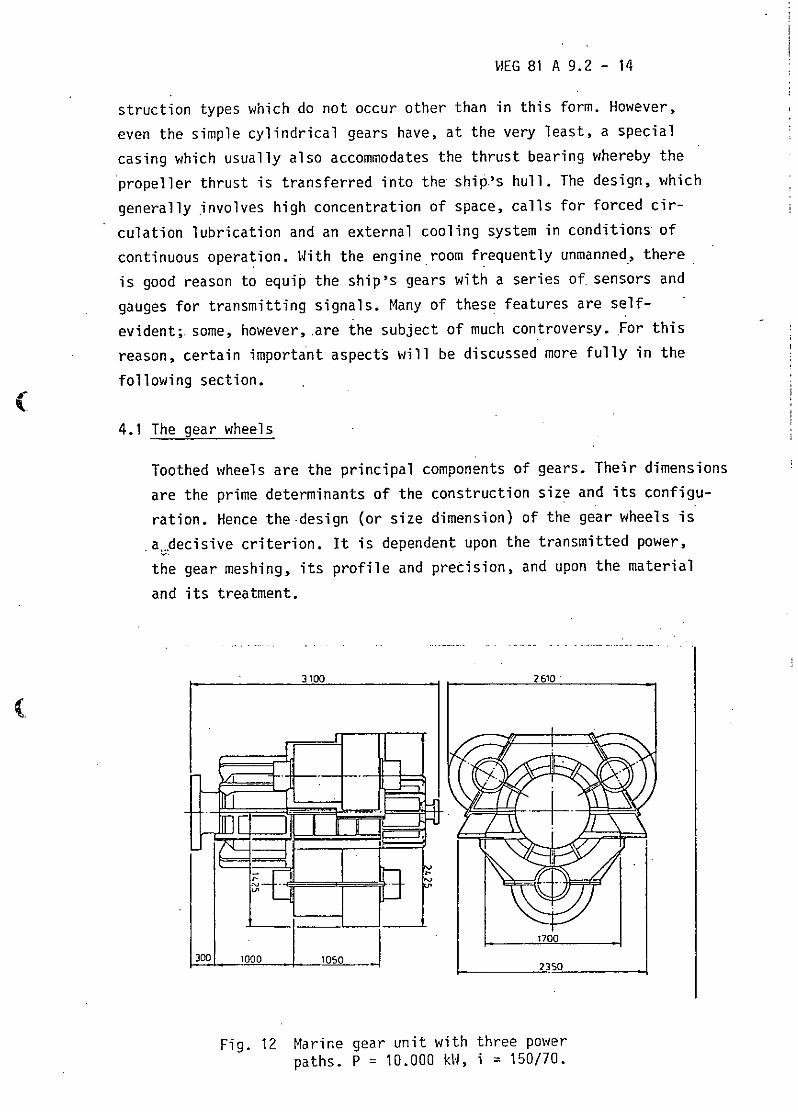
WEG 81 A 9.2 - 14
struction types which do not occur other than in this form. However,
even the simple cylindrical gears have, at the very least, a special
casing which usually also accommodates the thrust bearing whereby the
propeller thrust is transferred into the ship's hull. The design, which
generally involves high concentration of space, calls for forced cir-
culation lubrication and an external cooling system in conditions of
continuous operation. With the engine room frequently unmanned, there
is good reason to equip the ship's gears with a series of. sensors and
gauges for transmitting signals. Many of these features are self-
evident; some, however, are the subject of much controversy. For this
reason, certain important aspects will be discussed more fully in the
following section.
4.1 The gear wheels
Toothed wheels are the principal components of gears. Their dimensions
are the prime determinants of the construction size and its configu-
ration. Hence the design (or size dimension) of the gear wheels is
a decisive criterion. It is dependent upon the transmitted power,
the gear meshing, its profile and precision, and upon the material
and its treatment.
3100 _ 2610
1700
30, , • 1000 • 1050 2350
Fig. 12 Marine gear unit with three powerpaths. P = 10.000 kW, i = 150/70.
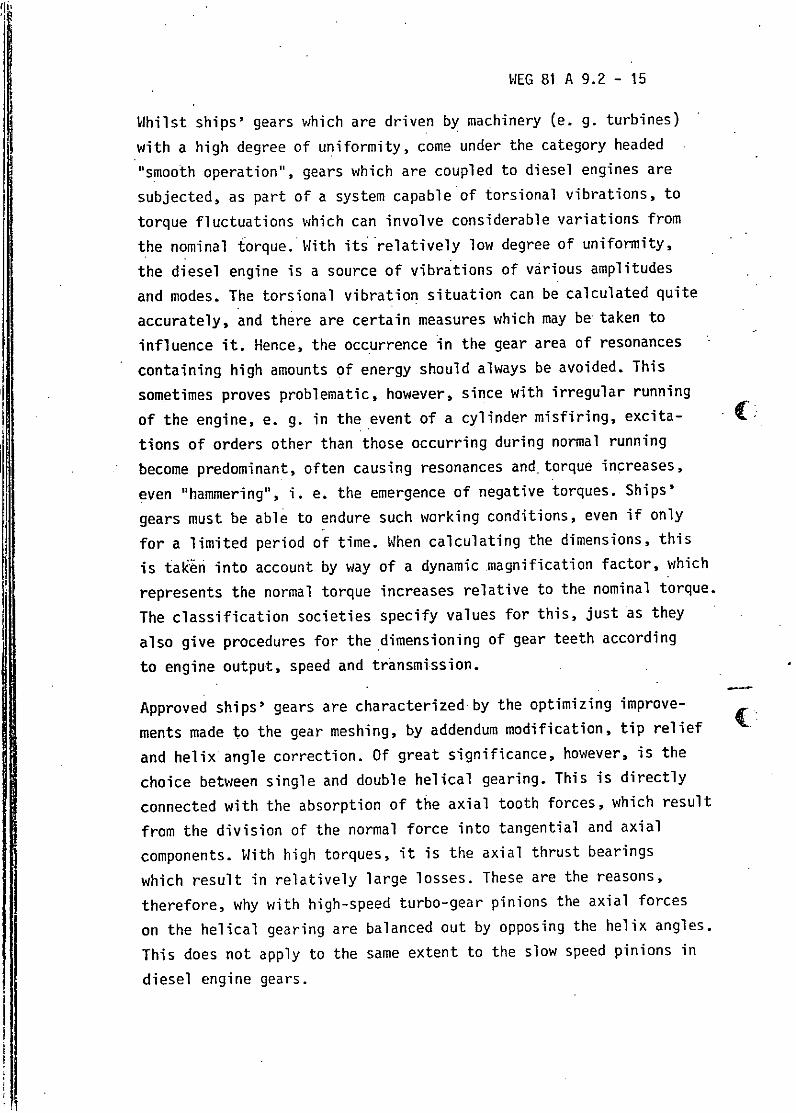
WEG 81 A 9.2 - 15
Whilst ships' gears which are driven by machinery Ce. g. turbines)
with a high degree of uniformity, come under the category headed
"smoo Ith operation", gears which are coupled to diesel engines are
subjected, as part of a system capable of torsional vibrations, to
torque fluctuations which can involve considerable variations from
the nominal torque. With its relatively low degree of uniformity,
the diesel engine is a source of vibrations of various amplitudes
and modes. The torsional vibration situation can be calculated quite
accurately, and there are certain measures which may be taken to
influence it. Hence, the occurrence in the gear area of resonances
containing high amounts of energy should always be avoided. This
sometimes proves problematic, however, since with irregular running
of the engine, e. g. in the event of a cylinder misfiring, excita-C
tions of orders other than those occurring during normal running
become predominant, often causing resonances and, torque increases,
even "hammering", i. e. the emergence of negative torques. Ships'
gears must be able to endure such working conditions, even if only
for a limited period of time. When calculating the dimensions, this
is taken into account by way of a dynamic magnification factor, which
represents the normal torque increases relative to the nominal torque.
The classification societies specify values for this, just as they
also give procedures for the dimensioning of gear teeth according
to engine output, speed and transmission.
Approved ships' gears are characterized by the optimizing improve-
ments made to the gear meshing, by addendum modification, tip relief
and helix angle correction. Of great significance, however, is the
choice between single and double helical gearing. This is directly
connected with the absorption of the axial tooth forces, which result
from the division of the normal force into tangential and axial
components. With high torques, it is the axial thrust bearings
which result in relatively large losses. These are the reasons,I therefore, why with high-speed turbo-gear pinions the axial forces
on the helical gearing are balanced out by opposing the helix angles.
This does not apply to the same extent to the slow speed pinions in
diesel engine gears.

WEG 81 A 9.2 - 16
In this case, the free axial forces can be carried byiaxial bearings
or, in the case of small gears, simply by roller bearings. This
arrangement enables the single helical gear, which is considerably
easier to produce, to be used with helix angles which facilitate
the use of even overlap ratios. In this way, the total length of the
contact lines in each tooth position is constant and the tooth stiff-
ness variation.:which is an important factor in noise emission, remains
practically constant during one passage of the tooth.
Gears with roller bearings are usually provided with an overlap ratio
of 1, so as not to lessen the durability of the roller bearings
through excessive axial forces. Gears with plain bearings, generally
governed by strict requirements for quiet operation, are capable of
accomnodating large axial forces and.can thus also accept greater
helix angles of up to an overlap ratio of 2. Single helical gearing
in ships' gears has the advantage that, to a certain extent, un-
avoidable axial propeller shaft vibrations cause much less additional
stressing of the gear wheels than is the case with double helical
gearing.
With double helical gearing the pinions are not axially restrained.
They must therefore follow each axial movement of the main wheel.
Their mass and the parts of the coupling attached to the pinions,
however, produce considerable forces opposing the accelerations and
decelerations. In a gear with single helical gearing, the axial vibra-
( tions of the large wheel give rise only to additional rotational mo-
tions, which are counteracted by much smaller secondary inertia forces.
The material from which the toothed wheels are made has an important
relation to the dimensions. The introduction of case-hardening pro-
duced a remarkable increase in the strength of tooth flanks compared
with a heat treated gear wheel made from high alloy refined steel.
Here, the critical load limit is governed by the strength of the
tooth flanks, whereas with case-hardened and ground teeth, seldom da-
mage, e. g. through pitting of the flanks occurs. The load capacity
limit then depends on the strength at the root of the tooth or in the
tooth itself. This is why toothed gear wheels with case-hardenedteeth
normally have fewer but larger teeth.

WEG 81 A 9.2- 17
Gear wheels can, up to a certain size, be produced from forgings.
However, if the diameter exceeds approximately 1500 mm it is more
economical to make the gear rim and the wheel body separately and
then join them together.
A method involving bolting on the wheel rims has provided a good
solution to this. See fig. 13.
Since, however, distortions may arise when heat-treating the gear
rims, it is preferable to design the large wheel for welded con-
struction. In such cases, the wheel body is constructed with a
hub and steel side plates with reinforcements, and welded onto
the gear rim. See fig. 14. The method employed here originates
from the principle used for the large wheels in turbine gears, and
is indeed, most successfully applied with large wheels incoporating
case-hardened teeth. Owing to the rigid connection of hub and gear
rim only slight distortions occur, so that grinding of the tooth
flanks produces only limited wear, this being beneficial to the
uniformity of the hardened case on the tooth flanks.
-. O 'ZI . .Y . >Z-= ' -•.: •--=-•._•
-/
r % • _
Fig. 13 Gear shafts mounted in rollerbearings

WEG 81 A 9.2 -18
Fig. 14 Outputshaft with tilting thrustpad and plain bearings
4.2 Shaft supports
Gear wheel shafts, particularly in small ships' gears, are usually
mounted in roller bearings. Roller bearings have the advantage of
simplicity of installation and also enable both radial and axial
(forces to be absorbed in one bearing. See fig. 15. In large gears,
however, plain bearings are preferred. Unlike large roller bearings,
these are easier to replace, and neither produce nor easen the trans-
mission of sound. The same applies to the thrust bearings which ab-
sorb the propeller thrust. Here, large thrust forces are taken by the
axial bearing with tilting thrust pads. See fig. 16.
4.3 The casing
Whether the casing is made of grey cast-iron or steel depends largely
upon amortizing the pattern costs and hence upon the number of ca-
sings to be produced. For a corresponding design, the two materials
can be regarded as being of equal value. Hybrid constructions,
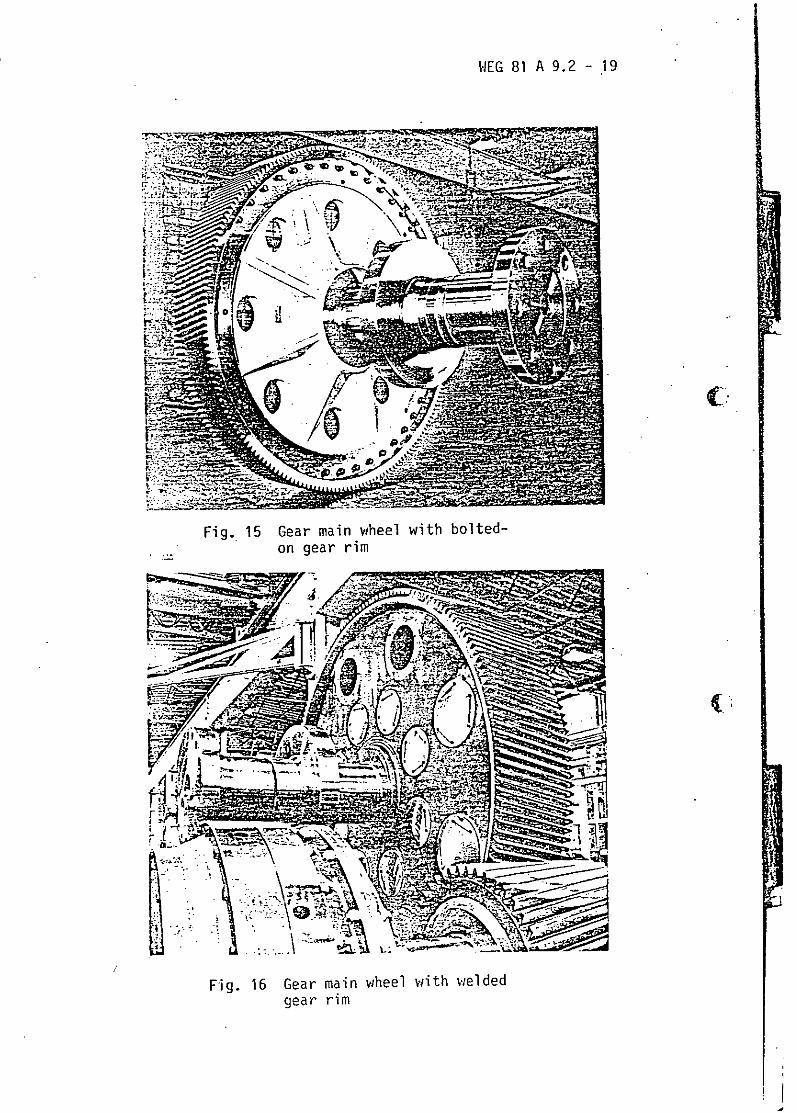
WEG 81 A 9.2 - 19
Fig. 15 Gear main wheel with bolted-on gear rim
AV
w .. \ ...
Fig. 16 Gear main wheel with weldedgear rim

W4EG 81 A 9.2 - 20
Where grey cast-iron is used for the complex shape of the middle
section, whilst steel is employed for the sump and the cover,
have also proved successful.
The way in which the gearbox seating is connected to the ship's
hull is, however, of great importance. Where large areas are in
contact, unavoidable hull distortions may impair the relative
position of the shafts to each other. For this reason, it is bene-
ficial to keep the bottom surface area of the gearbox small. A
strengthened substructure, which transfers a minimumn of distortion
onto the gearbox, should be provided at its seating. Associated
with this is the problem of where to position the thrust bearing:
( integrated in the gearbox casing or arranged separately. The
question essentially becomes one of how the thrust bearing can be
given a high axial stiffness. For if a very large main wheel
necessitates a deep incision in the double bottom, great difficulty
will be encountered in giving the integrated thrust bearing high
axial rigidity. In this case (as is normal in turbine gears) the
*thrust bearing is mounted separately. If, however, the dimensions
of the large wheels can be reduced to the extent that the gearbox
causes no interruption or weakening of the longitudinal hull struc-
ture, the t hrust bearing can be connected directly with the gear-
*box-without causing any adverse effects. The advantages of this*
style of solution are in simpler construction and ease of installa-
tion.
Even if a favourable gear tooth configuration results in minimising
noise, the material and shape of the casing are still significant
factors as regards sound emission. Preference is given to casings
made of grey cast-iron, with its good material damping, in order
to limit noise. The shape of the casing should be such that fre-
quencies containing high amounts of energy emanating from the
toothing do not incitate casing walls to resonance. If it is not
possible to make use of curved surfaces, irregular thickening of the
inner walls of the casing is an alternative and very adequate solu-
tion. With regard to noise emission, in order to match the standard

WEG 81 A 9.2 - 21
of the grey cast-iron casings, welded cases require relatively
thick plating. Should the weight make thisinpracticable, the
casings are designed with double walls, for which stiffeners
provide reinforcement between the inner and the (possibly per-
forated) outer wall. See fig. 17.
It is particularly in ships that special attentionshould be given
to the reduction of vibrations. If a stiff-elastic mounting cannot
be considered, it is worthwhile ensuring that there is sufficient
elasticity between the bearing supports and mounting surfaces of
the casing itself.
Heavy masses on the bearing structures and elastic connections
between these masses and the substructure help to reduce solid
born vibrations.
,..
Fig. 17 Gear box with double wall

Acknowl edgements
The author feels obliged to thank Professor C. Gallin
of the University of Delft for his encouragement, Mr.
K. H. Siefert and Mr. 0. Heiderich of Lohmann & Stol-
terfoht GmbH, for their utmost valuable cooperation
and Mrs. A. Struck for the typewriting of the paper.
(

S
0
0
S
a

Fifth WEGEM TGraduate SchoolAdvanced Ship Power PlantDesign and Operation
CC. Paper A 9.3
Design of pumps and piping svstems
bky
Dipl.-Ing. H. Stannowski
KSB, Werk Bremen

wtu• bI-'At.--"l"
1. Operating limits of centrifugal pumps as a result of
cavitation
When selecting a centrifugal pump you will proceed above all
according to economical aspects. An example is the inquiry for
a main sea water circulating pump for a motor ship.
The pump should deliver:
.0=175 1/s to H =24 m at n = 1750 r.p.m.>
Fig. 1 shows the charateristic curve of a suitable pump.
The operating point lies near the optimum. This guarantees that
the driving engine is as small as possible and that the con-
sumption of energy remains within limits.
After that it must be checked, whether the pump. is suitable
for the suction conditions of the plant. In former times it (9was asked'for the suction lift or the suction head of the pump,
whereas today the comprehensive term "net positive suction head"
NPSH (available) is used. In German literature you will oftenav
find the term NPSHA (A = Anlage = plant) or HHA (Haltedruck-
h6he der Anlage = retaining pressure head).
The unit:2of measurement is the same as it is for the total
head m (meter).
The German term H is defined according to DIN 24 260HA
(Centrifugal Pumps and Installations, Terms, Signs, Units).
The Anglo-American term NPSH is described in the brochure
NPSH in Centrifugal Pumps - Significance, Calculation,
Measurement) of EUROPUMP (European Committee of Pump Manufac-(
turers). Both terms only differ in the reference level.
According to the definition, H refers to the centre of the-HAsuction flange and NPSHav = NPSHA to the centre of the impeller
inlet. In colloquial usage you are often more flexible and
both expressions are used with the description of a real
practical reference point.
This is also valid for the "net positive suction head of the
pump", which is called NPSH (required), NPSH (pump) orrequ. p
in German literature H Nowadays the term NPSH is commonlyH'
used in Germany.
The value NPSH in fig. 1, for instance, refers to the centreP
of the suction flange of the pump. In order to obtain a satis-
factory operation, NPSH > NPSH is demanded.A

Whereas it is possible to calculate NPSHp when designing
the impeller according to empirical values or determine it
later during the test, the plant conditions are calculated
according to the equation: 2 + HPe + Pb - PD ve z geo H
NPSHA + H V S
g 2g s geo
with
Pe = pressure at inlet cross-section of plant
Pb = atmospheric pressure
PDc= vapour pressure of fluid pumped at inlet cross-section
= density of fluid pumped at inlet cross-section
g = gravitational constant
v e flow velocity at the inlet cross-section
H = positive suction headz geo
H = suction heads geo
HVS = head loss in the suction part of the plant
As far as ships are concerned the cooling water normally comes
( from the sea chest, that is, the pressure on the suction side
in vessel pe is eliminated. Furthermore the flow velocity at the
entry ve into the sea chest is normally so small that it can be
neglected. Due to that fact the equation becomes shorter, as you
can see in fig-. 2.
The term NPSH is not clear for itself and needs a more distinct
definition. It has been generally adopted that the characteristic
curves in the offers, which the manufacturers of pumps deliver
for radial centrifugal pumps, show an NPSH - curve, which gene-Prally refers to a 3 % drop of the total head.
In many cases this is not emphasized in particular. NPSH3% is
chosen because it can easily be measured in each test bed.
Most frequently you proceed in such a way that you bring the
suction valve into a special position (for instance half open).
With the wide open discharge valve the pump will possibly run
/3

in cavitation. Then the discharge valve is throttled and step
by step Q,H, and Hs are measured until the original characteris-
tic curve is found. The process is repeated with other positions
of the suction valve.
The NPSH - curve is plotted by all measuring points at3%
which the Q-H-curve already decreased by 3 % from the original
characteristic curve, due to the formation of vapour bubbles.
It is obvious that because of the large quantities of vapour
it is not allowed to continuously operate a pump at an opera-
tion point, in case NPSH NPSHA 3% p
In fig. 3 you see the proceedings of the flow pattern at the 4impeller entry. These patterns are arranged schematically. At
vane 3 the relative inlet velocity w1 is exactly directed parallel
to the centre line of the inlet edge of the vane; thus no schock
takes place. (3
Therefore here we talk of a state of shockless entry, which is
the basis for the calculation of an impeller. The absolute inlet
velocity c1 which is described in the inlet triangle, according
to this, forms the capacity Q stoffrei = shockless (Q shockless)st
which mostly corresponds with Qopt"
If the pump achieves a larger capacity or respectively a smaller
capacity by reducing respectively increasing the total head, the
inlet angle /3I of the vane and the direction of w, do not
correspond any longer with each other (see vane 4 respectively
vane 1).
If in these cases the pump operates within a special low pressure
range it may be possible that cavitation occurs earlier.
Thus it can be said that you have to expect a deterioration of
NPSH to partial load and overload, looking from Qt"p "
At the bottom of fig. 4. the course of NPSHp (NPSH 3%) of the
performance chart, fig. 1, is described.
The more resistant to cavitation a material is, the lower the
permissible NPSH-curve can be plotted.
As an example, you see in fig. 4 the NPSHe -curve, which guaran-
tees a sufficiently long durability for an impeller made of bronze.If the curve NPSHA' which serves here as an example, is present,
you can operate the pump of approximately Q/0stfr. 60 up to 110 %
with sufficient durability of the impeller.

Damages to the impeller are not the only consequences of
cavitation. As far as partial load is concerned strong vibrations
and noise must be expected additionally because of the partial
load eddy which is directed against the incoming flow.
The reason for the fact that the NPSH 3-curve of a radial
centrifugal pump does not rise again in the partial load region
is that the overload separation which lies deep in the impeller
passage clogs the impeller earlier with vapour than the partial.
load eddy which is found more in front (look at fig. 3).
Concerning marine pumps we are in the fortunate position to
provide a pump with a sufficient positive suction head, if
it is installed in the machine room. From experience you know
that in many cases, especially with small pumps, the NPSHA-curve
compared with the NPSH 3 %-curve is situated so high that you
don't have to consider a longer operation at partial load.
However, if we need larger pumps and/or pumps with high specific
speeds and possibly smaller total heads, an NPSH investigationis to be recommended urgently.

WIEG 81-A9.3-5
2. Determination of the operating point of pumps
For the consideration of the operating limits it is
necessary to predetermine the operating point of one or
several pumps of a system as precisely as possible.
This is very easy as long as the system only consists of
one pump and one consumer. Here it is merely important to
calculate the pressure losses of the plant at that capacity
which is supposed to be pumped through the plant, as precisely
as possible. It is evident that this is a problem, as long
as the piping is not yet exactly known. If it finally is, we
find the operating point of a pump at the intersection of
the plant characteristic curve and the pump characteristic
curve.
The determination is not quite so easy, if several pumps of
perhaps different sizes operate in parallel or even if se-
veral consumers are connected with these pumps. As long as
the systems are not branched too much this problem can be
solved relatively easily.
2.1 Total head of pump and plant
As you can see in fig. 5, a pump P works from a vessel e
into a higher vessel a. Both vessels are subject to different
system pressures pe and p The geodetic difference between
the water levels is Hgeo, the loss of mechanic energy in the
pipeline Hv . This loss which is usually called pipe friction Closs, increases practically with the square of the capacity.
According to DIN 24 260 the total head H(Q) of the pump,
due to the similarity of energy corresponds in each operating
point to the total head of the plant H A(Q). This total head
amounts to:
2 2HPaH-- a e V z +a e +Hv
H(Q) = HA(Q) + Z a Ze Hv.g 2g2 2
v -v- In many cases the term a e is neglectably low.
2g

WEG 81-A9.3-6
If v is large, e. g. at an injection nozzle at the enda 2
of the discharge line, Va can be added to the other
2g
friction losses Hv .
-Z -Z =Ha e geo
- To simplify matters the index (Q) can be omitted.
Thus the equation reduces to:
Pa Pe
H=HA g a Hgeo +HV (1)
In the left half of fig. 6 this energy equation is plotted,
referred to an optional datum level BN. The same procedure
is described in fig. 7 in the Q/H-curve.
H is the characteristic curve of the pump, H the characteristicA
curve of the plant. You find the operating point B with the
capacity Q at the point where both characteristic curves meet.
2.2 Reduced characteristic curve HC
A partial problem which always does occur later on, is thedetermination of the energy level at any point C of the plant
system (see fig. 5). This point lies by HgeoI higher than
the suction water level; the friction loss in this part of the
pipeline is H Now the mechanical energy must be found,
which exists at this point, compared to H or HA -
From the right side of fig. 6 you can read:
Pe?
H + - H + H + H1
g geol C V1
H is the residual mechanical energy which is still availableC
to the above C.
ePe
HC = H + - (H + HV) = H + H - HWH g eol Ve 1
H PeC H - W 1 - 9 (2)

WEG 81-A9.3-7
Due to the fact that equation (2) is valid for each point of
the characteristic curve, Hc is the characteristic curve, re-
duced to point C. According to fig. 7, HC is found graphi-
cally by reducing the characteristic curve of the pipeline
ePe
N7l at each capacity Q from the characteristic curve
"W- g
of the pump H.
From fig. 6 you also get the relation:
Pa Pa
HC = Hgeo -HgeoI + H - HVi + - Hgeo2 +HV 2 +• . 99 g(
HC = H W2 +a
As it was to be expected Hw2 + is the remaining charac-g-
teristic curve of the pipeline. It is also registered in fig. 7.
According to equation (3) it intersects HC at the capacity Q.
You can realize this important procedure as.follows: You achieve
the head HC of a pump with the total head H, reduced to any
point C of the discharge piping, by deducting all expenditures
of energy, which occur until this point is reached, from H.
These energies are the static head, by which the point C is
situated above the pump and the friction losses of this portion
of the pipeline. As the action of the pump is supported by the
pressure in the suction vessel, it helps to overcome the neces-
sary energy and is to be deducted from it. If the point C lies
below the pump, the static head as well, is to be deducted.
If Pe is equal to pa' if consequently, for instance, all vessels
are open and are subject to the barometric pressure, the terms
P can be left out.
g
WEG 81-A9.3-8
2.3 Parallel operation of two pumps
Let's suppose that, according to fig. 8, pump P takes its fluid
supply from a vessel el, and pump P2 takes it from a vessel e2.
The discharge pipes of both pumps join and form a common pipe
in point C, which ends in vessel a. Inside the vessels we find
the different pressures pe1' P•2 and . The static head and
the friction loss of both discharge lines are of a different
size; in addition to that the pumps have different capacities.
From fig. 8 you can lay out the two energy equations:
a) H a el + (Hgeol + Hvi) + (Hgeo3 + HV 3 )
gg_ P a - Pe l + H l N
9gPa - e2 + +H HV)+( + V3
b) H12 - (Hgeo2 - V2 (Hgeo3 V3)9 g
Pa Pe2S+ H W2 + HW3g
Both equations are transformed:
Equation a) changes to H. - (HW1 Pel =a + HW 3 HCag g
Pe2 Pa
Equation b) changes to H2 - (H1q2 = W3 2C'.g
They are equivalent to equation (2), therefore they form the
characteristic curves H C and H 2C of both pumps PI and P2'
which are reduced to point C. The construction is carried out in
the same way as shown in fig. 7, in fig. 9, and in fig. 10. Both
characteristic curves H and H2C are still available in the
confluence point, in order to overcome the remaining head energy
up to vessel a. They are transferred to fig. 11. As the capacities
are united in C they are added to the summary characteristic curve
HC = HIC + H2C at H = const.
WEG 81-A9.3-9
PaThe plant characteristic H + , which is valid for
W3 gthe remaining discharge line, intersects the summary characteristic
curve in the operating point B' at the capacity Q, which leads
to vessel a. If you line horizontally to the left, up to the points
of intersection with H C and H2C' you will find the capacities
Q and Q of both pumps P1 and P2 at the operating points B1 ' and
B2'. The points are retransferred into ig. 9 and fig. 10. The
real operating points B1 and B2 can be found in the total charac-
teristic curves H and H2 .1 2*
2.4 Delivery of a pump into two different vessels
In the example previously mentioned, two pumps delivered into a
common vessel. If, in the opposite case, one pump delivers int0C
two different vessels (fig. 12), the same capacity will not
reach both vessels a and a2, due to the different length of the
pipelines, friction losses, and due to the different pressures
in the vessels.
From fig. 12 two head equations are taken:
pal -Pe
a) H a + (H + H) + (H + Hg geol Vg geo2 V2
Pal - Pe + Hwi + HW2
g g
P2- Peb) H =a2 + (H + HV) + (Hgeo3 + Hv3dq.ggeol V e3 VSg
Pa2 -Pe- a2e + HW + HW3
g
Both equations are again transformed into:
Pe Pala) H - (HwI ) = alHW2 + HC
g g
Pe Pa2b) H - (Hwi - = +H = H
gg w3 C

WEG 81-A9.3-1O
Here, as well, the left side is equal to equation (2) , whereas
the right side corresponds to equation (3).
In fig. 13 the construction therefore starts again in a way
that all necessary energies of the lower pipelines are reduced
at Q = const. The supporting effect of Pe is also taken into
account. g -g
In the following, two consumers operate in parallel, which means
that this time the two residual characteristic curves of the
plants are added at H = const. (see fig. 14). This summed up
plant characteristic intersects the reduced pump characteristic,
transferred from fig. 13, at the operating point B' at the
capacity 0 of the pump. If you line horizontally to the left, youfind the partial flows Qand Q2 which reach the vessels aand 21(at the intersection points with the upper characteristic curvesof the discharge lines. According to fig. 13, the total head His found at the operating point B in the characteristic curve H.
In widely branched pipings there are cases, when you first have
to investigate more precisely one way of the system and only thenthe other one. Then it will be possible to form a reduced pumpcharacteristic curve for only one way of a branching. In fig. 15,
like in fig. 14, the pump characteristic curve Hc is ::educed to
point C. In addition to that the plant characteristic curves of jboth pipelines to the vessels a1and a2 are plotted. If e. g. the
.plant characteristic HA is deducted at H =const., which means
horizontally from the reduced characteristic curve Hct YOU getanother pump characteristic, reduced to point C. However, this
is only valid for the capacity directed to yessel a1
H Ca Hc +(a +H11)H~ HCal 3 C A3
As you can see, this reduced pump characteristic curve inter-
sects with the characteristic curve of the pipeline leading to
vessel a1 , at the capacity 01 In the same way H can be sub-l' A2tracted from H Cand the characteristic curve for the pipeline
to vessel 2 is found.

WEG 81-A9.3-11
2.5 Plant with by-pass
One first application of the methods described in chapter. 2.4 is the
by-pass with an adjustable throttling valve, as it is depicted
in fig. 16.
The whole procedure is shown in fig. 17, where we do without a
division into 2 diagrams. The plotted piping characteristic
of the by-pass lWBy + Pe describes One of many possible
g•g
positions of the adjustable throttling valve. It starts at Q 0
with the value Pe - Hgeoi, because Pe acts as counter
•-g " g
I T pressure from point C and Hgeoi is negative. The summation
characteristic curve formed by the by-pass and pipeline 2 inter-,
sects HC in Q, from which the two partial flows a and y result.
The more the throttling valve is closed, the steeper becomes Pethe corresponding by-pass characteristic curve HABy
HWBy +
as well as the summation characteristic curve of the pipeline
i Pe PeHABy + HA2 = qy + . H2 g gf g g
This way the summation characteristic curve Of the pipeline
becomes increasingly similar to the plant characteristic curve
HA2 = 2 + a The capacity Qa' reaching vessel a,•.g
becomes higher; at the same time the capacity Q of the pump becomes
smaller. In case the by-pass is completely closed, the by-pass
characteristic curve coincides with the ordinate and we get the
flow rate Q min at the intersection point of HA 2 = HW2 + Pa
g- g
and HC . Now the characteristic curve of the piping
H A1+2e +H+ H +H can be formed,ijHAl+2 - + Hgeol Hgeo2 + Vi V2
wle gwhich also intersects H in Qm.

WEG 81-A9.3-12
2.6 Mixed plant
Many problems can be solved with the basic constructions dest
cribed in chapter 2.1 to 2.4. Another kind of application should
be shown here, i. e. the delivery of two pumps into two vessels.
The plant is depicted in fig. 18. It is to be determined, which
capacities the pumps 1 and 2 deliver with given characteristic
curves and which parts of flow do reach the vessels a and a2.
According to the figures 19 and 20 in chapter 2.3, the charac-
teristic curves of the pumps H1 and H 2 are reduced to HIC or H1 2C1
to the confluence point C1 . In fig. 21 both reduced characteristic
curves are added at H = const.
The summation capacity is reduced to the point C2 by subtracting
HW3- = Hgeo3 + "V3. Finally, in fig. 22, this characteristic curve
H C2 is intersected with the joined sum of the plant characteristic
curves of piping 4 and 5. At the point of intersection B" there
is the summation capacity which by means of lining to the left
divides into the flow rates Qal and Qa2 reaching the vessels.
Q is retransferred to fig. 21. Above B" there is the operating
point B' on the energy level of point C1 .
On the left hand there are the flow rates Q1 andQ 2 of the two
pumps at the point of intersection of the horizontal line with
the individual characteristic curves HIC and H2Ci. The operating
points B ' and B2' are retransferred to fig. 19 and fig. 20;
above them we find the real operating points B1 and B2 respectively.
2.7 Mixed plant with cross connection
Contrary to fig. 18 the plant in fig. 23 is connected in such a
way that the direction of the water between C and C2 cannot
easily be predicted. Depending on the size of the pumps P1 and P2
or the friction losses in the pipings behind them, water will
flow from C1 to C2 or the other way round.
According to the figures 24 and 25, the construction again begins
with the reduction of the charateristic curves of both pumps to
the confluence points C and C2 respectively. Now it becomes
obvious that the level of the total heads of the characteristic
curves H and H is approximately thesame, but that pump P1iCi 2C21
delivers a higher capacity. Therefore it can be assumed that water
will flow from C to C2 In the case of an incorrect estimation1 2'
we so far have no solution, as later on it is impossible to find

WEG 81-A9.3-13
a point of intersection of the reduced characteristic curves
concerned.
Further construction takes place in accordance with the pro-
cedure in fig. 15. The reduced characteristic curve H was
transferred to fig. 26; the plant characteristic curve
PalH 3 + g is subtracted from it at H= const.'W3 g
The result is the characteristic curve HICla2 , i. e., the re-duced characteristic curve of pump P1 from C1 in the direction
of vessel a2 . You get the reduced characteristic curve HIC2 of
pump 1, related to C2 by subtracting the plant characteristic
curve H5.from this at Q = const.
The capacities with the characteristic curves H C2 and H2C2meet in C2 which can be seen in fig. 27. The point of inter-
section of their summation characteristic curves with the piping
characteristic curve H + Pa2 results in the capacity Qa2'
S'gwhich reaches vessel a2 . When lining to the left, we find on
the characteristic curve H2C2 the capacity Q2 of pump 2 and on
HiC 2 the capacity Q1a2' that is the part which pump 1 delivers
into vessel a2. Q1a2 is retransferred to fig. 26.
As you can see from the arrows, the total capacity Q1 can be
found on Hici, as well as the partial capacity Qa1 on
The retransfer of Q0 and Q2 to fig. 24 and fig. 25 respectively
results in the real operation points B I and B2 of the pumps.
r

WEG 81-A9.3--14
3. Conclusion
Whoever is supposed to design a pumping plant first of all
knows the capacities which shall be delivered from on place to
another. If the design of the piping exists, the static heads
as well as the friction losses are known. As in a branched net
the pumps and the-consumers do influence each other, you cannot
* at once determine the operating points of. the pumps from the
}present data. You are dependent on estimating the operating
points, then selecting appropriate pumps, and calculating the
plant with the characteristic curves according to the procedure
just described. You have to repeat this by changing the charac-
teristic curves as long as the desired capacity balance is
correct.
At the, end you must not forget to check, wh ether the operating
limits of the pumps are kept as far as cavitation is concerned.

0 500 U.-p 159 ,0910 2500 0 3o
ifl~. ~1n 500 2000 2500 3000
50
T
.... . 60
Ito
40 70
120
Opraio Behaiou of________________________________________
Cetiua2PmsFg0
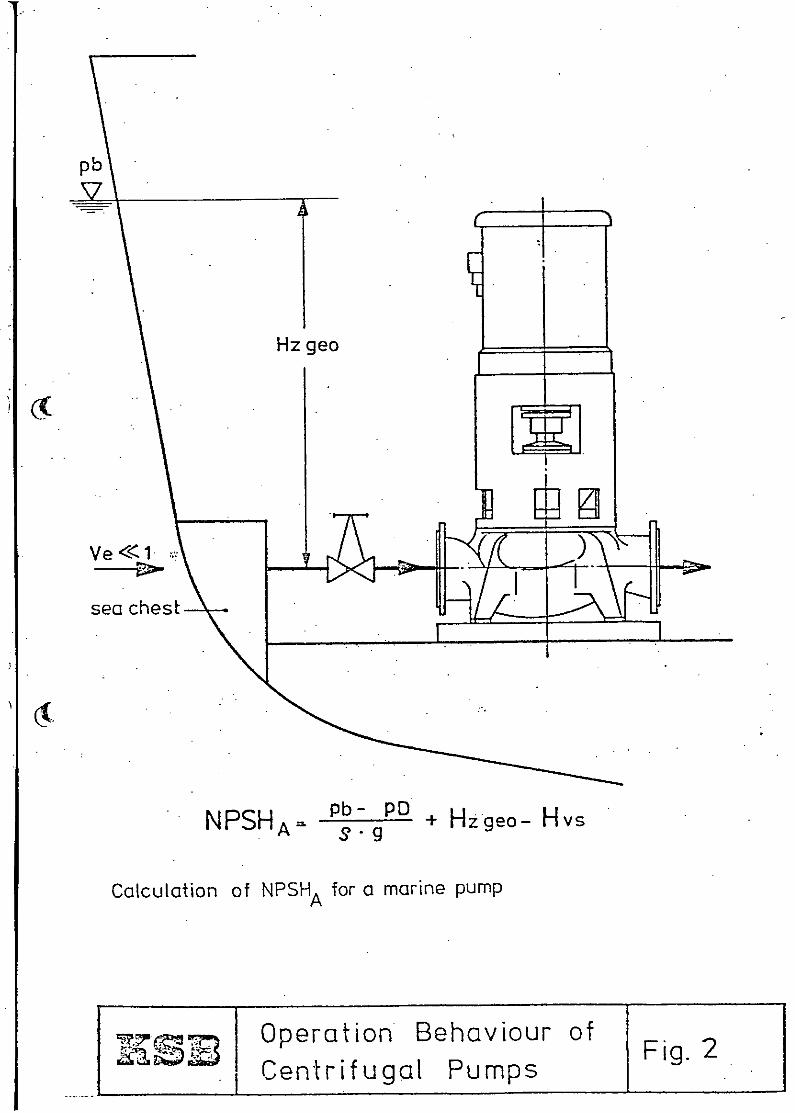
pb
V7z
Hz geo
)V e <<.
sea chest
NPSHA= Pb- PD + Hzgeo- Hvs
Calculation of NPSHA for a marine pump
Operation Behaviour of_ _ Centrifugal Pumps Fig. 2

in case of partial Load.possibility ofseparation on the suction side
• . pressure sideI...f-suction side
S W1
l -at the calculation point (flow without shock
ii
in case of overload.42 possibility of separation.
on the pressure-side
Description of partial load, normal load and over load at theimpeller inlet
-, Operation Behaviour of Fig. 3Z.D 3, Centrifugal Pumps.

NPSH
_permissible forNPSHA impeller made
of Ibronce
.' f/-NPSH 3%/
000t
0 100QO-6- - 100[%]
Schematic description of different cavitation conditions ina pump
Operation Behaviour of- Centrifugal Pumps Fig. 4
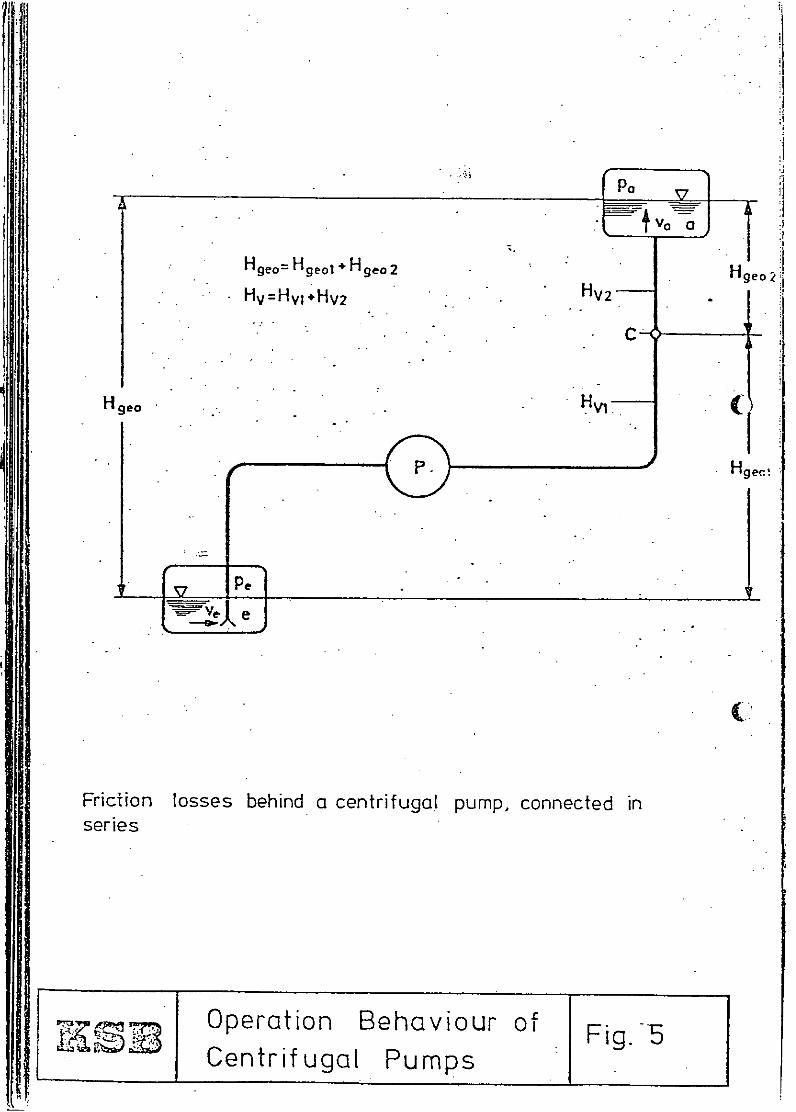
iPO
-. Hgeo=Hgeoi+Hgeo2 Hge
j H gea lVI (
P Hgec-'
Friction losses behind a centrifugal pump, connected inseries
'FANOperation Behaviour of Fig. -5Centrifugal__Pumps _____

A7
\HJ,F - H
HI Hv
H=HA P9
_Reference pointC
- .- -... .IH gos H ge.-i
I Za ZC
Ze
optional datum level BN
Pump calculation according to DIN 24260
77 Operation Behaviour ofSCentIfFig. 6Centrifugal Pumps

HH
HA HAI*IHA42 Pa3
Pc~Pe
- Hgeo
0 fl
-~ Operation Behaviour of* Fg7_______CentrifugalPumps

PPa
I,.oo:
Hgeo3 H V3
( Hvi .Hv2
02t P2 Hgeo2
H geol 01 Pe2 '
r Pei
Parallel operation of 2 pumps
Operation Behaviour of Fig.-8Centrifugal Pumps

HH
HIaH --
Pei-
MA Fig. 9
trtrfu a nsere froufi.p1

H
xii
Pe2I 3.g
Hg.o2I( v-
02 Qtransferred from fig. 11
Operation Behaviour of_______- Centrifugal Pumps

HA*H3 He
P.9
H H.
c I I
02 Q1 Q Q
Operation Behaviour of Fig____ ___ Centrifugal Pumps _ _ _ _

Q2t Hgeoa3
Hgeo2 OtHV3
HV2
*~ atHvi
Hgeoa
Pe
Delivery of dne pump into piping, connected in series
7L~E~B Operation Behaviour of Fg1_______Centrifugal__Pumps _____

HH
VHCtH HAI
Hg..4
Operation Behaviour ofCentrifugal PumpsFi.1

HAZZ al+WJ, Po9 , ,
--l "- + ;HW3
- HA=HAZ+HA3
C / I I ,
Pa2 I \ .
Heo 3 pg I \_,
Hgeo2 ,pg Pal
I I Q2
Operation Behaviour of Fig. 14Centrifugal Pumps

HAZ
H HA3
IH c
~~ Operation Behaviour of Fg1
12Centriflugal Pumps ____
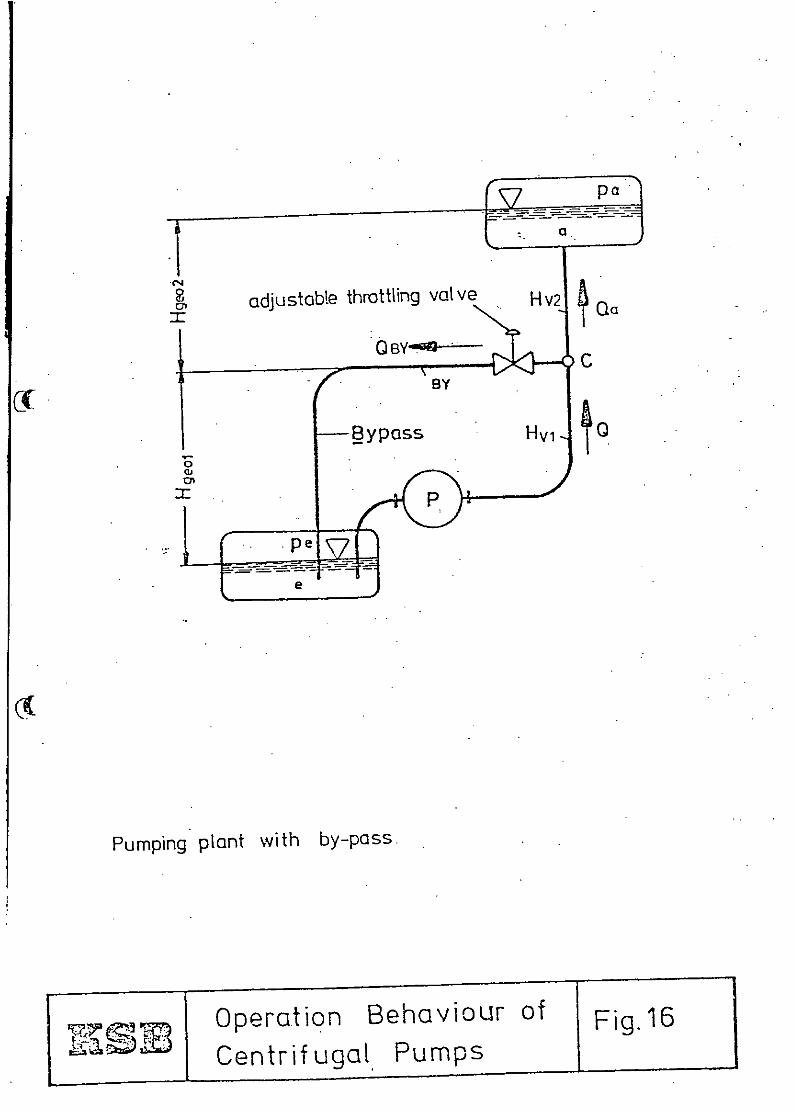
adjustable throttling valve Hv2-- :OBVe% C
BY
Bypass Hvi 0
pe
Pumping plant with by-pass.
Operation Behaviour of Fig. 16
Centrifugal Pumps

B in case of closed
H
IHABY+HA2 I pe01) ~HAI= Hwl - -g
KQa 13 0a Q min Q 0Hgeol-
rgOperaOtion Behaviour of Fi.1Centrifugal PumpsFi.1

C2C~t Hgeo 3 v3
HgeH Ieo
AA
AP2 Hgeo2I
Qv to2i
Mixed plant.
Operation Behaviour of________Centrifugal Pumps Fg1

H
Pel
Nii
BN
Hi
I J
SPel
transferred from fig. 21
7-,k7 Operation Behaviour ofCentrifugal Pumps

H
62
I~ 21
I 2
transferred from fig. 21 I
Id
iour
giOperation Behaviou of Fi.2

H
H ici ,
--~~ .-l-- H ici+ H 2CI
131 Hw3
ii H~oo= I "" H C2lHc l-H1-w3k
H I~eo3H 2C\ 'I
02 Q1 Q
transferred from fig. 22
Operation Behaviour of Fig. 21G 1Centrifugal Pumps

H
HW5+ PPal
H ~Pa2HC
0C02 Oaw
Operation Behaviour of Fig.22Centrifugal Pumps
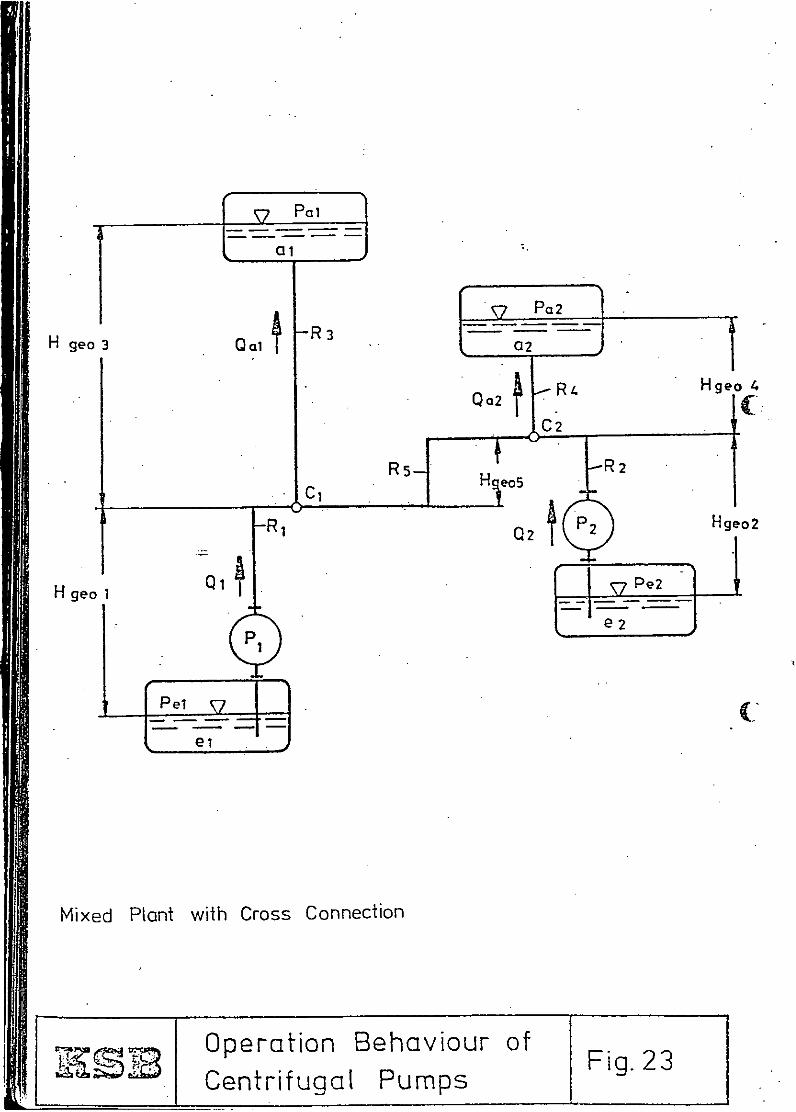
Pal2
H gec 3 Q102
R t.4 Hgeo 4Qa2a R 2
R5 HesR2
R Q2~ P2
H geo 2
H geo 1 Q 7Pe2
e 2
Mixed Plant with Cross Connection
Operation Behaviour of______ Centrifugal Pumps Fig. 23

H
Hwi -Pe"9
tl ' Hi- ,,,\ ' X-9II
transferred from fig. 26
SOperation Behaviour of Fig. 24Centrif ugal Pumps

Hp
ý4
II
HQ 2
tranferrd frm fi. 2
Operaion Bhav'
- TINZIFig.B2
\entrifugalPPump

Hw
.Q10 2 Oci 01
(1 transferred 'from fig. 27 I
Operation Behaviour of Fi.2H r. 3-7_ Centrifugal__Pumps Fig.___26

H
H 2C2
Hw4 P±21
HTc2
IQlcz2 Qz 2 0a2a
FI.2jetiua Pup

A4 S Part Divides02966

Fifth /EL3E/'TGraduate SchoolAdvahced Ship Power Plan tDesign and Operation
p Paper A9.4
Scoop systems for central heat exchangers
for ships
by
o. Prof. Dr.-Ing. G. Groi~mann
1. Introduction
2. Theoretical Evaluation2.1 Scoop Inlet Head*2.2 Scoop Outlet2.3 Head Increase by Velocity Reduction2.4 Scoop Performance Curve2.5 Scoop Resistance Curve
3. Examples and Test Results3.1 Calculation of a Scoop System
4. Conclusions

WEG 81-A9.4-1
Scoop systems for central heat exchangers for ships
1) Introduction
The increasing fuel prices have led to an increasing interest in scoop systems
for heat exchangers on bord of ships, as the electric power operated circulatingpumps can be stopped, when the ship is running at cruising speed, thus reducing
the overall fuel consumption.
With a diesel engine, about 40% of the energy input are going to the propeller,30% leave the ship through the stack and the last 30% are going-into the-cooling water.
A 25 O00 kW motor plant has to have about 3600 m3/h seawater which needs 135 kW for
the circulating pump. .
Already in 1939 and 1.940 Weske [I1 and Hewins/Reilly [2] published test results
and gave practical recommendation for the design of scoop condensers.
Scoop systems convert the kinetic energy of the flow near the hull into static pres-
sure.
Practically, they take the load off the circulating pump and put in on the propeller,
where it is - with a normal torque meter - undetected.
2) Theoretical Evaluation
Fig. 1 shows the arrangement of a scoop cooling system. As the energy of the meanboundary layer velocity is the only energy source, and as this is not a very high
energy source, the system has to be designed for very low pressure losses.The energy of the outside flow is utilized at two points, at the scoop inlet and at
the scoop outlet.
2.1 Scoop Inlet Head
Fig. 2 shows a typical inlet scoop. If we assume that the system is well under the
waterline and that we have no waves - at the moment - then Bernoulli's Law for the

WEG 81-A9.4-2
points "A" and "B" gives
v2 V+ M H + + HG+l0H -2gg- + HE+ RE (1)
H0 = water pressure, depth of scoop inlet below water. line.
HE = static pressure in scoop inlet
HRE= pressure losses in scoop inlet
VGM= mean boundary layer velocity before scoop inlet
• vE = mean inlet velocity
Formula (1) shows that a positive inlet head
HE is achieved.only when
vE < VGM
When no losses would occur, then the inlet head would be
GM-2 .- (curve a) (2)HE =- 2g 2-g
Equation 2 means in any case a deceleration of the flow, which means since we must
have a certain water flow through the cooler, that the diameter of the inlet must
become larger. Unfortunately we definitely have losses in the inlet. The real inlet
head curve is shown in curve b. The difference between these two curves are the inlet
losses HRE.
A typical curve of the pressure head of a scoop inlet is shown in Fig. 2. For easy
operation the head is made dimensionless by the velocity head of the mean boundary
layer velocity vGjand the inlet velocity is divided by VGMdirectly.
2.2 Scoop Outlet
The scoop system can be considered as a hydrodynamically working pump system. The
head was raised at the inlet by decreasing the water velocity. An increase of the

WEG 81-A9.4-3
outlet velocity vA above the inlet velocity vE would mean a decline of the
static head.
At the outlet we can achieve an additional pressure gain only be accelerating the
flow around the outlet, so that the static pressure at the outlet decreases.
V204výH 0 +- =H +HA + 2z1 (3)
VG= real accelerated boundary layer velocity .GM
• 2 12VGM - VGM
H A =. g (4)
as VGMiS per-design greater than VGM HA will be a negative head.
Fig. 3 shows how the flow around the outlet is accelerated by a lip around the for-
ward end of the outlet.
The overall dimensionless head of the inlet and outlet is
ho =hE hA (5)
2.3 Head Increase by Velocity Reduction
If the outlet diameter is not equal to the inlet diameter, then the difference
in velocity will also bring a difference in static pressure.
v22
H _ EE
V 2g 2g (6)
2g2

WEG 81-A9.4-4
With vE > vA we have another positive head added to the system head.
2.4 Scoop Performance Curve
The overall head of the scoop system is
2
HSC = HE - HA + .- D ) (8)- 2g DA
or dimensionless
hsc hE hA + hV (9)
When we assume VGA = VGE then we can replace vA in .Equ. 6 by
VA = VE A ) D0)
(If there is a big difference between the boundary layer velocity.at the outlet
VGA and the boundary layer velocity at the inlet vGE then the head becomes:
V2A + h
hSC hE -hA. GA hv
GE(By this operation all three components of the head are functions of vE/VGAM We
can draw the curve
hSC = f (VEE/VGM
This curve is equivalent to the head-capacity curve of centrifugal pumps, it is
even similar to such curves.
The dimensionless scoop performance curve is valid for any velocity of the ship,
not only for the design speed. This means that the inlet velocity vE and there-
fore the waterflow mv, is directly proportional to the ship's speed.

WEG 81-A9.4-5
PW"AE v = c i vs (12)
and that the scoop head is proportional to the square of the ship's speed
HSC = c2 .v s (13)
Fig. 4 shows a typical set of curves for a main condenser system of a turbine
ship. They give a good indication of the influence of a bigger outletdiameter(
on the overall head. We can see, that the head maximum is at VE/VGM= 0,8
so if the system mustutilize the maximum possible head, then the inlet velo-
city vE should be above o,8 vGM*
We can further see from Fig. 4 that with
DE/DA = 0,707A h/D = 0,5 and VE/VGM =85
the biggest component of the overall head is the velocity head.
hv 0,62-h , h E 0,2 hG, hA = 0,3"hG, hSC = 1,12hG G
h G (14)hG = g•
2.5 Scoop Resistance Curve
At service conditions, the scoop head and the scoop resistance will be equal.
h sc =hR (15)

WEG 81-A9.4-6
As there are only friction losses in the scoop system, the resistance will be
of the form
HR _-C1i v2 "1 (16)
or 2
or -Ci vi (17)
hR= 2vGMI2 g
The highest resistance is found in the cooler tubes. Shipboard measurementes
(showed this resistance to be
HK =KC'+ K ' (18)K dik 2g
vK is the velocity through the tubes, it-is directly related to the inletAE
velocity vE. VK0 = VEO A K 2
XK A½hK H :{CK + - .1 -] 2 (19)
K HG dik K VG
v EO= inlet velocity at design point
VK0 = velocity through condenser tubes at design point
AK = condenser tube flow area
AE = flow area of inlet tube
1 = length of condenser tubes
dKi= inside diameter of condenser tubes
X K =fricion coefficient for condenser tubes
K
C = faktor for pressure losses at tube entrance
K
For the inlet pipe system including the water box
hRE = 0,23 VGM V (20)
was found.

WEG 81 -A9.4 6 a-
Figure 6
Dhieinsionhess Boundar' Layer 7hickncss at Svco !oBaitsd 0. HS7'4 - ;71"/53 - rpr
0.0161,.*
P 0,2strj
C,0:4
P,v,,Id's NO. R?,
Fig 5 .Scoop and Resistance Curvesý Fig.?7
H hF h - fl~WS)
2 LV "SC 016 A~*3f
0,5 0, z
0' I Veloci~y head hv -
q,4
0,6Quite head hA 0,2 h~ ''. i
2) hA.
0,4--
o, 47 ý. A8 " 6

WEG 81-A9.4-7
When there are different diameters in the inlet pipe system the
inlet losses become
2
hRE CEl + CE2 ( DE1 (21)DE2. • -(1
The outlet losses are smaller i than the inlet losses. (The flow in the
water box is accelerated and the outlet losses from the tube are smaller than
the inlet losses).
fA~ 2 g(2 vE 2 DE 4 V E 2(22) hRA = C4'( vA ,)2= C4(-- ) -.A (- E C -C(-- ).-(-)•,(2VGM v E . VGM A DA vGM
With the outlet diameter bigger than the inlet diameter, it is sufficient, if
we calculate with the overall pipe losses
v 2
hRp 0,25 E (23)SVGM
With thi•, the overall resistance is
2 K A 2)(24) h= hRp+ hRK = (CE +c.i'iiE}
A 2X K dlk A VGMA -c G
In Fig. 5 we have drawn the resistance curve hR and the scoop performance curve
hso for a lip hL = 0 '5 DA and DE = 0,84-D A
The resistance curve is rather steep.
If there is an increase is resistance - for instance by barnacles and/or
plugged tubes - then a 20% resistance increase will cause a 10% flow decrease.
I would like to stress the point, that for any ships speed, the service condi-
tions for the scoop system are represented by the point.
hSC = hR

WEG 81-A9.4-8
This means that the coolant flow through the condenser is directly proportionalto the ships speed whereas the scoop head is proportional to the square of thespeed of the ship. This is the same characeteristic, as we find them with cen-trifugal pumps.
3. Exam Test Results
3.1 Calculation of a Scoop System
Main engine fresh water cooler for a 1600 kW diesel engine.
At design power, the cooler needs a seawater flow of C"
Q = 280.m3/h
This includes the cooling water for 1 diesel generator.
The ships sp6"ed at 1500 kW is
v .= 12,9 kn = 6,17 m/s
Distance from bow
Is 75m (
Reynolds number
Re =4,7 -.108
Dimensionsless boundary layer at scoop (calculated with a friction coefficientACp = 0,2.10) (Fig. 6)
-8= 0,0151Is

WEG 81-A9.4-9
Boundary layer thickness 1,6x =(-)1S 1,14 m
Height of virtuel lip .is S 2
YE 1/3 •E 1/3 D- 0,295 D
DE estimated 300 mm, DA= 300 mm
= ,09[i] _ yoYE = 0,089 [m 1x =,0,0775 Yx
The boundary layer velocity is( Y 1/7.
Mean boundary layerKvelocity between y = o and y = yo
yo V,. YO.Y /S1 /7 v., 7 •/V611 (-y--vr) dy=is--pnYY 8 x
We can calculate the velocity head of the mean boundary layer velocity.2 2 v
~C 271S7' Yo21•;'-Hm = 2V6M - 72VS . -LT -) =0.777 VS (.--igin 2g 8 2g '' 2g '5x
For the cooler, the mean boundary layer velocity is
VGM = 3,72 m/s
With these values the velocity head of the boundary layer velocity becomes
!ApHG = 2g = 0,709 m WC
With A = 0,0794 m2 , AE.= AA = 0,0707 m2KE A
CA = CE = 0,3; A. = 0,045, 1K = 1,12 m, C' = 0,8
the resistance of the cooler becomes
hK = 3,49 (VE/VG)
With the resistance of inlet- and outletpipes - including butterfly valves and bends
hRp : 0,84 (vE/VGM)2

WEG 81-A9.4-10
The overall resistance of the scoop system is
hR = 4,33 (vE/vG 2
The service point was according to the calculation at
VGM =0,323VGM ".
This means an inlet velocity of v= 1,20 m/s and a cooling water flow of
Q =305M 3 /h. (
The scoop-cooler was designed for the M.V.'Ymir, built at Werft Nobiskrug.Sea trials were on May 7 aid 8, 1980. The design conditions were:
See water inlet temperature 32°C
See water outlet temperature 380C
Freshwater inlet temperature 800C
Freshwater outlet temperature 40°C
Margin for cleaness 15%Heat load 7 200 000 kJ/h
The cooler arrangement is shown in Fig. 1.
At the sea trial, the sea water temperature was 8 -. 10C, so there was a great
safety margin, which allowed several tests.
The scoop cooler stayed'in operation during the crash-astern manoevre and wasworking satisfactorily with reserved flow at full astern power. At "half astern"
the back flow was not good enough, so the pump had to be activated. (This test
could be done only on account of the low sea water temperature).
After the anchor trials the ship was started with the sea water cooling pump
inactivated. The scoop cooler performance was satisfactorily.
At 4 different ships speeds, flow measurement were made. They show, that the

WEG 81-A9.4-11
water velocity at the scoop inlet is proportional to the ships speed, where
as the scoop head increase with the sqaure of the ships speed.
Fig. 8 as stated in Equ. (12).
It can be seen in Fig. 7, that the measured water velocity at design speed was
vE = 1,27 m/s. and the pressure loss over the cooler was HK = 0,380 mWC. Com-
pared with the calculated velocity of 1,20 m/s and HK C,36 mWC these are
rather fair test results.
( 4. Conclusions
A scoop system for the sea water cooling system for motor ships is an inexpensivebut effective installation, to lower the electric load at "full away" load con-
ditions of motor ships. In the case of MS "Ymir", the electric load was decreased
from 125 kW to 100 kW, which means a saving of 20%.
List of Symbols Indice
A Area m 2 A Exit
H Pressure Head m WC E Entrance
h Pressure Head, dimensionsless G Boundary layer
c coefficiente R Friction
g gravity constant V Velocity
v velocity K Condenser
D Diameter L Lip of outlet scoop
n number (of condition tubes) P Pipe
L Length of ship S Ship
1 Length of condenser tubes
C Coefficients for friction o design conditions, zero conditions
Acp Friction Coefficient sc scoop
k Friction Coefficient
h height of lip
Y Boundary layer coordinate
6 Boundary layer thickness
a Volume flow
I.

References
[1 Weske 1939 probablySNAME
12] Hewing, ReillyCondenser Scoop DesignTrans. Actions SNAME 1940
131 English, J.W.Naval Architect, Jan. 1974
[4] HOTrial Trips Recordsespecially Esso Malaysia
[5] Bremer VulkanTest ReportVWS (unpublished)
.6] HSVA Test Reports for HOW(unpublished)
1i 71 R.' U•torreOperational Considerations for Designing MachineryCondensers - Condenser Scoop SystemsISME Tokyo 1978
I

Fig 2 Scoop Inlet Head
/B B
ý,r' ý5
A-.- - YE ()x
0. 12 0.6 0.8
Fig 3 Scoop Outlet Heod
I VA H -hM M Fig 4 5coop Curves
V 2
D 1890 ,2I "
'575 r, "ll
II
hA 1 2600h h
I' Ii I II 4IoA, j I I I L I4
- 0o 2 0,4 0,6 0,,
09 0,2 0,0 0.6 6 08 1Ev Z20/' 2,4..
A tAIVGA


