II-SDV 2015, 21 - 21 April, in Nice
38
Graph & Maps Visualization Using Open Source Components Patrick Beaucamp [email protected] www.bpm-conseil.com Stéphane Mure [email protected] www.thermolabo.com II-SDV, Nice 20 th April 2015
-
Upload
dr-haxel-cem-gmbh -
Category
Internet
-
view
799 -
download
1
Transcript of II-SDV 2015, 21 - 21 April, in Nice

Graph & Maps Visualization Using Open Source Components
Patrick [email protected]
Stéphane [email protected]
www.thermolabo.com
II-SDV, Nice 20th April 2015

Presentation Agenda
Open Source Graphs & Stat Graphs
Open Source Maps
Demo Platform : AklaBox
Demo Platform : Thermolabo

Open Source Maps – The Origin
Discovery of Cholera – 1854 (John Snow)
http://en.wikipedia.org/wiki/1854_Broad_Street_cholera_outbreak

Open Source Maps – Useful Maps everywhere
Bicycle Accident in Street : who is taking care of trafic management
Example in Boston : http://www.boston.com/bostonglobe/editorial_opinion/blogs/the_angle/2010/12/bike_crash_map.html

Open Source Maps - Overview
Maps as a Service- Support for standard : Wsdl, Open API- Possibility to publish your own Map (Building)
Maps Coordinate- GPS, Lambert, KML, …
ReferenceNokia : https://www.here.comOSM : http://www.openstreetmap.orgGoogle : https://www.google.comApple : https://mapsconnect.apple.com
http://www.osgeo.org/mapserver
Commercial : http://www.esri.com/software/arcgis/arcgisserver

Open Source Maps – Boscolo Map

Open Source Maps - OpenStreetMap
https://www.openstreetmap.org/
OpenStreetMap (OSM) is a collaborative project to create a free editable map of the world. Two major driving forces behind the establishment and growth of OSM have been restrictions on use or availability of mapinformation across much of the world and the advent of inexpensive portable satellite navigation devices.
Created by Steve Coast in the UK in 2004, itwas inspired by the success of Wikipedia and the preponderance of proprietary map data in the UK and elsewhere
Open Source Maps – OpenStreetMap Advantage
https://www.openstreetmap.org/
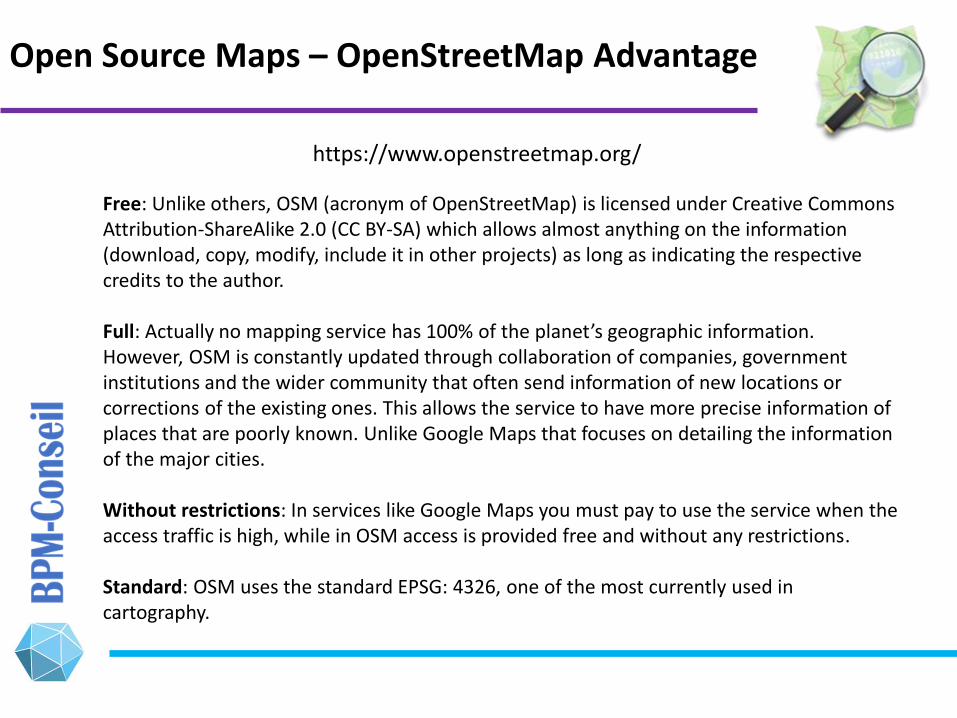
Free: Unlike others, OSM (acronym of OpenStreetMap) is licensed under Creative Commons Attribution-ShareAlike 2.0 (CC BY-SA) which allows almost anything on the information (download, copy, modify, include it in other projects) as long as indicating the respective credits to the author.
Full: Actually no mapping service has 100% of the planet’s geographic information. However, OSM is constantly updated through collaboration of companies, government institutions and the wider community that often send information of new locations or corrections of the existing ones. This allows the service to have more precise information of places that are poorly known. Unlike Google Maps that focuses on detailing the information of the major cities.
Without restrictions: In services like Google Maps you must pay to use the service when the access traffic is high, while in OSM access is provided free and without any restrictions.
Standard: OSM uses the standard EPSG: 4326, one of the most currently used in cartography.
Open Source Maps – OpenStreetMap Advantage
https://www.openstreetmap.org/
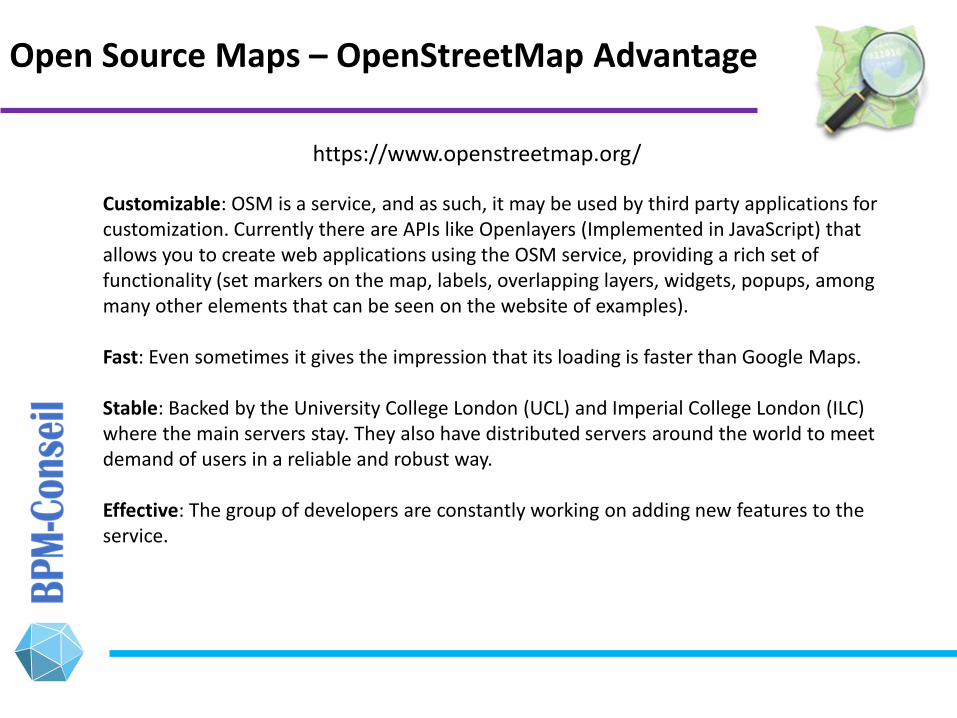
Customizable: OSM is a service, and as such, it may be used by third party applications for customization. Currently there are APIs like Openlayers (Implemented in JavaScript) that allows you to create web applications using the OSM service, providing a rich set of functionality (set markers on the map, labels, overlapping layers, widgets, popups, among many other elements that can be seen on the website of examples).
Fast: Even sometimes it gives the impression that its loading is faster than Google Maps.
Stable: Backed by the University College London (UCL) and Imperial College London (ILC) where the main servers stay. They also have distributed servers around the world to meet demand of users in a reliable and robust way.
Effective: The group of developers are constantly working on adding new features to the service.

Open Source Maps – OpenStreetMap, to be improved
https://www.openstreetmap.org/
Documentation: The official documentation is not complete and not very clear. Many times we must search in forums and blogs to understand some functionality.
Incompatibility: Some users have reported OSM erroneous behavior when it is used in conjunction with other tools. For example: Maps are displayed distorted when OSM is used with Twitter Bootstrap. However, this bug is easy to fix (we will share the solution in another article later).

Open Source Maps – Local Map (Philippines)
http://www.accu-map.com/(Google, Nokia)
http://www.paperlesstrail.net/OpenStreetMap
Road definition, using Google Maps in parallel
Problem with street naming (some meters of difference)
Problem with Google Maps Api : like 100m or 500m of difference (still accurate ?)

Open Source Graphs
Chart Engine : Birt Chart library, FusionChart, Google Charts, JFreeChart, etc …
ReferencesBIRT Chart http://eclipse.org/birt/Google https://developers.google.com/chart/FusionChart http://www.fusioncharts.com/Jfree Chart http://www.jfree.org/jfreechart/
Commercial : http://www.highcharts.com/

Open Source Graphs – FusionChart
API, JSon and Xml supportFree Version, Trial Version

Open Source Graphs – JFreeChart
Easy to installNo development studio

Open Source Graphs – Google Chart
You need internet access to have it up & running
Collection of information (IP address, Web browsing history, etc …)
Tracking is everywhere with Google …
Change in contract for API : not anymore available (ex : api for google translate)
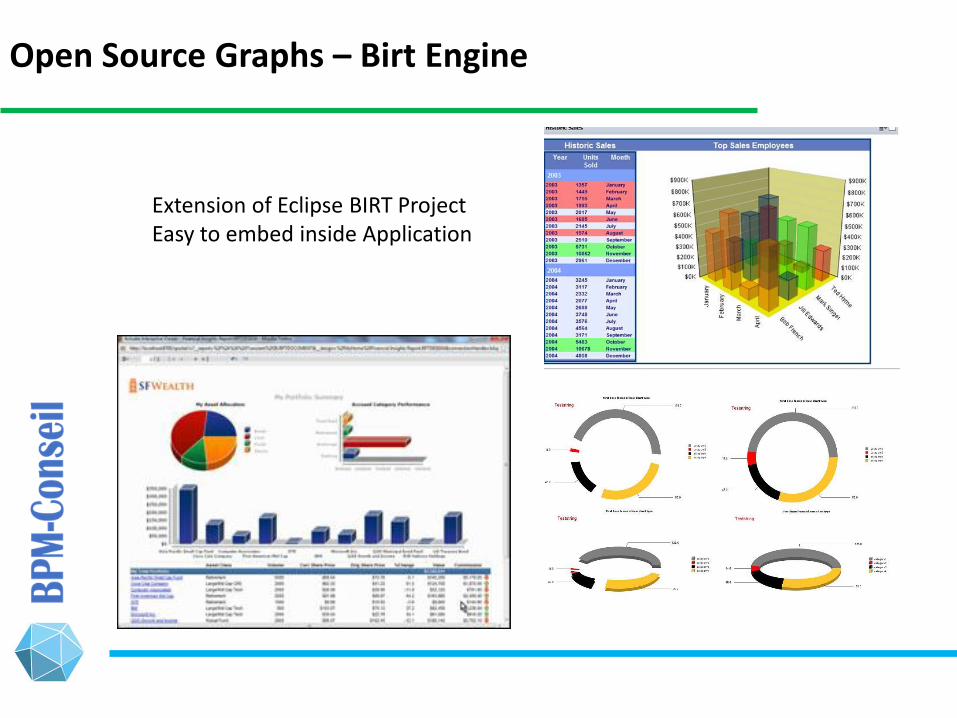
Open Source Graphs – Birt Engine
Extension of Eclipse BIRT ProjectEasy to embed inside Application

Open Source Statistical Graphs
Statistical Graph : R, Weka, R-Shiny

Stat Graphs - R
3D Scatter Plot ->
<- Graph Plot 3D

Stat Graphs - Weka
K-Means ->
<- Decision Tree
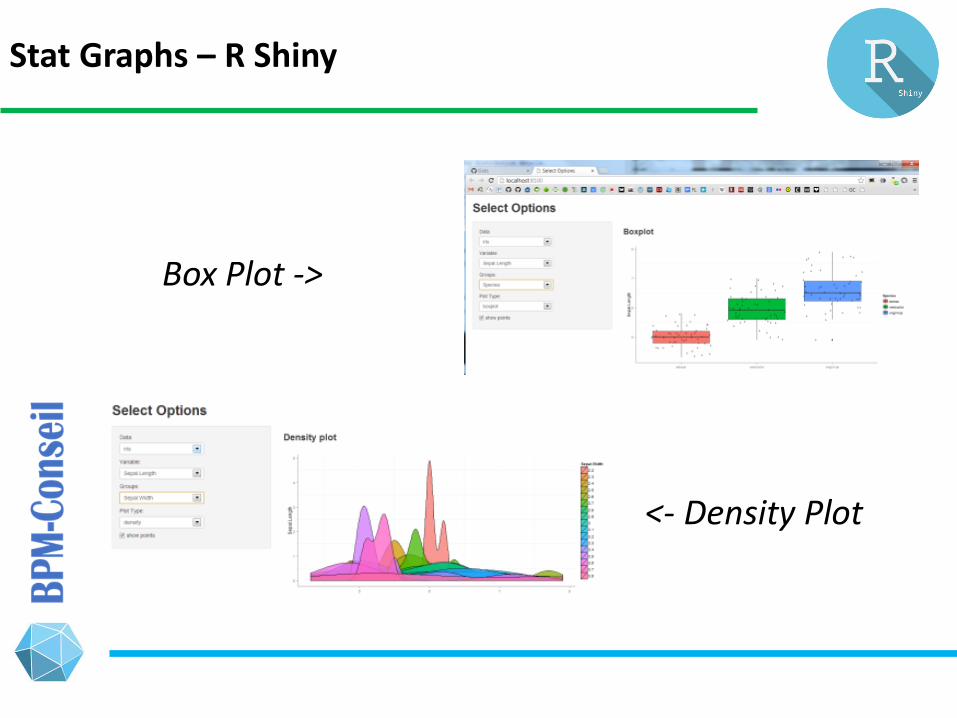
Stat Graphs – R Shiny
<- Density Plot
Box Plot ->

Stat Graphs – 3DPlot + R Shiny
http://blog.snap.uaf.edu/2014/01/07/r-shiny-plot3d-rgl-images-only/

Stat Graphs – Others : FreeMind, Go JS
http://freemind.sourceforge.net/wiki/index.php/Main_Page
http://www.gojs.net/latest/index.html

AklaBox
Document ManagementRecord ManagementMail Management
www.aklabox.com

AklaBox
Certified on Cloudera & HortonWorks
Run on Hadoop :Solr/Cloud, Hdfs ...
Ready for OpenStack

AklaBox, Graph Integration
User Dashboard to visualize type of
document
Admin Dashboard to visualize document
and user activity

AklaBox, Maps Integration
<- Static Map
OpenStreet Map ->

AklaBox, Mind Map Integration
<- Mind Map with Word association
Search Highlight -> inside document
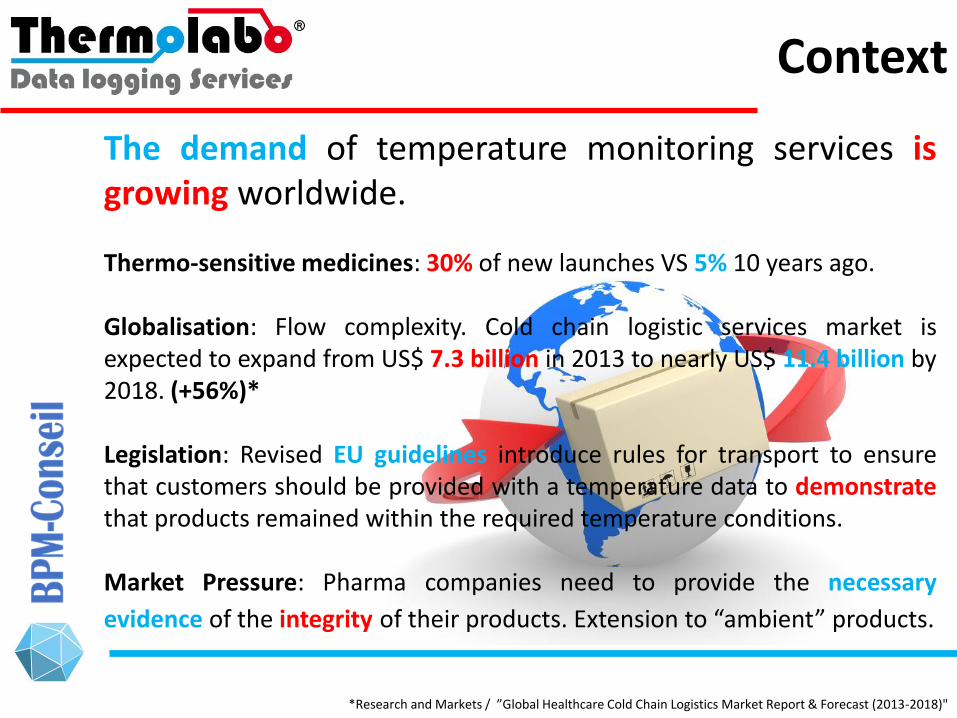
Context
The demand of temperature monitoring services isgrowing worldwide.
Thermo-sensitive medicines: 30% of new launches VS 5% 10 years ago.
Globalisation: Flow complexity. Cold chain logistic services market isexpected to expand from US$ 7.3 billion in 2013 to nearly US$ 11.4 billion by2018. (+56%)*
Legislation: Revised EU guidelines introduce rules for transport to ensurethat customers should be provided with a temperature data to demonstratethat products remained within the required temperature conditions.
Market Pressure: Pharma companies need to provide the necessary
evidence of the integrity of their products. Extension to “ambient” products.
*Research and Markets / ”Global Healthcare Cold Chain Logistics Market Report & Forecast (2013-2018)"
We support Qualified Persons, Directors ofQuality and/or Logistics who want todemonstrate their compliance with regards totheir obligation of temperature traceabilityduring transportation of healthcare products.
We are an innovative service company in data-logging operations
In a glance…

From Monitoring to Data logging Services
Monitoring Data logging Services
Dataloggers Life Cycle management
Data Analysis
Data Processing
Data Storage
Data Analysis
Data Collection
DataManagement
OperationsManagement
Multi- Brand Devices or
Systems

The way it is now…
Low performance
Paper-based process &Single record approach
High risks

Transforming raw data into high value decision process information +
Data-logging : Challenge
Thermolabo Web Platform
-Providing affordable solutions
-Removing operational constraints
- Anticipating market evolution/demand
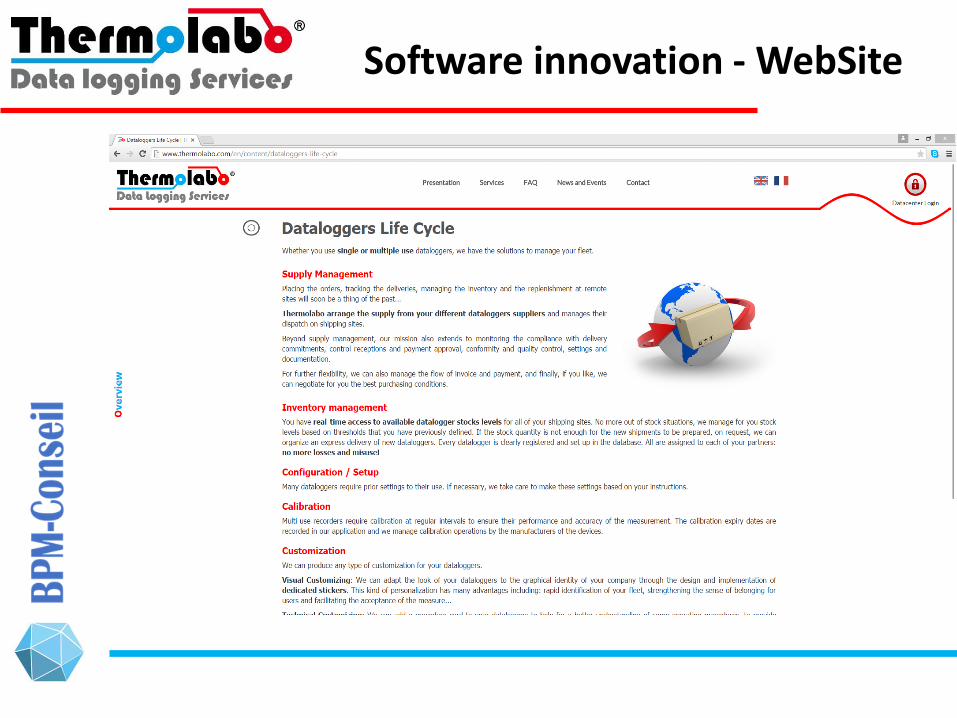
Software innovation - WebSite

Software innovation - Graph

Software innovation - Maps

MapsNokia https://www.here.comOSM http://www.openstreetmap.org/Google https://www.google.comApple https://mapsconnect.apple.com/
ChartsBIRT Chart http://eclipse.org/birt/Google https://developers.google.com/chart/FusionChart http://www.fusioncharts.com/Jfree Chart http://www.jfree.org/jfreechart/
StatsR http://www.r-project.org/Weka http://www.cs.waikato.ac.nz/ml/weka/R Shiny http://shiny.rstudio.com/
PlatformsAklaBox www.aklabox.comThermolabo www.thermolabo.com
References


Lucky One !