II - Defense Technical Information Center · te thce PART II: MAT•IALS, MIXTUIRES, AND TEST ......
38
AD-752 803 DYNAMIC AND STATIC TESTS OF PLAIN CONCRETE SPECIMENS, REPORT I R. L. Lundeen Army Engineer Waterways Experiment Station Vicksburg, Mississippi November 1963 II DISTRIBUTED BY: National Technical Information Service U.S. DEPARTMENT OF COMMERCE 5285 Port Royal Road, Springfield Va. 22151
Transcript of II - Defense Technical Information Center · te thce PART II: MAT•IALS, MIXTUIRES, AND TEST ......

AD-752 803
DYNAMIC AND STATIC TESTS OF PLAIN CONCRETESPECIMENS, REPORT I
R. L. Lundeen
Army Engineer Waterways Experiment StationVicksburg, Mississippi
November 1963
II
DISTRIBUTED BY:
National Technical Information ServiceU. S. DEPARTMENT OF COMMERCE5285 Port Royal Road, Springfield Va. 22151

,/
DYNAMIC AND STATIC TESTS OFPLAIN CONCRETE SPECIMENS
E
CNý
MISCELLANEOUS PAPER NO. 6-609
November 1963r ~I i
• ,• ;.. , . .- .. ' ,•
U. S. Army Engineer Waterways Experiment StationCORPS OF ENGINEERS
Vicksburg, MississippiARMY.MRC VICKSBURO. MISS.

PREFACE
The funds for this investigation were provided by Army Materiel
C!ommand for an in-house research and development project to be designated
by the Director., U. S. Army Engineer W~aterways Experiment Station (WES),
Vircksburg, Miss. The authorization for the project is contained in a memo-
randum to the Chief, Concrete Division, from the Director, W.ES, dated 16
November 1962., subject, "New R and D WIork - FY 1963."1
' ~This work was conducted by the Concrete Division., W'ES, under the
supervision of Mr. T. B. Kennedy, Chief. Staf.'f members actively concerned
with the investigation included 1-11essrs. James M. Polatty,, W'. 0. Tynes,
i K. L. Saucier, and Pfc. R. L. Lundeen. The investigation was under the
i direct supervision of Pfc. Lundeen iho also prepared this report with
S' assistance in analysis of data from Mr. Saucier.
lie I
I Director of tor this investigation and pre-
,paration and publication of this report was Col. Alex G. Sutton, Jr., CE.
Technical Director was Mr. J. B. Tiffarry.
34044supervision of-Mr. . B. Kennedy, Chief. Staf. members actively. o ncerne

CONTENTS
i}iEFTACE .i ...........
....I.'J*1A..Y ..... .... . . .... . . . . . . . . vii
I'ART I: INTRODUCTION . ........................ 1
Background . . . . . . . . . . . . . . . . . . . . . . . . . . .Purpose and Scope of Investigation .............. 1
}'ART II: MATERIALS, MIXTURES, AND TEST SPECIMENS .......... 3
Materials . • . . . . . . . . . . . . . . . . . . . . .. . 3Mixtures ..................... ............................ 3Test Specimens "........................ 3Strain Gages .............. ............................. 4
11PAR1T III: TEST MLTHODS, APPARATUS, AND PROCEDURES .... ......... 5
Static Tests .. ....... . . o . . . . . ........... 5Dynamic Tests ................................ 7
PART IV: RESULTS ......... ......................... . . . .. o 11
SCompression Tests 11Tensile-Splitting Tests .................. 12Flexure Tests ......................... 12Test Methods ................ ............................ 14
PART V: SUMARY OF RESULTS ................................... 15
REFERENCES .................................. 16
TABLES 1-5
PLATES 1-5
APPE1NDIX A: ME•THOD OF TEST FOR STRENGTH OF CYLINDRICAL CONCRETESPECIMENS LOADED AXIALLY BY IMPACT ............ Al Al
APPIDDIX B: METHOD OF TEST FOR STRENGTH OF CYLINDRICAL CONCRETESPECI4ENS LOADED DIA.IETRALLY BY IMPACT ......... Bi
WIL4
Ct
- .'

• I. The effect of th'e rate of application of load on the compressive,
S' 0t.,;:ile-splitting, and flexual strengths of specimens from three concrete
• ztdytures having static compressive strengths of approximately 2000, 3000,•-'1 ,.hIOCO psi., respectively., vas investigated. The test specimens were castl-l/2- by 3 y e -by 6-in. cylinders., and 6- by 6- by 20-in.
wcas,•hich w;ere tested in compression, tensile splitting, and flexure4r•.,opectively. Dynamic loading of the specimens was accomplished writh ther.1pid-loading MIT-11-MS gas-operated impact machine. Resistance-wire strainj;ages were bonded -to the concrete specimens used in the compressive andtoensilc-splitting tests to obtain stress-strain relations. Static tests
A
w:ere made on a hydraulic testing machine.
The corxpressive, tensile-splitting, and flexural strengths of theconcrete were higher under the high rate of loading than under staticloading. For all three strength levels, the ratios of dynamic to statictrenth efere approximately 1fapl .t4,i and 4loa for compressive, tensile-: -plitting, and flexral strengths, respectively. The ratios of dynamic tostatic hodulus of elasticity obtained in the tensile-splitting and compres-sion tests varied, but generally could be considered as being c:a.
R12producible test methods and proceduresy li dtes an d 6- b6b2rmin-Ing the dynamic compressive and tensile-splitting strengths of concrete.These methods are given in Appendices A and B.
viii
t7
-•nocsltigtsc.t bansrs-tan eain.Sai et
~zcr mad ona hyraulc tstin macine

117
DYNA14IC AND STATIC TESTS OF PLAIN CONCRETE SPECf41NS
PART I: INTRODUCTION
Background
1. In the field of dynamic testing of concrete specimens a limited
?:.~,: t of vork has been done using slow rate-of-loading equipment. In
3wwctigations to date of the effect of rate of loading on the compressive
Strngth and elastic properties of concrete, )314)7)8* either a weight re-
,as-ed at a height to fall on the specimen or a hydraulic testing machine
rw' at full speed has been used to apply the load. Watstein7-'' attained a
:::ax:ilum stressing rate of I psi. per 10 sec using a dropped weight as com-
ja•,,d to a rate of 1 psi per 0.5 X 10- sec attained in compression testing
.t the '.xteriays Experiment Station. This investigation was conducted
.t,.iizing a gas-operated impact-h mp.er apparatus for the purpose of adding
to .resent knowledge on dynamic testing.
2. The value for dynamic compressive strength of concrete fd iscd itzu:ally taken as the static compressive strength fV multiplied by 1.3. It
CIis believed that this value was developed in tests, in which a loading ap-
;,aratus having a relatively slow rate of loading was used; thus it may not
be valid for rapid loading tests. In addition, there is no standard pro-
cedure for dynamic testing such as exists for static testing.
Purpose and Scope of Investigation
3. The purposes of this investigation were (a) to develop reproduc-
ible test methods and procedures for testing concrete specimens.of differ-
ent strengths at high rates of loading, and (b) to determine the dynamic-
!'itatic strength and elastic moduli ratios for the different concrete
3trengths used. l
4. The investigation consisted of laboratory tests in which the
* Iaised numbers refer to similarly numbered items in tha list of refer-
dices at the end of text.

• -- " '''!
2
ýWS-nodflfed MIT high rate-of-loading apparatus was used to investigate thecomr-prcrsivc, tensile-splitting, and flexural strengths of concrete speci-mens under dynamic loading, and a hydraulic testing machine was used forstatic loading. Stress-strain relations were obtained in the compressiveand tensile-8plitting tests.
F
:.. . . . .. . .. "." ." I,. :• •- ,"~" . •. -"•

31te thce PART II: MAT•IALS, MIXTUIRES, AND TEST SPECIMINS
eci-
for Materials
Tive
5. The materials used in the concrete test specimens consisted of
.. port--land cement manufactured in Alabama, and crushed-limestone fine
.3nAd coarse aggregates obtained from Tennessee. The air-entraining admix-
ture used was laboratory-stock, neutralized vinsol resin solution.
Mixtures
6. Three concrete mixtures, designed to produce a low-, a medium-,
and a high-strength concrete, were proportioned to have a slump of 1-1/2
in. (+1/2 in.) and an air content of '.0 percent (±0.5 percent). The
maximum-size aggregate used was 3/8 in. The mixture proportions are given
in tablu 1. The concrete was mixed in a tilting-drum mixer of 16-cu-ft
capacity. Water, coarse aggregate, cement, and fine aggregate were added
in thab order in the mixer. The concrete was mixed for 2 mmin, allowed to
rest for 3 min, and remixed for 1 min.
Test Specimens
7. Three rounds of each of the three mixtures (low, medium, and high
strength) were cast. From each round, 15 of each of the following three
types of specimens were cast, twelve for dynamic testing and three for
static testing for comparison. The small size of the compression-test
specimens was dictated by the limited capacity of the dynamic testing
machine.
a. 1-1/2- by 3-in. cylinders for compression tests.
Sb. 3- by 6-in. cylinders for tensile-splitting tests.
c. 6- by 6- by 20-in. beams for flexural-strength tests.
8. The specimens were consolidated in the molds. The consolidation
times used were 5 sec for the 1-1/2- by 3-in. cylinders., and 10 sec for the
3- by 6-in. cylinders using a vibration table (external vibration) with a
freciiency of 3600 vibrations per min. The 6- by 6- by 20-in. beams were
J ._

a4 L4 77 7.7
vibrated internally for 25 sec with a portable, l-l/2-in.-diameter,
flexible-shaft vibrator with a frequency of 6000 vibrations per min.
9. The concrete specimens were moist-cured for 21 days. On the 22c
dayv, the 6- by 6- by 20-in. beams were sawed to a true 20 in.; the ends o:the 3- by 6-in. cylinders were sawed smooth to facilitate the applying o-
strain gages; and the 1-1/2- by 3-in. cylinders were capped with hydrostc.
on the cast end to obtain a plain surface. The specimens were air-dried
for the remainder of the time until tested at 28 days age. In preparatiu.
for the strain gages, the surfaces of the concrete cylinders were lightly
roughened with fine sandpaper and cleaned with methyl ethyl ketone. VoiM.
in the concrete in the areas where the gages would be attached were fillt-
with hydrostone.
Strain Gages
10. Two SR-4 strain gages were mounted diametrically opposite each 1
other on each compression specimen, and longitudinally opposed to each
other on each tensile-splitting specimen. The strain gages had thin pape,
backs, were mounted on the specimens with a nitrocellulose glue, and wirec
in series. Each gage was 13/16 of an inch long. The gages had a resist-
ance of 120 ohms (240 ohms when wired in series), and a gage factor of
S2.05.
Is
Ta

P)ART~ III: TETMuTHODS APPARTUS, AND PROCEDURES.
* Static Tests
'c3fmrossion
1ne 11. Electrical resistance strain gages were used in all static
coilipression tests to provide an indication of the stress-strain relation.
A manually operated strain indicator vas u~sed to record strain measure-
1-ents. The specimens were tested in a 30,000-lb Universal testing machine
's a~t a rate of approxirately 35 Psi or 3720 lb per min. StrLin readingswe e taken at loadinterval of lb0 lb.
iKo attc:Lpt was made ',w
to obtain the ul- ..
Lto the excessive
straining rate V. * t
be recorded) near *
the ultimate -..-- 3,OLUIE~A0i
1 00*B EIVae
F strength. A speci- - . ,.A TESTI NG MACHINE "~
men under staticLJ Z d
test is shown in fig. 1.Tensile splitting* Fig. 1. Static compression test
12. The 3- by 6-in, specimens for tensile splitting were equipped4
with a pair of gages centered horizontally on the ends of the cylinders.W
Several positions of gage placement were tried before this position was
adopted. The gages again wure wired in series to obtain the average
strain on the specimen. The strain was recorded on a manually operated
*The testing procedure that has been referred to as "tensile splitting"has been more recently designated "diametral compression" (A. Rudnick.,A. R. Hunter, and F. C. Holden., "An analysis of the diametral-coutpression
test," Materials Research and Standards, Vol 3, No. 4 (April 1963), PP
283-38-8T*' *. * --
6W
.............................
t_ I c
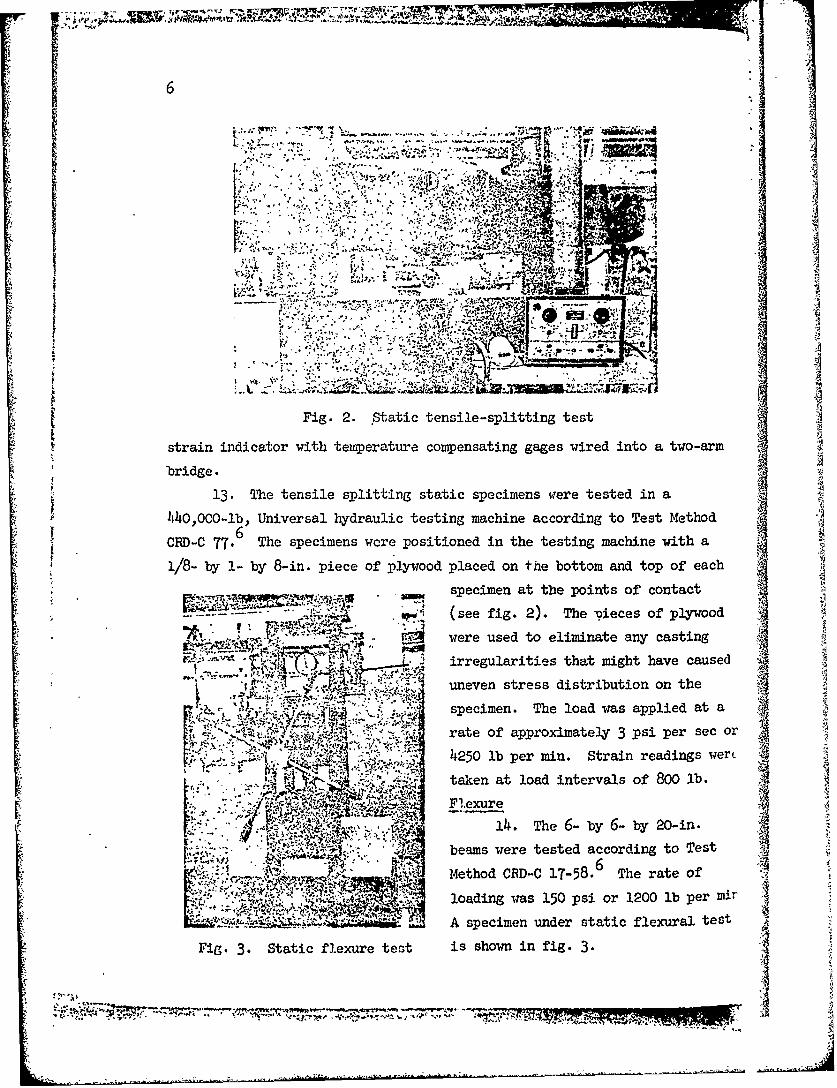
Fig 2.Saieslesltigts
stai indiato with tepeatr copesain gae ie no w-r
bridge.4
13 h esl pitigsai pcmeswr etdi
440,O a.b Unvesa hyrui etn ahn acrigt etMto
; -
(se fig 2)h
Sig2Stti wenrie-usplittin tesiintenatn
13.Th tnsie plttigtaicrsecuaiimens eeteste minh havcue
CRD- ~ Thespeimen wee poitinedvin sthes testringuacione onithea
.. specimen. aTthe pointws opplcontacta4N 1
,~~~proiae (se Pi.2.Th ~csio plyoo se or425 w bere usdtlminaterainy eastingswr
irreguatloaritiesthrat migh have cause
'¼ specimen1. The wsa .
loaswretetd appried t4Tes
- * -~ ~- ~ '.'Mrtehof aproxmae 3758 psi prasec or
I ~*~. -~ tkn tloadin intervalsPs of 8200 lb.prm
A- bpecimsere tnerstedacicrdingrto test A
Fi-3. Static flexure test is shown in fig. 3. '

I row___
Dynamic Tests
Th 1IT lE'S impact loader15. only a brief description of the rapid-loading machine (fig. 14)
Used 'rproducin,.g dynamic loads will be given in this report. For a more
dot-ailed description of the
rceiethe reader is referred
tothe thesis by Dr. R. J. .
Hansen. ~i
16. The impact load is
produced by a high-pressure, . . . -v-
gas-operated, cylinder-pist~on i!~
arrangement. The use of this~a
type of system -inits the ma- V MW - it
chine. to the production of' a MY!-.
single concentrated load. The%
cylinder-piston arrangemaenL, , .- ','
originally designed to produce p *.'. *
anormal working load of 10,000ib, has been modified to pro- .*.,:.
duce a 25,000-lb working load.
The stroke of the piston rod in Fig. 4. Impact machine
all tests was limited to 1/2 in.anistueaio
17. The piston cylinder was made by grinding a standard commercial
l!-7/8.-in.-ID steel pipe. The original duraluminum piston was replacedwith a brass piston. The piston rod was 1 in. in diameter, and wus made
2from: neolite steel for additional strength.
18. The piston, piston rod, and load-initiation system were designed
so that nitrogen under 1000 psi would drive ,.'½-e piston to the capacity of
the machine. Bottled nitrogen was used to pr., -ide the required gas pres-4
sure as it is a fairly light gas and produces a constant-slope loading
Pulsse which peaked in approximately 1 ms for the tensile-splitting and comn-
presoion tests. A mechanical trip lever system was used that restrained
* the piston rod from applying the load to the specimen until it vas tripped.
The actual tripping operation is initiated bv a plunger which pushes the

M RM
trip lever at the desired moment by release of a gas-operated solenoid.The load was released by evacuating the gas from the accumulator cylinderabove the piston by the use of another solenoid. The total volume of the
accumulator cylinder was 982 cu in.
19. The base of the supporting system for the machine and load cell
was made heavy and massive to minimize vertical support vibration during
testing ('see fig. 4).
Instrumentation
20. The instrumentation, also shown in fig. 4, consisted essentially
of a 50,000-1b load cell and an oscilloscope modified to provide only one
trigger sweep. Initially, an accelerometer was used in conjunction with a
load cell to determine the reaction resulting from the impulse applied by
the impact machine. The stress-strain relations were recorded on a dual-
trace oscilloscope equipped with a camera.
21. The load cell was calibrated statically periodically by loading
it vith a hydraulic testing machine and relating the corresponding changes
in load to the position change of the beam on the oscilloscope. For strain
calibration, a known resistance was switched into the strain circuit and
the resulting change noted. By use of the gage factor relation the known
resistance was equated to a definite value of strain.
Testing -procedures
22. The dynamic test specimens were equipped with the same type of
strain gages, mounted and wired in the same way as the static specimens.
The testing cap attached
to the piston rod con-:" : "•• :' ... "sisted or a beveled male
. ".-" surface uhich fitted into
' . . -the complementary female
f*-..-.. . -. ,* surfaces of the different- .- testing heads to provide
S1.. 1.1,11 a rotating ball joint.The different heads are
Fig. 5. Testing heads; left to right, testingcap, compression head, tensile-splitting head, shown in fig. 5 along with
flexure head, and flexure apparatus the center-point loading,
flexure apparatus. A rocking bar was employed on one end of the flexure
4 'R
IfI
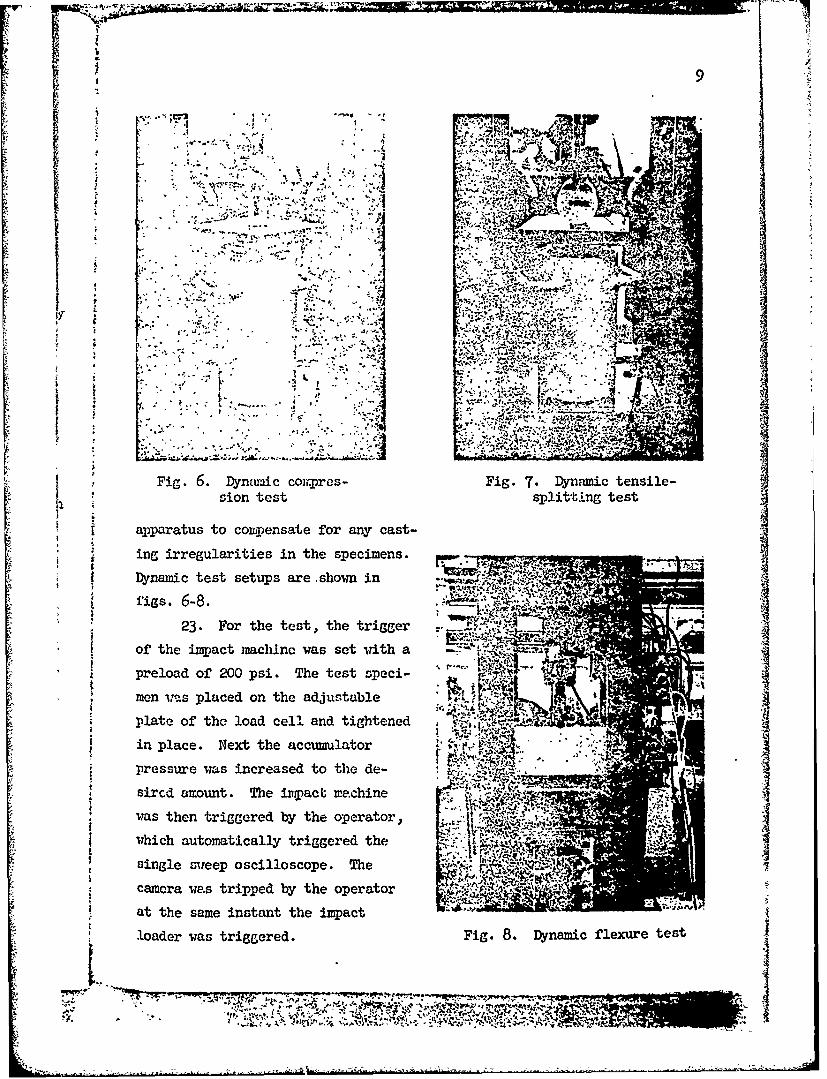
Fig 6. Dyai cops Fi. Dnmctnie
figs 6-8 smw "A
23. Fo th tet, the trge
preload ~ ~ ~ ~ j of( 20 s.Te etse
men vasilcdon thet jutalplate~~~slttn testlodclladtihee
For pae Nxth tethe ectriggeror
pressure was increased to the de-
sircd amount. The impacL e~ chine --
was then triggered by the operator,which automatically triggered the
single sweep oscilloscope. The .
camera was tripped by the operator ~ i
at the same instant the impact -
* loader was triggered. Fig. 8.Dynamic flexure test
z~
101A
Rlecord! rut and reduction of data
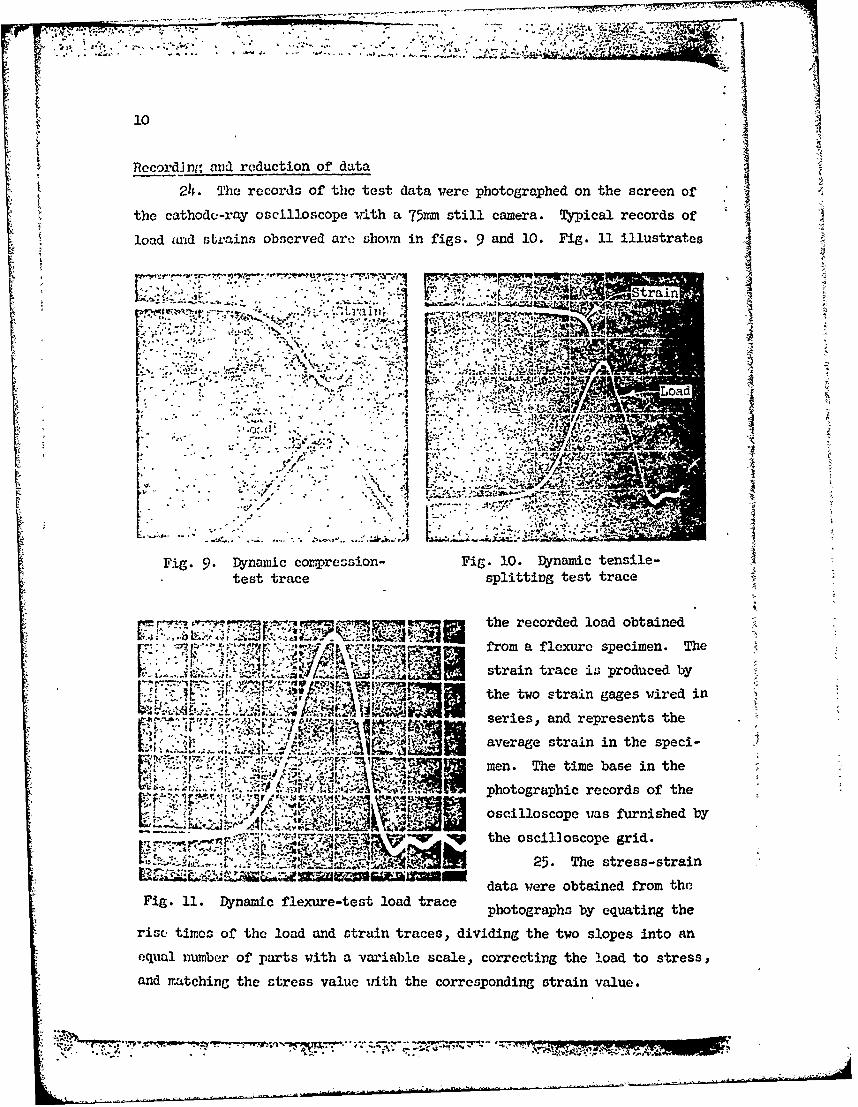
24~. The records of the test data were photographed on the screen of
the cathodc-ray oscilloscope with a 75~rn- still camera. Typical records ofload and strains observed aro shoirn in figzs. 9 and 10. Fig. 11 illustrates 2
3b
:v~7t ~ ~ , .. ~Load
Pr 7" i:3 mmp.tercre odotie
fro a lxreseimn.h
tebtrc splttaing traeis tradcedb
"n~ji te twostrain gages wired in
seis n represents the
aeaestrain in the speci--. .~;2 r~men. The time base in the
eD ~ ~ k phtorahc ecrs f hIt". z r phtgrpi reodro hoscilloscope vias furnished by
ythe oscil~oscope grid.
.1'' '. .**f ~25. The stress-strain~ data were obtained from the
Fig. 11. Dy'namic flexure-test load trace photographs by equating the
risQ times of the load and strain traces, dividing the two slopes into an
equal number of parts with a variable scale, correcting the load to stress,and m~atching the stress value with the corresponding strain value.
* ..~Z777 .

C .... . . r " " " , • ,,• •. . . • < F. :'O •
4% 'i . ".
_fn1WV1
PART IV: RESULTS
Compression Tests
26. The results of the compressive-strength tests on the three
strength levels of concrete specimens under static and dynamic loading ace
given in table 2. Each test value represents the average of three rounds
of specimens. The average static compressive strengths were 1960, 2770,
and 3920 psi for the low-, medium-, and high-strength mixtures, respec-
,tively. The ratios of dynamic to static compressive strengths were 1.37,
1.39, and 1.33, respectively. Table 3 gives the ultimate compressive
strength data for each round. Plate 1 shows the relation by round of
ultimate static to ultimate dynamic compressive strength. The average{ f load rise time was approximately 0.90 ms for all strength levels.
(1 27. Composite itress-strain curves, both static and dynamic, for
"each of the three concretes are shown in plate 2. The modulus of the con-
crete is given as the slope of the secant drawn from the origin to a point
on the curve corresponding to a value of 1O00 .Lin. per in. of strain. Use
: of the secant modulus of elasticity eliminated possible humai judgment in
determining the modulus by ths initial tangent method. It can be seen that
I the slope of the linear portion of the dynamic stress-strain curves becomes
increasingly steeper than the slope of the static curves as the strength of
the concrete increases. This is indicated in the ratios of the dynamic to
static moduli, which were 0.86,
1.15, and 1.19 for the low-,
medium-, and high-strength con- K
crete mixtures, respectively. I
28. There was no signi-Teeano g STATIC DYNAMIC
ficant difference in the manner
of failure of the compressive " " "
tent cylinders in the dynamicand static tests. Fig. 12 showsthat both the dynamic and static Fig. 12. Static and dynamic specimens
specimens failed in the charac- after compressive failureteristic manner of brittle material in a compressive test by developingii

12
cones at the ends which served to split the cylinder.
Tensile-Splitting Tests
29. The average dynamic and static tensile-splitting strengths for
the three strength levels are given in table 2. The average static
tensile-splitting strengths were 295, 410., and 540 psi for the low-,,
medium-, and high-strength mixtures, respectively. The ratios of the dy-Snamic to static strength were 1.75 for low, 1.74 for medium, and 1.73 for
high strengths, respectively. The average load rise time for all strength
levels was about 0.85 ms. The effect of dynamic loading on the tensile-
splitting strength of concrete is illustrated in plate 3. Table 4 gives
the results of tests of the individual rounds of specimens.
30. The composite stress-strain relations for each strength level
ave illustrated in plate 4. The curves are identical in pattern with the
compressive-strength curves in that the steepness of the slope of the lin-
ear portion of the dynamic test curve increases over that of the companion
static test curve as concrete
strength increases. The moduli."• of the three strength levels were
"computed by the secant methodN
using a strain value of 150 gin.
STATIC DYNAMIC. per in. The dynamic to static
ratios of the moduli for the
three strength levels are respec-S. £ tively 0.80, 1.03, and 1.10.
Fig. .3. Static and dynamic specimens 31. Fig. 13 illustratesafter tensile-splitting failure the breaks of concrete specimens
that underwent static and dynamic tensile-splitting tests. The breaks for
both types of loading were clean, even, and passed through the center of
the cylinder, all characteristics of a good break.
Flexure Tests
32. Table 5 gives the results of tests on the individual rounds of

- _ j -... .. ... •-• J •••a. : .. • • • • • •4 • •k
t~
13
the flexural test specimens. Average load rise time for all strength lev-'els was approximately 1.70 ms. The average static flexural strengths,
shoim in table 2, were 290, 375, and 410 for the low-, medium-, and high-
strength levels, respectively, as computed by the following relation:
R - P
2bdwhere R = modulus of rupture, psi
P = maximum applied load, lb1 = span length., in.
b = width of specimen, in.
d = depth of specimen, in.
33. As seen in plate 5 and table 2, the dynamic flexural strengths
? computed from the load cell response by the relation given above were
approximately four times greater than the static strengths. It is very
* . doubtful that this is a true value of the relation of static to dynamic
*I i flexural strengths. The ratio of dynamic stress to static stress is corn-
i eonly called the impact factor. The impact factor is dependent on the type
"of material, the type of loading and, in flexural tests particularly, the
f' type of test apparatus. It has been shown 5 that the impact factor for a
suddenly applied load is valid under the following conditions: (a) the
proportional limit of the material is not exceeded, and (b) all of the en-
ergy supplied by the impacting body is absorbed in stressing the beam.
Neither of these conditions existed in these tests. Also, the energy sup-
plied by the machine was surely affected by the test apparatus before the
load reaction was recorded on the load cell. Apparently the ratio devel-
oped for the flexural strengths. vas influenced by the aforementioned
j factors. To obtain valid results from flexural tests of plain concrete
beams, a revised test apparatus should be used which has a rigid base and
load cells that will -"
measure eacli reac-
tion individually.PFig. 14 shows the
static and dynamic USTAT T I
specimecns after Fig. 14. Static and dynamic specimens afterflexure failure. failure in flexure

The breaks shown are characteristic of those encountered throughout the .testing.
Test Methods
34. Reproducible test methods and procedures for determining the
compressive and tensile-splitting strengths of concrete dynamically were
developed and are given in Appendices A and B. Due to the erroneous value
attained for the relation of static to dynamic flexural strengths, no test
procedures were developed for determining the dynamic flexural strength of jconcrete.
k
rf
11
I
I .I
tA

15
PART V: SUMMARY OF RESULTS
35. The following results were derived from the tests conducted in
this investigation:
a. Compressive strength of specimens of each strength level- was higher under the high rate of loading than under the
static loading. For all strength levels an average ratioof dynamic to static strengths of 1.36 was obtained.
b. The dynamic tensile-splitting strength of the specimens ofeach strength level was greater than the static strength;an average ratio of dynamic to static strength of 1.74 wasobtained for all strength levels.
c. For all strength levels, the modulus of rupture of theflexure specimens increased by an average ratio of dynamicto static strength of 4.37. However, this value containsseveral indeterminate factors, and should be consideredvalid only for the test a ,paratus used in these tests.
d. The ratio of secant rodulus of elasticity of dynamic tostatic strength from compressive and tensile-splittingspecimens increased as strength increased. Values obtainedranged from 0.86 to 1.19 for compressive, and from 0.80 to1.10 for tensile-splitting strength.
e. Reproducible test methods for determining the compressiveand tensile-splitting strengths of concrete dynamicallywere developed.
I,

REFERENCES
1. Abrams, D. A., "The effect of rate of application of load on the com-pressive strength of concrete." Proceedings, American Society forTesting Materials, Part II, vol XVII (1917), pp 364-374. }
2. Hansen, R. J., Development of Experimental Technique for Controlled .Impulsive Loading of Simple Beams. ScD thesis, Massachusetts In-stitute of Technology, Cambridge, Mass., January 1948.
3. Jones, P. G., and Richart, F. E., "The effect of testing speed on {strength and elastic properties of concrete." Proceedings, AmericanSociety for Testing Materials, Part II, vol 36 (1936), pp 380-391'
4. McHenry, Douglas, and Shideler, J. J., "Review of data on effect ofspeed in mechanical testing of concrete." Symposium on Speed of Test-ing of Non-Metallic MaterialsR ASTM.1 Special Technical Publication No.185-(29 June 1955), P 72..
5. Seely, F. B., and Smith, J. 0., "Dynamic loads," in Resistance ofMaterials, 4th ed. (John Wiley and Sons, Inc, New York, N. Y., 1956),Chapter X.
6. U. S. Arzy Engineer Waterways Experiment Station, CE, Handbook forConcrete and Cement, with quarterly supplements. Vicksburg, Miss.,August 1949.
7. Watstein, D., "Effect of straining rate on the compressive strengthand elastic properties of coficrete." Journal of the American ConcreteInstitute, vol 24, No. 8 (April 1953), Pp 72-9-744.
8. , "Properties of concrete at high rates of loading.""* .Symposium on Impact Testing, ASTM Special Technical Publication No.
176 (27 June 1955), pp 156-169.
M
4
III

0.
Table 1 Y
Mixture Proportions for Test Concretes
Actual Fine Aggregate: Con- Cement Factor Water :Cement
Spec- Slump Total Aggregate tent bags/cu yd Ratioimen in. % by vol . Theoretical Actual by Wei.ht
Low-Strength Concre're
L-1 1-1/2 51 4.9 3.50 3.33 0.95L-2 1-1/2 51 5.0 3.50 3.33 0.95L-3 1-1/2 51 5.5 3.50 3.35 0.95
Medium-Strength Concrete
M-1 1-1/2 50 5.0 4.oo 3.81 0.82M-2 1-1/2 50 4.5 4.00 3.79 0.82M-3 1-1/2 50 5.0 4.oo 3.81 0.82
High-Strength Concrete
H-1 1-1/2 49 4.7 4.50 4.27 0.70H-2 1-1/2 49 4.7 4.50 4.27 0.70H-3 1-1/2 49 5.0 4.50 4.28 0.70
%744IfiI •-

"Table 2
Summary of Test Results
Low Medium High
Test Strength Strength Strength
•" Compressive strength, psi
"ynamic (f' 2680 386o 5210
Static (fc) 1960 2770 3920
1.37 1.39 1.33
Modulus of elasticity in compressionf,i" 06
10 psi
Dynamic (Ecd) 1.32 2.33 3.13
Static (Es) 1.53 2.02 2.63
0.86 , 1.15 1.19cdcEcs
Tensile-splitting strength, psi""~nd (f, 515 715 9352
Static f) 295 410 540, ,1.75 i. 1.33
d- t
"Modulus of elasticity in tensile"spltting., 1O ps
" i Dynemic(t) 1.24• 2.00 2.53
. Static (Fits) 1.55 1.95 2.31
• Etjt 0.80 1.03 1~l
i" modulus of rupture in. flexure. psi
Dynamic (R) 1255 1685 1765
Static (R290 375 1110
RdRs4.33 4.4+9 4.30
ds~ ;'*

Table 3
Ultimate Compressive Strength Data
Static DynamicRound Strength Range Strength Range No. Avg Rise
0No. p2±* psi** psi psi Specimens Time, s•cnt
L-1 1770 120 2850 44o 9 0.77
L-2 2060 230 2790 580 10 0.86
L-3 2040 ±20 2400 590 12 1.07
SM-1 3180 280 4170 880 10 1.02
1M-2 2500 250 3190 580 11 0.89
M-3 2630 190 4210 800 10 0.82
SH-1 +080 200 4930 1530 11 0.87
1H-2 4480 410 5510 1310 10 0.98
1H-3 3200 510 5180 124o 9 0.78
I!II
11
•" * Average of 3 specimens.?o• **Range is the difference between highest and lowest values recorded.
•: t Rise time is the time reqtuired for the load on the specimen to reach
Sits max~imum value from zero load.

1, -
71
Table 4Tensile-Splitting Test Data
Static ynamic.Round Strenwth Range Strength Range No. Avg Rise--e-No.- psi* psi p-3si psi Secimens TiemeL-1 290 40. 505 120 10 0.85 4
SL-2 280 30 505 185 10 0.75L-3 315 30 530 65 11 0.98
M-1 415 70 725 100 10 0.80M-2 375 55 635 110 10 0.86M-3 435 20 775 115 10 .o0.98
H-1 555 50 950 245 9 0.92H-2 520 35 910 160 10 0.84
H-3 535 10 950 330 10 0.72
A o
I£
''I
* Average of three tests.
" • ,•:•',q~• ,. .,•. • .,.

ft Table 5SFlexural Streny.ih Test Da'a
Static DynamicRoturd Strength HaTnge Strength Range No. Avg Rise
No. psi* psi psi Specimens Time, nis
L-I 285 5 1325 370 10 2.00L-2 295 25 127?0 305 8 1.6,(L-3 285 10 1165 305 9 1.89
M-1 365 15 1715 435 11 1.56M-2 360 25 1740 550 9 1.5814-3 360 15 1580 655 , 8 1.54
H-1 435 5 2105 515 10 1.21H-2 400 15 1800 485 8 1.52
11-3 390 65 1350 215 9 2.25F\
* Average of three tests.
7t !"-w,-" -' '"
W *

II
Wui
ki 9L '7II =E UOut -L
U,.. 7.
F -09M
'-i>~ 0 J I1
NEWz
061-
I-I - -
1 mm--* -- - m 2
-- I-LI !__ - 0a
ootz 3to
OW 0IizIw
I IIPLAIEIII

4004000
4 2 000- -0
0 0000 2000 3000 000-
STRAIN, MICROINC14 STRAIN, MICROINCH
A. LOW- STRENGTH CONCRETE B. MEDIUM - STRENGTH CONCRETE
* /a. -- A.
2000 -- 2 -
S• i •LEGENDS• •ITATIC
S6"-----A DNAMIC
2000
I //
IKI
100001000 2000 3000 0cQ020
STRAIN, MICROINCH DYNAMIC VS STATICC. HIGH-STRENGTH CONCRETE CMEU-S NGHONCRETE
TEST RESULTSPT
PLATE/
A.
:-...•,•,•.• .- : ,,. ... .•.•., -/

Iu y
~ 6 L.IX4 fr - *
0~*
0
oisj T -- -
O~SE9
IISflJ IL 1 0
0
z rj - - - -0
"1 -3
SI -SO-I Nz
I~d H±~i~kL SOS
PLAER-~ 3404

wwI-1
0~ 0
UU
ai
2IiL
OI W
01-
- - oz a Z 0 1
0 0 1 0 0 0 10 0 0mU
PLATE 4

ti r
w
09L
= j=06 a
_ 1. LUM 0 A0
= =0
0120Z
zI 0
I w
- PLATE 5

APPENDIX A: METHOD OF TEST FOR STRENGTH OF CYLINDRICALCONCRETE SPECIMENS LOADED AXIALLY BY IMPACT
SScope
1. The method covers the procedures for determining the strength of
cylindrical concrete specimens loaded axially by impact.
Apparatus
2. (a) Testing Machine.- The testing machine shall be the WES-MIT
rapid-loading impact machine. The machine is* equipped irLth a 50,000-lb load cell, and a test-
ing cap attached to the piston rod consisting
of a beveled male surface which is fitted into
the complementary female surface of the dif-
ferent testing heads to provide a rotating
ball joint. A compression specimen undergoing
dynamic testing is shown in Fig. Al. The test-
ing cap and the compressive test head are Fig. Al. Compressionspecimen undergoing
shoim in Fig. 'A2. dynamic testing
/20*
.W I II
COMPRESSIVE HEAD TESTING CAP
Fig. A2. Sketch of compressive head and testing cap

, - *i d
A2
(b) Recording Equipment.- Recording equipment shall consist of a
dual-beam oscillosc.ope that has been modified to provide a single trigger
sweep, on which is mounted a 75mm still camera.
Test Specimen
3. (a) The test specimen shall be cylindrical.' Due to the limited
capacity of the dynamic testing machine the size of the specimen shall be
limited to 1-1/2 by 3 in. Molded cylinders shall be made and stored in
accordance with the applicable provision of CRD-C 10, and drilled core
specimens shall be taken and moisture-conditioned in accordance with appli-
cable provisions of CRD-C 27. The diameter of the test specimen shall be
determined to the nearest 0.01 in. by averaging two diameters measured at
right angles to each other at about midheight of the specimen. This aver-
age diameter shall be used for calculating the cross-sectional area. The
length of the specimen, including caps, shall be measured to the nearest
0.1 in.
(b) Strain Gages.- If stress-strain relations are to be determined,
two SR-4 strain gages of type A-3-S6 (nominal length of 1 in.) or equiva-
iS lent shall be mounted diametrically opposite; oSCUoP7 one another midway between the ends of each
I compression specimen as illustrated in Fig.
A3. The gages shall be wired in series to
obtain the average strain on the specimen.
Procedure
4. (a) Placing the Specimen.- Place
the specimen on the load cell's adjustable
Fig. A3. Position of SR-4 bearing plate; carefully align the axis ofstrain gages the specimen with the center of thrust of
the beveled, seated compression head.
(b) AppAcation of Load... First set the trigger on the impact ma-
chine; apply a preload of approximately 200 psi to seat the trigger mecban-
ism. Bring the load cell's adjustable bearing plate to bear on the speci-
men by turning it until tight. As the adjustable plate is brought to bear
on the specimen, rotate the movable compression head gently by hand so
that uniform seating is obtained. Next increase the accumulator pressure
to the rcauired amount to produce failure of the specimen. Then trigger
4Z* s.. P
IA3
the impact machine, which automatically triggers the single sweep oscillo-
I scope. The camera is tripped at the same instant that the impact loader is
triggered. After completion of the test, release the accumulator pressure
"t and reset the trigger mechanism. All tests, the results of which are to
be compared, should be conducted using the same accumulator tank pressure.
Calculations
5. The stress-strain data obtained on the photographs are reduced by
equating the rise times of the load and strain traces, dividing the two
slopes into an equal number of parts with a variable scale, correcting the
load to stress, and matching the stress value with the corresponding strain
value. The compressive strength of the specimen is determined by dividing
the maximum load carried by the specimen during the test by the average
cross-sectional area determined as described in Sec. 3; the result is ex-
pressed to the nearest 10 psi.
- Report
6. The report shall include the following:
(1) Identification number
(2) Diameter, in. -"
(3) Cross-sectional area, sq in.
(4) Accumulator tank pressure, psi
(5) Load cell scale recorded by oscilloscope, lb per cm
(6) Time scale recorded by oscilloscope, ms per cm
(7) Strain scale recorded by oscilloscope, tin./in. per cm
(8) Type of fracture
(9) Defects in either specimen or caps
(10) Age of specimen
I -I
APPENDIX B: METHOD OF TEST FOR STRENGTH OF CYLINDRICAL CONCRETESPECIMENS LOADED DIAMETRALLY Ft IMPACT
I
S Scope
1. The method covers the procedure for determining the strength of
cylindrical concrete specimens loaded diametrally by impact.
Apparatus
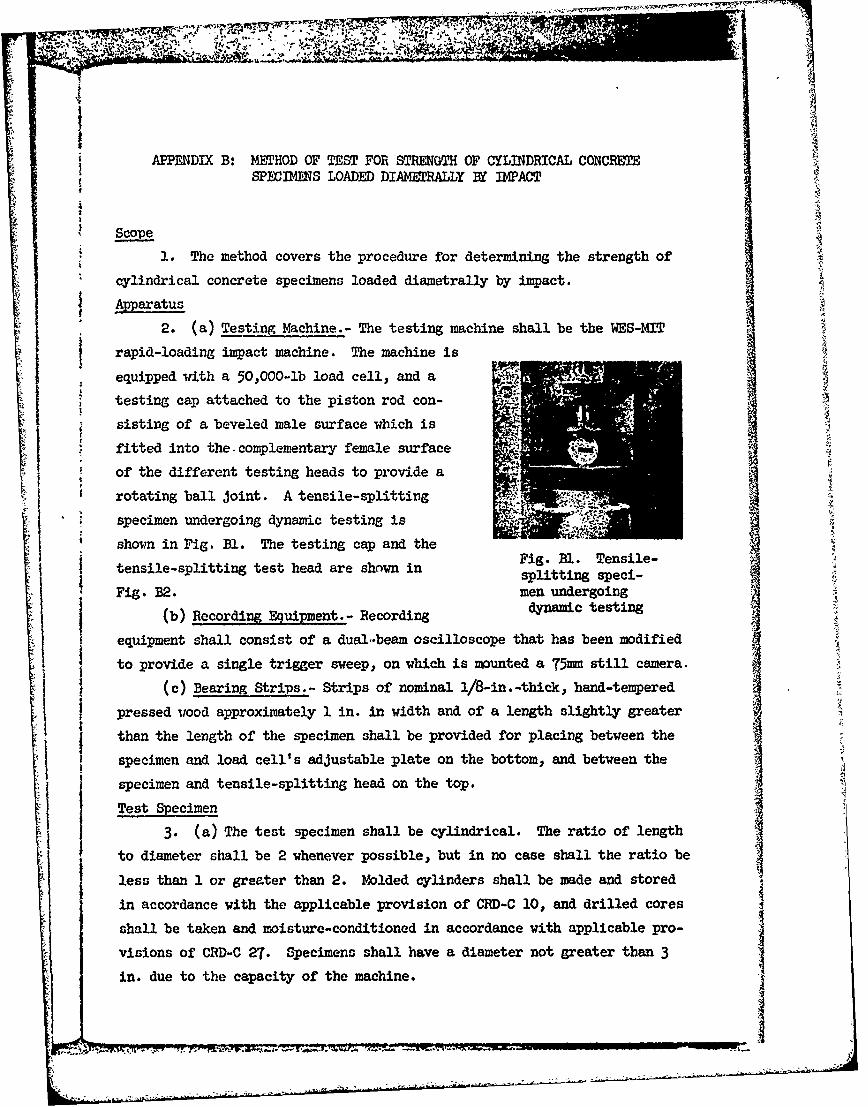
2. (a) Testing Machine.- The testing machine shall be the WES-MIT
rapid-loading impact machine. The machine isequipped with a 50,000-lb load cell, and a
testing cap attached to the piston rod con-
sisting of a beveled male surface which is
fitted into the complementary female surface
of the different testing heads to provide a
rotating ball joint. A tensile-splitting .
specimen undergoing dynamic testing is
shown in Fig. Bl. The testing cap and the Fig. BI. Tensile- ,
tensile-splitting test head are shown in
S Fig. B2. men undergoingS(b)Recodingdynamic testing
(b) Recording Equipment.- Recording
equipment shall consist of a dual-beam oscilloscope that has been modifiedto provide a single trigger sweep, on which is mounted a T5mm still camera.
(c) Bearing Strips.- Strips of nominal i/8-in.-thick, hand-tempered
pressed itood approximately 1 in. in width and of a length slightly greater
than the length of the specimen shall be provided for placing between the
specimen and load cell's adjustable plate on the bottom, and between the
specimen and tensile-splitting head on the top.Test Specimen
3. (a) The test specimen shall be cylindrical. The ratio of length
to diameter shall be 2 whenever possible, but in no case shall the ratio be
less than 1 or greater than 2. Molded cylinders shall be made and stored
in accordance with the applicable provision of CRD-C 10, and drilled cores
shall be taken and moisture-conditioned in accordance with applicable pro-
visions of CRD-C 27. Specimens shall have a diameter not greater than 3
in. due to the capacity of the machine.
M~r- M

B2
a" CI
TENSILE -SPLITTING HIEAD
t -e
TESTING CAP
Fig. B32. Sketch showing tensile-splitting head and testing cap
*n ;IT M;

5'-.r .M:-.N-ý
4W
'IB3
(b) The line of contact between the specimen and each bcaring :Aripshall be straight and free of any projections or depressions highcr or
deeper than 0.01 in. When the line of contact is not straight or ekintaun:3projections or depressions having heights or depths greater than 0.01 in.,the specimen shall be ground or capped so as to produce bearing Unws meet-
ring these requirements. When capping is employed, the caps shall be as
thin as practicable and shall be formed of high-strength gypsum plastur,
J and a capping device as shown in CRD-C 77 for tensile splitting shull beused.
(c) Strain Gages.- If stress-strain relations are to be determined,
two SR-4 strain gages of type
A-3-S6 (nominal length of 1 in. )
or equivalent shall be mounted
by centering the gages horizon-
tall- on the ends of the cylin-
der as illustrated in Fig. B3.
The gages shall be wired in se- oSoPE
ries to obtain the average
strain on the specimen. Fig. B3. Sketch showing position ofSProcedure strain gages
4. (a) Marking- Draw a line along the vertical diameter of each end
of the specimen. These lines shall be in the axial plane.(b) Positioning.- Place one of the bearing strips across the center
of the load cell plate. Then place the specimen on the bearing strip insuch a position that the diametrical lines on the ends of the specimen arevertical and centered over the bearing strips. Place second bearing strip
on the upper axial element of the cylinder so that diametrical lines inter-sect its center. Position the assembly, including the specimen and two
bearing strips, so that the projection of the selected axial plane inter-sects the center of the tensile-splitting head and the center of the speci-
men is beneath the center of the beveled testing cap (Fig. Bl). Bearingstrips shall be used in all cases regardless of the methods which may have
been used to prepare the bearing lines on the test specimen.
(c) Application of Load.- First set the trigger on the impact ma-
chine; apply a preload of approximately 200 psi to seat the trigger

4B4
mechanism. Bring the load cell's adjustable bearing plate to bear on the
specimen by turning it until tight; next increase the accumulator pres-sure to the required amount to produce failure of the specimien. Then trig-
ger the impact machine which automatically triggers the single sweep oscil-
"loscope. Trip the camera at the sam; instant that the impact loader is
triggered. After completion of the test, release the accumulator pressure
and reset the trigger mechanism. All tests, the results of which are to
be compared, should be conducted using the same accumulator tank pressure.
Calculations
5. The stress-strain data obtained on the photographs are reduced
by equating the rise times of the load and strain traces, dividing the two
slopes into an equal number cf parts with a variable scale, correcting the
load to stress, and matching the stress value with the corresponding strain
value. The tensile-splitting strength of the specimen is calculated as
follows:
"T = 2P
where:
"T = tensile splitting "strength, psi
P = maximum applied load indicated by the load trace, lb
t = length, in.
d = diameter, in.
The results shall be expressed to the nearest 5 psi.
*i Report
6. The report shall include the following:
(1) Indentification number
(2) Diameter and length of specimen, in.
(3) Accumulator tank pressure, psi
(4) Load cell scale recorded by oscilloscope, lb per cm
"(5) Time scale recorded by oscilloscope, ms per cm
(6) Strain scale recorded by oscilloscope, gin./in. per cm
(7) Type of fracture1, (8) Defects in either specimens or caps
(9) Age of specimen
Y"
LM