
II 111 11----------- - NISTEpicenters of New Madrid Earthquakes 2 -4 Isoseismal Map of the 1811 New...
76
II 111 11 ----------- SEISMIC HAZARD ALONG A CRUDE OIL PIPELINE IN THE EVENT OF AN 1811-1812 TYPE NEW MADRID EARTHQUAKE by H.H.M. Hwang l and C-H.S. Chen 2 April 16, 1990 Technical Report NCEER-90-0006 NCEER Project Number 89-3012 NSF Master Contract Number ECE 86-07591 1 Associate Research Professor, Center for Earthquake Research and Informatiol, Memphis State University 2 Research Associate, Center for Earthquake Research and Information, Memphis State University NATIONAL CENTER FOR EARTHQUAKE ENGINEERING RESEARCH State University of New York at Buffalo Red Jacket Quadrangle, Buffalo, NY 14261
Transcript of II 111 11----------- - NISTEpicenters of New Madrid Earthquakes 2 -4 Isoseismal Map of the 1811 New...

II111 11-----------
SEISMIC HAZARD ALONG A CRUDE OIL PIPELINEIN THE EVENT OF AN 1811-1812
TYPE NEW MADRID EARTHQUAKE
by
H.H.M. Hwangl and C-H.S. Chen2
April 16, 1990
Technical Report NCEER-90-0006
NCEER Project Number 89-3012
NSF Master Contract Number ECE 86-07591
1 Associate Research Professor, Center for Earthquake Research and Informatiol, MemphisState University
2 Research Associate, Center for Earthquake Research and Information, Memphis StateUniversity
NATIONAL CENTER FOR EARTHQUAKE ENGINEERING RESEARCHState University of New York at BuffaloRed Jacket Quadrangle, Buffalo, NY 14261

PREFACE
The National Center for Earthquake Engineering Research (NCEER) is devoted to the expansionand dissemination of knowledge about earthquakes, the improvement of earthquake-resistantdesign, and the implementation of seismic hazard mitigation procedures to minimiz(: loss of livesand property. The emphasis is on structures and lifelines that are found in zones o~ moderate tohigh seismicity throughout the United States.
NCEER's research is being carried out in an integrated and coordinated manner following astructured program. The current research program comprises four main areas:
• Existing and New Structures• Secondary and Protective Systems• Lifeline Systems• Disaster Research and Planning
This technical report pertains to Program 3, Lifeline Systems, and more specificall:r to crude oiltransmission systems.
The safe and serviceable operation of lifeline systems such as gas, electricity, oil, water, communication and transportation networks, immediately after a severe earthquake, is of crucialimportance to the welfare of the general public, and to the mitigation of seismic hazards uponsociety at large. The long-term goals of the lifeline study are to evaluate the seismic performanceof lifeline systems in general, and to recommend measures for mitigating the societal risk arisingfrom their failures.
From this point of view, Center researchers are concentrating on the study of spe:;ific existinglifeline systems, such as water delivery and crude oil transmission systems. A seis:nic performance analysis of crude oil transmission systems in the New Madrid area is underway. The studyfocuses on the vulnerability of these systems to seismic events. Technical and sDcietal issuesarising from disruption of the supply of crude oj from the south to the northeast following anearthquake are addressed, as is potential envircnmental pollution due to seismically inducedfailure of pipelines.
The research activities comprising the crude oil transmission system study are ~;hown in theaccompanying figure.
iii

Data Collection
Structural, FunctionalSoil, Geological
+I Liquefaction and Large Ground Deformation I+I System Response and Vulnerability Analysis I+
Serviceability Analysis
I+
Risk Assessment
Supply, PollutionI I
+Retrofit, Repair
& Restoration IThis report provides an assessment of the seismic hazard that exists along a major crude oilpipeline traversing the New Madrid seismic zone. An 1811-1812 type New Madrid earthquakewith moment magnitude 8.2 is assumed to occur at three locations where large historicalearthquakes have occurred. Six pipeline crossings of the major rivers in West Tennessee arechosen as the sites for hazard evaluation because of the liquefaction potential at these sites. Aseismologically-based model is used to predict the bedrock accelerations. Uncertainties in threemodel parameters, i.e., stress parameter, cutoff frequency, and strong-motion duration areincluded in the analysis. Each parameter is represented by three typical values. From thecombination of these typical values, a total of 27 earthquake time histories are generated foreach selected site due to an 1811-1812 type New Madrid earthquake occurring at a postulatedseismic source.
iv

ABSTRACT
An assessment of the seIsmIC hazard that exists along th ~ majorcrude oil pipeline (pipeline 22) is presented in this report. An 18111812 type New Madrid earthquak~ with moment magnitude 8.2 isassumed to occur at three locations where large h lstoricalearthquakes have occurred. Six pip,~line crossings of the major riversin West Tennessee are chosen a~; the sites for hazard e\ aluationbecause of the liquefaction potential at these sites. A seismol Jgicallybased model is used to predict the bedrock accekrations.Uncertainties in three model pararn eters, i.e., stress parameter, cutofffrequency, and strong-motion durajon are included in the malysis.Each parameter is represented by three typical values. From thecombination of these typical values, a total of 27 earthquake timehistories can be generated for each selected site due to an 18111812 type New Madrid earthquake occurring at a postulated seismicsource.
v


TABLE OF CONTENTS
SECTION TITLE
1 INTRODUCTION
2 PIPELINE AND SEI~:MIC SOURCES
3 SEISMIC HAZARD ESTIMATION
3.1 Fourier Amplitude Spectrum
3.2 Power Spectral Density Function
3.3 Acceleration Time Hi stories
3.4 Peak Values of Earthquake Motions
3.5 Parameter Uncertainties
3.6 Numerical Results
4 SUMMARY AND CONCLUSIONS
5 REFERENCES
APPENDIX
A PEAK BEDROCK ACCELERATIONS
vii
PAGE
1 - 1
2 - 1
3-1
3-1
3-4
3-4
3-5
3-7
3-9
4 - 1
5 - 1
A-I


FIGURE
1 - 1
LIST OF lLLUSTRATIONS
TITLE
Pipeline 22 and Liquefiable Soil Areas in
Tennessee
PAGE
1- 2
2 - 1
2-2
2-3
2-4
2-5
3-1
3-2
3-3
Source and Site Locations 2 - 3
Epicenters of New Madrid Earthquakes 2 - 4
Isoseismal Map of the 1811 New Madrid
Earthquake (after N llttli, O.W., 1973) 2 - 5
Map of Ground Effects of the 1811·-1812 New
Madrid Earthquakes (adapted from Fuller, 1912;
taken from Jibson and Keefer, 1988) 2 - 6
Epicenters of Five Historical New .Madrid
Earthquakes 2-8
Fourier Amplitude Spectrum (M = 8.2, R = 85 km) 3 - 11
Power Spectrum (M = 8.2, R = 85 km) 3 - 12
A Sample of Synthetic Earthquake
(M = 8.2, R = 85 km) 3 - 13
I, ""'

TABLE
2 - I
2-II
2 -III
2-IV
LIST OF TABLES
TITLE
Site Locations
Historical New Mad~id Earthquakes
Source Locations
Epicentral Distances
PAGE
2-2
2-9
2-10
2 - 11
3 - I Earthquake Parameters 3-8
3 -II Samples of Earthquake 3 -1 0
3 -III Peak Accelerations at Wolf River Crossing due
to Seismic Source at Marked Tree 3-14
3 -IV Statistics of Peak Bedrock Accelerations 3-15
xi


SECTJ[ON 1
INTRODUCTION
A major crude oil pipeline, Capline (pipeline 22), passes through therecharge area of underground water supplies in the West Tennesseeregion (figure 1-1). Because of the age of this pipeline, it is doubtfulthat any seismic design was included in the pipeline design. Thevulnerability of the pipeline subject to an 1811-1812 type NewMadrid earthquake is a major concern. In a pilot study cond Jcted bythe NCEER lifeline group [1], the buried pipeline was considered tofail due to soil liquefaction indu~ed by earthquakes. The areas ofhigh probability of liquefaction in Tennessee include mosl of thestream beds in West Tennessee (figure 1-1). If a pipeline wereruptured during an earthquak,~, the spilled material couldcontaminate the recharge area, thus impacting the water supply ofalmost all West Tennessee. Such an impact would be enormc,us sincethere is no immediately alternath e source of water supply in thisregion. In this study, the seisrrjc hazards along pipelin~ 22 isassessed, assuming that a scenario earthquake with magnitudesimilar to the 1811-1812 New Madrid earthquakes will oceur at apostulated source in the New Madrid seismic zone.
1-1

--_.._---_._--- .'--------...
,.....I
N
M-- _.- -._- -- -.._- ---"---....
s s S 5A L
FIGURE I-I Pipeline 22 and Liquefiable Soil Areas in Tennessee

SECTION 2
PIPELINE AND SEISMIC SOURCES
The Capline system is a 40-inch pipeline operated by Shell PipelineCorporation of Houston, Texas. Th~ pipeline transports crude oil fromsoutheastern Louisiana to Patoka, Illinois [l], traveling thrcugh softsediments of the Mississippi Valley and crossing major rivers in WestTennessee: Wolf River, Loosahatchie River, Hatchie River, ForkedDeer-South Fork, Forked Deer-North Fork, and Obion River. Theseriver crossings are the potential lo(~ations of soil liquefaction during alarge earthquake, and therefore ar~ selected as the sites for seismichazard evaluation. The locations of these six river crossings are listedin table 2-1 and also shown in figure 2-1.
The New Madrid seismic zone (NMSZ) is clearly delineated by theconcentration of epicenters (figure 2-2). From the pattern ofepicenters, at least three distinct linear trends suggesting theorientations of three subsurface fault segments in the New Madridregion are observed [2,3]. These three fault segments are (1) asouthern segment extending frDm Marked Tree, Arkansas, toCaruthersville, Missouri, roughly along the axis of the Reelfoot riftcomplex; (2) a middle segment trending northwest and extendingfrom Ridgely, Tennessee, to west of New Madrid, Missouri; and (3) arelatively shorter northern segment extending from west of NewMadrid, Missouri, to southern Illinois. From the focal mechanismstudies [3,4], both the northern and southern segments exhibit apredominantly right-lateral strike-slip fault-plane moti )n. Themiddle segment, on the other hand, exhibits a thrus:-faultingmechanism.
During the winter of 1811-1812, three great earthquakes oc :urred inthe Mississippi Valley. Because of low attenuation in the eastern andcentral United States, the intensity of the 1811-1812 NeVI Madridearthquakes (according to Nuttli [5]) produced far greater damagethan that produced by any other historical earthquake in the NorthAmerican continent. The shocks were felt over a wide are a of thecentral and eastern United State~;. Nuttli constructed a generalizedisoseismal map of the first principal shock that occurred onDecember 16, 1811 (figure 2-3). The area estimated to be 600,000k m 2, experienced damaging earth motions (modified Mercalliintensity ~ VII). Figure 2-4 illustrates the ground disruptions such as
2 -1

Site River
TABLE 2-1 Site Locations
Latitude Longitude
1 Wolf River 35.07° 89.63°
2 Loosahatchie River 35.28° 89.56°
3 Hatchie River 35.55° 89.44 °
4 Forked Deer-South Fork 35.80° 89.36°
Forked Deer-North Fork ° 89.32°5 35.96
6 Obion River 36.25° 89.17°
2-2

PIPELINE 22
MO
AR
MS
L-_...... ..............._. , ._.....,/",...I
-89 0
o 100km
~IGURE 2-1 Source and Site Locations
2-3

New Madrid Seismic Zone 1974 - 1988
-91 0 -90 0 -8'9 Q -88"38· 35·
tg>0 0 00 £0
o 0 0o °0 0
c
00 0 00 0 0 Oa::Qo 0~0 0 0
~o°oG~o0
CO 0o 0
0o 0 0
00
~o ° r:P 0 0 00
co8 8 0 0
0
JJ Q o 0 0 0 0 00
0e°
37" 0 bPo 0 0 37"
°0 <Bo°0:00 00
CD0
0
00 00 0 0
00
0
O~0
0 8 000 0 0
0 0
:36" 00 0 0 36"0 o(;p
00 ()
0 0
o~'"()
0
0
J9 0
00 O·
0o 2.0~M<3.0 M~S.O
o O.O~M<2.0 -4.0~M<5.0
0o M<O.O 3.0~M<4.0• I35" 35°
-91 0 -90 0 -89· -880
0 200 km
FIGURE 2-2 Epicenters of New Madrid Earthquakes
2-4

FIGURE 2-3
New Madrid~ 18·11
Isoseismal M.ap of the 1811 New MadridEarthquake (after Nuttli, 0 .. W., 1973)
2-5

EXPLANATION
Uplands of Paleozoic
bedrock
Uplands of Teniery bedrock
Terraces and ridges possibly
due 10 uplift
Areas uplifted during
eanhquakes
~
Arees depressed during
e.I1hqu.kes
Are.s submerged duringeanhqulkes
Landslides from bluffs
Area of SInd extNllion
Areas of marked fissuring
oBonom lands
FIGURE 2-4 l\1ap of Ground Effects of the 1811-12 New MadridEarthq uakes (adapted from Fuller, 1912; t a kenfrom Jibson and Keefer, 1 988)
2-6

uplift andearthquakes
sand[6] .
extrusion due to the 1811-1812 New Madrid
In addition to the three 1811-1812 New Madrid earthquakes, therewere two other damaging earthqulkes that occurred in the NMSZ(figure 2-5). One occurred in 1843 near Marked Tree, Arkan ;as, andthe other occurred in 1895 near Charleston, Missouri. Table =:-11 liststhe locations and moment magnitudes M of these five historicalevents [7].
In this study, a scenario earthquake similar to an 1811-1812 typeNew Madrid earthquake is postulated to occur in the NMSZ.Considering the concentration ,)f instrumental epicenters, thehistorical events, and the site locadons selected for this study, threeearthquake sources (A, B, and C) are selected as shown in tat,le 2-111.Since the scenario earthquake is assumed to have a m;lgnitudesimilar to the 1811-1812 New Madrid earthquakes (M = 8.:~, 8.09,and 8.3), the moment magnitude M = 8.2 is assigned to thepostulated scenario earthquake. The epicentral distances from thesethree seismic sources to six selected sites are listed in table 2 -IV.
2-7

Jan. S. 184~
MISSOURI
ARKANSAS
Jan. 23, 1812*J
L*Dec.16, 1811
Memphis
KENTUCKY
36 0
TENNESSEE l
Little Rock•
FIGURE 2-5
rL~---------\---13S0
Source: Algermissen and Askew
Epicenters of Five Historical New MadridEarthquakes
2-8

TABLE 2-11 Historical New Madrid Earthquake5
Event Epicen ter
Latitude Longitude
M
1811 Dec 16
1812 Jan 23
1812 Feb 07
1843 Jan 05
1895 Oct 31
36.0N
36.3N
36.5N
35.5N
37.0N
2-9
90.0W
89.6W
89.6W
90.5W
89.4W
8.20
8.09
8.30
6.47
6.81

TABLE 2-111 Source Locations
Source
A
B
C
Latitude
35.5N
36.0N
36.3N
Longi tude Historical Reference
90.5W 1843 0105 Marked Tree event
90.0W 1811 1216 New Madrid event
89.6W 1812 0123 New Madrid event
2-10

TABLE 2-IV Epicentral Distances
Source Site R(km)
1 84.62
2 89.13
A 3 96.35
4 108.30
5 118.63
6 145.81
1 95.79
2 92.36
B 3 67.10
4 48.63
5 42.94
6 56.48
1 118.25
2 113.73
C 3 84.68
4 59.2'5
5 45.08
6 38.91
2-11


SECTION 3
SEISMIC HAZARD ESTIMATION
Estimating the characteristics of ground motions induced by a largeNew Madrid earthquake is quite Ghallenging because of the lack ofstrong-motion data in the New Madrid region. In this study, aseismologically-based model is used to predict the horizontal bedrockmotions primarily due to shear waves generated from a seismicsource [8]. The model is centered on a power spectrum which in turnis developed from a Fourier amplitude spectrum. The Fourieramplitude spectrum is constructed based on the physicalcharacteristics of an earthquake including source mechanism andpath attenuation. From the power spectrum, earthquak.e timehistories and probability-based response spectra can be generateddirectly. The power spectrum can also be used to estimate the peakearthquake accelerations.
3.1 Fourier Amplitude Spectrum
The Fourier amplitude spectrum used in this study essentiallyfollows the Boore and Atkinson approach [9].
AU) = C x S(n x D(f) x I(f) (3.1)
where C is a scaling factor; S(f) is a source spectral function; D(f) is adiminution function; and I(f) is a shape filter.
The source spectral function S(i) is a frequency-domainrepresentation of the seismic energy released by an earthquake. Inthis study, we use an 0)2 source :~pectrum proposed by Brune [10].This source spectrum is a function of a single corner frequenc Y i 0 and
a seismic moment Mo:
S(f)M o
3-1
(3.2)

The corner frequency f 0 is determined by the seIsmIC moment Mo,
crustal shear wave velocity 13, and stress parameter ~ a:
i o= 4.9 x 10⁶ ~(~~) 1/3 (3.3)
The seismic moment Mo is related to average fault displacement D,fault rupture area A, and modulus of rigidity Il in the source zone:
M o = IlAD (3.4 )
Stress parameter ~a describes the level of the source spectralfunction above the corner frequency f o' The stress parameter ~a
proposed by Atkinson [11], Boore and Atkinson [9], Brune [10], andJoyner [12] is a constant and is independent of earthquakemagnitude, while the stress parameter suggested by Nuttli [13]increases with magnitude. In this study, a constant to.a is used.
According to the scaling law suggested by Boore [14] and Joyner [12],the scaling factor C is
c _<Raw> F V 1- 4 TC P ~3 r
where:
<RS<I» = radiation patternF = free-surface effectV = partition of a vector into horizontal componentsp = crustal densityr = hypocentral distance
(3.5)
<Ra<l» is the radiation pattern corresponding to different types ofseismic waves over a range of azimuths (a) and takeoff angles (<1». For<l> and S averaged over the whole focal sphere, the shear-waveradiation pattern <Ra<l» is 0.55 [15]. F accounts for the amplificationdue to the free surface and is taken as 2 [14]. V is the factor thataccounts for the partition of a vector into horizontal components and
3-2

is chosen as I/--J 2. Based on the hypocentral locatons ofinstrumentally recorded microearthquakes in the NMSZ, the focaldepths normally range from 5 to 20 km below the surface where thegranitic basement rock of the upper and middle continentd crustsare found. In this study, an average focal depth is taken as 10 km.The density p of continental crust at this focal depth is takel as 2.7g m I c m 3 , and the shear-wave velocity p is 3.5 kmls ~c. Thehypocentral distance r is the distance measured from the focus of anearthquake to the site. The term llr in equation (3.5) accounts forthe diminishing of source spectrum as a result of body-wavegeometric spreading.
The diminution function D(f) represents the anelastic attenuationthat accounts for the damping of the earth's crust and a sharpdecrease of acceleration spectra abc ve a cutoff frequency f m'
[-1C fr ]
D(f) = exp (j(f) p P(f,fm)
where:
Q(f) = frequency-dependent quality factorP(f,fm) = high-cut filter
(3.6)
The exponential term in equation 1).6) accounts for path attenuation.The quality factor Q(f) describes the attenuation of seismi:: wavesand is frequency dependent. The great distance at which th e 18111812 New Madrid earthquakes were felt has been attributed to thelow attenuation of seismic waves in central and eastern United States[5]. Several frequency-dependent quality factors Q(f) have beenproposed [16-18]. Based on the attenuation study conducted byDwyer and others [16] in central United States, the quality factor ofshear and Lg waves is
Q(f) = IS00 f 0.40 (3.7)
Since this study is related to the Nh1SZ, we feel that the quality factorproposed by Dwyer and others is more appropriate and so is used inthis study.
3-3

The high-cut filter P(f,f m) accounts for the observation that theacceleration spectra often show a sharp decrease above a cutofffrequency fm. In this study, a Butterworth filter is used as the highcut filter:
(3.8)
The shape filter I(f) is to shape the source spectral function for aparticular type of earthquake motion of interest. For acceleration, theshape filter is given as
I(f) = (2rcf)2
3.2 Power Spectral Density Function
(3.9)
An earthquake accelerogram generally shows a build-up segmentfollowed by a strong-motion segment which is in turn followed by adecay segment. The frequency content of earthquake accelerogramsis approximately constant during the strong-motion segment. Thus,the strong-motion segment of an acceleration time history isconsidered as a stationary random process. The one-sided powerspectral density function (power spectrum) Sa(f) can be derived fromthe Fourier amplitude spectrum.
2Sa(f) = T IA(.f)12 (3.10)
where A(f) is the Fourier amplitude spectrum as III equation (3.1),and T is the strong-motion duration.
3.3 Acceleration Time Histories
In this study, synthetic earthquake time histories are generatedusing the method proposed by Shinozuka [19]. Given the powers.pectrum, the stationary acceleration time histories as(t) can begenerated as follows:
3-4

Nas(t) = ;)2 L ;) Sa(ffilJtlffi COS(2:rrffikt + <Ilk)
k=1
where:
Sa(ffik) = one-sided earthquake power spectrumN = number of frequency intervals~(J) = frequency increment(J)k = k tl (J)
<Ilk = random phase angles uniformly distributedbetween 0 and 2:rr
(3.11)
The nonstationary acceleration time histories aCt) can be obtainedfrom the multiplication of an enve] ope function wet):
a( t)=as(t) w(t) (3.12)
The envelope function wet) proposed by Hwang et al. [2] and used inthis study is comprised of three segments: (l) a parabolicallyincreased segment simulating the hitial rise part of the accelerogramand its duration is chosen as one fifth of T, (2) a constant segmentrepresenting the strong-motion portion of an earthquake excitationand has a duration equal to T, and (3) a linearly decayed segmentextending four fifths of T. Thus, the total duration is 2T. It is notedthat real seismograms are commonly observed with long codadurations; however, the coda durations are considered unimportantin most engineering applications.
3.4 Peak Values of Earthquake Motions
The peak value Ap of an acceleration time history aCt) over aduration T is defined as
A p = max I aCt) I (3.13)

The statistical distribution of A p can be approximated by theasymptotic distribution function of the extreme values [20]. In thisstudy, the cumulative distri bu tion function of A p proposed byVanmarcke [21] is used.
a 2 - 1-exp(---J;ri a8 e )].FAP(r) = [1-exp(- 2)] exp_-voT exp(a 2 /2)-1 ' r>O (3.14)
in which va is the mean zero-crOSSIl1g rate of the displacement
response; 8e = 81.2 in which 8 is a shape factor [21]; and a = rl 0" a is anormalized barrier level. The standard deviation 0" a can be computedfrom the power spectrum Sa(w),
The mean and standard deviation of A p are particularly useful for
engineering applications. The mean value Ap and standard deviation(JAp can be expressed as
Ap = Pm 0" a (3.15)
O"Ap=qO"a (3.16)
From equation (3.14), Der Kiureghian [22] obtained the followingempirical equations for Pm and q:
Pm = --J2 In(veT) + 0.5772 I --J 2 In(veT)
q = 1.2 I --J 2 In(veT) - 5.4 I (13 + [2 In(v cT)]3·2)
in which
(3.17)
(3.18)
{
maX(2.1, 28voT);vel' = (1.6380.45_0.38)vOT;
VOl'
3-6
0.00<8~0.10
0.10 < 8 < 0.690.69 ~ 8 < 1.00
(3.19)

3.5 Parameter Uncertainties
The seismologically-based mode:! for the horizontal bedrockaccelerations is defined by several parameters as summarized intable 3-1. In this study, the moment magnitude M is chosen as 8.2 tosimulate the 1811-1812 type New Madrid earthquak~. Theepicentral distance R is dependent on the site locations. Someparameters such as the radiation pattern is determined from theconsideration of earthquake seismology. The focal depth :md thecorresponding crustal density p and shear-wave velocity ~ arechosen from the data related to the New Madrid region. Since theseparameters appear to have less irJluence on the resulting bedrockaccelerations, a deterministic value is assigned to each cf theseparameters. A deterministic quality factor Q(f) is also used in thisstudy due to the lack of pertinent information to quanlify thevariation. On the other hand, the stress parameter ~ cr, cutofffrequency fm, and strong-motion duration T have significant effectson the resulting bedrock accelerations. Thus, the uncertainties inthese parameters are included in the analysis.
In this study, a constant stress parameter is used to predict thehorizontal bedrock time histories. Boore and Atkinson [9], h1cGuireand others [23], and Somerville and others [24] suggested an average~cr around 100 bars for central and eastern North America. Using the1988 Saguenay earthquake, Atkinson and Boore [25] determined thatthe stress parameter is about 200 bars. Thus, three values, ~o = 100,150, and 200 bars, are selected for this study.
The cutoff frequency f m is a parameter to model the deca) of theFourier amplitude spectrum beyond certain frequency. The ~election
of fm also affects the peak value of an earthquake. According toBoore and Atkinson [9], fm is uncertain in eastern North America.McGuire and others [23] suggested fm = 40 bars for rock site:; in thisregion. From the study of the 1988 Saguenay earthquake, Chen andHwang [26] found that the value of f m seems to decrease as theepicentral distance increases and fm = 20 to 30 Hz are obtaned forrock sites at epicentral distances le~is than 100 km. In this st Jdy, weselect 20, 30, and 40 Hz to I~over the uncertainty in cutofffrequencies.
The strong-motion duration T is ar other important factor that affectsthe outcome of the time histories. Hanks [27] suggested tha: strong
3-7

TABLE 3-1
Parameters
Moment Magnitude
Epicentral Distance
Focal Depth
Radiation Pattern
Horizontal Component
Shear Wave Velocity
Crustal Density
Quality Factor
Stress Parameter
Cutoff Frequency
Strong-Motion Duration
Earthquake Parameters
Symbol
M
R
h
<Re<)l>
V
13
p
Q(f)
~(J
fm
T
3-8
Value
8.2
Table 2-IV
10.0 km
0.55
0.71
3.5 km/sec
2.7 gm/cm3
1500j°.4
Variable
Variable
Variable

motion duration T is equal to th,~ source duration, which IS thereciprocal of the corner frequency fo:
1T = fo (3.20)
On the basis of this equation, the strong-motion duration T for anM = 8.2 earthquake with a stress parameter of 150 bars is ahout 32sec. According to studies conducted by Johnston [28], Krinitzsky andothers [29], Lai [30], and Sues and others [31], strong-motionduration has significant variation. Thus, the coefficient of variation istaken as 50%. Based on this consideration, three values of 16, 32, and48 sec are chosen for an earthquake with M of 8.2 and !la of 150bars. For earthquakes with differe1t stress parameters, the strongmotion durations are computed according to the same procedure.
3.6 Numerical Results
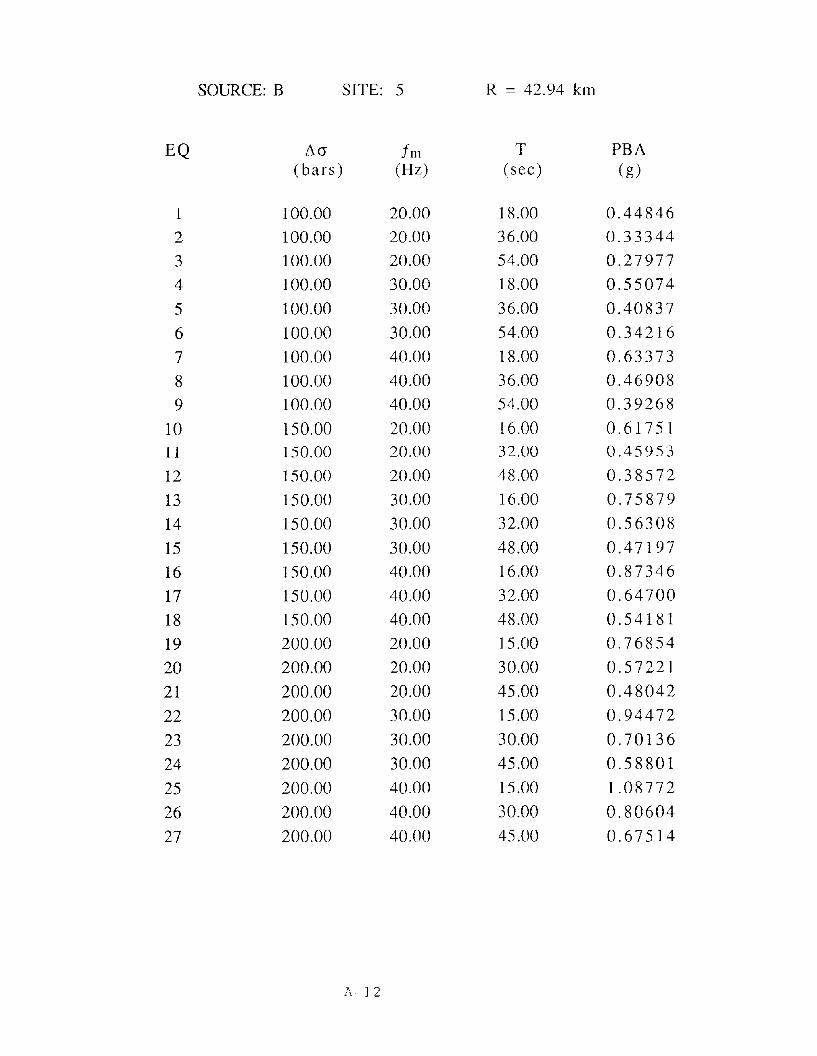
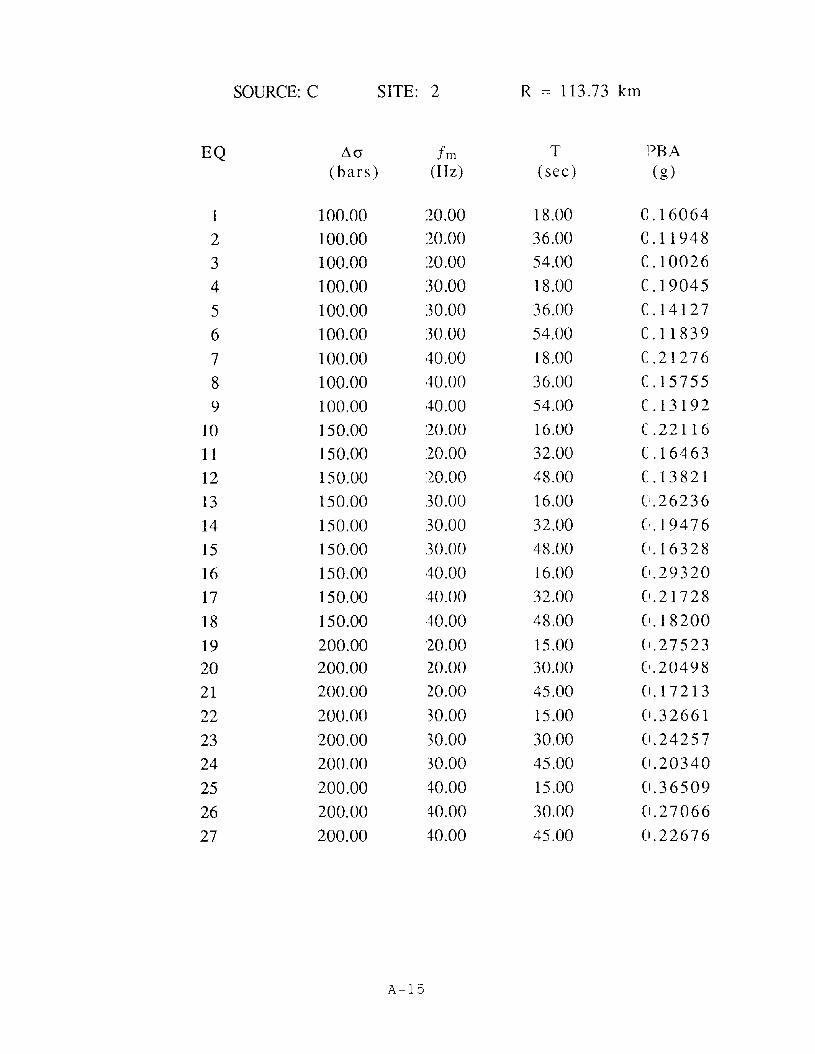
In this study, the uncertainties in model parameters !l a, f m, and Tare represented by three values. From the combination of thesetypical values, a total of 27 sample:i of earthquakes can be generatedand are listed in table 3-11. For the purpose of illustration, theseismic source is assumed at Marked Tree, Arkansas (source A) andthe site is taken as the Wolf River crossing (Site 1). !la, fm, anj Tareselected as 150 bars, 30 Hz and 32 sec, respectively. Theseparameters, together with those listed in table 3-1, are used togenerate synthetic earthquakes. The Fourier amplitude sp'~ctrum,
power spectrum and a synthetic time history corresponding tl) theseparameters are shown in figures 3-], 3-2, and 3-3, respectively. The27 peak bedrock accelerations (PBA) computed directly from thepower spectrum are listed in table 3-111. Appendix A shows the peakbedrock accelerations of all six si tes from three different seismicsources. A statistical analysis is carried out to determine themaximum value Amax , minimum value Amin, mean value Amean , andcoefficient of variation (COV). Table 3-IV shows these statistics for allsix sites from three seismic sources. Notice that the COY for a II casesare about 0.33 and the mean value is very close to the so-calledbest-estimate value, i.e. the peak value determined using the meanparameter values.
3-9

TABLE 3-11 Samples of Earthquake
Sample ~(J
(bars)fm
(Hz)T
(sec)
1 100.00 20.00 18.002 100.00 20.00 36.00
3 100.00 20.00 54.004 100.00 30.00 18.00
5 100.00 30.00 36.00
6 100.00 30.00 54.007 100.00 40.00 18.00
8 100.00 40.00 36.009 100.00 40.00 54.00
10 150.00 20.00 16.001 1 150.00 20.00 32.001 2 150.00 20.00 48.00
1 3 150.00 30.00 16.0014 150.00 30.00 32.00
15 150.00 30.00 48.00
16 150.00 40.00 16.001 7 150.00 40.00 32.00
1 8 150.00 40.00 48.00
1 9 200.00 20.00 15.00
20 200.00 20.00 30.0021 200.00 20.00 45.00
22 200.00 30.00 15.00
23 200.00 30.00 30.0024 200.00 30.00 45.00
25 200.00 40.00 15.00
26 200.00 40.00 30.0027 200.00 40.00 45.00
3-10

60.0
50.D
-UII)rJ ""0.0.........
w aI uf-' -f-'
U .......r:a::l '-oIu.u
~ /~
~U 20.0U<
10.0
0.0
FOURIER AMPLITUDE SPECTRUM
-2.0 -1.0 0.0
LOG OF FREQUENCY (Hz)
1.0 2.0
FIGURE 3-1 Fourier Amplitude Spectrum (M=8.2, R=85 kill)

220.0
200.0
lBO.O
........t"J 160.0ititCJCll
140.0Vl..........
w NI ..
it 120.0f-' SN
tl....... 100.0
~....rn 60.0ZI":iIE-o 60.0Z....
,(0.0
20.0
0.0
-2.0 -1.0
POWER SPECTRUM
0.0
LOG OF FREQUENCY (Hz)
1.0 2.0
FIGURE 3-2 Power Spectrum (M=8.2, R=85 k m)

~ 0 en0 ~C'i 0 M
I(J I(JN N
I
~ ~
~() -.O~ E
.::a::
.P.s'l ~ro lI)
QOII
';)q, ~
~'"N
;p QO
~ II
~--~ ~
~
.::a::CO
~:::
~ C'".c-
~~ """oPc!' CO~
~q,CJ
~c!l -~..-q,'b -~ C>.
rJ:J
q," e:.-Jl~ 0
~-~
q,O c.ECO
....~ rJ:JoPL' -<
~c).~
I
~
~~;J~~
~
." 0 en~
0 ....0 t?
~ It)N
~S/~:aS/K~ r
JIO1.1.V(l:na::X)V
3-1:3

TABLE 3-111 Peak Accelerations at Wolf River Crossing
due to Seismic Source at Marked Tree
Sample L'lcr
(bars)
fm
(Hz)
T
(sec)
PBA
(g)
1 100.00 20.00 18.00 0.21
2 100.00 20.00 36.00 0.16
3 100.00 20.00 54.00 0.13
4 100.00 30.00 18.00 0.25
5 100.00 30.00 36.00 0.19
6 100.00 30.00 54.00 0.16
7 100.00 40.00 18.00 0.298 100.00 40.00 36.00 ().21
9 100.00 40.00 54.00 0.18
10 150.00 20.00 16.00 0.29
1 1 150.00 20.00 32.00 0.22
1 2 150.00 20.00 48.00 0.18
1 3 150.00 30.00 16.00 0.35
14 150.00 30.00 32.00 0.26
1 5 150.00 30.00 48.00 0.22
1 6 150.00 40.00 16.00 0.39
1 7 150.00 40.00 32.00 0.29
1 8 150.00 40.00 48.00 0.24
1 9 200.00 20.00 15.00 0.36
20 200.00 20.00 30.00 0.27
21 200.00 20.00 45.00 0.23
22 200.00 30.00 15.00 0.43
23 200.00 30.00 30.00 0.32
24 200.00 30.00 45.00 0.27
25 200.00 40.00 15.00 0.4926 200.00 40.00 30.00 0.36
27 200.00 40.00 45.00 0.30
3-14

TABLE 3·IV Statistics of Peak Bedrock Accelerations
Source Site A max(g)
Amin(g)
A mean(g)
mv
1 0.49 0.13 0.27 0.332 0.46 0.12 0.25 0.33
A 3 0.42 0.11 0.23 0.334 0.38 0.10 0.21 0.335 0.36 0.10 0.20 0.326 0.31 0.09 0.17 0.32
1 0.42 0.11 0.23 0.332 0.44 0.12 0.24 0.33
B 3 0.65 0.17 0.36 0.334 0.95 0.25 0.51 0.335 1.09 0.28 0.59 0.346 0.80 0.21 0.43 0.33
1 0.36 0.10 0.20 0.322 0.37 0.10 0.20 0.32
C 3 0.49 0.13 0.27 0.334 0.76 0.20 0.41 0.335 1.03 0.27 0.56 0.346 1.21 0.31 0.65 0.34
3-15


SECTION 4
SUMMARY AND CONCLUSIONS
Estimation of seismic hazard is an essential task in carrymg outseismic risk assessment studies. In this study, we present the: seismichazard assessment along pipeline 22 (Capline). An 1811-U~12 typeNew Madrid earthquake with M = 8.2 is assumed to occur at threelocations, where large historical earthquakes have occurred. Sixpipeline crossings of major rivers in West Tennessee are chosen asthe sites for hazard evaluation bt::cause of the liquefaction potentialat these locations. A seismologically-based model is used to predictthe bedrock accelerations. Uncertainties in three model parameters,i.e., stress parameter ~ cr, cutoff frequency fill, and stron g-motionduration T are included in the analysis. Each parameter isrepresented by three values. From the combination of theseparameters, 27 samples of earthquake are generated for eact pair ofseismic sources and selected sites. The results of the seismic hazardanalysis can be used to evaluate the liquefaction potential at thesesites, assess the vulnerability of pipeline facilities, investigate therisk from a postulated pipeline break, and prepare an emergencyresponse plan.
4-1


SECTION 5
REFERENCES
1. Ariman, T., et. aI., "Pilot Study on Seismic Vulnerability Jf CrudeOil Transmission Systems," Prepared for NCEER (draft), February,1989.
2. Johnston, A.C., "A Major Earthquake Zone on the Mis dssippi,"Scientific American, Vol. 246, No.4, 1982, pp. 60-68.
3. O'Connell, D.R., Bufe, CG., and Zoback, M.D., "Microearthquakesand Faulting in the Area of New Madrid, Missouri - ReelfootLake, Tennessee", in McKeo\\-n, EA., and Pakiser, L.c., (eds.),Investigations of the New Madrid, Missouri, Earthquake Region,U.S. Geological Survey Professional Paper 1236-D, 1982, pp. 3138.
4. Herrman, R.B., and Canas, J., "Focal Mechanism Studies in the NewMadrid Seismic Zone," Bulletin of the Seismological Society ofAmerica, Vol. 68, No.4, August, 1978, pp. 1095-1102.
5. Nuttli, O.W., "The Mississippi Valley Earthquakes 1811 and 1812:Intensities, Ground Motion and Magnitudes," Bulletin of theSeismological Society of America, Vol. 63, No.1, April,l973, pp.227-248.
6. Jibson, R.W. and Keefer D.K., "Landslides Triggered byEarthquakes in the Central \1ississippi Valley, Tenne~;see andKentucky," USGS Professional Paper 1336-C, U.S. GeologicalSurvey, 1988.
7. Coppersmith, K.J., et aI., "Methods for Assessing .MaximumEarthquakes in the Central and Eastern United State~,," EPRIProject RP-2556-12 (draft) June, 1989.
8. Hwang, H., Chen, C.-H., and Yu, G., "Bedrock Accelerations inMemphis Area due to Large New Madrid Earthquakes," TechnicalReport NCEER-89-0029, National Center for EarthquakeEngineering Research, SUNY, Buffalo, NY, November, 1989.
9. Boore, D.M. and Atkinson, G.M., "Stochastic Prediction of GroundMotion and Spectral Response Parameters at Hard-Rock Sites inEastern North America," Bulletin of the Seismological Society ofAmerica, Vol. 77, No.2, 1987, pp. 440-467.
10. Brune, J .N., "Tectonic Stress a.nd Spectra of Seismic She;lf Wavesfrom Earthquakes," Journal of Geophysical Research, Vol. 75, No.26, September, 1970, pp. 4997-5009.
11. Atkinson, G.M., "Ground Motions of Moderate EarthquakesRecorded by the Eastern Canada Telemetered Network," Earth
h .J - __

Physics Branch Open-File No. 85-5, Geological Survey of Canada,Ottawa, 1985, 76 pp.
12. Joyner, W.B., "A Scaling Law for the Spectra of LargeEarthquakes," Bulletin of the Seismological Society of America,Vol. 74, No.4, August, 1984, pp. 1167-1188.
Jl3. Nuttli, O.W., "Average Seismic Source-Parameter Relations forMid-Plate Earthquakes," Bulletin of the Seismological Society ofAmerica, Vol. 73, No.2, April, 1983, pp. 519-535.
14. Boore, D.M., "Stochastic Simulation of High-Frequency GroundMotions Based on Seismological Models of the Radiated Spectra,"Bulletin of the Seismological Society of America, Vol. 73, No.6,December, 1983, pp. 1864-1894.
15. Boore, D.M. and Boatwright J., "Average Body-Wave RadiationCoefficients," Bulletin of the Seismological Society of America,Vol. 74, No.5, October, 1984, pp. 1615-1621.
16. Dwyer, J.J., Herrmann, R.B., and Nuttli, O.W., "Spatial Attenuationof the Lg Wave in the Central United States," Bulletin of theSeismological Society of America, Vol. 73, No.3, June, 1983, pp.781-796.
17. Hasegawa, H.S., "Attenuation of Lg Waves in the CanadianShield," Bulletin of the Seismological Society of America, Vol. 75,No.3, 1985, pp. 1569-1582.
18. Shin, T.-C. and Herrmann, R.B., "Lg Attenuation and SourceStudies Using 1982 Miramichi Data," Bulletin of the SeismologicalSociety of America, Vol. 77, No.2, April, 1987, pp. 384-397.
19. Shinozuka, M., "Digital Simulation of Ground Acceleration,"Proceedings of the 5th World Conference on EarthquakeEngineering, Rome, Italy, June, 1973, pp. 2829-2838.
20. Shinozuka, M., "Methods of Safety and Reliability Analysis," inFreudenthal, A.M., (ed.), Proceedings of the InternationalConference on Structural Safety and Reliability, Washington D.C.,April 9-11, 1969, pp. 11-45.
21. Vanmarcke, E.H., "On the Distribution of First Passage Times forNormal Stationary Random Processes," Journal of AppliedMechanics, ASME, Vol. 42, March, 1975, pp. 215-220.
22. Der Kiureghian, A., Sackman, J.L. and Nour-Omid, B., "DynamicAnalysis of Light Equipment in Structures: Response toStochastic Input," Journal of Engineering Mechanics Division,ASCE, Vol. 109, No. EMl, February, 1983, pp. 90-110.
23. McGuire, R.K., Toro, G.R. and Silva, W.J., "Engineering Model ofEarthquake Ground Motion for Eastern North America," EPRI NP6074, October, 1988.
5-2

24. Somerville, P.G., McLaren, J.P., LeFevre, L.V., Burger, R.\V., andHeImberger, D.V., "Comparison of Source Scaling Relations ofEastern and Western North American Earthquakes," BuLetin ofthe Seismological Society of America, Vol. 77, 1987, pp. 322-346.
25. Atkinson, G.M. and Boare, D.M., "Preliminary Analysis of GroundMotion Data from the 25 November 1988 Saguenay, Quebec,Earthquake," Seismological Society of America, Abstract of 84thAnnual Meeting, 1989.
26. Chen, C.H. and Hwang, H., "Direct Evaluation of EarthquakeResponse Spectra from Seismological Models," Proceedings of 4thU.S. National Conference on Earthquake Engineering, PalmSprings, CA, May 20-24, 1990.
27. Hanks, T.C., "b-values and w -Y Seismic Source Jv1odels:Implications for Tectonic Stres:; Variations Along Active CrustalFault Zones and the Estimation of High-Frequency Strong GroundMotion," Journal of Geophysical Research, Vol. 84, 1979, pp.2235 -2242.
28. Johnston, A.C., "Seismic Ground Motions in Shelby County,Tennessee, Resulting from Large New Madrid Earthquakes,"Technical Report 88-01, Center for Earthquake Reseal ch andInformation, Memphis State University, January, 1988.
29. Krinitzsky, E.L., Chang, F.K. ard Nuttli, a.w., "Magnitude-RelatedEarthquake Ground Motions," Bulletin of the Association ofEngineering Geologists, Vol. XXV, No.4, 1988, pp. 399-423.
30. Lai, P. S.-S., "Statistical Characterization of Strong Ground MotionsUsing Power Spectral Density Functions," Bulletin of theSeismological Society of America, Vol. 72, No.1, 1982, pp. 259274.
31. Sues, R.H., Wen, Y.K., and AnE., A.H.-S., "Stochastic Evaluation ofSeismic Structural Perforrrance," Journal of StructuralEngineering, ASCE, Vol. 111, No.6, 1985, pp. 1204-1218.


Appendix A Peak Bedrock Accelerations
A-I

SOURCE: A SITE: 1 R = 84.62 km
EQ 1:1 a 1m T PBA(bars) (Hz) (sec) (g)
1 100.00 20.00 18.00 0.21134
2 100.00 20.00 36.00 0.15717
3 100.00 20.00 54.00 0.13188
4 100.00 30.00 18.00 0.25347
5 100.00 30.00 36.00 0.18800
6 100.00 30.00 54.00 0.15753
7 100.00 40.00 18.00 0.28591
8 100.00 40.00 36.00 0.21169
9 100.00 40.00 54.00 0.17723
10 150.00 20.00 16.00 0.29097
1 1 150.00 20.00 32.00 0.21658
1 2 150.00 20.00 48.00 0.18181
13 150.00 30.00 16.00 0.34920
14 150.00 30.00 32.00 0.25920
15 150.00 30.00 48.00 0.21728
16 150.00 40.00 16.00 0.39403
17 150.00 40.00 32.00 0.29195
18 150.00 40.00 48.00 0.24452
19 200.00 20.00 15.00 0.36212
20 200.00 20.00 30.00 0.26967
21 200.00 20.00 45.00 0.22643
22 200.00 30.00 15.00 0.43474
23 200.00 30.00 30.00 0.32283
24 200.00 30.00 45.00 0.27069
25 200.00 40.00 15.00 0.49065
26 200.00 40.00 30.00 0.36369
27 200.00 40.00 45.00 0.30467
A-2

SOURCE: A SITE: 2 R = 89.13 km
EQ ~O' fm T FBA(bars) (Hz) (sec) :g)
1 100.00 20.00 18.00 o 19876
2 100.00 20.00 36.00 o 14782
3 100.00 20.00 54.00 o 12403
4 100.00 30.00 18.00 o 23780
5 100.00 30.00 36.00 o 17638
6 100.00 30.00 54.00 o 14780
7 100.00 40.00 18.00 o 26768
8 100.00 40.00 36.00 o 19820
9 100.00 40.00 54.00 o 16594
10 150.00 20.00 16.00 o 27365
13 150.00 30.00 16.00 o 32761
14 150.00 30.00 32.00 o 24318
15 150.00 30.00 48.00 o 20386
16 150.00 40.00 16.00 o 36891
17 150.00 40.00 32.00 o 27335
18 150.00 40.00 48.00 o 22894
19 200.00 20.00 15.00 o 34056
20 200.00 20.00 30.00 025362
21 200.00 20.00 45.00 o 2129622 200.00 30.00 15.00 o 40786
23 200.00 30.00 30.00 0,30288
24 200.00 30.00 45.00 0,25396
25 200.00 40.00 15.00 0.45937
26 200.00 40.00 30.00 0,34052
27 200.00 40.00 45.00 0,28526
A-3

SOURCE: A SITE: 3 R = 96.35 km
EQ ~(j fm T PBA(bars) (Hz) (sec) (g)
1 100.00 20.00 8.00 0.18113
2 100.00 20.00 36.00 0.13471
3 100.00 20.00 54.00 0.11304
4 100.00 30.00 18.00 0.21588
5 100.00 30.00 36.00 0.16012
6 100.00 30.00 54.00 0.13418
7 100.00 40.00 18.00 0.24222
8 100.00 40.00 36.00 0.17936
9 100.00 40.00 54.00 0.15017
10 150.00 20.00 16.00 0.2493811 150.00 20.00 32.00 0.18563
12 150.00 20.00 48.00 0.15584
13 150.00 30.00 16.00 0.29740
14 150.00 30.00 32.00 0.22076
15 150.00 30.00 48.00 0.18507
16 150.00 40.00 16.00 0.33382
17 150.00 40.00 32.00 0.24736
18 150.00 40.00 48.00 0.20718
19 200.00 20.00 15.00 0.31035
20 200.00 20.00 30.00 0.23113
21 200.00 20.00 45.00 0.19408
22 200.00 30.00 15.00 0.37024
23 200.00 30.00 30.00 0.27495
24 200.00 30.00 45.00 0.23055
25 200.00 40.00 15.00 0.41567
26 200.00 40.00 30.00 0.30814
27 200.00 40.00 45.00 0.25814
A-4

SOURCE: A SITE: 4 R = 108.30 km
EQ ~a fm T FBA(bars) (Hz) (sec) :g)
1 100.00 20.00 18.00 o 16551
2 100.00 20.00 36.00 o 12309
3 100.00 20.00 54.00 o 10329
4 100.00 30.00 18.00 o 19648
5 100.00 30.00 36.00 o 14574
6 100.00 30.00 54.00 o 12213
7 100.00 40.00 18.00 o 21974
8 100.00 40.00 36.00 o 16272
9 100.00 40.00 54.00 o 13624
10 150.00 20.00 16.00 o 22786
11 150.00 20.00 32.00 o 16962
12 150.00 20.00 48.00 o 14240
13 150.00 30.00 16.00 o 27067
14 150.00 30.00 32.00 o 20093
15 150.00 30.00 48.00 o 16845
16 150.00 40.00 16.00 o 30283
17 150.00 40.00 32.00 o 22441
18 150.00 40.00 48.00 o 18796
19 200.00 20.00 15.00 o 2835720 200.00 20.00 30.00 021119
21 200.00 20.00 45.00 0,17734
22 200.00 30.00 15.00 0,33696
23 200.00 30.00 30.00 025025
24 200.00 30.00 45.00 0,20984
25 200.00 40.00 15.00 0,37708
26 200.00 40.00 30.00 0,27954
27 200.00 40.00 45.00 0,23420
A-S

SOURCE: A SITE: 5 R = 118.63 km
EQ L1n fm T PBA(bars) (Hz) (sec) (g)
1 100.00 20.00 18.00 0.15653
2 100.00 20.00 36.00 0.11642
3 100.00 20.00 54.00 0.09770
4 100.00 30.00 18.00 0.18536
5 100.00 30.00 36.00 0.13749
6 100.00 30.00 54.00 0.11522
7 100.00 40.00 18.00 0.20687
8 100.00 40.00 36.00 0.15319
9 100.00 40.00 54.00 0.12827
10 150.00 20.00 16.00 0.21550
11 150.00 20.00 32.00 0.16042
12 150.00 20.00 48.00 0.13468
13 150.00 30.00 16.00 0.25534
14 150.00 30.00 32.00 0.18956
15 150.00 30.00 48.00 0.15892
16 150.00 40.00 16.00 0.28509
17 150.00 40.00 32.00 0.21127
18 150.00 40.00 48.00 0.17696
19 200.00 20.00 15.00 0.26818
20 200.00 20.00 30.00 0.19974
21 200.00 20.00 45.00 0.16773
22 200.00 30.00 15.00 0.31788
23 200.00 30.00 30.00 0.23609
24 200.00 30.00 45.00 0.19797
25 200.00 40.00 15.00 0.35498
26 200.00 40.00 30.00 0.26318
27 200.00 40.00 45.00 0.22049
A-6

SOURCE: A SITE: 6 R = 145.81 km
EQ L10" fm T PBA(bars) (Hz) (sec) (g)
1 100.00 :W.OO 18.00 C.13770
2 100.00 20.00 36.00 C.I0242
3 100.00 20.00 54.00 ( .08595
4 100.00 30.00 18.00 ('.16207
5 100.00 30.00 36.00 (1.12023
6 100.00 30.00 54.00 (1.10076
7 100.00 40.00 18.00 0.18000
8 100.00 40.00 36.00 0.13330
9 100.00 40.00 54.00 0.11162
10 150.00 20.00 16.00 0.18957
11 150.00 20.00 32.00 0.14113
12 150.00 20.00 48.00 0.11848
13 150.00 30.00 16.00 0.22326
14 150.00 30.00 32.00 0.16576
15 150.00 30.00 48.00 0.13897
16 150.00 40.00 16.00 0.24804
17 150.00 40.00 32.00 0.18383
18 150.00 40.00 48.00 0.15399
19 200.00 20.00 15.00 0.2359120 200.00 20.00 30.00 0.17571
21 200.00 20.00 45.00 0.14756
22 200.00 30.00 15.00 0.27794
23 200.00 30.00 30.00 0.20644
24 200.00 30.00 45.00 1).17312
25 200.00 40.00 15.00 1).30885
26 200.00 40.00 30.00 1).22900
27 200.00 40.00 45 ..00 ').19186
A-7

SOURCE:B SITE: 1 R = 95.79 km
EQ ,1a fm T PBA(bars) (Hz) (sec) (g)
1 100.00 20.00 18.00 0.18241
2 100.00 20.00 36.00 0.13566
3 100.00 20.00 54.00 0.11384
4 100.00 30.00 18.00 0.21747
5 100.00 30.00 36.00 0.16130
6 100.00 30.00 54.00 0.13517
7 100.00 40.00 18.00 0.24407
8 100.00 40.00 36.00 0.18072
9 100.00 40.00 54.00 0.15131
10 150.00 20.00 16.00 0.25114
11 150.00 20.00 32.00 0.18694
12 150.00 20.00 48.00 0.15694
13 150.00 30.00 16.00 0.29959
14 150.00 30.00 32.00 0.22239
15 150.00 30.00 48.00 0.18643
16 150.00 40.00 16.00 0.33636
17 150.00 40.00 32.00 0.24924
18 150.00 40.00 48.00 0.20876
19 200.00 20.00 15.00 0.31254
20 200.00 20.00 30.00 0.23276
21 200.00 20.00 45.00 0.19545
22 200.00 30.00 15.00 0.37297
23 200.00 30.00 30.00 0.27698
24 200.00 30.00 45.00 0.23225
25 200.00 40.00 15.00 0.41884
26 200.00 40.00 30.00 0.31049
27 200.00 40.00 45.00 0.26011
A.-8

SOURCE:B SITE: 2 R = 92.36 km
EQ .10" fm T PBA(bars) (Hz) (sec) (g)
1 100.00 =~O.OO 18.00 0.19054
2 100.00 20.00 36.00 0.14171
3 100.00 20.00 54.00 0.11891
4 100.00 ~'O.OO 18.00 0.22758
5 100.00 ~'O.OO 36.00 0.16880
6 100.00 ~'O.OO 54.00 0.14145
7 100.00 LO.OO 18.00 0.25581
8 100.00 LO.OO 36.00 0.18941
9 100.00 LO.OO 54.00 0.15858
10 150.00 20.00 16.00 0.26234
11 150.00 20.00 32.00 0.19527
12 150.00 20.00 48.00 0.16393
13 150.00 ~'O.OO 16.00 0.31352
14 150.00 ~'O.OO 32.00 0.23272
15 150.00 ~'O.OO 48.00 0.19510
16 150.00 LO.OO 16.00 0.35253
17 150.00 LO.OO 32.00 0.26122
18 150.00 LO.OO 48.00 0.21879
19 200.00 20.00 15.00 0.3264820 200.00 20.00 30.00 0.24314
21 200.00 20.00 45.00 0.20416
22 200.00 ~,O.OO 15.00 0.39031
23 200.00 ~,O.OO 30.00 0.28985
24 200.00 ~,O.OO 45.00 0.24304
25 200.00 L.O.OO 15.00 0.43898
26 200.00 L.O.OO 30.00 0.32541
27 200.00 L.O.OO 45.00 0.27261
A-9

SOURCE: B SITE: 3 R = 67.10 km
EQ tlu fm T PBA(bars) (Hz) (sec) (g)
1 100.00 20.00 18.00 0.27601
2 100.00 20.00 36.00 0.20524
3 100.00 20.00 54.00 0.17221
4 100.00 30.00 18.00 0.33427
5 100.00 30.00 36.00 0.24790
6 100.00 30.00 54.00 0.20772
7 100.00 40.00 18.00 0.38013
8 100.00 40.00 36.00 0.28141
9 100.00 40.00 54.00 0.23559
10 150.00 20.00 16.00 0.3800311 150.00 20.00 32.00 0.28284
12 150.00 20.00 48.00 0.23742
13 150.00 30.00 16.00 0.46053
14 150.00 30.00 32.00 0.34179
15 150.00 30.00 48.00 0.28651
16 150.00 40.00 16.00 0.52390
17 150.00 40.00 32.00 0.38813
18 150.00 40.00 48.00 0.32506
19 200.00 20.00 15.00 0.47296
20 200.00 20.00 30.00 0.35218
21 200.00 20.00 45.00 0.29570
22 200.00 30.00 15.00 0.57335
23 200.00 30.00 30.00 0.42572
24 200.00 30.00 45.00 0.35694
25 200.00 40.00 15.00 0.65239
26 200.00 40.00 30.00 0.48352
27 200.00 40.00 45.00 0.40503
A-IO

SOURCE: B SITE: 4 R = 48.63 km
EQ ~(j fm T PBA(bars) (Hz) (sec) (g)
1 100.00 20.00 18.00 0.39318
2 100.00 20.00 36.00 0.29235
3 100.00 20.00 54.00 0.24529
4 100.00 30.00 18.00 0.48125
5 100.00 30.00 36.00 0.35686
6 100.00 30.00 54.00 0.29900
7 100.00 40.00 18.00 0.55220
8 100.00 40.00 36.00 0.40875
9 100.00 40.00 54.00 0.34218
10 150.00 20.00 16.00 0.54137
11 150.00 20.00 32.00 1).40289
12 150.00 20.00 48.00 1).33818
13 150.00 30.00 16..00 1).66304
14 150.00 30.00 32.00 1).49204
15 150.00 30.00 48.00 1).41243
16 150.00 40.00 16.00 ).76108
17 150.00 40.00 32.00 ).56378
18 150.00 40.00 48.00 ).47213
19 200.00 20.00 15.00 ).67378
20 200.00 20.00 30.00 J.50167
21 200.00 20.00 45.00 D.42120
22 200.00 30.00 15.00 D.82550
23 200.00 30.00 30.00 0.61287
24 200.00 30.00 45.00 0.51383
25 200.00 40.00 15.00 0.94776
26 200.00 40.00 30.00 0.70235
27 200.00 40.00 45.00 0.58830
A-ll
SOURCE: B SITE: 5 R = 42.94 km
EQ L}<J fm T PBA(bars) (Hz) (sec) (g)
1 100.00 20.00 18.00 0.44846
2 100.00 20.00 36.00 0.33344
3 100.00 20.00 54.00 0.27977
4 100.00 30.00 18.00 0.55074
5 100.00 30.00 36.00 0.40837
6 100.00 30.00 54.00 0.34216
7 100.00 40.00 18.00 0.63373
8 100.00 40.00 36.00 0.46908
9 100.00 40.00 54.00 0.39268
10 150.00 20.00 16.00 0.61751
11 150.00 20.00 32.00 0.45953
12 150.00 20.00 48.00 0.38572
13 150.00 30.00 16.00 0.75879
14 150.00 30.00 32.00 0.56308
15 150.00 30.00 48.00 0.47197
16 150.00 40.00 16.00 0.87346
17 150.00 40.00 32.00 0.64700
18 150.00 40.00 48.00 0.54181
19 200.00 20.00 15.00 0.76854
20 200.00 20.00 30.00 0.57221
21 200.00 20.00 45.00 0.48042
22 200.00 30.00 15.00 0.94472
23 200.00 30.00 30.00 0.70136
24 200.00 30.00 45.00 0.58801
25 200.00 40.00 15.00 1.08772
26 200.00 40.00 30.00 0.80604
27 200.00 40.00 45.00 0.67514
A-12

SOURCE: B SITE: 6 R = 56.48 km
EQ L\O" fm T PBA(bars) (Hz) (sec) (g)
1 100.00 20.00 18.00 0.33432
2 100.00 20.00 36.00 0.24859
3 100.00 20.00 54.00 0.20858
4 100.00 30.00 18.00 0.40736
5 100.00 30.00 36.00 0.30208
6 100.00 30.00 54.00 0.25311
7 100.00 40.00 18.00 0.46561
8 100.00 40.00 36.00 0.34468
9 100.00 40.00 54.00 0.28855
10 150.00 20.00 16.00 0.46033
11 150.00 20.00 32.00 0.34259
12 150.00 20.00 48.00 0.28757
13 150.00 30.00 16.00 0.56123
14 150.00 30.00 32.00 0.41651
15 150.00 30.00 48.00 0.34913
16 150.00 40.00 16.00 0.64173
17 150.00 40.00 32.00 0.47539
18 150.00 40.00 48.00 0.39812
19 200.00 20.00 15.00 0.57291
20 200.00 20.00 30.00 0.42658
21 200.00 20.00 45.00 0.35817
22 200.00 30.00 15.00 0.69874
23 200.00 30.00 30.00 0.51878
24 200.00 30.00 45.00 0.43495
25 200.00 40.00 15.00 0.79914
26 200.00 40.00 30.00 0.59224
27 200.00 40.00 45.00 0.49608
A-J3

SOURCE: C SITE: 1 R = 118.25 km
EQ L1a fm T PBA(bars) (Hz) (sec) (g)
1 100.00 20.00 18.00 0.15684
2 100.00 20.00 36.00 0.11665
3 100.00 20.00 54.00 0.09789
4 100.00 30.00 18.00 0.18574
5 100.00 30.00 36.00 0.13778
6 100.00 30.00 54.00 0.11546
7 100.00 40.00 18.00 0.20732
8 100.00 40.00 36.00 0.15352
9 100.00 40.00 54.00 0.12855
10 150.00 20.00 16.00 0.2159311 150.00 20.00 32.00 0.16074
12 150.00 20.00 48.00 0.13495
13 150.00 30.00 16.00 0.25587
14 150.00 30.00 32.00 0.18995
15 150.00 30.00 48.00 0.15925
16 150.00 40.00 16.00 0.28570
17 150.00 40.00 32.00 0.21172
18 150.00 40.00 48.00 0.17734
19 200.00 20.00 15.00 0.26872
20 200.00 20.00 30.00 0.20014
21 200.00 20.00 45.00 0.16806
22 200.00 30.00 15.00 0.31854
23 200.00 30.00 30.00 0.23658
24 200.00 30.00 45.00 0.19838
25 200.00 40.00 15.00 0.35575
26 200.00 40.00 30.00 0.26374
27 200.00 40.00 45.00 0.22096
A-14
SOURCE: C SITE: 2 R = 113.73 km
EQ ~cr fm T PBA(bars) (Hz) (sec) (g)
1 100.00 20.00 18.00 0.16064
2 100.00 20.00 36.00 0.11948
3 100.00 :W.OO 54.00 C.I0026
4 100.00 30.00 18.00 C.19045
5 100.00 30.00 36.00 C.14127
6 100.00 30.00 54.00 (.11839
7 100.00 40.00 18.00 (.21276
8 100.00 40.00 36.00 (.15755
9 100.00 40.00 54.00 (.13192
10 150.00 :W.OO 16.00 (.22116
11 150.00 20.00 32.00 (.16463
12 150.00 20.00 48.00 (.13821
13 150.00 .30.00 16.00 (,26236
14 150.00 .30.00 32.00 ('.19476
15 150.00 30.00 48.00 ('.16328
16 150.00 40.00 16.00 (1.29320
17 150.00 40.00 32.00 (1.21728
18 150.00 40.00 48.00 (1.18200
19 200.00 20.00 15.00 (1.27523
20 200.00 20.00 30.00 (1.20498
21 200.00 20.00 45.00 (1.17213
22 200.00 30.00 15.00 (1.32661
23 200.00 30.00 30.00 (1.24257
24 200.00 30.00 45.00 (1.20340
25 200.00 40.00 15.00 (1.36509
26 200.00 40.00 30.00 (1.27066
27 200.00 40.00 45.00 (1.22676
A-15

SOURCE: C SITE: 3 R = 84.68 km
EQ L1e> fm T PBA(bars) (Hz) (sec) (g)
1 100.00 20.00 18.00 0.21115
2 100.00 20.00 36.00 0.15702
3 100.00 20.00 54.00 0.13176
4 100.00 30.00 18.00 0.25324
5 100.00 30.00 36.00 0.18782
6 100.00 30.00 54.00 0.15739
7 100.00 40.00 18.00 0.28563
8 100.00 40.00 36.00 0.21148
9 100.00 40.00 54.00 0.17706
10 150.00 20.00 16.00 0.29071
11 150.00 20.00 32.00 0.21638
12 150.00 20.00 48.00 0.18165
13 150.00 30.00 16.00 0.34887
14 150.00 30.00 32.00 0.25895
15 150.00 30.00 48.00 0.21708
16 150.00 40.00 16.00 0.39364
17 150.00 40.00 32.00 0.29167
18 150,00 40.00 48.00 0.24428
19 200.00 20.00 15.00 0.36179
20 200.00 20.00 30.00 0.26942
21 200.00 20.00 45.00 0.22623
22 200.00 30.00 15.00 0.43433
23 200.00 30.00 30.00 0.32253
24 200.00 30.00 45.00 0.27043
25 200.00 40.00 15.00 0.49018
26 200.00 40.00 30.00 0.36334
27 200.00 40.00 45.00 0.30438
A-16

SOURCE: C SITE: 4 R = 59.25 km
EQ ~cr fm T PBA(bars) (Hz) (sec) (g)
1 100.00 20.00 18.00 0.31716
2 100.00 :~O.OO 36.00 0.23584
3 100.00 20.00 54.00 0.19788
4 100.00 ]0.00 18.00 0.38583
5 100.00 ]0.00 36.00 0.28612
6 100.00 :10.00 54.00 0.23974
7 100.00 40.00 18.00 0.44042
8 100.00 40.00 36.00 0.32603
9 100.00 40.00 54.00 0.27294
10 150.00 :~O.OO 16.00 0.43670
11 150.00 :~O.OO 32.00 0.32500
12 150.00 :~O.OO 48.00 0.27281
13 150.00 30.00 16.00 0.53157
14 150.00 30.00 32.00 0.39450
15 150.00 :W.OO 48.00 0.33068
16 150.00 40.00 16.00 0.60700
17 150.00 40.00 32.00 0.44967
18 150.00 40.00 48.00 0.37659
19 200.00 20.00 15.00 0.5434920 200.00 20.00 30.00 0.40468
21 200.00 20.00 45.00 0.33978
22 200.00 :W.OO 15.00 0.66181
23 200.00 30.00 30.00 0.49137
24 200.00 30.00 45.00 0.41197
25 200.00 40.00 15.00 0.75588
26 200.00 40.00 30.00 0.56020
27 200.00 40.00 45.00 0.46924
A-17

SOURCE: C SITE: 5 R = 45.08 km
EQ 110" im T PBA(bars) (Hz) (sec) (g)
1 100.00 20.00 18.00 0.42612
2 100.00 20.00 36.00 0.31684
3 100.00 20.00 54.00 0.26583
4 100.00 30.00 18.00 0.52265
5 100.00 30.00 36.00 0.38755
6 100.00 30.00 54.00 0.32472
7 100.00 40.00 18.00 0.60076
8 100.00 40.00 36.00 0.44469
9 100.00 40.00 54.00 0.37226
10 150.00 20.00 16.00 0.5867411 150.00 20.00 32.00 0.43664
12 150.00 20.00 48.00 0.36651
13 150.00 30.00 16.00 0.72009
14 150.00 30.00 32.00 0.53437
15 150.00 30.00 48.00 0.44791
16 150.00 40.00 16.00 0.82802
17 150.00 40.00 32.00 0.61335
18 150.00 40.00 48.00 0.51364
19 200.00 20.00 15.00 0.73025
20 200.00 20.00 30.00 0.54370
21 200.00 20.00 45.00 0.45649
22 200.00 30.00 15.00 0.89653
23 200.00 30.00 30.00 0.66559
24 200.00 30.00 45.00 0.55802
25 200.00 40.00 15.00 1.03113
26 200.00 40.00 30.00 0.76411
27 200.00 40.00 45.00 0.64002
1''\-18

SOURCE: C SITE: I) R = 38.91 km
EQ ~() fm T FBA(bars) (Hz) (sec) ~g)
1 100.00 20.00 18.00 o 49670
2 100.00 20.00 36.00 o 36930
3 100.00 20.00 54.00 o 30985
4 100.00 30.00 18.00 o 61142
5 100.00 30.00 36.00 a 45336
6 100.00 30.00 54.00 a 37985
7 100.00 40.00 18.00 o 70497
8 100.00 40.00 36.00 o 52181
9 100.00 40.00 54.00 a 43681
10 150.00 20.00 16.00 o 68393
11 150.00 20.00 32.00 o 50895
12 150.00 20.00 48.00 o 42720
13 150.00 30.00 16.00 o 84241
14 150.00 30.00 32.00 o 62512
15 150.00 30.00 48.00 o 52396
16 150.00 40.00 16.00 o 97166
17 150.00 40.00 32.00 071973
18 150.00 40.00 48.00 0,60271
19 200.00 20.00 15.00 08512120 200.00 20.00 30.00 0,63375
21 200.00 20.00 45.00 0,53208
22 200.00 30.00 15.00 1,04883
23 200.00 30.00 30.00 0,77863
24 200.00 30.00 45.00 0,65278
25 200.00 40.00 15.00 1,21002
26 200.00 40.00 30.00 0,89665
27 200.00 40.00 45.00 0,75102
A-19


NATIONAL CENTER FOR EARTHQUAKE ENGINEERING RESEARCHLIST OF TECHl'.'lCAL REPORTS
The National Center for Earthquake Engineering Research (NCEER) publishes technical reports on a variety 'If subjects relatedto earthquake engineering written by authors funded through NCEER. These reports are available fron both NCEER'sPublications Department and the National Technical Information Service (NTIS). Requests for reports should be directed to thePublications Department, National Center for Earthquake Enginc:ering Research, State University of New YOlk at Buffalo, RedJacket Quadrangle, Buffalo, New York 14261. Reports can also be requested through NTIS" 5285 Port Royal~oad, Springfield,Virginia 22161. NTIS accession numbers are shown in parenthesis, if available.
NCEER-87-0001
NCEER-87-0002
NCEER-87-0003
NCEER-87-0004
NCEER-87-0005
NCEER-87-0006
NCEER-87-0007
NCEER-87-0008
NCEER-87-0009
NCEER-87-0010
NCEER-87-0011
NCEER-87-0012
NCEER-87-0013
NCEER-87-0014
NCEER-87-0015
NCEER-87-0016
"First-Year Program in Research, Educaion and Technology Transfer," 3/5/87, (PB81-134275/AS).
"Experimental Evaluation of Instantane)us Optimal Algorithms for Structural ContJ 01," by R.C. Lin,T.T. Soong and A.M. Reinhom, 4/20/87 (PB88-134341/AS).
"Experimentation Using the Earthquake Simulation Facilities at University at B 1ffalo," by A.M.Reinhom and R.L. Ketter, to be published.
'The System Characteristics and Performance of a Shaking Table," by J.S. Hwang K.C. Chang andG.C. Lee, 6/1/87, (PB88-134259/AS). This report is available only through NTIS (see address givenabove).
"A Finite Element Formulation for Nonlinear Viscoplastic Material Using a Q Model, ' by O. Gyebi andG. Dasgupta, 11(2/87, (PB88-213764/A~).
"Symbolic Manipulation Program (SMJ» - Algebraic Codes for Two and Three Dimensional FiniteElement Formulations," by X. Lee and C. Dasgupta, 1119/87, (PB88-219522/AS).
"Instantaneous Optimal Control Laws fe,r Tall Buildings Under Seismic Excitations," by J.N. Yang, A.Akbarpour and P. Ghaemmaghami, 6/10'87, (PB88-134333/AS).
"IDARC: Inelastic Damage Analysis of Reinforced Concrete Frame - Shear-Wall Structures," by Y.J.Park, A.M. Reinhom and S.K. Kunnath, 7/20/87, (PB88-134325/AS).
"Liquefaction Potential for New York State: A Preliminary Report on Sites in Manhattan and Buffalo,"by M. Budhu, V. Vijayakumar, R.F. Giese and L. Baumgras, 8(31/87, (PB88-163704/AS). This reportis available only through NTIS (see address given above).
"Vertical and Torsional Vibration of Foundations in Inhomogeneous Media," by A.S. Veletsos andKW. Dotson, 6/1/87, (PB88-134291/AS).
"Seismic Probabilistic Risk Assessmen, and Seismic Margins Studies for Nuclear :>ower Plants," byHoward H.M. Hwang, 6/15/87, (PB88-134267/AS).
"Parametric Studies of Frequency R,:sponse of Secondary Systems Under Gnund-AccelerationExcitations," by Y. Yong and Y.K. Lin, 6/10/87, (PB88-134309/AS).
"Frequency Response of Secondary Sy;tems Under Seismic Excitation," by J.A. H lLung, J. Cai andY.K. Lin, 7(31/87, (PB88-134317/AS).
"Modelling Earthquake Ground Motiom in Seismically Active Regions Using Pararletric Time SeriesMethods," by G.W. Ellis and A.S. Cakrrak, 8(25/87, (PB88-134283/AS).
"Detection and Assessment of Seismi~ Structural Damage," by E. DiPasquale alld A.S. Cakmak,8/25/87, (PB88-163712/AS).
"Pipeline Experiment at Parkfield, Caifomia," by J. Isenberg and E. Richardson, 9/15/87, (PB88163720/AS). This report is available only through NTIS (see address given above).
B-1
NCEER-87-0017
NCEER-87-0018
NCEER-87-0019
NCEER-87-0020
NCEER-87-0021
NCEER-87-0022
NCEER-87-0023
NCEER-87-0024
NCEER-87-0025
NCEER-87-0026
NCEER-87-0027
NCEER-87-0028
NCEER-88-0001
NCEER-88-0002
NCEER-88-0003
NCEER-88-0004
NCEER-88-0005
NCEER-88-0006
NCEER-88-0007
"Digital Simulation of Seismic Ground Motion," by M. Shinozuka, G. Deodatis and T. Harada, 8{31/87,(PB88-155197/AS). This n~port is available only through NTIS (see address given above).
"Practical Considerations for Structural Control: System Uncertainty, System Time Delay and Truncation of Small Control Forces," J.N. Yang and A. Akbarpour, 8/10/87, (PB88-163738/AS).
"Modal Analysis of Nonclassically Damped Structural Systems Using Canonical Transfonnation," byIN. Yang, S. Sarkani and F.x. Long, 9(27/87, (PB88-187851/AS).
"A Nonstationary Solution :in Random Vibration Theory," by J.R. Red-Horse and P.O. Spanos, 11/3/87,(PB88-163746/AS).
"Horizontal Impedances for Radially Inhomogeneous Viscoelastic Soil Layers," by A.S. Veletsos andK.W. Dotson, 10/15/87, (PB88-150859/AS).
"Seismic Damage Assessment of Reinforced Concrete Members," by Y.S. Chung, C. Meyer and M.Shinozuka, 10/9/87, (PB88-150867/AS). This report is available only through NTIS (see address givenabove).
"Active Structural Control in Civil Engineering," by T.T. Soong, 11/11/87, (PB88-187778/AS).
Vertical and Torsional Impedances for Radially Inhomogeneous Viscoelastic Soil Layers," by K.W.Dotson and A.S. Veletsos, ]2/87, (PB88-]87786/AS).
"Proceedings from the Symposium on Seismic Hazards, Ground Motions, Soil-Liquefaction andEngineering Practice in Eastern North America," October 20-22, 1987, edited by K.H. Jacob. 12/87.(PB88-188115/AS).
"Report on the Whittier-Narrows, California, Earthquake of October ], ]987," by J. Pantelic and A.Reinhorn, 11/87, (PB88-187752/AS). This report is available only through NTIS (see address givenabove).
"Design of a Modular Program for Transient Nonlinear Analysis of Large 3-D Building Structures," byS. Srivastav and IF. Abel, ]2{30/87, (PB88-187950/AS).
"Second-Year Program in Research, Education and Technology Transfer," 3/8/88, (PB88-2]9480/AS).
"Workshop on Seismic Computer Analysis and Design of Buildings With Interactive Graphics," by W.McGuire, J.F. Abel and C.H. Conley, ]/]8/88, (PB88-]87760/AS).
"Optimal Control of Nonlinear Flexible Structures," by J.N. Yang, FX. Long and D. Wong, ](22/88,(PB88-213772/AS).
"Substructuring Techniques in the Time Domain for Primary-Secondary Structural Systems," by G.D.Manolis and G. Juhn, 2/10/88, (PB88-213780/AS).
"Iterative Seismic Analysis of Primary-Secondary Systems," by A. Singhal, L.D. Lutes and P.O.Spanos, 2/23/88, (PB88-213798/AS).
"Stochastic Firtite Element Expansion for Random Media," by P.D. Spanos and R. Ghanem, 3/]4/88,(PB88-213806/AS).
"Combining Structural Optimization and Structural Control," by F.Y. Cheng and c.P. Pantelides,1/]0/88, (PB88-2138]4/AS).
"Seismic Perfonnance Assessment of Code-Designed Structures," by H.H-M. Hwang, J-W. Jaw andH-J. Shau, 3/20/88, (PB88-219423/AS).
B-2

NCEER-88-0008
NCEER-88-0009
NCEER-88-0010
NCEER-88-0011
NCEER-88-0012
NCEER-88-0013
NCEER-88-0014
NCEER-88-0015
NCEER-88-0016
NCEER-88-0017
NCEER-88-0018
NCEER-88-0019
NCEER-88-0020
NCEER-88-0021
NCEER-88-0022
NCEER-88-0023
NCEER-88-0024
NCEER-88-0025
NCEER-88-0026
NCEER-88-0027
"Reliability Analysis of Code-Designed Structures Under Natural Hazards," by F.H-M. Hwang, H.Ushiba and M. Shinozuka, 2(29/88, (PE 88-229471/AS).
"Seismic Fragility Analysis of Shear Wall Structures," by J-W Jaw and H.H-M Hwang, 4/30/88,(PB89-102867/AS).
"Base Isolation of a Multi-Story Bui:ding Under a Harmonic Ground Motion - A Comparison ofPerformances of Various Systems," by F-G Fan, G. Ahmadi and LG. Tadjbakhsh, 5/18/88,(PB89-122238/AS).
"Seismic Floor Response Spectra for a C:ombined System by Green's Functions," by F.M. Lavelle, L.ABergman and P.D. Spanos, 5/1/88, (PBg9-102875/AS).
"A New Solution Technique for Randomly Excited Hysteretic StlUctures," by G.Q. Cai and YK. Lin,5/16/88, (PB89-102883/AS).
"A Study of Radiation Damping ane Soil-Structure Interaction Effects in the Centrifuge," by K.Weissman, supervised by J.H. Prevost, 5(24/88, (PB89-144703/AS).
"Parameter Identification and Implemeltation of a Kinematic Plasticity Model for Frictional Soils," byHI. Prevost and D.V. Griffiths, to be published.
'Two- and Three- Dimensional Dynamic Finite Element Analyses of the Long Val'ey Dam," by D.V.Griffiths and J.H. Prevost, 6/17/88, (PB89-144711/AS).
"Damage Assessment of Reinforced Concrete Structures in Eastern United States," Jy A.M. Reinhom,M.J. Seidel, S.K. Kunnath and YJ. Parl~, 6/15/88, (PB89-122220/AS).
"Dynamic Compliance of Vertically LJaded Strip Foundations in Multilayered Viscoelastic Soils," byS. Ahmad and AS.M. Israil, 6/17/88, (pB89-102891/AS).
"An Experinlental Study of Seismic Structural Response With Added Viscoelastic :)ampers," by R.C.Lin, Z. Liang, T.T. Soong and R.H. Zhmg, 6/30/88, (PB89-122212/AS).
"Experimental Investigation of Primary - Secondary System Interaction," by G.D. Manolis, G. Juhn andAM. Reinhom, 5(27/88, (PB89-12220L1/AS).
"A Response Spectrum Approach For Analysis of Nonclassically Damped Structures," by J.N. Yang, S.Sarkani and F.x. Long, 4(22/88, (PB89 ·102909/AS).
"Seismic Interaction of Structures and :ioi1s: Stochastic Approach," by A.S. Velets01 and A.M. Prasad,7(21/88, (PB89-122196/AS).
"Identification of the Serviceability Linit State and Detection of Seismic Structural Damage," by E.DiPasquale and A.S. Cakmak, 6/15/88, (PB89-122188/AS).
"Multi-Hazard Risk Analysis: Case of a Simple Offshore Structure," by B.K. Bhartia and E.H.Vanmarcke, 7(21/88, (PB89-145213/A5).
"Automated Seismic Design of Reinforced Concrete Buildings," by Y.S. Chung, C. Meyer and M.Shinozuka, 7/5/88, (PB89-122170/AS).
"Experimental Study of Active Contnl of MDOF Structures Under Seismic Ex,;itations," by L.L.Chung, R.C. Lin, TT. Soong and A.M. Reinhorn, 7/10/88, (PB89-122600/AS).
"Earthquake Simulation Tests of a Low-Rise Metal Structure," by J.S. Hwang, K.C. Chang, G.C. Leeand R.L. Ketter, 8/1/88, (PB89-102917IAS).
"Systems Study of Urban Response and Reconstruction Due to Catastrophic Earthquakes," by F. Kozinand H.K. Zhou, 9(22/88, (PB90-162348/AS).
B-3

NCEER-88-0028
NCEER-88-0029
NCEER-88-0030
NCEER-88-0031
NCEER-88-0032
NCEER-88-0033
NCEER-88-0034
NCEER-88-0035
NCEER-88-0036
NCEER-88-0037
NCEER-88-0038
NCEER-88-0039
NCEER-88-0040
NCEER-88-0041
NCEER-88-0042
NCEER-88-0043
NCEER-88-0044
NCEER-88-0045
NCEER-88-0046
"Seismic Fragility Analysis of Plane Frame Structures," by H.H-M. Hwang and Y.K. Low, 7(31/88,(PB89-131445/AS).
"Response Analysis of Stochastic Structures," by A. Kardara, C. Bucher and M. Shinozuka, 9/22/88,(PB89-174429/AS).
"Nonnormal Accelerations Due to Yielding in a Primary Structure," by D.C.K. Chen and L.D. Lutes,9/19/88, (PB89-131437/AS).
"Design Approaches for Soil-Structure Interaction," by A.S. Veletsos, A.M. Prasad and Y. Tang,12(30/88, (PB89-174437/AS).
"A Re-evaluation of Design Spectra for Seismic Damage Control," by C.J. Turkstra and A.G. Tallin,11/7/88, (PB89-145221/AS).
'The Behavior and Design of Noncontact Lap Splices Subjected to Repeated Inelastic Tensile Loading,"by V.E. Sagan, P. Gergely and R.N. White, 12/8/88, (PB89-163737/AS).
"Seismic Response of Pile Foundations," by S.M. Mamoon, P.K. Banerjee and S. Ahmad, 11/1/88,(PB89-145239/AS).
"Modeling of R/C Building Structures With Flexible Floor Diaphragms (IDARC2)," by A.M. Reinhorn,S.K. Kunnath and N. Panahshahi, 9/7/88, (PB89-207153/AS).
"Solution of the Dam-Reservoir Interaction Problem Using a Combination of FEM, BEM withParticular Integrals, Modal Analysis, and Substructuring," by C-S. Tsai, C.C. Lee and R.L. Ketter,12(31/88, (PB89-207146/AS).
"Optimal Placement of Actuators for Structural Control," by F.Y. Cheng and C.P. Pantelides, 8/15/88,(PB89-162846/AS).
''Teflon Bearings in Aseismic Base Isolation: Experimental Studies and Mathematical Modeling," by A.Mokha, M.C. Constantinou and A.M. Reinhorn, 12/5/88, (PB89-218457/AS).
"Seismic Behavior of Flat Slab High-Rise Buildings in the New York City Area," by P. Weidlinger andM. Ettouney, 10/15/88, (PB90-145681/AS).
"Evaluation of the Earthquake Resistance of Existing Buildings in New York City," by P. Wcidlingerand M. Ettouney, 10/15/88, to be published.
"Small-Scale Modeling Techniques for Reinforced Concrete Structures Subjected to Seismic Loads," byW. Kim, A. El-Attar and R.N. White, 11/22/88, (PB89-189625/AS).
"Modeling Strong Ground Motion from Multiple Event Earthquakes," by G.W. Ellis and A.S. Cakmak,10/15/88, (PB89-174445/AS).
"Nonstationary Models of Seismic Ground Acceleration," by M. Grigoriu, S.E. Ruiz and E.Rosenblueth, 7/15/88, (PB89-1896l7/AS).
"SARCF User's Guide: Seismic Analysis of Reinforced Concrete Frames," by Y.S. Chung, C. Meyerand M. Shinozuka, 11/9/88, (PB89·174452/AS).
"First Expert Panel Meeting on Disaster Research and Planning," edited by J. Pantelic and J. Stoyle,9/15/88, (PB89-174460/AS).
"Preliminary Studies of the Effect of Degrading Infill Walls on the Nonlinear Seismic Response of SteelFrames," by C.Z. Chrysostomou, P. Gergely and J.F. Abel, 12/19/88, (PB89-208383/AS).
B-4

NCEER-88-0047
NCEER-89-0001
NCEER-89-0002
NCEER-89-0003
NCEER-89-0004
NCEER-89-0005
NCEER-89-0006
NCEER-89-0007
NCEER-89-0008
NCEER-89-0009
NCEER-89-ROlO
NCEER-89-0011
NCEER-89-0012
NCEER-89-0013
NCEER-89-0014
NCEER-89-0015
NCEER-89-0016
NCEER-89-P017
NCEER-89-0017
"Reinforced Concrete Frame Component Testing Facility - Design, Construction, Ins :rumentation andOperation," by S.P. Pessiki, C. Conley, T. Bond, P. Gergely and R.N. White, 12/16/88,(PB89-174478/AS).
"Effects of Protective Cushion and Soil Compliancy on the Response of Equipment Within a Seismically Excited Building," by J.A. HoLung, 2/16/89, (PB89-207179/AS).
"Statistical Evaluation of Response Modification Factors for Reinforced Concrete Structures," byH.H-M. Hwang and J-W. Jaw, 2/17/89, (PB89-207187/AS).
"Hysteretic Columns Under Random Excitation," by G-Q. Cai and Y.K. Lin, 1/9/89, (PB89-196513/AS).
"Experimental Study of 'Elephant Foot Bulge' Instability of Thin-Walled Metal Tanks," by Z-H. Jia andR.L. Ketter, 2/22/89, (PB89-207195/AS).
"Experiment on Performance of Buried Pipelines Across San Andreas Fault," b) J. Isenberg, E.Richardson and T.D. O'Rourke, 3/10/89, (PB89-218440/AS).
"A Knowledge-Based Approach to SlJuctural Design of Earthquake-Resistant Buildings," by M.Subramani, P. Gergely, C.H. Conley, J.F. Abel and A.H. Zaghw, 1/15/89, (PB89-218465/AS).
"Liquefaction Hazards and Their Effects on Buried Pipelines," by T.D. O'Rourke and P.A. Lane,2/1/89, (PB89-218481).
"Fundamentals of System Identificationn Structural Dynamics," by H. Imai, C-B. Yun, O. Maruyamaand M. Shinozuka, 1/26/89, (PB89-2072J l/AS).
"Effects of the 1985 Michoacan Earthqulke on Water Systems and Other Buried Lifelines in Mexico,"by A.G. Ayala and M.J. O'Rourke, 3/8/8'), (PB89-207229/AS).
"NCEER Bibliography of Earthquake Education Materials," by K.E.K. Ross, Second Revision, 9/1/89,(PB90-125352/AS).
"Inelastic Three-Dimensional Response Analysis of Reinforced Concrete Building StJUctures (IDARC3D), Part I - Modeling," by S.K. Kunnatr and A.M. Reinhorn, 4/17/89, (PB90-114612iAS).
"Recommended Modifications to ATC-14," by C.D. Poland and J.O. Malley, 4/12/89,(PB90-108648/AS).
"Repair and Strengthening of Beam-to-Column Connections Subjected to Earthquake Loading," by M.Corazao and AJ. Durrani, 2/28/89, (PB9)-109885/AS).
"Program EXKAL2 for Identification of Structural Dynamic Systems," by O. Maruyama, C-B. Yun, M.Hoshiya and M. Shinozuka, 5/19/89, (PB90-109877/AS).
"Response of Frames With Bolted Semi-Rigid Connections, Part I - Experimental Stuiy and AnalyticalPredictions," by PJ. DiCorso, A.M. Rdnhom, J.R. Dickerson, J.B. Radziminski and WL Harper,6/1/89, to be published.
"ARMA Monte Carlo Simulation in Frobabilistic Structural Analysis," by P.D. ~;panos and M.P.Mignolet, 7/10/89, (PB90-109893/AS).
"Preliminary Proceedings from the COl1ference on Disaster Preparedness - The Pla;e of EarthquakeEducation in Our Schools," Edited by K.~.K. Ross, 6/23/89.
"Proceedings from the Conference on Disaster Preparedness - The Place of Earthqt ake Education inOur Schools," Edited by K.E.K. Ross, 12/31/89, (PB90-207895).
B-.5

NCEER-89-00l8
NCEER-89-00l9
NCEER-89-0020
NCEER-89-002l
NCEER-89-0022
NCEER-89-0023
NCEER-89-0024
NCEER-89-0025
NCEER-89-0026
NCEER-89-0027
NCEER-89-0028
NCEER-89-0029
NCEER-89-0030
NCEER-89-003l
NCEER-89-0032
NCEER-89-0033
NCEER-89-0034
NCEER-89-0035
NCEER-89-0036
"Multidimensional Models of Hysteretic Material Behavior for Vibration Analysis of Shape MemoryEnergy Absorbing Devices, by E.1. Graesser and F.A. Cozzarelli, 6{l/89, (PB90-l64l46/AS).
"Nonlinear Dynamic Analysis of TIrree-Dimensional Base Isolated Structures (3D-BASIS)," by S.Nagarajaiah, A.M. Reinhorn and M.C. Constantinou, 8/3/89, (PB90-161936/AS).
"Structural Control Considering Time-Rate of Control Forces and Control Rate Constraints," by F.Y.Cheng and C.P. Pantelides, 8/3/89, (PB90-l20445/AS).
"Subsurface Conditions of Memphis and Shelby County," by K.W. Ng, T-S. Chang and H-H.M.Hwang, 7/26/89, (PB90-120437/AS).
"Seismic Wave Propagation Effects on Straight Jointed Buried Pipelines," by K. Elhmadi and MJ.O'Rourke, 8/24/89, (PB90-162322/AS).
"Workshop on Serviceability Analysis of Water Delivery Systems," edited by M. Grigoriu, 3/6/89,(PB90-l27424/AS).
"Shaking Table Study of a 1/5 Scale Steel Frame Composed of Tapered Members," by K.C. Chang, J.S.Hwang and G.C. Lee, 9/18/89, (PB90-l60l69/AS).
"DYNAlD: A Computer Program for Nonlinear Seismic Site Response Analysis - Technical Documentation," by Jean H. Prevost, 9/14/89, (PB90-16l944/AS).
"1:4 Scale Model Studies of Active Tendon Systems and Active Mass Dampers for Aseismic Protection," by A.M. Reinhorn, T.T. Soong, R.C. Lin, Y.P. Yang, Y. Fukao, H. Abe and M. Nakai, 9/15/89,(PB90-173246/AS).
"Scattering of Waves by Inclusions in a Nonhomogeneous Elastic Half Space Solved by BoundaryElement Methods," by P.K. Hadley, A. Askar and A.S. Cakmak, 6/15/89, (PB90-145699/AS).
"Statistical Evaluation of Deflection Amplification Factors for Reinforced Concrete Structures," byH.H.M. Hwang, J-W. Jaw and A.L. Ch'ng, 8/31/89, (PB90-164633/AS).
"Bedrock Accelerations in Memphis Area Due to Large New Madrid Earthquakes," by H.H.M. Hwang,C.H.S. Chen and G. Yu, 1l{l/89, (PB90-l62330/AS).
"Seismic Behavior and Response Sensitivity of Secondary Structural Systems," by Y.Q. Chen and T.T.Soong, 10/23/89, (PB90-164658/AS).
"Random Vibration and Reliability Analysis of Primary-Secondary Structural Systems," by Y. Ibrahim,M. Grigoriu and T.T. Soong, 11/10/89, (PB90-161951/AS).
"Proceedings from the Second U.S. - Japan Workshop on Liquefaction, Large Ground Deformation andTheir Effects on Lifelines, September 26-29,1989," Edited by T.D. O'Rourke and M. Hamada, 12/1/89,(PB90-209388/AS).
"Deterministic Model for Seismic Damage Evaluation of Reinforced Concrete Structures," by J.M.Bracci, A.M. Reinhorn, J.B. Mander and S.K. Kunnath, 9/27/89, to be published.
"On the Relation Between Local and Global Damage Indices," by E. DiPasquale and A.S. Cakmak,8/15/89, (PB90-l73865).
"Cyclic Undrained Behavior of Nonplastic and Low Plasticity Silts," by A.J. Walker and H.E. Stewart,7/26/89, (pB90-1835l8/AS),
"Liquefaction Potential of Surficial Deposits in the City of Buffalo, New York," by M. Budhu, R. Gieseand L. Baumgrass, 1/17/89, (PB90-208455/AS).
B-6
NCEER-89-0037
NCEER-89-0038
NCEER-89-0039
NCEER-89-0040
NCEER-89-0041
NCEER-90-0001
NCEER-90-0002
NCEER-90-0003
NCEER-90-0004
NCEER-90-0005
NCEER-90-0006
"A Determinstic Assessment of Effects 0 f Ground Motion Incoherence," by A.S. Veletsos and Y. Tang,7/15/89, (PB90-164294/AS).
"Workshop on Ground Motion Parameters for Seismic Hazard Mapping," July 17-18 1989, edited byR.V. Whitman, 12/1/89, (PB90-173923/AS).
"Seismic Effects on Elevated Transit Lnes of the New York City Transit Authority," by C.J. Costantino, C.A. Miller and E. Heymsfield, 12/26/89, (PB90-207887/AS).
"Centrifugal Modeling of Dynamic Soil-StrucLUre Interaction," by K. Weissman, Slpervised by J.H.Prevost, 5/10/89, (PB90-207879/AS).
"Linearized Identification of Buildings With Cores for Seismic Vulnerability Assessment," by I-K. Hoand A.E. Aktan, 11/1/89.
"Geotechnical and Lifeline Aspects of th~ October 17, 1989 Lorna Prieta Earthquake h San Francisco,"by T.D. O'Rourke, H.E. Stewart, F.T. Bllckburn and T.S. Dickerman, 1/90, (PB90-2m:596/AS).
"Nonnormal Secondary Response Due t,) Yielding in a Primary Structure," by D.C.L Chen and L.D.Lutes, 2/28/90.
"Earthquake Education Materials for Grades K-12," by K.E.K. Ross, 4/16/90.
"Catalog of Strong Motion Stations in Eastern North America," by R.W. Busby, 4/3/9C.
"NCEER Strong-Motion Data Base: A User Manuel for the GeoBase Release (Version 1.0 for theSun3)," by P. Friberg and K. Jacob, 3/31,'90.
"Seismic Hazard Along a Crude Oil Pipeline in the Event of an 1811-1812 T~'pe New MadridEarthquake," by H.H.M. Hwang and C-H.S. Chen, 4/16/90.
B·7