Igor Koutsenok, MD, MS Assistant Professor of Psychiatry, UCSD, Director, Center for Criminality &...
39
Igor Koutsenok, MD, MS Assistant Professor of Psychiatry, UCSD, Director, Center for Criminality & Addiction Research, Training & Application (CCARTA) Treatment of Substance Treatment of Substance Involved Offenders in Involved Offenders in Criminal Justice Settings Criminal Justice Settings – – Challenges & Outcomes Challenges & Outcomes
-
Upload
blaine-henshaw -
Category
Documents
-
view
215 -
download
1
Transcript of Igor Koutsenok, MD, MS Assistant Professor of Psychiatry, UCSD, Director, Center for Criminality &...
Igor Koutsenok, MD, MSAssistant Professor of Psychiatry, UCSD,
Director,Center for Criminality & Addiction Research, Training & Application
(CCARTA)
Treatment of Substance Treatment of Substance Involved Offenders in Criminal Involved Offenders in Criminal
Justice Settings –Justice Settings –Challenges & OutcomesChallenges & Outcomes

Let’s start with some bad Let’s start with some bad newsnews

California StatisticsCalifornia Statistics
172,785 in prison (1986: 39,373)172,785 in prison (1986: 39,373) Cost – $38 000 per inmateCost – $38 000 per inmate 117,136 on parole (1986: 19,780)117,136 on parole (1986: 19,780) Cost - $12 000 per paroleeCost - $12 000 per parolee 77% of males and 83% of females 77% of males and 83% of females
incarcerated in California have drug incarcerated in California have drug and alcohol problems.and alcohol problems.

Nationwide costNationwide costColumbia University Report, March Columbia University Report, March
20052005
$ 30 billion states spent on adult $ 30 billion states spent on adult corrections (incarceration, corrections (incarceration, probation, parole)probation, parole)
$24.1 billion of it was on substance $24.1 billion of it was on substance involved offendersinvolved offenders

During the 1980s and 1990s, the number of incarcerated women tripled, while the number of men doubled.
80% of these women have substance abuse problems.
On Women…On Women…
“What Works,” Dr. Rudy J. Cypser, CURE-NY, 2000

Some Other Sad FactsSome Other Sad Facts Over 2 million inmates inhabited U.S. Over 2 million inmates inhabited U.S.
jails & prisonsjails & prisons They are parents of 3.4 million childrenThey are parents of 3.4 million children 2 in 3 convicts have been tested 2 in 3 convicts have been tested
positive for drugs at time of arrest.positive for drugs at time of arrest. 2 in 3 inmates have verified drug 2 in 3 inmates have verified drug
histories, histories, BUT…BUT…
Under 15 % receive systematic Under 15 % receive systematic treatmenttreatment
Deitch, Koutsenok & Ruiz, 2004Deitch, Koutsenok & Ruiz, 2004
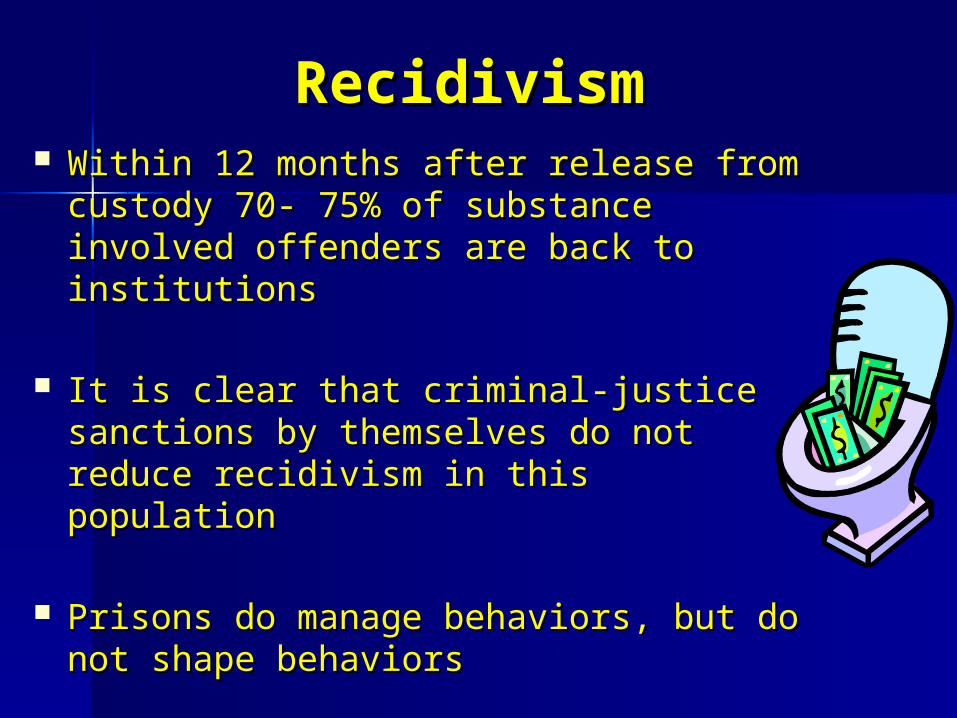
Recidivism Recidivism Within 12 months after release from Within 12 months after release from
custody 70- 75% of substance involved custody 70- 75% of substance involved offenders are back to institutionsoffenders are back to institutions
It is clear that criminal-justice It is clear that criminal-justice sanctions by themselves do not reduce sanctions by themselves do not reduce recidivism in this populationrecidivism in this population
Prisons do manage behaviors, but do Prisons do manage behaviors, but do not shape behaviorsnot shape behaviors

Policies for Drug OffendersPolicies for Drug Offenders
Diversion Incarceration
Probation w/o verdict(Prop 36)
Drug Courts
Intermediatesanctions

Policies for Drug OffendersPolicies for Drug Offenders
Diversion Incarceration
Probation w/o verdict(Prop 36)
Drug Courts
Intermediatesanctions
Public Safety
Public Safety RisksRisks

Policies for Drug OffendersPolicies for Drug Offenders
Diversion Incarceration
Probation w/o verdict(Prop 36)
Drug Courts
Intermediatesanctions
$$$$$$ Costs $$$$$$$$
$$$$$$ Costs $$$$$$$$
$$
Public Safety Risks
Public Safety Risks

Policies for Drug OffendersPolicies for Drug Offenders
Diversion Incarceration
Probation w/o verdict(Prop 36)
Drug Courts
Intermediatesanctions
Over-Over-reliancereliance
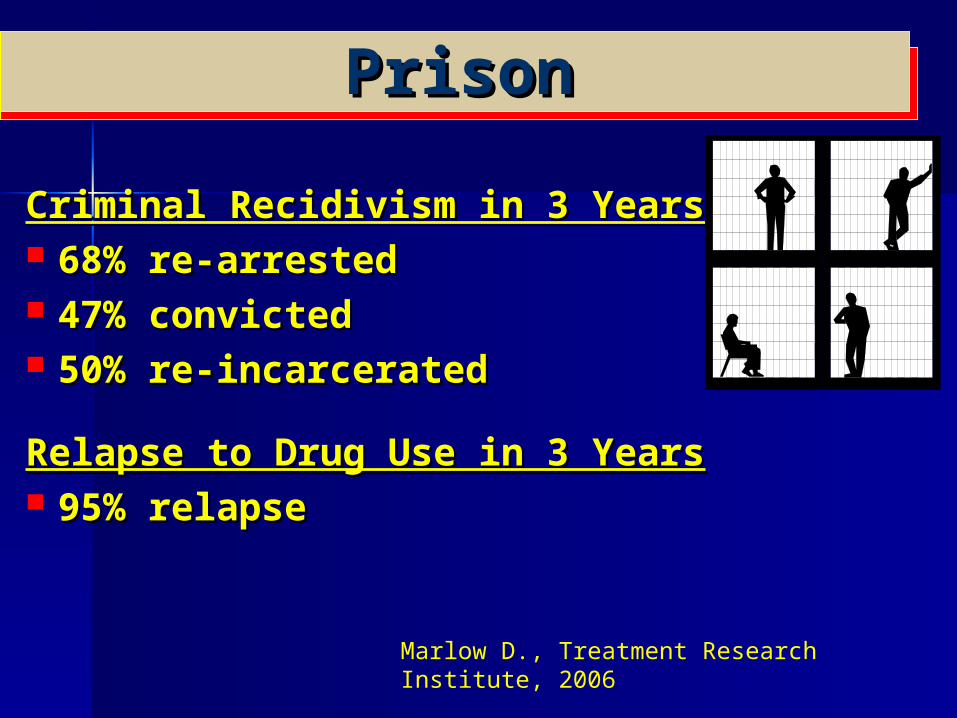
PrisonPrison
Criminal Recidivism in 3 YearsCriminal Recidivism in 3 Years 68% re-arrested68% re-arrested 47% convicted47% convicted 50% re-incarcerated50% re-incarcerated
Relapse to Drug Use in 3 YearsRelapse to Drug Use in 3 Years 95% relapse95% relapse
Marlow D., Treatment Research Institute, 2006

Policies for Drug OffendersPolicies for Drug Offenders
Diversion Incarceration
Probation w/o verdict(Prop 36)
Drug Courts
Intermediatesanctions

Policies for Drug OffendersPolicies for Drug Offenders
Diversion Incarceration
Probation w/o verdict(Prop 36)
Drug Courts
Intermediatesanctions
Over-Over-reliancereliance

Referral to TreatmentReferral to Treatment
50% - 67% don’t show for intake50% - 67% don’t show for intake 40% - 80% drop out in 3 months40% - 80% drop out in 3 months 90% drop out in 12 months90% drop out in 12 months 70% of probationers and parolees 70% of probationers and parolees
drop out within 2 - 6 monthsdrop out within 2 - 6 months
Attrition
D. Marlow D. & T.McLellan, TRI, 2004
Time for some better Time for some better newsnews
What will happen if we
What will happen if we
combine incarceration
combine incarceration
and treatment?
and treatment?

From the work of From the work of Douglas B. Marlowe, J.D., Ph.D.Douglas B. Marlowe, J.D., Ph.D.
Types of Substance Types of Substance Involved OffendersInvolved Offenders

Criminogenic Criminogenic RisksRisks Age during rehabilitation < 25 yearsAge during rehabilitation < 25 years Criminal onset < 16 yearsCriminal onset < 16 years Prior rehabilitation failuresPrior rehabilitation failures History of violenceHistory of violence Antisocial Personality DisorderAntisocial Personality Disorder Psychopathy Psychopathy Familial history of crimeFamilial history of crime Criminal associationsCriminal associations

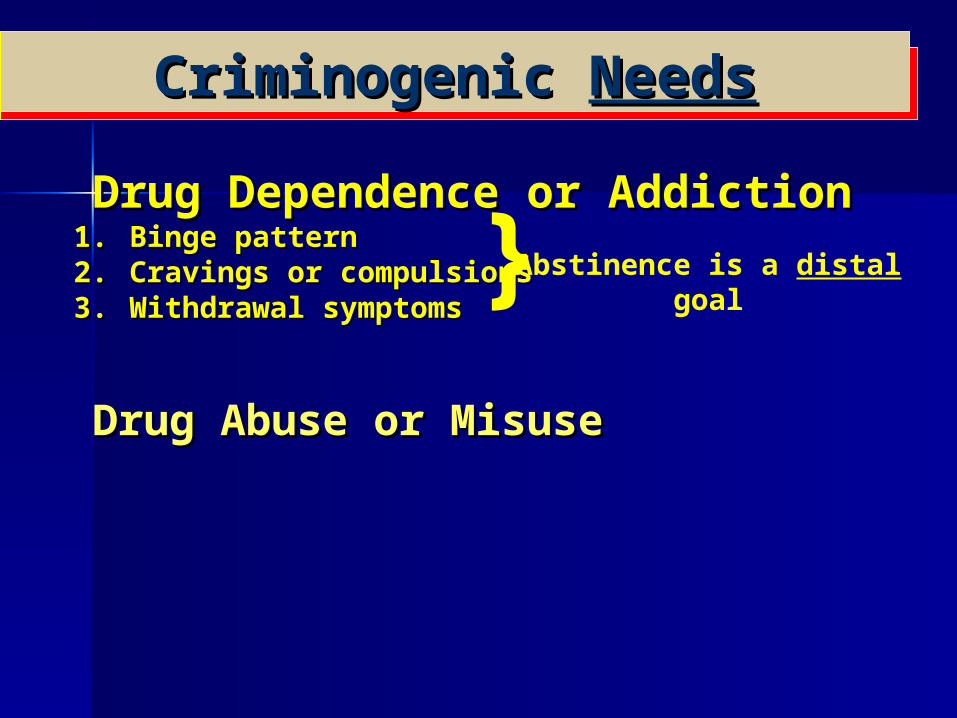
Criminogenic Criminogenic NeedsNeeds
Drug Dependence or AddictionDrug Dependence or Addiction

Criminogenic Criminogenic NeedsNeeds
Drug Dependence or AddictionDrug Dependence or Addiction1.1. Binge patternBinge pattern2.2. Cravings or compulsionsCravings or compulsions3.3. Withdrawal symptomsWithdrawal symptoms

Criminogenic Criminogenic NeedsNeeds
Drug Dependence or AddictionDrug Dependence or Addiction1.1. Binge patternBinge pattern2.2. Cravings or compulsionsCravings or compulsions3.3. Withdrawal symptomsWithdrawal symptoms
} Abstinence is a distal goal
Criminogenic Criminogenic NeedsNeeds
Drug Dependence or AddictionDrug Dependence or Addiction1.1. Binge patternBinge pattern2.2. Cravings or compulsionsCravings or compulsions3.3. Withdrawal symptomsWithdrawal symptoms
Drug Abuse or MisuseDrug Abuse or Misuse
} Abstinence is a distal goal

Criminogenic Criminogenic NeedsNeeds
Drug Dependence or AddictionDrug Dependence or Addiction1.1. Binge patternBinge pattern2.2. Cravings or compulsionsCravings or compulsions3.3. Withdrawal symptomsWithdrawal symptoms
Drug Abuse or MisuseDrug Abuse or Misuse
} Abstinence is a distal goal
Abstinence is a proximal goal}

Criminogenic Criminogenic NeedsNeeds
Drug Dependence or AddictionDrug Dependence or Addiction1.1. Binge patternBinge pattern2.2. Cravings or compulsionsCravings or compulsions3.3. Withdrawal symptomsWithdrawal symptoms
Drug Abuse or MisuseDrug Abuse or Misuse
Collateral needsCollateral needs– E.g., dual diagnosis, HIV+E.g., dual diagnosis, HIV+
} Abstinence is a distal goal
Abstinence is a proximal goal}

High RiskHigh Risk Low RiskLow Risk
High High NeedsNeeds
Low Low NeedsNeeds
Risk & Needs MatrixRisk & Needs Matrix

Risk & Needs MatrixRisk & Needs Matrix
High RiskHigh Risk Low RiskLow Risk
High High NeedsNeeds
Low Low NeedsNeeds
AccountabilityAccountability&&
TreatmentTreatment

Risk & Needs MatrixRisk & Needs Matrix
High RiskHigh Risk Low RiskLow Risk
High High NeedsNeeds
Low Low NeedsNeeds
AccountabilityAccountability&&
TreatmentTreatment
TreatmentTreatment

Risk & Needs MatrixRisk & Needs Matrix
High RiskHigh Risk Low RiskLow Risk
High High NeedsNeeds
Low Low NeedsNeeds
AccountabilityAccountability&&
TreatmentTreatment
TreatmentTreatment
AccountabilityAccountability

Risk & Needs MatrixRisk & Needs Matrix
High RiskHigh Risk Low RiskLow Risk
High High NeedsNeeds
Low Low NeedsNeeds
AccountabilityAccountability&&
TreatmentTreatment
TreatmentTreatment
PreventionPrevention
AccountabilityAccountability
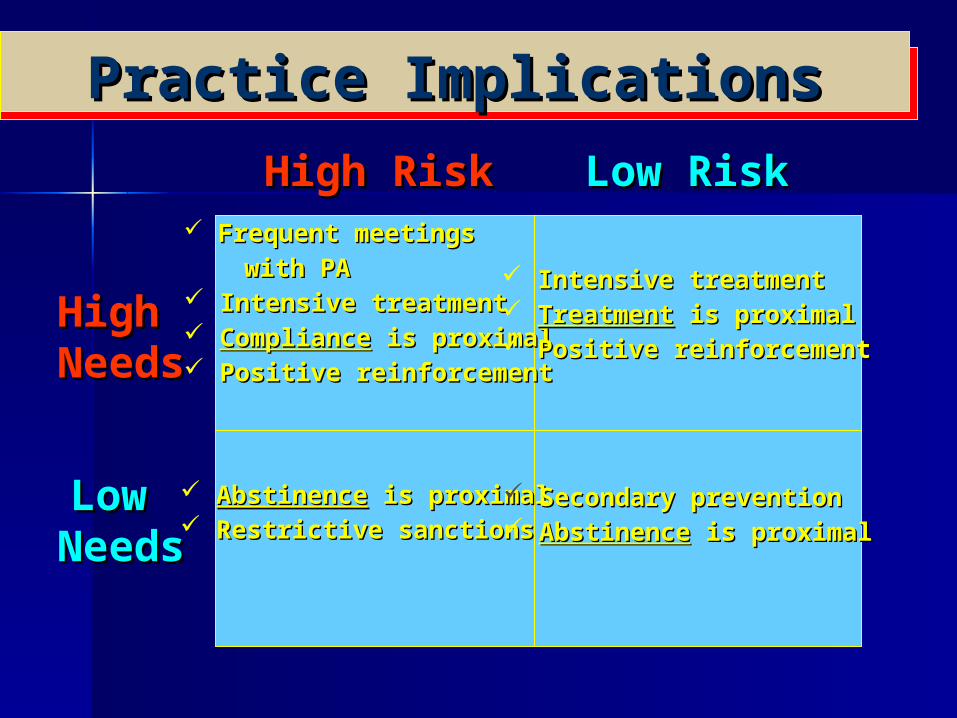
Practice ImplicationsPractice Implications
High RiskHigh Risk Low RiskLow Risk
High High NeedsNeeds
Low Low NeedsNeeds
Frequent meetings Frequent meetings
with PAwith PA Intensive treatmentIntensive treatment ComplianceCompliance is proximal is proximal Positive reinforcementPositive reinforcement
Intensive treatment Intensive treatment TreatmentTreatment is proximal is proximal Positive reinforcementPositive reinforcement
AbstinenceAbstinence is proximal is proximal Restrictive sanctionsRestrictive sanctions
Secondary prevention Secondary prevention AbstinenceAbstinence is proximal is proximal

The profile of a successful The profile of a successful high risk/high need client in high risk/high need client in
community based community based therapeutic community is therapeutic community is
very similar to the one of a very similar to the one of a substance abusing offender substance abusing offender
in custodyin custody
Why Therapeutic Community Model?
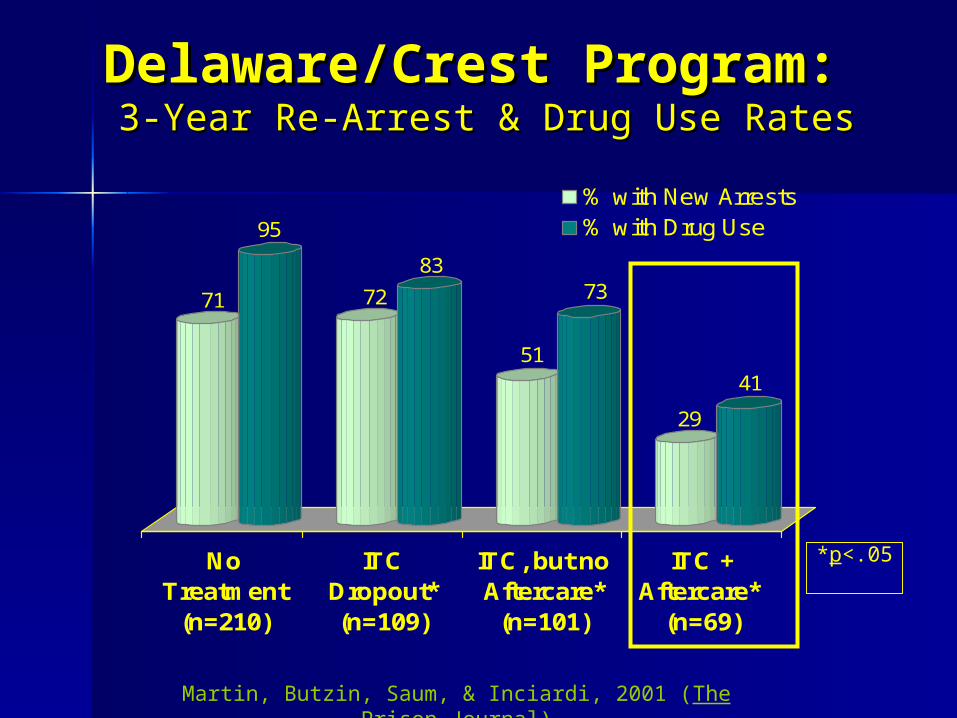
Delaware/Crest Program: Delaware/Crest Program: 3-Year Re-Arrest & Drug Use Rates3-Year Re-Arrest & Drug Use Rates
71
95
72
83
51
73
29
41
No Treatment
(n=210)
ITC Dropout*(n=109)
ITC, but noAftercare*
(n=101)
ITC +Aftercare*
(n=69)
% with New Arrests% with Drug Use
Martin, Butzin, Saum, & Inciardi, 2001 (The Prison Journal)
*p<.05

Texas In-prison TC ProgramTexas In-prison TC Program::Return to custody rates (24 months follow-up), 2001Return to custody rates (24 months follow-up), 2001
64
51
2319
33
22
16
3338
45
12
22
27
5
18
0
10
20
30
40
50
60
70
Intake 3 6 9 12 18 24
Months After Discharge
Untreated Comparisons (n=103)Aftercare Non-completers (n=123)Aftercare Completers (n=170)
AftercareCompleters
K. Knight, D. Simpson. The Prison Journal, 2002

California/Amity Program: California/Amity Program: 3-Year Return-to-Custody Rates (%)3-Year Return-to-Custody Rates (%)
7582 79
28
No Treatment
(n=189)
ITC Dropout(n=73)
ITC, but noAftercare(n=154)
ITC +Aftercare*
(n=162)
Wexler, Melnick, Lowe, & Peters, 2002 (The Prison Journal)
*p<.001

Coercion in the CriminalCoercion in the Criminal Justice System Justice System
A 2000 report from the Institute A 2000 report from the Institute of Medicine summarized that of Medicine summarized that
“contrary to earlier fears among “contrary to earlier fears among clinicians, criminal justice clinicians, criminal justice
pressure does not threaten pressure does not threaten treatment effectiveness, and it treatment effectiveness, and it
improves outcomes”improves outcomes”

Research FindingsResearch FindingsMultiple studiesMultiple studies
The length of time spent in treatment is a reliable predictor of post treatment outcomes and recidivism
Coerced patients tend to stay longer and do as well as volunteers overall
Most substance involved offenders would never seek treatment without pressure from the criminal-justice system

General Findings & Recommendations
1. Duration, Setting, Training: fundamental for In-prison TC (ITC) programs– ITC = 9-12 months in a residential (segregated)
treatment unit– Staff training is a must– On-going monitoring & evaluation
2. Engagement in transitional aftercare is crucial for effectiveness
3. ITC is most cost effective for high-risk offenders4. Boot camps & periodic drug-focused counseling
have poor outcomes5. Risk assessments should guide selections for Risk assessments should guide selections for
treatmenttreatment

Thank youThank you