Nimmervoll Michaela 4th form h igher secondary collage for chemical ingineering
HIGHER EDUCATION ARTS DATA SERVICES
ART AND DESIGN
Data Summaries
2014-2015

Copyright © 2015 by HEADS Higher Education Arts Data Services 11250 Roger Bacon Drive, Suite 21
Reston, Virginia 20190
Higher Education Arts Data Services
DATA SUMMARIES
2014-2015
ART AND DESIGN
HEADS Data Summaries in Art and Design for 2014-2015 are compilations of data generated from the 2014-2015 Annual Reports required of all member institutions of the National Association of Schools of Art and Design. Also included is information from a group of non-member institutions that volunteered to participate in the HEADS survey.
The data are generally separated by type of institution (public or private). There are also Data Summaries divided by the highest degree granted in art and design; several Data Summaries combine all data into a single category.
If you have any questions or comments about the HEADS project, please contact: HIGHER EDUCATION ARTS DATA SERVICES
11250 Roger Bacon Drive, Suite 21 Reston, Virginia 20190
Telephone: 703-437-0700 Ext. 122
Facsimile: 703-437-6312
[email protected] www.arts-accredit.org
The Higher Education Arts Data Services (HEADS) project is a joint activity of the National Association of Schools of Music, the National Association of Schools of Art and Design, the National Association of Schools of Dance, and
the National Association of Schools of Theatre.
Higher Education Arts Data Services
ART/DESIGN DATA SUMMARIES
2014 – 2015
Table of Contents
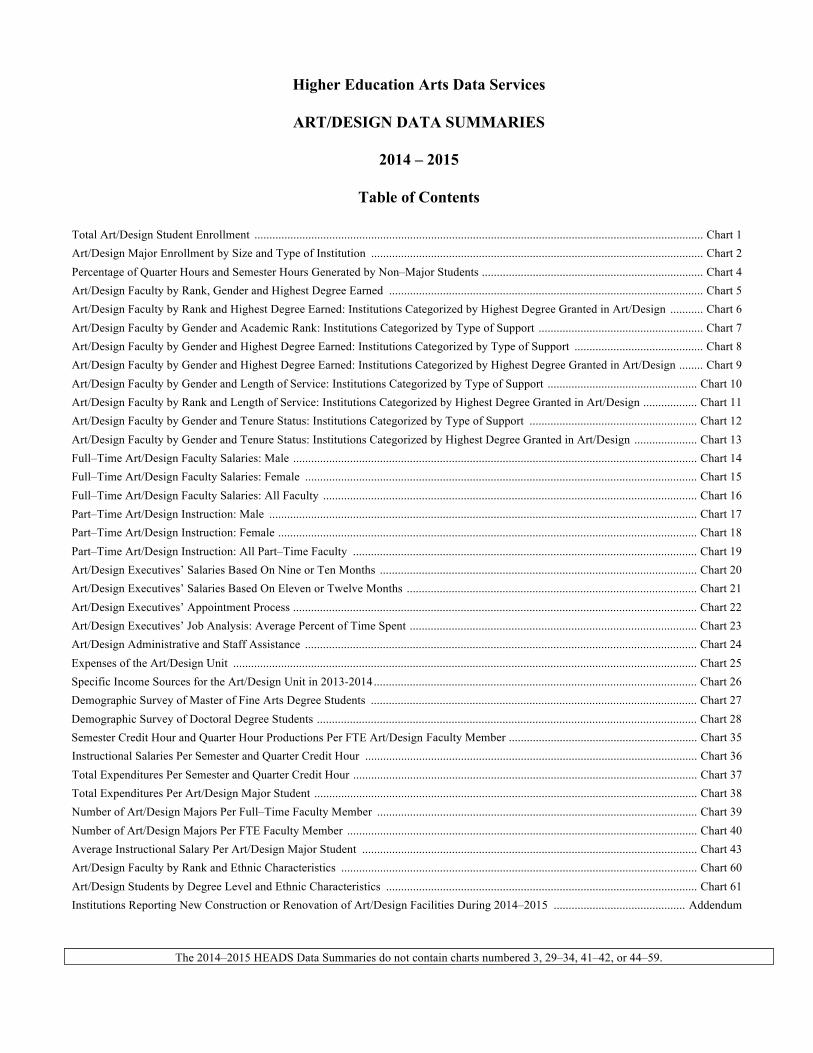
Total Art/Design Student Enrollment ...................................................................................................................................................... Chart 1 Art/Design Major Enrollment by Size and Type of Institution ............................................................................................................... Chart 2 Percentage of Quarter Hours and Semester Hours Generated by Non–Major Students .......................................................................... Chart 4 Art/Design Faculty by Rank, Gender and Highest Degree Earned ......................................................................................................... Chart 5 Art/Design Faculty by Rank and Highest Degree Earned: Institutions Categorized by Highest Degree Granted in Art/Design ........... Chart 6 Art/Design Faculty by Gender and Academic Rank: Institutions Categorized by Type of Support ....................................................... Chart 7 Art/Design Faculty by Gender and Highest Degree Earned: Institutions Categorized by Type of Support ........................................... Chart 8 Art/Design Faculty by Gender and Highest Degree Earned: Institutions Categorized by Highest Degree Granted in Art/Design ........ Chart 9 Art/Design Faculty by Gender and Length of Service: Institutions Categorized by Type of Support .................................................. Chart 10 Art/Design Faculty by Rank and Length of Service: Institutions Categorized by Highest Degree Granted in Art/Design .................. Chart 11 Art/Design Faculty by Gender and Tenure Status: Institutions Categorized by Type of Support ........................................................ Chart 12 Art/Design Faculty by Gender and Tenure Status: Institutions Categorized by Highest Degree Granted in Art/Design ..................... Chart 13 Full–Time Art/Design Faculty Salaries: Male ....................................................................................................................................... Chart 14 Full–Time Art/Design Faculty Salaries: Female ................................................................................................................................... Chart 15 Full–Time Art/Design Faculty Salaries: All Faculty ............................................................................................................................. Chart 16 Part–Time Art/Design Instruction: Male ............................................................................................................................................... Chart 17 Part–Time Art/Design Instruction: Female ............................................................................................................................................ Chart 18 Part–Time Art/Design Instruction: All Part–Time Faculty ................................................................................................................... Chart 19 Art/Design Executives’ Salaries Based On Nine or Ten Months .......................................................................................................... Chart 20 Art/Design Executives’ Salaries Based On Eleven or Twelve Months ................................................................................................. Chart 21 Art/Design Executives’ Appointment Process ....................................................................................................................................... Chart 22 Art/Design Executives’ Job Analysis: Average Percent of Time Spent ................................................................................................ Chart 23 Art/Design Administrative and Staff Assistance ................................................................................................................................... Chart 24 Expenses of the Art/Design Unit ........................................................................................................................................................... Chart 25 Specific Income Sources for the Art/Design Unit in 2013-2014 ............................................................................................................ Chart 26 Demographic Survey of Master of Fine Arts Degree Students ............................................................................................................. Chart 27 Demographic Survey of Doctoral Degree Students ............................................................................................................................... Chart 28 Semester Credit Hour and Quarter Hour Productions Per FTE Art/Design Faculty Member ............................................................... Chart 35 Instructional Salaries Per Semester and Quarter Credit Hour ............................................................................................................... Chart 36 Total Expenditures Per Semester and Quarter Credit Hour ................................................................................................................... Chart 37 Total Expenditures Per Art/Design Major Student ................................................................................................................................ Chart 38 Number of Art/Design Majors Per Full–Time Faculty Member ........................................................................................................... Chart 39 Number of Art/Design Majors Per FTE Faculty Member ..................................................................................................................... Chart 40 Average Instructional Salary Per Art/Design Major Student ................................................................................................................ Chart 43 Art/Design Faculty by Rank and Ethnic Characteristics ....................................................................................................................... Chart 60 Art/Design Students by Degree Level and Ethnic Characteristics ........................................................................................................ Chart 61 Institutions Reporting New Construction or Renovation of Art/Design Facilities During 2014–2015 ............................................ Addendum
The 2014–2015 HEADS Data Summaries do not contain charts numbered 3, 29–34, 41–42, or 44–59.

INSTITUTIONS INCLUDED IN THIS SURVEY BY STATE
ALABAMA
Alabama State University
American University of Kuwait
Auburn University
Jacksonville State University
Paris College of Art
University of Alabama
University of Alabama at Birmingham
University of Alabama in Huntsville
University of Montevallo
University of North Alabama
ALASKA
University of Alaska Anchorage
ARIZONA
Arizona State University
University of Arizona
ARKANSAS
Arkansas State University
University of Arkansas at Fort Smith
University of Arkansas, Little Rock
University of Central Arkansas
CALIFORNIA
Academy of Art University
American Film Institute
Art Center College of Design
Azusa Pacific University
Biola University
California College of the Arts
California Institute of the Arts
California Polytechnic State University
California State Polytechnic University, Pomona
California State University, Chico
California State University, Fullerton
California State University, Long Beach
California State University, Los Angeles
California State University, Northridge
California State University, Sacramento
California State University, San Bernardino
California State University, Stanislaus
Columbia College Hollywood
Dominican University of California
Fashion Institute of Design and Merchandising
Humboldt State University
Laguna College of Art and Design
Los Angeles Academy of Figurative Art
Loyola Marymount University
Otis College of Art and Design
San Diego State University
San Francisco Art Institute
San Francisco State University
San Jose State University
Sonoma State University
University of the Pacific
Woodbury University
COLORADO
Colorado State University
Metropolitan State University of Denver
Rocky Mountain College of Art and Design
University of Denver
University of Northern Colorado
CONNECTICUT
Hartford Art School
Shintaro Akatsu School of Design at University of Bridgeport
University of Connecticut
Western Connecticut State University
DELAWARE
Delaware College of Art and Design
DISTRICT OF COLUMBIA
George Washington University
Howard University
FLORIDA
Broward College
Florida International University
Florida School of the Arts
Florida State University
New World School of the Arts
Ringling College of Art and Design
University of Florida
University of North Florida
University of South Florida
GEORGIA
Columbus State University
Georgia Institute of Technology (Industrial Design)
Georgia Regents University
Georgia Southern University
Georgia State University
Kennesaw State University
University of Georgia
University of North Georgia
University of West Georgia
Valdosta State University
IDAHO
Boise State University
University of Idaho
ILLINOIS
Bradley University
Chicago State University
College of DuPage
Eastern Illinois University
Illinois State University
Northeastern Illinois University
Northern Illinois University
School of the Art Institute of Chicago
Southern Illinois University Carbondale
Southern Illinois University Edwardsville
University of Illinois at Urbana-Champaign
Waubonsee Community College
Western Illinois University
INDIANA
Ball State University
Herron School of Art and Design
Indiana State University

INSTITUTIONS INCLUDED IN THIS SURVEY BY STATE (continued)
Indiana University
Indiana University - Purdue University, Fort Wayne
Indiana Wesleyan University
Ivy Tech Community College of Indiana, Central Indiana
Ivy Tech Community College of Indiana, Columbus
Ivy Tech Community College of Indiana, North Central
Ivy Tech Community College of Indiana, Southern Indiana
Ivy Tech Community College of Indiana, Southwest
Ivy Tech Community College of Indiana, Wabash Valley
Purdue University (Industrial Design)
Saint Mary's College
University of Indianapolis
University of Notre Dame (Industrial Design)
University of Saint Francis
University of Southern Indiana
Vincennes University
IOWA
Drake University
Iowa State University
KANSAS
Emporia State University
Kansas State University
Washburn University
Wichita State University
KENTUCKY
Murray State University
University of Kentucky
Western Kentucky University
LOUISIANA
Louisiana Tech University
McNeese State University
Nicholls State University
Northwestern State University of Louisiana
Southeastern Louisiana University
University of Louisiana at Lafayette
University of New Orleans
MAINE
Maine College of Art
University of Maine
University of Southern Maine
MARYLAND
Community College of Baltimore County
Maryland Institute College of Art
MASSACHUSETTS
Boston University
Bridgewater State University
Endicott College
Framingham State University
Lesley University College of Art and Design
Massachusetts College of Art and Design
Montserrat College of Art
Mount Ida College
New England School of Art and Design at Suffolk University
Salem State University
School of the Museum of Fine Arts, Boston
University of Massachusetts Dartmouth
Wentworth Institute of Technology (Industrial Design)
MICHIGAN
Central Michigan University
College for Creative Studies
Cranbrook Academy of Art
Eastern Michigan University
Grand Rapids Community College
Grand Valley State University
Hope College
Kendall College of Art and Design of Ferris State University
Lawrence Technological University
Siena Heights University
University of Michigan
Western Michigan University
MINNESOTA
Minneapolis College of Art and Design
Minnesota State University Mankato
Minnesota State University Moorhead
Normandale Community College
Saint Cloud State University
Saint Olaf College
University of Minnesota, Duluth
MISSISSIPPI
Delta State University
Jackson State University
Mississippi University for Women
Mississippi Valley State University
University of Mississippi
University of Southern Mississippi
MISSOURI
East Central College
Kansas City Art Institute
Maryville University of Saint Louis
Saint Louis Community College at Florissant Valley
Saint Louis Community College at Meramec
Saint Louis University
University of Central Missouri
Washington University in Saint Louis
MONTANA
Montana State University - Billings
Montana State University - Bozeman
University of Montana
NEBRASKA
University of Nebraska at Lincoln
University of Nebraska at Omaha
Wayne State College
NEVADA
University of Nevada, Las Vegas
NEW HAMPSHIRE
New Hampshire Institute of Art
Plymouth State University
NEW JERSEY
Kean University
Montclair State University
New Jersey City University
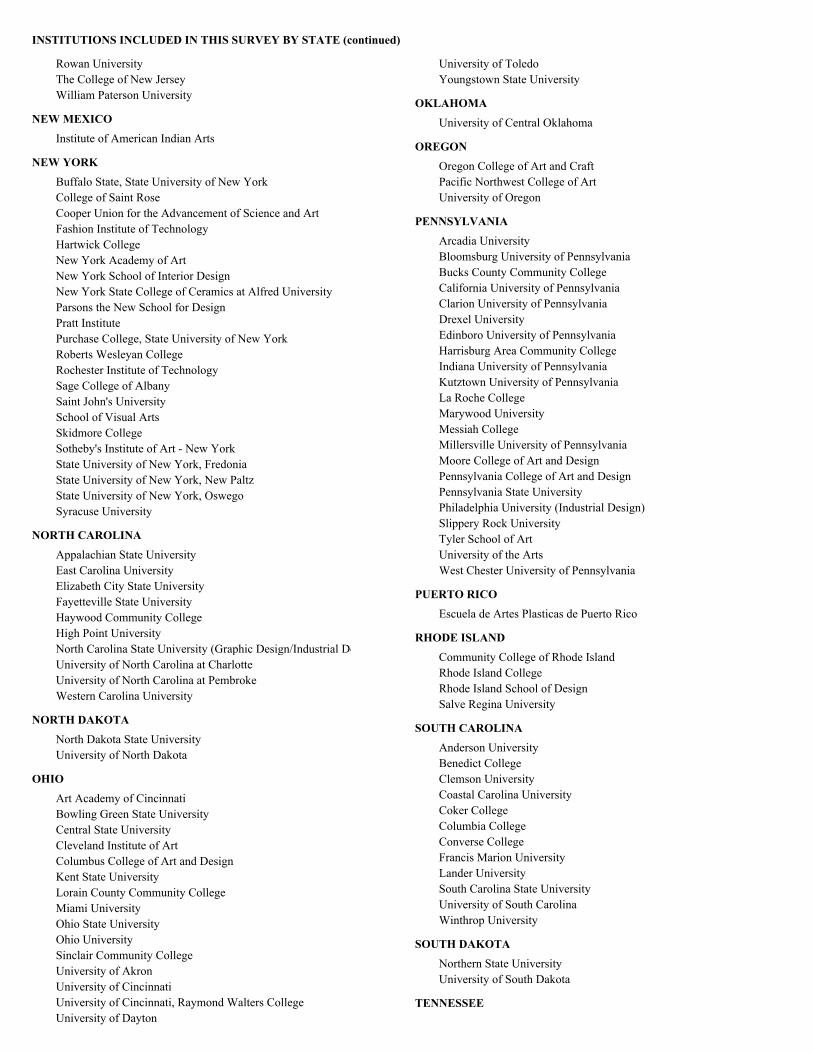
INSTITUTIONS INCLUDED IN THIS SURVEY BY STATE (continued)
Rowan University
The College of New Jersey
William Paterson University
NEW MEXICO
Institute of American Indian Arts
NEW YORK
Buffalo State, State University of New York
College of Saint Rose
Cooper Union for the Advancement of Science and Art
Fashion Institute of Technology
Hartwick College
New York Academy of Art
New York School of Interior Design
New York State College of Ceramics at Alfred University
Parsons the New School for Design
Pratt Institute
Purchase College, State University of New York
Roberts Wesleyan College
Rochester Institute of Technology
Sage College of Albany
Saint John's University
School of Visual Arts
Skidmore College
Sotheby's Institute of Art - New York
State University of New York, Fredonia
State University of New York, New Paltz
State University of New York, Oswego
Syracuse University
NORTH CAROLINA
Appalachian State University
East Carolina University
Elizabeth City State University
Fayetteville State University
Haywood Community College
High Point University
North Carolina State University (Graphic Design/Industrial Design)
University of North Carolina at Charlotte
University of North Carolina at Pembroke
Western Carolina University
NORTH DAKOTA
North Dakota State University
University of North Dakota
OHIO
Art Academy of Cincinnati
Bowling Green State University
Central State University
Cleveland Institute of Art
Columbus College of Art and Design
Kent State University
Lorain County Community College
Miami University
Ohio State University
Ohio University
Sinclair Community College
University of Akron
University of Cincinnati
University of Cincinnati, Raymond Walters College
University of Dayton
University of Toledo
Youngstown State University
OKLAHOMA
University of Central Oklahoma
OREGON
Oregon College of Art and Craft
Pacific Northwest College of Art
University of Oregon
PENNSYLVANIA
Arcadia University
Bloomsburg University of Pennsylvania
Bucks County Community College
California University of Pennsylvania
Clarion University of Pennsylvania
Drexel University
Edinboro University of Pennsylvania
Harrisburg Area Community College
Indiana University of Pennsylvania
Kutztown University of Pennsylvania
La Roche College
Marywood University
Messiah College
Millersville University of Pennsylvania
Moore College of Art and Design
Pennsylvania College of Art and Design
Pennsylvania State University
Philadelphia University (Industrial Design)
Slippery Rock University
Tyler School of Art
University of the Arts
West Chester University of Pennsylvania
PUERTO RICO
Escuela de Artes Plasticas de Puerto Rico
RHODE ISLAND
Community College of Rhode Island
Rhode Island College
Rhode Island School of Design
Salve Regina University
SOUTH CAROLINA
Anderson University
Benedict College
Clemson University
Coastal Carolina University
Coker College
Columbia College
Converse College
Francis Marion University
Lander University
South Carolina State University
University of South Carolina
Winthrop University
SOUTH DAKOTA
Northern State University
University of South Dakota
TENNESSEE

INSTITUTIONS INCLUDED IN THIS SURVEY BY STATE (continued)
Austin Peay State University
Belmont University
Carson-Newman College
Memphis College of Art
Middle Tennessee State University
Tennessee State University
Tennessee Technological University
Union University
University of Memphis
University of Tennessee
University of Tennessee at Chattanooga
Watkins College of Art, Design & Film
TEXAS
Brookhaven College
Del Mar College
Lamar University
Midwestern State University
Sam Houston State University
Southern Methodist University
Stephen F. Austin State University
Texas Christian University
Texas Tech University
University of Mary Hardin-Baylor
University of North Texas
University of Texas at Arlington
University of Texas at Austin
University of Texas at San Antonio
University of Texas of the Permian Basin
UTAH
Brigham Young University
Southern Utah University
Utah State University
Weber State University
VERMONT
Champlain College
VIRGINIA
George Mason University
James Madison University
Old Dominion University
Radford University
Virginia Commonwealth University
Virginia State University
Virginia Tech (Industrial Design)
WASHINGTON
Cornish College of the Arts
Western Washington University (Industrial Design)
WEST VIRGINIA
Shepherd University
West Virginia University
WISCONSIN
Milwaukee Institute of Art and Design
University of Wisconsin - Green Bay
University of Wisconsin - Madison
University of Wisconsin - Milwaukee
University of Wisconsin - Stevens Point
University of Wisconsin - Stout
University of Wisconsin - Whitewater
WYOMING
Casper College
Northwest College
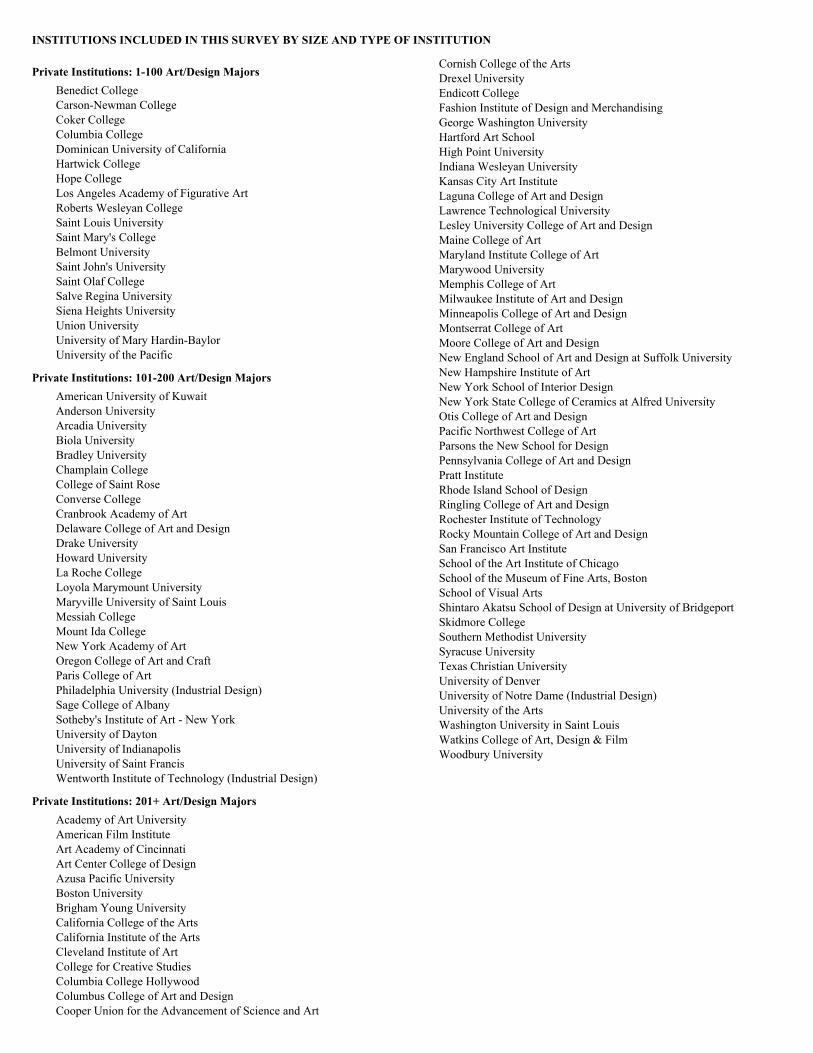
INSTITUTIONS INCLUDED IN THIS SURVEY BY SIZE AND TYPE OF INSTITUTION
Private Institutions: 1-100 Art/Design Majors
Benedict CollegeCarson-Newman CollegeCoker CollegeColumbia CollegeDominican University of CaliforniaHartwick CollegeHope CollegeLos Angeles Academy of Figurative ArtRoberts Wesleyan CollegeSaint Louis UniversitySaint Mary's CollegeBelmont UniversitySaint John's UniversitySaint Olaf CollegeSalve Regina UniversitySiena Heights UniversityUnion UniversityUniversity of Mary Hardin-BaylorUniversity of the Pacific
Private Institutions: 101-200 Art/Design Majors
American University of KuwaitAnderson UniversityArcadia UniversityBiola UniversityBradley UniversityChamplain CollegeCollege of Saint RoseConverse CollegeCranbrook Academy of ArtDelaware College of Art and DesignDrake UniversityHoward UniversityLa Roche CollegeLoyola Marymount UniversityMaryville University of Saint LouisMessiah CollegeMount Ida CollegeNew York Academy of ArtOregon College of Art and CraftParis College of ArtPhiladelphia University (Industrial Design)Sage College of AlbanySotheby's Institute of Art - New YorkUniversity of DaytonUniversity of IndianapolisUniversity of Saint FrancisWentworth Institute of Technology (Industrial Design)
Private Institutions: 201+ Art/Design Majors
Academy of Art UniversityAmerican Film InstituteArt Academy of CincinnatiArt Center College of DesignAzusa Pacific UniversityBoston UniversityBrigham Young UniversityCalifornia College of the ArtsCalifornia Institute of the ArtsCleveland Institute of ArtCollege for Creative StudiesColumbia College HollywoodColumbus College of Art and DesignCooper Union for the Advancement of Science and Art
Cornish College of the ArtsDrexel UniversityEndicott CollegeFashion Institute of Design and MerchandisingGeorge Washington UniversityHartford Art SchoolHigh Point UniversityIndiana Wesleyan UniversityKansas City Art InstituteLaguna College of Art and DesignLawrence Technological UniversityLesley University College of Art and DesignMaine College of ArtMaryland Institute College of ArtMarywood UniversityMemphis College of ArtMilwaukee Institute of Art and DesignMinneapolis College of Art and DesignMontserrat College of ArtMoore College of Art and DesignNew England School of Art and Design at Suffolk UniversityNew Hampshire Institute of ArtNew York School of Interior DesignNew York State College of Ceramics at Alfred UniversityOtis College of Art and DesignPacific Northwest College of ArtParsons the New School for DesignPennsylvania College of Art and DesignPratt InstituteRhode Island School of DesignRingling College of Art and DesignRochester Institute of TechnologyRocky Mountain College of Art and DesignSan Francisco Art InstituteSchool of the Art Institute of ChicagoSchool of the Museum of Fine Arts, BostonSchool of Visual ArtsShintaro Akatsu School of Design at University of BridgeportSkidmore CollegeSouthern Methodist UniversitySyracuse UniversityTexas Christian UniversityUniversity of DenverUniversity of Notre Dame (Industrial Design)University of the ArtsWashington University in Saint LouisWatkins College of Art, Design & FilmWoodbury University

INSTITUTIONS INCLUDED IN THIS SURVEY BY SIZE AND TYPE OF INSTITUTION (continued)
Public Institutions: 1-100 Art/Design Majors
Alabama State UniversityBloomsburg University of PennsylvaniaCasper CollegeCentral State UniversityChicago State UniversityClarion University of PennsylvaniaDelta State UniversityElizabeth City State UniversityFayetteville State UniversityFlorida School of the ArtsHaywood Community CollegeIvy Tech Community College of Indiana, Southern IndianaIvy Tech Community College of Indiana, Wabash ValleyLander UniversityMidwestern State UniversityMississippi University for WomenMississippi Valley State UniversityMontana State University - BillingsNormandale Community CollegeNorth Dakota State UniversityNorthern State UniversityNorthwest CollegeNorthwestern State University of LouisianaSouth Carolina State UniversityTennessee State UniversityUniversity of Alabama in HuntsvilleUniversity of Cincinnati, Raymond Walters CollegeUniversity of North AlabamaUniversity of Texas of the Permian BasinVirginia State UniversityWayne State CollegeWestern Washington University (Industrial Design)
Public Institutions: 101-200 Art/Design Majors
Arkansas State UniversityCalifornia State University, StanislausCalifornia University of PennsylvaniaCentral Michigan UniversityClemson UniversityColumbus State UniversityCommunity College of Rhode IslandDel Mar CollegeEast Central CollegeEastern Illinois UniversityEmporia State UniversityFramingham State UniversityFrancis Marion UniversityGeorgia Regents UniversityIndiana University of PennsylvaniaInstitute of American Indian ArtsIvy Tech Community College of Indiana, ColumbusIvy Tech Community College of Indiana, North CentralIvy Tech Community College of Indiana, SouthwestJackson State UniversityJacksonville State UniversityLamar UniversityLorain County Community CollegeLouisiana Tech UniversityMcNeese State UniversityMillersville University of PennsylvaniaMurray State UniversityNew World School of the ArtsNicholls State UniversityNortheastern Illinois University
Plymouth State UniversityRowan UniversitySalem State UniversityShepherd UniversitySlippery Rock UniversitySonoma State UniversityTennessee Technological UniversityThe College of New JerseyUniversity of Arkansas at Fort SmithUniversity of Arkansas, Little RockUniversity of ConnecticutUniversity of MaineUniversity of New OrleansUniversity of North Carolina at PembrokeUniversity of North DakotaUniversity of South DakotaUniversity of Southern MaineUniversity of ToledoValdosta State UniversityVincennes UniversityVirginia Tech (Industrial Design)Washburn UniversityWest Chester University of PennsylvaniaWestern Connecticut State UniversityWestern Illinois University

INSTITUTIONS INCLUDED IN THIS SURVEY BY SIZE AND TYPE OF INSTITUTION (continued)
Public Institutions: 201-400 Art/Design Majors
Austin Peay State UniversityBridgewater State UniversityBrookhaven CollegeBucks County Community CollegeCalifornia Polytechnic State UniversityCoastal Carolina UniversityEastern Michigan UniversityGeorgia Institute of Technology (Industrial Design)Georgia Southern UniversityGrand Rapids Community CollegeHarrisburg Area Community CollegeHumboldt State UniversityIllinois State UniversityIndiana State UniversityJames Madison UniversityMiami UniversityMiddle Tennessee State UniversityMinnesota State University MankatoMinnesota State University MoorheadMontana State University - BozemanNew Jersey City UniversityPennsylvania State UniversityRhode Island CollegeSaint Cloud State UniversitySaint Louis Community College at Florissant ValleySoutheastern Louisiana UniversitySouthern Illinois University CarbondaleSouthern Illinois University EdwardsvilleSouthern Utah UniversityState University of New York, FredoniaState University of New York, OswegoStephen F. Austin State UniversityTexas Tech UniversityUniversity of AkronUniversity of AlabamaUniversity of Alabama at BirminghamUniversity of Alaska AnchorageUniversity of Central ArkansasUniversity of Central MissouriUniversity of IdahoUniversity of KentuckyUniversity of MemphisUniversity of Minnesota, DuluthUniversity of MississippiUniversity of MontanaUniversity of MontevalloUniversity of Nebraska at LincolnUniversity of North Carolina at CharlotteUniversity of North FloridaUniversity of North GeorgiaUniversity of Northern ColoradoUniversity of South FloridaUniversity of Southern IndianaUniversity of Southern MississippiUniversity of TennesseeUniversity of Tennessee at ChattanoogaUniversity of Texas at San AntonioUniversity of West GeorgiaUniversity of Wisconsin - Green BayUniversity of Wisconsin - MadisonUniversity of Wisconsin - Stevens PointUniversity of Wisconsin - WhitewaterWaubonsee Community CollegeWeber State University
West Virginia UniversityWestern Carolina UniversityWestern Kentucky UniversityWichita State UniversityWilliam Paterson UniversityWinthrop UniversityYoungstown State University

INSTITUTIONS INCLUDED IN THIS SURVEY BY SIZE AND TYPE OF INSTITUTION (continued)
Public Institutions: 401+ Art/Design Majors
Appalachian State UniversityArizona State UniversityAuburn UniversityBall State UniversityBoise State UniversityBowling Green State UniversityBroward CollegeBuffalo State, State University of New YorkCalifornia State Polytechnic University, PomonaCalifornia State University, ChicoCalifornia State University, FullertonCalifornia State University, Long BeachCalifornia State University, Los AngelesCalifornia State University, NorthridgeCalifornia State University, SacramentoCalifornia State University, San BernardinoCollege of DuPageColorado State UniversityCommunity College of Baltimore CountyEast Carolina UniversityEdinboro University of PennsylvaniaEscuela de Artes Plasticas de Puerto RicoFashion Institute of TechnologyFlorida International UniversityFlorida State UniversityGeorge Mason UniversityGeorgia State UniversityGrand Valley State UniversityHerron School of Art and DesignIndiana UniversityIndiana University - Purdue University, Fort WayneIowa State UniversityIvy Tech Community College of Indiana, Central IndianaKansas State UniversityKean UniversityKendall College of Art and Design of Ferris State UniversityKennesaw State UniversityKent State UniversityKutztown University of PennsylvaniaMassachusetts College of Art and DesignMetropolitan State University of DenverMontclair State UniversityNorth Carolina State University (Graphic Design/Industrial Design)Northern Illinois UniversityOhio State UniversityOhio UniversityOld Dominion UniversityPurchase College, State University of New YorkPurdue University (Industrial Design)Radford UniversitySaint Louis Community College at MeramecSam Houston State UniversitySan Diego State UniversitySan Francisco State UniversitySan Jose State UniversitySinclair Community CollegeState University of New York, New PaltzTyler School of ArtUniversity of ArizonaUniversity of Central OklahomaUniversity of CincinnatiUniversity of FloridaUniversity of GeorgiaUniversity of Illinois at Urbana-Champaign
University of Louisiana at LafayetteUniversity of Massachusetts DartmouthUniversity of MichiganUniversity of Nebraska at OmahaUniversity of Nevada, Las VegasUniversity of North TexasUniversity of OregonUniversity of South CarolinaUniversity of Texas at ArlingtonUniversity of Texas at AustinUniversity of Wisconsin - MilwaukeeUniversity of Wisconsin - StoutUtah State UniversityVirginia Commonwealth UniversityWestern Michigan University

Higher Education Arts Data Services DATA SUMMARIES
2014-2015
ART/DESIGN ENROLLMENT
Chart 1, Chart 2, and Chart 4 provide information on art/design major enrollment, number of degrees awarded in art/design, and percentage of credits generated in courses designed for non-art/design majors.
Chart 1 includes the number of institutions offering a specific major, art/design enrollment by major for Summer and Fall 2014, and the number of degrees awarded during the period July 1, 2013 to June 30, 2014.
Example: Chart 1-2 – “Total Art/Design Student Enrollment, All Institutions,” Bachelor of Fine Arts Degree Programs or Equivalent (65% Art/Design Content). During 2014-2015, 172 institutions offered majors in Communication Design. In those schools, 3,573 Communication Design major students were enrolled in Summer 2014; 16,982 were enrolled in Fall 2014; and 4,259 graduated between July 1, 2013 and June 30, 2014.
Chart 2 is a synopsis of Chart 1 by size and type of institution. There are three charts: private institutions, public institutions, and all institutions. There is also a figure in each chart for total enrollment (all programs) in that category of institution.
Example: Chart 2-9 – “Art/Design Major Enrollment by Size and Type of Institution,” Public Institutions, 201-400 Majors. Fifty-eight schools in this category offer baccalaureate liberal arts degree programs in art/design. In those schools, 1,726 art/design major students were enrolled in Summer 2014; 7,292 were enrolled in Fall 2014; and 1,548 graduated between July 1, 2013 and June 30, 2014.
Chart 4 analyzes the percentage of credit hours (either quarter or semester hours) generated by non-art/design major students.
Example: Chart 4 – “Percentage of Semester Hours Generated by Non-Major Students,” Public Institutions, 401+ Majors. The average percentage of semester hours generated by non-art/design major students in the 72 institutions in this category is 30%. The percentiles also provide a range of data for comparison.

TOTAL ART/DESIGN STUDENT ENROLLMENT, ALL INSTITUTIONS
ART/DESIGN CHART 1-1
Number of Degrees
Awarded July 1, 2013
through June 30, 2014
Art/Design Major
Enrollment
Fall, 2014
Art/Design Major
Enrollment
Summer, 2014
Number of Institutions
with Majors
Associate of Fine Arts Degree Programs or Equivalent (65% Art/Design Content)
Crafts 2 17 35 7
Design 20 2,043 4,285 1,477
Studio Arts 17 777 2,274 434
Foundation/Basic Studies 6 110 492 27
Other 23 916 4,057 1,188
Total 41 3,863 11,143 3,133
Associate Degree Programs in Art Education, Art Therapy and Art/Business/Arts Administration
(50% Art/Design Content)
Art Education 4 21 69 5
Art Therapy 1 2 8 2
Art/Business/Arts Administration 2 157 591 180
Foundation/Basic Studies 0 0 0 0
Other 5 142 602 91
Total 9 322 1,270 278
Associate Liberal Arts Degree Programs in Art/Design (30-45% Art/Design Content)
Foundation/Basic Studies 7 185 642 66
Other 7 249 796 93
Total 12 434 1,438 159

ART/DESIGN CHART 1-2
TOTAL ART/DESIGN STUDENT ENROLLMENT, ALL INSTITUTIONS
Number of Degrees
Awarded July 1, 2013
through June 30, 2014
Art/Design Major
Enrollment
Fall, 2014
Art/Design Major
Enrollment
Summer, 2014
Number of Institutions
with Majors
Bachelor of Fine Arts Degree Programs or Equivalent (65% Art/Design Content)
Advertising Design 1,113 10 300 250
Animation 3,954 29 725 694
Art History 296 22 133 83
Ceramics 587 73 147 215
Communication Design (Graphic
Design, Visual Communication
Design)
16,982 172 3,573 4,259
Design 1,560 17 266 401
Digital Media/Multimedia 1,874 42 283 445
Drawing 750 41 203 273
Environmental Design 245 5 66 68
Fashion Design 4,973 26 1,434 1,118
Fiber 242 18 49 105
Film 1,721 17 232 365
Furniture Design 184 10 40 49
Game Art/Design 581 7 58 77
General Crafts 301 7 45 75
Glassworking 118 12 7 49
Illustration 6,824 55 1,400 1,667
Industrial Design 4,700 35 1,053 921
Interior Design 4,803 65 1,354 1,144
Jewelry/Fine Metals 587 45 140 206
Painting 2,437 104 466 869
Photography 5,429 128 1,181 1,602
Printmaking 698 89 161 302
Product Design 613 7 214 136
Sculpture 1,199 99 234 388
Studio Arts 10,025 113 2,469 2,374
Textile Design/Weaving 229 8 44 72
Theatre Design 0 0 0 0
Video 1,004 7 323 203
Foundation/Basic Studies 9,057 47 581 98
Other 15,577 134 3,238 3,079
Total 98,663 263 20,419 21,587

ART/DESIGN CHART 1-2 (continued)
TOTAL ART/DESIGN STUDENT ENROLLMENT, ALL INSTITUTIONS
Number of Degrees
Awarded July 1, 2013
through June 30, 2014
Art/Design Major
Enrollment
Fall, 2014
Art/Design Major
Enrollment
Summer, 2014
Number of Institutions
with Majors
Baccalaureate Degree Programs in Art Education, Art Therapy, and Art/Business/Arts Administration (50% Art/Design Content)
152 885 4,306 1,120Art Education
8 60 243 50Art Therapy
7 114 740 208Art/Business/Arts Administration
2 46 227 35Foundation/Basic Studies
17 361 1,168 145Other
162 1,466 6,684 1,558Total
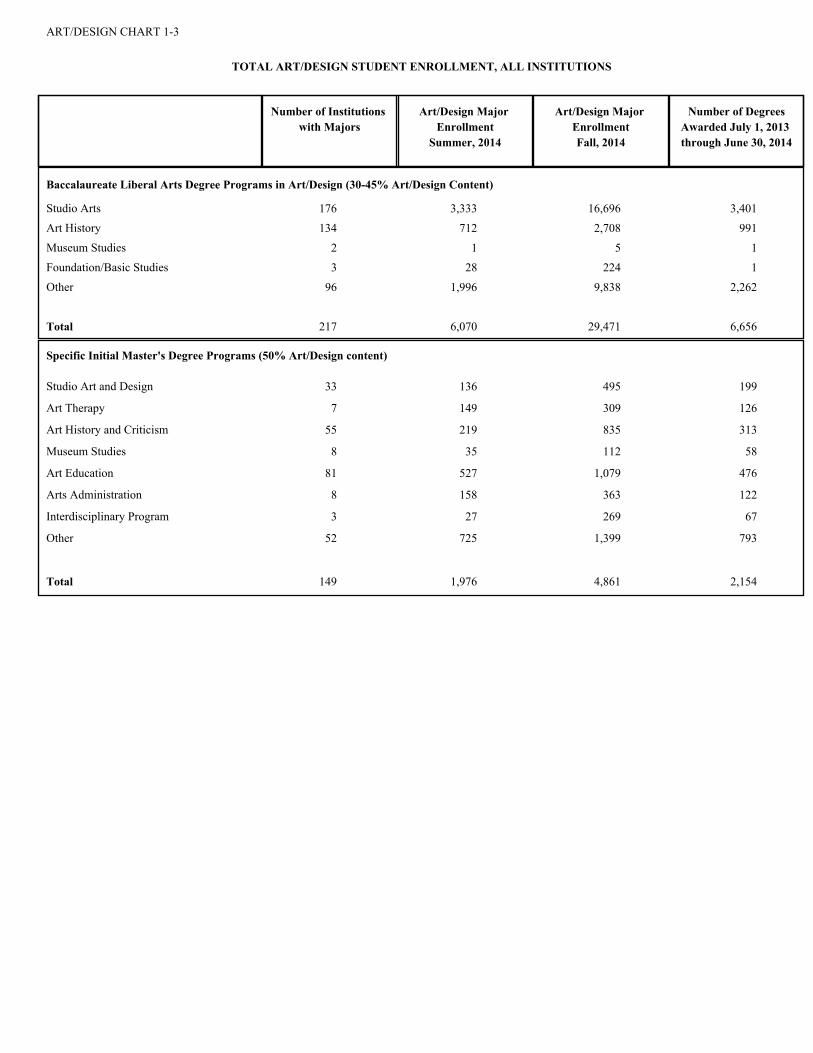
ART/DESIGN CHART 1-3
TOTAL ART/DESIGN STUDENT ENROLLMENT, ALL INSTITUTIONS
Number of Degrees
Awarded July 1, 2013
through June 30, 2014
Art/Design Major
Enrollment
Fall, 2014
Art/Design Major
Enrollment
Summer, 2014
Number of Institutions
with Majors
Baccalaureate Liberal Arts Degree Programs in Art/Design (30-45% Art/Design Content)
Studio Arts 176 3,333 16,696 3,401
Art History 134 712 2,708 991
Museum Studies 2 1 5 1
Foundation/Basic Studies 3 28 224 1
Other 96 1,996 9,838 2,262
Total 217 6,070 29,471 6,656
Specific Initial Master's Degree Programs (50% Art/Design content)
Studio Art and Design 33 136 495 199
Art Therapy 7 149 309 126
Art History and Criticism 55 219 835 313
Museum Studies 8 35 112 58
Art Education 81 527 1,079 476
Arts Administration 8 158 363 122
Interdisciplinary Program 3 27 269 67
Other 52 725 1,399 793
Total 149 1,976 4,861 2,154

ART/DESIGN CHART 1-4
TOTAL ART/DESIGN STUDENT ENROLLMENT, ALL INSTITUTIONS
Number of Degrees
Awarded July 1, 2013
through June 30, 2014
Art/Design Major
Enrollment
Fall, 2014
Art/Design Major
Enrollment
Summer, 2014
Number of Institutions
with Majors
Master of Fine Arts Degree Programs or Equivalent (2-year programs)
Advertising Design 1 141 219 62
Animation 2 302 600 204
Ceramics 38 41 201 67
Communication Design (Graphic
Design, Visual Communication Design)
36 304 871 234
Design 14 183 607 236
Digital Media/Multimedia 13 138 305 48
Drawing 13 7 61 15
Environmental Design 1 10 19 10
Fashion Design 6 444 785 239
Fiber 7 4 31 13
Film 10 212 512 207
Furniture Design 4 3 36 19
Game Art/Design 1 16 193 80
General Crafts 2 6 14 9
Glassworking 7 5 24 17
Illustration 10 232 489 137
Industrial Design 15 200 552 133
Interior Design 15 338 705 200
Jewelry/Fine Metals 23 43 160 41
Painting 55 142 637 301
Photography 47 266 759 261
Printmaking 42 31 199 72
Product Design 0 0 0 0
Sculpture 49 41 225 100
Studio Arts 42 466 1,407 490
Textile Design/Weaving 6 2 23 11
Theatre Design 0 0 0 0
Video 3 162 379 85
Visual Communications 7 64 137 14
Other 59 863 2,761 945
Total 144 4,666 12,911 4,250
Doctoral Degree Programs
Art History and Criticism 12 84 262 39
Art Education 8 83 192 36
Other 5 10 56 0
Total 19 177 510 75

TOTAL ART/DESIGN STUDENT ENROLLMENT, ALL INSTITUTIONS
ART/DESIGN CHART 1-5
Number of Degrees /
Certificates / Diplomas
Awarded July 1, 2013
through June 30, 2014
Enrollment
Fall, 2014
Enrollment
Summer, 2014
Number of Institutions
Undergraduate Level Non-Degree Programs (Certificate, Diploma, etc.)
Total 42 1,176 1,348 464
Graduate Level Non-Degree Programs (Certificate, Diploma, etc.)
Total 22 65 306 177
GRAND TOTAL
ART/DESIGN STUDENT
ENROLLMENT ALL LEVELS
345 40,634 168,605 40,491

ART/DESIGN CHART 2-1
ART/DESIGN MAJOR ENROLLMENT BY SIZE AND TYPE OF INSTITUTION
All Private Institutions
Number of Degrees /
Certificates / Diplomas
Awarded July 1, 2013
through June 30, 2014
Art/Design Major
Enrollment
Fall, 2014
Art/Design Major
Enrollment
Summer, 2014
Number of Institutions
with Majors
Associate of Fine Arts or Equivalent
(65% Art/Design content)
10 1,843 3,643 1,487
Associate Degree Programs in Art
Education, Art Therapy, and
Art/Business/Arts Administration
(50% Art/Design content)
2 120 419 218
Associate of Liberal Arts Degree
Programs in Art/Design
(30-45% Art/Design content)
0 0 0 0
Bachelor of Fine Arts or Equivalent
(65% Art/Design content)
86 10,998 50,418 10,698
Baccalaureate Degree Programs in Art
Education, Art Therapy, and
Art/Business/Arts Administration
(50% Art/Design content)
36 265 1,572 363
Baccalaureate Liberal Arts Degree
Programs in Art/Design (30-45%
Art/Design content)
51 859 3,568 957
Specific Initial Master's Degree
Programs in Art/Design
(50% Art/Design content)
45 1,080 2,552 1,219
Master of Fine Arts Degree Programs
in Art/Design
(2-year programs)
48 3,836 10,028 3,311
Doctoral Degree Programs 1 0 6 0
Undergraduate Level Non-Degree
Programs (Certificate, Diploma, etc.)
20 1,007 716 160
Graduate Level Non-Degree Programs
(Certificate, Diploma, etc.)
15 59 264 161
Grand Total 108 20,067 73,186 18,574
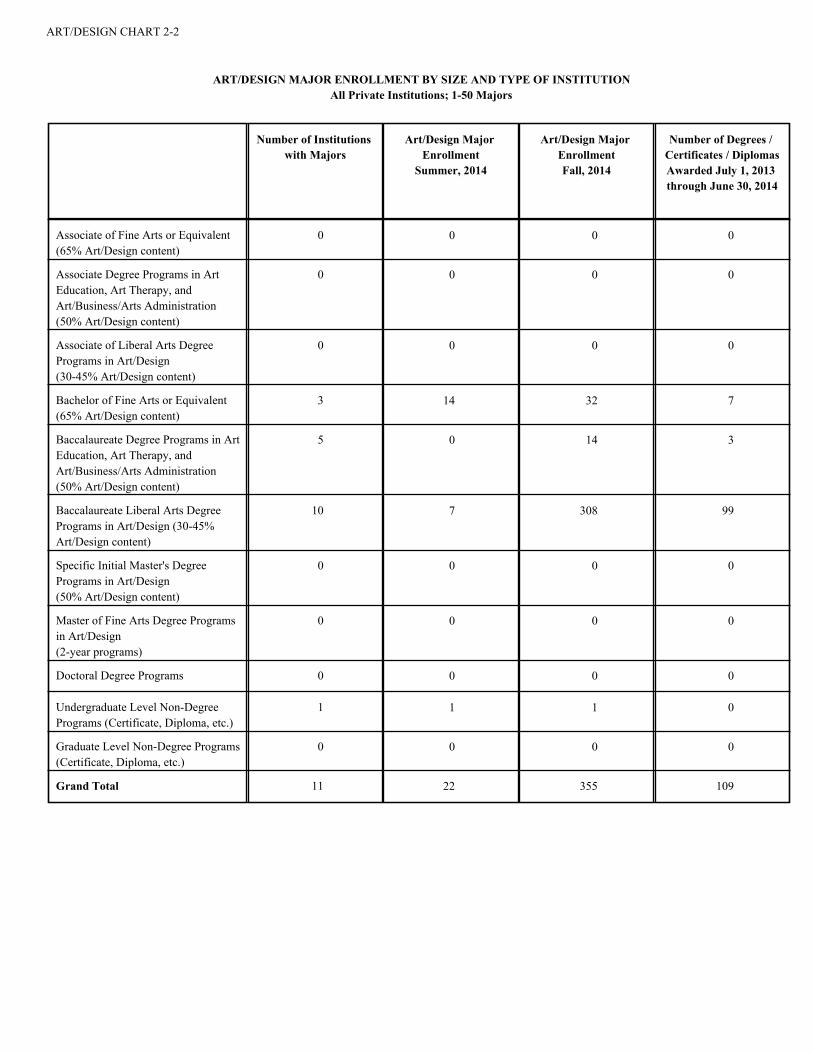
ART/DESIGN CHART 2-2
ART/DESIGN MAJOR ENROLLMENT BY SIZE AND TYPE OF INSTITUTION
All Private Institutions; 1-50 Majors
Number of Degrees /
Certificates / Diplomas
Awarded July 1, 2013
through June 30, 2014
Art/Design Major
Enrollment
Fall, 2014
Art/Design Major
Enrollment
Summer, 2014
Number of Institutions
with Majors
Associate of Fine Arts or Equivalent
(65% Art/Design content)
0 0 0 0
Associate Degree Programs in Art
Education, Art Therapy, and
Art/Business/Arts Administration
(50% Art/Design content)
0 0 0 0
Associate of Liberal Arts Degree
Programs in Art/Design
(30-45% Art/Design content)
0 0 0 0
Bachelor of Fine Arts or Equivalent
(65% Art/Design content)
3 14 32 7
Baccalaureate Degree Programs in Art
Education, Art Therapy, and
Art/Business/Arts Administration
(50% Art/Design content)
5 0 14 3
Baccalaureate Liberal Arts Degree
Programs in Art/Design (30-45%
Art/Design content)
10 7 308 99
Specific Initial Master's Degree
Programs in Art/Design
(50% Art/Design content)
0 0 0 0
Master of Fine Arts Degree Programs
in Art/Design
(2-year programs)
0 0 0 0
Doctoral Degree Programs 0 0 0 0
Undergraduate Level Non-Degree
Programs (Certificate, Diploma, etc.)
1 1 1 0
Graduate Level Non-Degree Programs
(Certificate, Diploma, etc.)
0 0 0 0
Grand Total 11 22 355 109

ART/DESIGN CHART 2-3
ART/DESIGN MAJOR ENROLLMENT BY SIZE AND TYPE OF INSTITUTION
Private Institutions; 51-100 Majors
Number of Degrees /
Certificates / Diplomas
Awarded July 1, 2013
through June 30, 2014
Art/Design Major
Enrollment
Fall, 2014
Art/Design Major
Enrollment
Summer, 2014
Number of Institutions
with Majors
Associate of Fine Arts or Equivalent
(65% Art/Design content)
0 0 0 0
Associate Degree Programs in Art
Education, Art Therapy, and
Art/Business/Arts Administration
(50% Art/Design content)
0 0 0 0
Associate of Liberal Arts Degree
Programs in Art/Design
(30-45% Art/Design content)
0 0 0 0
Bachelor of Fine Arts or Equivalent
(65% Art/Design content)
5 16 318 76
Baccalaureate Degree Programs in
Art Education, Art Therapy, and
Art/Business/Arts Administration
(50% Art/Design content)
2 2 25 5
Baccalaureate Liberal Arts Degree
Programs in Art/Design (30-45%
Art/Design content)
7 68 232 79
Specific Initial Master's Degree
Programs in Art/Design
(50% Art/Design content)
0 0 0 0
Master of Fine Arts Degree Programs
in Art/Design
(2-year programs)
0 0 0 0
Doctoral Degree Programs 0 0 0 0
Undergraduate Level Non-Degree
Programs (Certificate, Diploma, etc.)
0 0 0 0
Graduate Level Non-Degree
Programs (Certificate, Diploma, etc.)
0 0 0 0
Grand Total 8 86 575 160
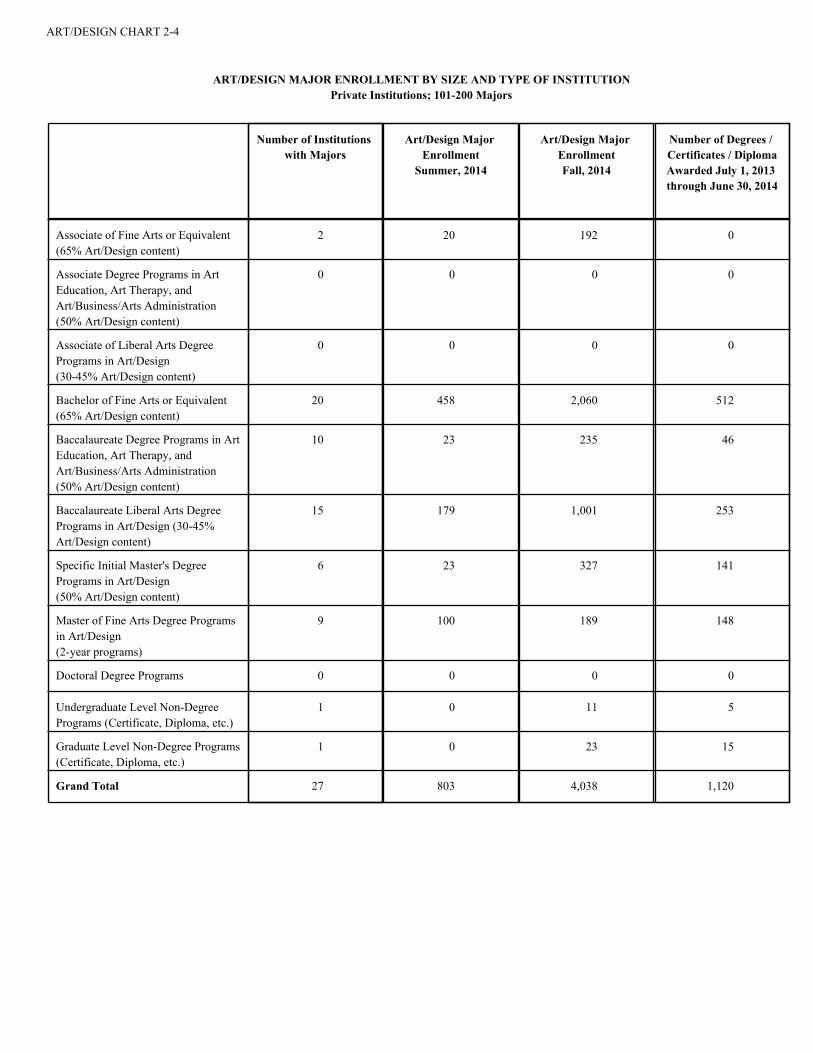
ART/DESIGN CHART 2-4
ART/DESIGN MAJOR ENROLLMENT BY SIZE AND TYPE OF INSTITUTION
Private Institutions; 101-200 Majors
Number of Degrees /
Certificates / Diploma
Awarded July 1, 2013
through June 30, 2014
Art/Design Major
Enrollment
Fall, 2014
Art/Design Major
Enrollment
Summer, 2014
Number of Institutions
with Majors
Associate of Fine Arts or Equivalent
(65% Art/Design content)
2 20 192 0
Associate Degree Programs in Art
Education, Art Therapy, and
Art/Business/Arts Administration
(50% Art/Design content)
0 0 0 0
Associate of Liberal Arts Degree
Programs in Art/Design
(30-45% Art/Design content)
0 0 0 0
Bachelor of Fine Arts or Equivalent
(65% Art/Design content)
20 458 2,060 512
Baccalaureate Degree Programs in Art
Education, Art Therapy, and
Art/Business/Arts Administration
(50% Art/Design content)
10 23 235 46
Baccalaureate Liberal Arts Degree
Programs in Art/Design (30-45%
Art/Design content)
15 179 1,001 253
Specific Initial Master's Degree
Programs in Art/Design
(50% Art/Design content)
6 23 327 141
Master of Fine Arts Degree Programs
in Art/Design
(2-year programs)
9 100 189 148
Doctoral Degree Programs 0 0 0 0
Undergraduate Level Non-Degree
Programs (Certificate, Diploma, etc.)
1 0 11 5
Graduate Level Non-Degree Programs
(Certificate, Diploma, etc.)
1 0 23 15
Grand Total 27 803 4,038 1,120

ART/DESIGN CHART 2-5
ART/DESIGN MAJOR ENROLLMENT BY SIZE AND TYPE OF INSTITUTION
Private Institutions; 201+ Majors
Number of Degrees /
Certificates / Diploma
Awarded July 1, 2013
through June 30, 2014
Art/Design Major
Enrollment
Fall, 2014
Art/Design Major
Enrollment
Summer, 2014
Number of Institutions
with Majors
Associate of Fine Arts or Equivalent
(65% Art/Design content)
8 1,823 3,451 1,487
Associate Degree Programs in Art
Education, Art Therapy, and
Art/Business/Arts Administration
(50% Art/Design content)
2 120 419 218
Associate of Liberal Arts Degree
Programs in Art/Design
(30-45% Art/Design content)
0 0 0 0
Bachelor of Fine Arts or Equivalent
(65% Art/Design content)
58 10,510 48,008 10,103
Baccalaureate Degree Programs in
Art Education, Art Therapy, and
Art/Business/Arts Administration
(50% Art/Design content)
19 240 1,298 309
Baccalaureate Liberal Arts Degree
Programs in Art/Design (30-45%
Art/Design content)
19 605 2,027 526
Specific Initial Master's Degree
Programs in Art/Design
(50% Art/Design content)
42 3,813 9,701 3,170
Master of Fine Arts Degree
Programs in Art/Design
(2-year programs)
36 980 2,363 1,071
Doctoral Degree Programs 1 0 6 0
Undergraduate Level Non-Degree
Programs (Certificate, Diploma, etc.)
18 1,006 704 155
Graduate Level Non-Degree
Programs (Certificate, Diploma, etc.)
14 59 241 146
Grand Total 62 19,156 68,218 17,185

ART/DESIGN CHART 2-6
ART/DESIGN MAJOR ENROLLMENT BY SIZE AND TYPE OF INSTITUTION
All Public Institutions
Number of Degrees /
Certificates / Diploma
Awarded July 1, 2013
through June 30, 2014
Art/Design Major
Enrollment
Fall, 2014
Art/Design Major
Enrollment
Summer, 2014
Number of Institutions
with Majors
Associate of Fine Arts or Equivalent
(65% Art/Design content)
31 2,020 7,500 1,646
Associate Degree Programs in Art
Education, Art Therapy, and
Art/Business/Arts Administration
(50% Art/Design content)
7 202 851 60
Associate of Liberal Arts Degree
Programs in Art/Design
(30-45% Art/Design content)
12 434 1,438 159
Bachelor of Fine Arts Degree
(65% Art/Design content)
177 9,421 48,245 10,889
Baccalaureate Degree Programs in Art
Education, Art Therapy, and
Art/Business/Arts Administration
(50% Art/Design content)
126 1,201 5,112 1,195
Baccalaureate Liberal Arts Degree
Programs in Art/Design
(30-45% Art/Design content)
166 5,211 25,903 5,699
Specific Initial Master's Degree
Programs in Art/Design
(50% Art/Design content)
104 896 2,309 935
Master of Fine Arts Degree Programs
in Art/Design
(2-year programs)
96 830 2,883 939
Doctoral Degree Programs 18 177 504 75
Undergraduate Level Non-Degree
Programs (Certificate, Diploma, etc.)
22 169 632 304
Graduate Level Non-Degree Programs
(Certificate, Diploma, etc.)
7 6 42 16
Grand Total 237 20,567 95,419 21,917
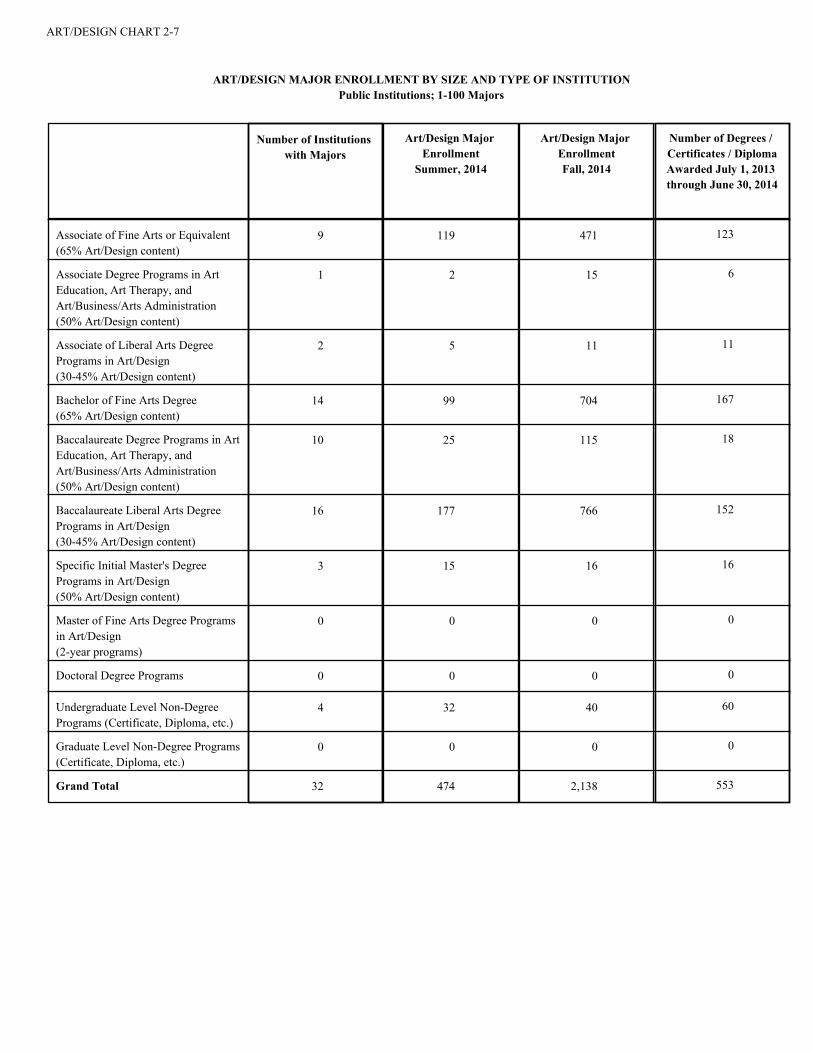
ART/DESIGN CHART 2-7
ART/DESIGN MAJOR ENROLLMENT BY SIZE AND TYPE OF INSTITUTION
Public Institutions; 1-100 Majors
Number of Degrees /
Certificates / Diploma
Awarded July 1, 2013
through June 30, 2014
Art/Design Major
Enrollment
Fall, 2014
Art/Design Major
Enrollment
Summer, 2014
Number of Institutions
with Majors
Associate of Fine Arts or Equivalent
(65% Art/Design content)
9 119 471 123
Associate Degree Programs in Art
Education, Art Therapy, and
Art/Business/Arts Administration
(50% Art/Design content)
1 2 15 6
Associate of Liberal Arts Degree
Programs in Art/Design
(30-45% Art/Design content)
2 5 11 11
Bachelor of Fine Arts Degree
(65% Art/Design content)
14 99 704 167
Baccalaureate Degree Programs in Art
Education, Art Therapy, and
Art/Business/Arts Administration
(50% Art/Design content)
10 25 115 18
Baccalaureate Liberal Arts Degree
Programs in Art/Design
(30-45% Art/Design content)
16 177 766 152
Specific Initial Master's Degree
Programs in Art/Design
(50% Art/Design content)
3 15 16 16
Master of Fine Arts Degree Programs
in Art/Design
(2-year programs)
0 0 0 0
Doctoral Degree Programs 0 0 0 0
Undergraduate Level Non-Degree
Programs (Certificate, Diploma, etc.)
4 32 40 60
Graduate Level Non-Degree Programs
(Certificate, Diploma, etc.)
0 0 0 0
Grand Total 32 474 2,138 553

ART/DESIGN CHART 2-8
ART/DESIGN MAJOR ENROLLMENT BY SIZE AND TYPE OF INSTITUTION
Public Institutions; 101-200 Majors
Number of Degrees /
Certificates / Diploma
Awarded July 1, 2013
through June 30, 2014
Art/Design Major
Enrollment
Fall, 2014
Art/Design Major
Enrollment
Summer, 2014
Number of Institutions
with Majors
Associate of Fine Arts or Equivalent
(65% Art/Design content)
8 213 824 197
Associate Degree Programs in Art
Education, Art Therapy, and
Art/Business/Arts Administration
(50% Art/Design content)
2 28 151 25
Associate of Liberal Arts Degree
Programs in Art/Design
(30-45% Art/Design content)
3 62 237 34
Bachelor of Fine Arts Degree
(65% Art/Design content)
39 481 3,400 744
Baccalaureate Degree Programs in
Art Education, Art Therapy, and
Art/Business/Arts Administration
(50% Art/Design content)
28 112 666 150
Baccalaureate Liberal Arts Degree
Programs in Art/Design
(30-45% Art/Design content)
34 486 2,684 520
Specific Initial Master's Degree
Programs in Art/Design
(50% Art/Design content)
14 115 128 61
Master of Fine Arts Degree
Programs in Art/Design
(2-year programs)
11 70 205 51
Doctoral Degree Programs 1 3 2 0
Undergraduate Level Non-Degree
Programs (Certificate, Diploma, etc.)
3 3 26 2
Graduate Level Non-Degree
Programs (Certificate, Diploma, etc.)
1 0 2 2
Grand Total 55 1,573 8,325 1,786

ART/DESIGN CHART 2-9
ART/DESIGN MAJOR ENROLLMENT BY SIZE AND TYPE OF INSTITUTION
Public Institutions; 201-400 Majors
Number of Degrees /
Certificates / Diploma
Awarded July 1, 2013
through June 30, 2014
Art/Design Major
Enrollment
Fall, 2014
Art/Design Major
Enrollment
Summer, 2014
Number of Institutions
with Majors
Associate of Fine Arts or Equivalent
(65% Art/Design content)
6 245 1,138 129
Associate Degree Programs in Art
Education, Art Therapy, and
Art/Business/Arts Administration
(50% Art/Design content)
1 2 18 0
Associate of Liberal Arts Degree
Programs in Art/Design
(30-45% Art/Design content)
5 293 870 114
Bachelor of Fine Arts Degree
(65% Art/Design content)
57 2,168 8,869 2,153
Baccalaureate Degree Programs in
Art Education, Art Therapy, and
Art/Business/Arts Administration
(50% Art/Design content)
42 380 1,450 352
Baccalaureate Liberal Arts Degree
Programs in Art/Design
(30-45% Art/Design content)
58 1,726 7,292 1,548
Specific Initial Master's Degree
Programs in Art/Design
(50% Art/Design content)
34 205 492 190
Master of Fine Arts Degree
Programs in Art/Design
(2-year programs)
29 130 458 164
Doctoral Degree Programs 3 16 54 4
Undergraduate Level Non-Degree
Programs (Certificate, Diploma, etc.)
7 29 252 152
Graduate Level Non-Degree
Programs (Certificate, Diploma, etc.)
0 0 0 0
Grand Total 71 5,194 20,893 4,806
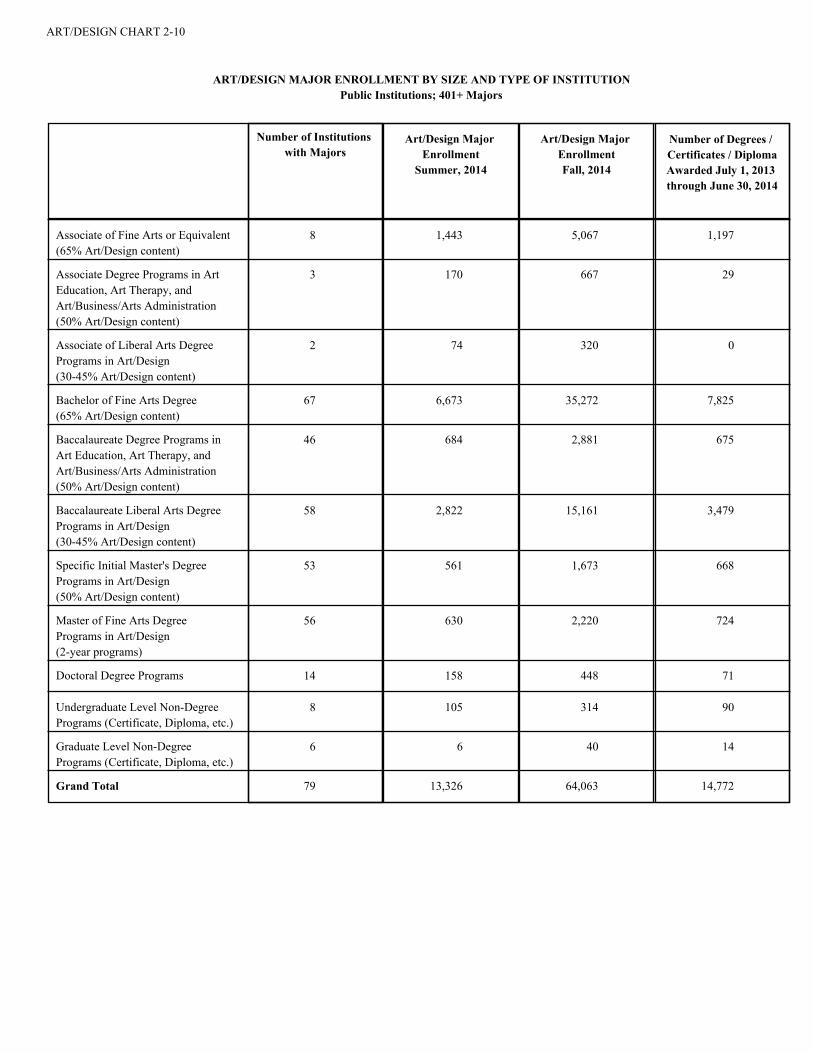
ART/DESIGN CHART 2-10
ART/DESIGN MAJOR ENROLLMENT BY SIZE AND TYPE OF INSTITUTION
Public Institutions; 401+ Majors
Number of Degrees /
Certificates / Diploma
Awarded July 1, 2013
through June 30, 2014
Art/Design Major
Enrollment
Fall, 2014
Art/Design Major
Enrollment
Summer, 2014
Number of Institutions
with Majors
Associate of Fine Arts or Equivalent
(65% Art/Design content)
8 1,443 5,067 1,197
Associate Degree Programs in Art
Education, Art Therapy, and
Art/Business/Arts Administration
(50% Art/Design content)
3 170 667 29
Associate of Liberal Arts Degree
Programs in Art/Design
(30-45% Art/Design content)
2 74 320 0
Bachelor of Fine Arts Degree
(65% Art/Design content)
67 6,673 35,272 7,825
Baccalaureate Degree Programs in
Art Education, Art Therapy, and
Art/Business/Arts Administration
(50% Art/Design content)
46 684 2,881 675
Baccalaureate Liberal Arts Degree
Programs in Art/Design
(30-45% Art/Design content)
58 2,822 15,161 3,479
Specific Initial Master's Degree
Programs in Art/Design
(50% Art/Design content)
53 561 1,673 668
Master of Fine Arts Degree
Programs in Art/Design
(2-year programs)
56 630 2,220 724
Doctoral Degree Programs 14 158 448 71
Undergraduate Level Non-Degree
Programs (Certificate, Diploma, etc.)
8 105 314 90
Graduate Level Non-Degree
Programs (Certificate, Diploma, etc.)
6 6 40 14
Grand Total 79 13,326 64,063 14,772
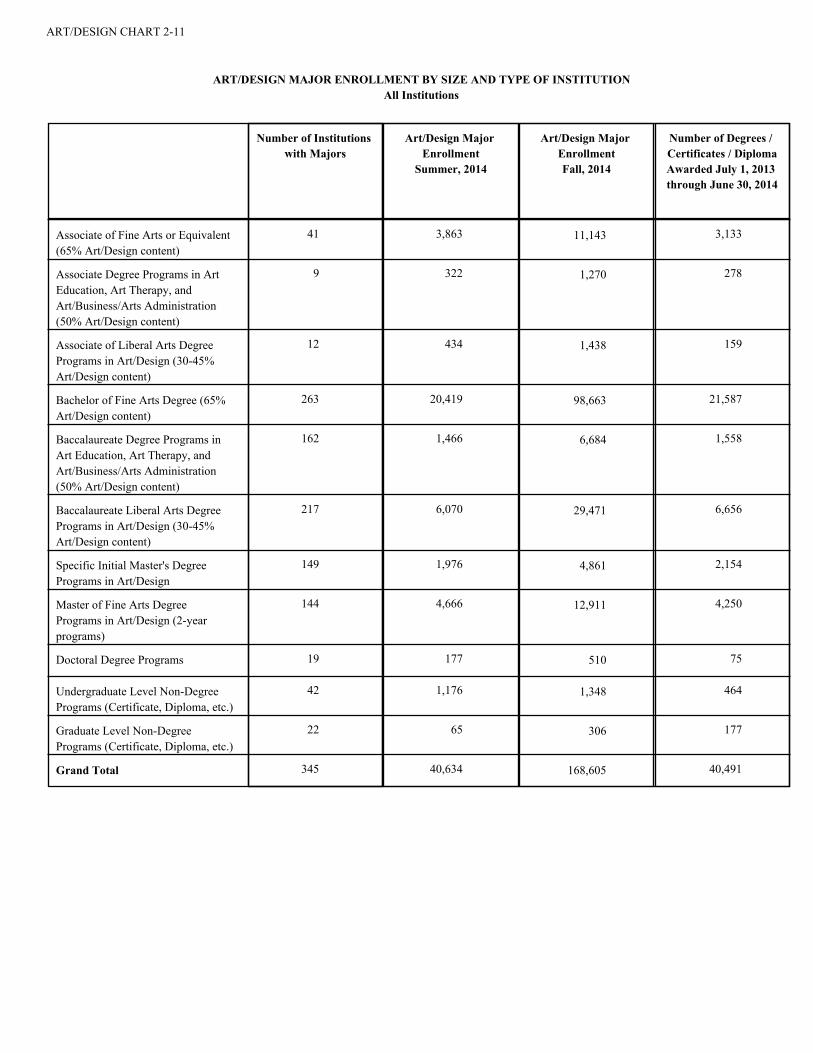
ART/DESIGN CHART 2-11
ART/DESIGN MAJOR ENROLLMENT BY SIZE AND TYPE OF INSTITUTION
All Institutions
Number of Degrees /
Certificates / Diploma
Awarded July 1, 2013
through June 30, 2014
Art/Design Major
Enrollment
Fall, 2014
Art/Design Major
Enrollment
Summer, 2014
Number of Institutions
with Majors
Associate of Fine Arts or Equivalent
(65% Art/Design content)
41 3,863 11,143 3,133
Associate Degree Programs in Art
Education, Art Therapy, and
Art/Business/Arts Administration
(50% Art/Design content)
9 322 1,270 278
Associate of Liberal Arts Degree
Programs in Art/Design (30-45%
Art/Design content)
12 434 1,438 159
Bachelor of Fine Arts Degree (65%
Art/Design content)
263 20,419 98,663 21,587
Baccalaureate Degree Programs in
Art Education, Art Therapy, and
Art/Business/Arts Administration
(50% Art/Design content)
162 1,466 6,684 1,558
Baccalaureate Liberal Arts Degree
Programs in Art/Design (30-45%
Art/Design content)
217 6,070 29,471 6,656
Specific Initial Master's Degree
Programs in Art/Design
149 1,976 4,861 2,154
Master of Fine Arts Degree
Programs in Art/Design (2-year
programs)
144 4,666 12,911 4,250
Doctoral Degree Programs 19 177 510 75
Undergraduate Level Non-Degree
Programs (Certificate, Diploma, etc.)
42 1,176 1,348 464
Graduate Level Non-Degree
Programs (Certificate, Diploma, etc.)
22 65 306 177
Grand Total 345 40,634 168,605 40,491

ART/DESIGN CHART 4
PERCENTAGE OF QUARTER HOURS GENERATED BY NON-MAJOR STUDENTSINSTITUTIONS WITH QUARTER HOUR SYSTEMS
Number of Institutions Reporting
5th Percentile
25th Percentile
50th Percentile
75th Percentile
95th Percentile
Average
Private Institutions
1-50 Art/Design Majors 1 17%17%17%17%17%17%
51-100 Art/Design Majors 0 0%0%0%0%0%0%
101-200 Art/Design Majors 0 0%0%0%0%0%0%
201+ Art/Design Majors 3 30%50%36%18%18%17%
Public Institutions
1-100 Art/Design Majors 1 7%7%7%7%7%7%
101-200 Art/Design Majors 0 0%0%0%0%0%0%
201-400 Art/Design Majors 1 38%38%38%38%38%38%
401+ Art/Design Majors 4 37%57%54%38%20%17%
All Institutions 10 30%56%50%20%17%11%

ART/DESIGN CHART 4 (continued)
PERCENTAGE OF SEMESTER HOURS GENERATED BY NON-MAJOR STUDENTSINSTITUTIONS WITH SEMESTER HOUR SYSTEMS
Number of Institutions Reporting
5th Percentile
25th Percentile
50th Percentile
75th Percentile
95th Percentile
Average
Private Institutions
1-50 Art/Design Majors 10 61%88%71%63%47%38%
51-100 Art/Design Majors 8 52%78%59%48%41%36%
101-200 Art/Design Majors 20 24%48%31%23%14%6%
201+ Art/Design Majors 36 16%57%27%7%2%1%
Public Institutions
1-100 Art/Design Majors 30 52%88%61%53%36%26%
101-200 Art/Design Majors 52 44%65%57%46%34%19%
201-400 Art/Design Majors 70 40%70%50%38%28%15%
401+ Art/Design Majors 72 30%57%40%30%20%8%
All Institutions 298 37%68%51%36%23%4%

ART/DESIGN CHART 5
ART/DESIGN FACULTY BY RANK, GENDER AND HIGHEST DEGREE EARNED
Number of
Institutions
Reporting
With
Doctorate
With
MFA
With
Master's
(Non-MFA)
With
Bachelor's
With
Associate's
With No
Degree
Total Percent of
Total Faculty
(1)
MEN
Professor 258 167 749 106 65 1 5 1,093 26%
Associate Professor 267 177 742 131 84 0 6 1,140 28%
Assistant Professor 252 128 590 109 79 1 8 915 22%
Instructor 70 15 130 42 144 17 23 371 9%
Lecturer 56 6 82 18 21 0 2 129 3%
Unranked 19 23 143 57 138 3 24 388 9%
Visiting Faculty 50 9 68 14 8 0 1 100 2%
TOTAL 327 525 2,504 477 539 22 69 4,136 100%
Percent With Specific
Degree (1)
13% 61% 12% 13% 1% 2% 100%
WOMEN
Professor 230 206 499 77 32 1 2 817 23%
Associate Professor 256 296 619 87 36 2 2 1,042 29%
Assistant Professor 246 247 444 125 60 3 1 880 25%
Instructor 72 15 110 61 84 20 9 299 8%
Lecturer 53 15 107 49 10 0 0 181 5%
Unranked 16 24 118 63 49 1 10 265 7%
Visiting Faculty 41 10 45 13 5 0 1 74 2%
TOTAL 324 813 1,942 475 276 27 25 3,558 100%
Percent With
Specific Degree (1)
23% 55% 13% 8% 1% 1% 100%
ART/DESIGN CHART 5 (continued)
ART/DESIGN FACULTY BY RANK, GENDER AND HIGHEST DEGREE EARNED
Number of
Institutions
Reporting
With
Doctorate
With
MFA
With
Master's
(Non-MFA)
With
Bachelor's
With
Associate's
With No
Degree
Total Percent of
Total Faculty
(1)
MEN AND WOMEN COMBINED (2)
Professor 297 380 1,277 185 97 2 8 1,949 25%
Associate Professor 306 481 1,408 224 120 2 8 2,243 28%
Assistant Professor 302 392 1,067 240 141 4 9 1,853 24%
Instructor 106 31 254 105 232 38 32 692 9%
Lecturer 77 21 192 67 32 0 2 314 4%
Unranked 22 47 261 120 187 4 34 653 8%
Visiting Faculty 69 19 116 27 13 0 2 177 2%
TOTAL 343 1,371 4,575 968 822 50 95 7,881 100%
Percent With Specific
Degree (1)
17% 58% 12% 10% 1% 1% 100%

Higher Education Arts Data Services DATA SUMMARIES
2014-2015
ART/DESIGN FACULTY NUMBERS
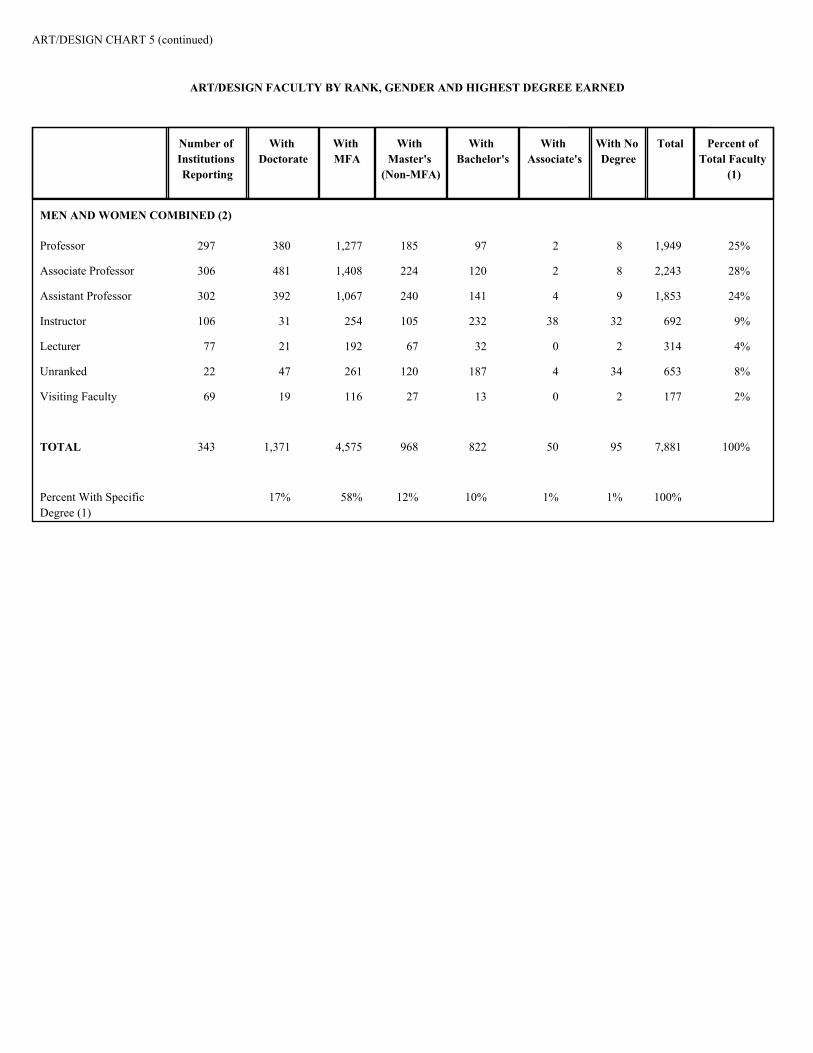
Charts 5 through 13 provide a variety of calculations of the number of full-time faculty members. The charts calculate the number of faculty members by gender, highest degree earned, academic rank, length of service at the same institution, and tenure status. Chart 12-3 shows information regarding average numbers of faculty members and average instructional FTE.
Example: Chart 10 – “Art/Design Faculty by Gender and Length of Service: Institutions Categorized by Type of Support,” Private Institutions, Women.
At the 97 private institutions reporting faculty data by gender, 367 female faculty members have been employed full-time for 1-4 years, 323 have been employed for 5-9 years, and 712 have been employed for 10 years or more at the same institution. These figures are based on a total of 1,402 female faculty members at private institutions, representing 43% of all faculty at schools that reported faculty data by gender.
(1) Due to rounding, percentages may not sum to 100%.
(2) Some respondents are unable to provide faculty data by gender. Therefore, this combined total has more entries than the sum of the individual male and female entries.

ART/DESIGN CHART 5
ART/DESIGN FACULTY BY RANK, GENDER AND HIGHEST DEGREE EARNED
Number of
Institutions
Reporting
With
Doctorate
With
MFA
With
Master's
(Non-MFA)
With
Bachelor's
With
Associate's
With No
Degree
Total Percent of
Total Faculty
(1)
MEN
Professor 258 167 749 106 65 1 5 1,093 26%
Associate Professor 267 177 742 131 84 0 6 1,140 28%
Assistant Professor 252 128 590 109 79 1 8 915 22%
Instructor 70 15 130 42 144 17 23 371 9%
Lecturer 56 6 82 18 21 0 2 129 3%
Unranked 19 23 143 57 138 3 24 388 9%
Visiting Faculty 50 9 68 14 8 0 1 100 2%
TOTAL 327 525 2,504 477 539 22 69 4,136 100%
Percent With Specific
Degree (1)
13% 61% 12% 13% 1% 2% 100%
WOMEN
Professor 230 206 499 77 32 1 2 817 23%
Associate Professor 256 296 619 87 36 2 2 1,042 29%
Assistant Professor 246 247 444 125 60 3 1 880 25%
Instructor 72 15 110 61 84 20 9 299 8%
Lecturer 53 15 107 49 10 0 0 181 5%
Unranked 16 24 118 63 49 1 10 265 7%
Visiting Faculty 41 10 45 13 5 0 1 74 2%
TOTAL 324 813 1,942 475 276 27 25 3,558 100%
Percent With
Specific Degree (1)
23% 55% 13% 8% 1% 1% 100%

ART/DESIGN CHART 5 (continued)
ART/DESIGN FACULTY BY RANK, GENDER AND HIGHEST DEGREE EARNED
Number of
Institutions
Reporting
With
Doctorate
With
MFA
With
Master's
(Non-MFA)
With
Bachelor's
With
Associate's
With No
Degree
Total Percent of
Total Faculty
(1)
MEN AND WOMEN COMBINED (2)
Professor 297 380 1,277 185 97 2 8 1,949 25%
Associate Professor 306 481 1,408 224 120 2 8 2,243 28%
Assistant Professor 302 392 1,067 240 141 4 9 1,853 24%
Instructor 106 31 254 105 232 38 32 692 9%
Lecturer 77 21 192 67 32 0 2 314 4%
Unranked 22 47 261 120 187 4 34 653 8%
Visiting Faculty 69 19 116 27 13 0 2 177 2%
TOTAL 343 1,371 4,575 968 822 50 95 7,881 100%
Percent With Specific
Degree (1)
17% 58% 12% 10% 1% 1% 100%

ART/DESIGN CHART 6
ART/DESIGN FACULTY BY RANK AND HIGHEST DEGREE EARNED
INSTITUTIONS CATEGORIZED BY HIGHEST DEGREE GRANTED IN ART/DESIGN
Number of
Institutions
Reporting
With
Doctorate
With
MFA
With
Master's
(Non-MFA)
With
Bachelor's
With
Associate's
With No
Degree
Total Percent of
Total Faculty
(1)
Associate Degree-Granting Institutions
Professor 16 5 41 18 0 0 0 64 20%
Associate Professor 18 3 20 12 5 0 0 40 12%
Assistant Professor 17 2 27 11 10 0 0 50 16%
Instructor 10 4 32 26 49 24 11 146 45%
Lecturer 0 0 0 0 0 0 0 0 0%
Unranked 3 1 17 2 0 0 0 20 6%
Visiting Faculty 1 0 1 0 0 0 0 1 0%
TOTAL 30 15 138 69 64 24 11 321 100%
Percent of Total (1) 5% 43% 21% 20% 7% 3% 100%
Baccalaureate Degree-Granting Institutions
Professor 108 55 307 17 9 1 2 391 26%
Associate Professor 111 88 314 18 10 0 2 432 29%
Assistant Professor 108 78 276 23 12 0 1 390 26%
Instructor 37 4 52 13 9 0 0 78 5%
Lecturer 26 5 51 12 4 0 0 72 5%
Unranked 6 11 46 13 25 1 0 96 6%
Visiting Faculty 22 3 22 7 5 0 0 37 2%
TOTAL 124 244 1,068 103 74 2 5 1,496 100%
Percent of Total (1) 16% 71% 7% 5% 0% 0% 100%

ART/DESIGN CHART 6 (continued)
ART/DESIGN FACULTY BY RANK AND HIGHEST DEGREE EARNED
INSTITUTIONS CATEGORIZED BY HIGHEST DEGREE GRANTED IN ART/DESIGN
Number of
Institutions
Reporting
With
Doctorate
With
MFA
With
Master's
(Non-MFA)
With
Bachelor's
With
Associate's
With No
Degree
Total Percent of
Total Faculty
(1)
Master's (Non-MFA) Degree-Granting Institutions
Professor 39 34 139 20 1 0 0 194 28%
Associate Professor 42 48 141 24 6 0 0 219 32%
Assistant Professor 41 45 109 29 7 0 0 190 28%
Instructor 7 1 14 13 14 5 0 47 7%
Lecturer 6 1 7 3 2 0 0 13 2%
Unranked 2 7 2 6 0 0 0 15 2%
Visiting Faculty 6 0 7 2 1 0 0 10 1%
TOTAL 44 136 419 97 31 5 0 688 100%
Percent of Total (1) 20% 61% 14% 5% 1% 0% 100%
MFA Degree-Granting Institutions
Professor 117 223 704 111 77 1 5 1,121 24%
Associate Professor 118 264 792 131 90 2 6 1,285 28%
Assistant Professor 118 194 567 154 104 4 7 1,030 22%
Instructor 46 18 134 48 149 9 21 379 8%
Lecturer 37 10 119 36 15 0 1 181 4%
Unranked 9 27 195 99 162 3 34 520 11%
Visiting Faculty 29 9 62 13 7 0 1 92 2%
TOTAL 127 745 2,573 592 604 19 75 4,608 100%
Percent of Total (1) 16% 56% 13% 13% 0% 2% 100%

ART/DESIGN CHART 6 (continued)
ART/DESIGN FACULTY BY RANK AND HIGHEST DEGREE EARNED
INSTITUTIONS CATEGORIZED BY HIGHEST DEGREE GRANTED IN ART/DESIGN
Number of
Institutions
Reporting
With
Doctorate
With
MFA
With
Master's
(Non-MFA)
With
Bachelor's
With
Associate's
With No
Degree
Total Percent of
Total Faculty
(1)
Doctoral Degree-Granting Institutions
Professor 17 63 86 19 10 0 1 179 23%
Associate Professor 17 78 141 39 9 0 0 267 35%
Assistant Professor 18 73 88 23 8 0 1 193 25%
Instructor 6 4 22 5 11 0 0 42 5%
Lecturer 8 5 15 16 11 0 1 48 6%
Unranked 2 1 1 0 0 0 0 2 0%
Visiting Faculty 11 7 24 5 0 0 1 37 5%
TOTAL 18 231 377 107 49 0 4 768 100%
Percent of Total (1) 30% 49% 14% 6% 0% 1% 100%
All Institutions
Professor 297 380 1,277 185 97 2 8 1,949 25%
Associate Professor 306 481 1,408 224 120 2 8 2,243 28%
Assistant Professor 302 392 1,067 240 141 4 9 1,853 24%
Instructor 106 31 254 105 232 38 32 692 9%
Lecturer 77 21 192 67 32 0 2 314 4%
Unranked 22 47 261 120 187 4 34 653 8%
Visiting Faculty 69 19 116 27 13 0 2 177 2%
TOTAL 343 1,371 4,575 968 822 50 95 7,881 100%
Percent of Total (1) 17% 58% 12% 10% 1% 1% 100%

ART/DESIGN CHART 7
ART/DESIGN FACULTY BY GENDER AND ACADEMIC RANK
INSTITUTIONS CATEGORIZED BY TYPE OF SUPPORT
Number of
Institutions
Reporting
Professor Associate
Professor
Assistant
Professor
Instructor Lecturer Unranked Visiting
Faculty
Total Percent of
Total Faculty
(1)
Private Institutions
Men 98 385 402 321 262 36 370 41 1,817 56%
Women 97 256 342 297 196 33 254 24 1,402 43%
TOTAL (2) 106 650 756 638 460 70 624 65 3,263 100%
Percent of Total (1) 20% 23% 20% 14% 2% 19% 2% 100%
Public Institutions
Men 229 707 738 594 109 93 18 59 2,318 50%
Women 227 561 700 583 103 148 11 50 2,156 47%
TOTAL (2) 237 1,298 1,487 1,215 232 244 29 112 4,617 100%
Percent of Total (1) 28% 32% 26% 5% 5% 1% 2% 100%
All Institutions
Men 327 1,092 1,140 915 371 129 388 100 4,135 52%
Women 324 817 1,042 880 299 181 265 74 3,558 45%
TOTAL (2) 343 1,948 2,243 1,853 692 314 653 177 7,880 100%
Percent of Total (1) 25% 28% 24% 9% 4% 8% 2% 100%

ART/DESIGN CHART 8
ART/DESIGN FACULTY BY GENDER AND HIGHEST DEGREE EARNED
INSTITUTIONS CATEGORIZED BY TYPE OF SUPPORT
Number of
Institutions
Reporting
With
Doctorate
With
MFA
With
Master's
(Non-MFA)
With
Bachelor's
With
Associate's
With No
Degree
Total Percent of
Total Faculty
(1)
Private Institutions
Men 98 189 853 243 450 19 64 1,818 56%
Women 97 214 686 247 207 24 24 1,402 43%
TOTAL (2) 106 407 1,570 495 661 43 88 3,264 100%
Percent of Total (1) 12% 48% 15% 20% 1% 3% 100%
Public Institutions
Men 229 336 1,651 234 89 3 5 2,318 50%
Women 227 599 1,256 228 69 3 1 2,156 47%
TOTAL (2) 237 964 3,005 473 161 7 7 4,617 100%
Percent of Total (1) 21% 65% 10% 3% 0% 0% 100%
All Institutions
Men 327 525 2,504 477 539 22 69 4,136 52%
Women 324 813 1,942 475 276 27 25 3,558 45%
TOTAL (2) 343 1,371 4,575 968 822 50 95 7,881 100%
Percent of Total (1) 17% 58% 12% 10% 1% 1% 100%
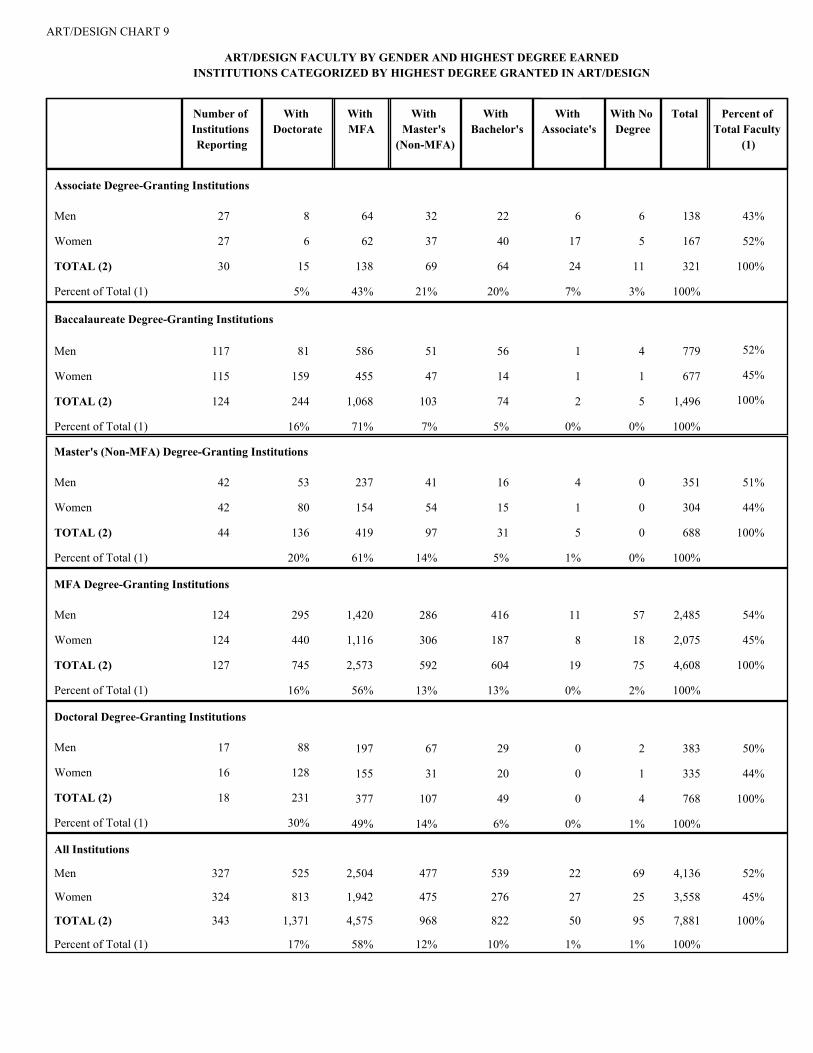
ART/DESIGN CHART 9
ART/DESIGN FACULTY BY GENDER AND HIGHEST DEGREE EARNED
INSTITUTIONS CATEGORIZED BY HIGHEST DEGREE GRANTED IN ART/DESIGN
Number of
Institutions
Reporting
With
Doctorate
With
MFA
With
Master's
(Non-MFA)
With
Bachelor's
With
Associate's
With No
Degree
Total Percent of
Total Faculty
(1)
Associate Degree-Granting Institutions
Men 27 8 64 32 22 6 6 138 43%
Women 27 6 62 37 40 17 5 167 52%
TOTAL (2) 30 15 138 69 64 24 11 321 100%
Percent of Total (1) 5% 43% 21% 20% 7% 3% 100%
Baccalaureate Degree-Granting Institutions
Men 117 81 586 51 56 1 4 779 52%
Women 115 159 455 47 14 1 1 677 45%
TOTAL (2) 124 244 1,068 103 74 2 5 1,496 100%
Percent of Total (1) 16% 71% 7% 5% 0% 0% 100%
Master's (Non-MFA) Degree-Granting Institutions
Men 42 53 237 41 16 4 0 351 51%
Women 42 80 154 54 15 1 0 304 44%
TOTAL (2) 44 136 419 97 31 5 0 688 100%
Percent of Total (1) 20% 61% 14% 5% 1% 0% 100%
MFA Degree-Granting Institutions
Men 124 295 1,420 286 416 11 57 2,485 54%
Women 124 440 1,116 306 187 8 18 2,075 45%
TOTAL (2) 127 745 2,573 592 604 19 75 4,608 100%
Percent of Total (1) 16% 56% 13% 13% 0% 2% 100%
Doctoral Degree-Granting Institutions
Men 17 88 197 67 29 0 2 383 50%
Women 16 128 155 31 20 0 1 335 44%
TOTAL (2) 18 231 377 107 49 0 4 768 100%
Percent of Total (1) 30% 49% 14% 6% 0% 1% 100%
All Institutions
Men 327 525 2,504 477 539 22 69 4,136 52%
Women 324 813 1,942 475 276 27 25 3,558 45%
TOTAL (2) 343 1,371 4,575 968 822 50 95 7,881 100%
Percent of Total (1) 17% 58% 12% 10% 1% 1% 100%
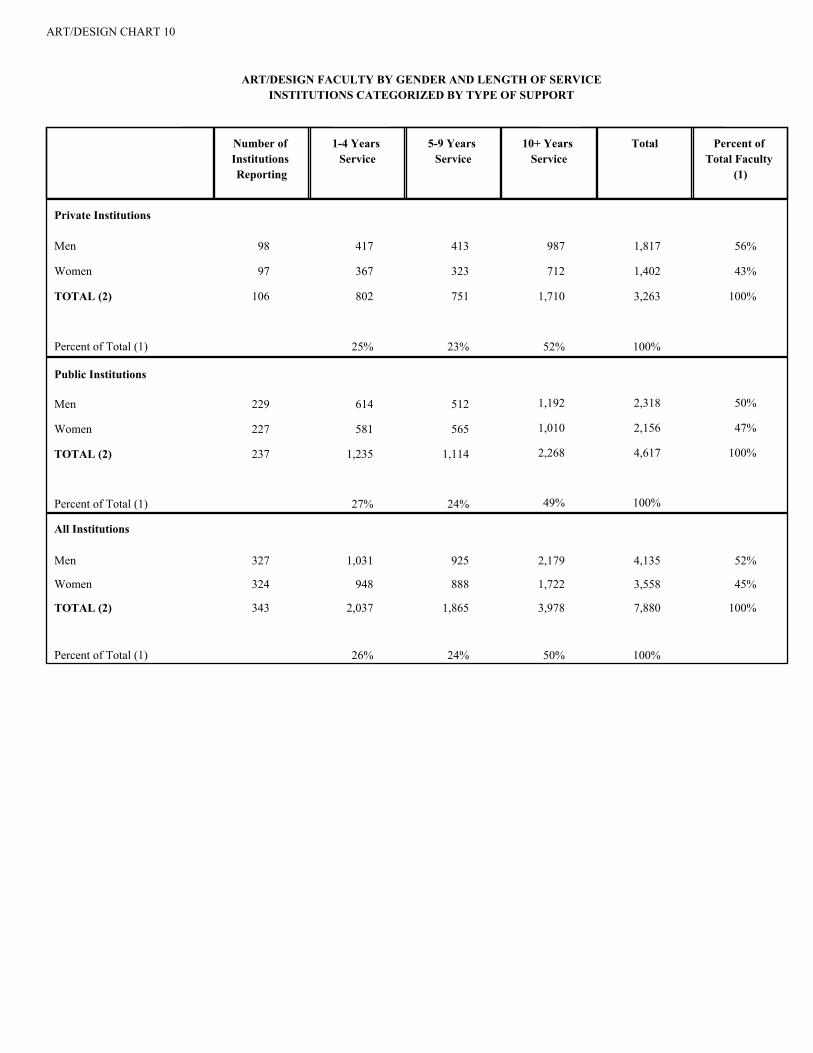
ART/DESIGN CHART 10
ART/DESIGN FACULTY BY GENDER AND LENGTH OF SERVICE
INSTITUTIONS CATEGORIZED BY TYPE OF SUPPORT
Number of
Institutions
Reporting
1-4 Years
Service
5-9 Years
Service
10+ Years
Service
Total Percent of
Total Faculty
(1)
Private Institutions
98Men 417 413 987 1,817 56%
97Women 367 323 712 1,402 43%
106TOTAL (2) 802 751 1,710 3,263 100%
Percent of Total (1) 25% 23% 52% 100%
Public Institutions
229Men 614 512 1,192 2,318 50%
227Women 581 565 1,010 2,156 47%
237TOTAL (2) 1,235 1,114 2,268 4,617 100%
Percent of Total (1) 27% 24% 49% 100%
All Institutions
327Men 1,031 925 2,179 4,135 52%
324Women 948 888 1,722 3,558 45%
343TOTAL (2) 2,037 1,865 3,978 7,880 100%
Percent of Total (1) 26% 24% 50% 100%
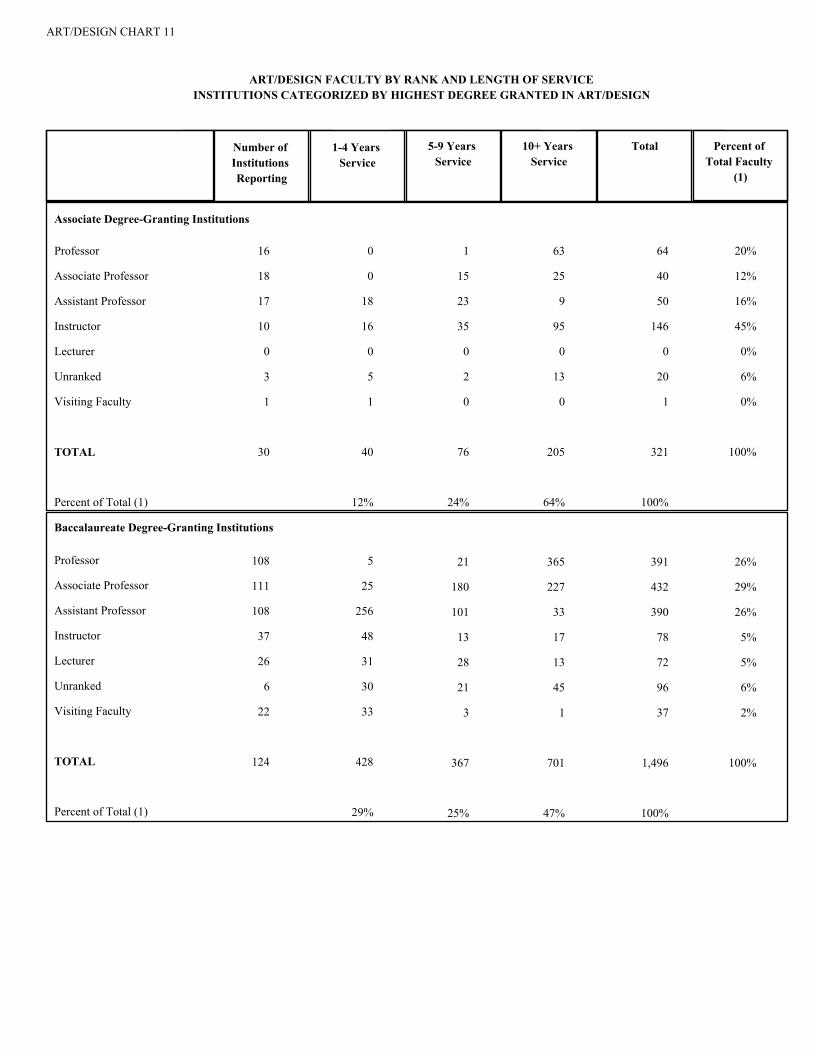
ART/DESIGN CHART 11
ART/DESIGN FACULTY BY RANK AND LENGTH OF SERVICE
INSTITUTIONS CATEGORIZED BY HIGHEST DEGREE GRANTED IN ART/DESIGN
Number of
Institutions
Reporting
1-4 Years
Service
5-9 Years
Service
10+ Years
Service
Total Percent of
Total Faculty
(1)
Associate Degree-Granting Institutions
16Professor 0 1 63 64 20%
18Associate Professor 0 15 25 40 12%
17Assistant Professor 18 23 9 50 16%
10Instructor 16 35 95 146 45%
0Lecturer 0 0 0 0 0%
3Unranked 5 2 13 20 6%
1Visiting Faculty 1 0 0 1 0%
30TOTAL 40 76 205 321 100%
Percent of Total (1) 12% 24% 64% 100%
Baccalaureate Degree-Granting Institutions
108Professor 5 21 365 391 26%
111Associate Professor 25 180 227 432 29%
108Assistant Professor 256 101 33 390 26%
37Instructor 48 13 17 78 5%
26Lecturer 31 28 13 72 5%
6Unranked 30 21 45 96 6%
22Visiting Faculty 33 3 1 37 2%
124TOTAL 428 367 701 1,496 100%
Percent of Total (1) 29% 25% 47% 100%

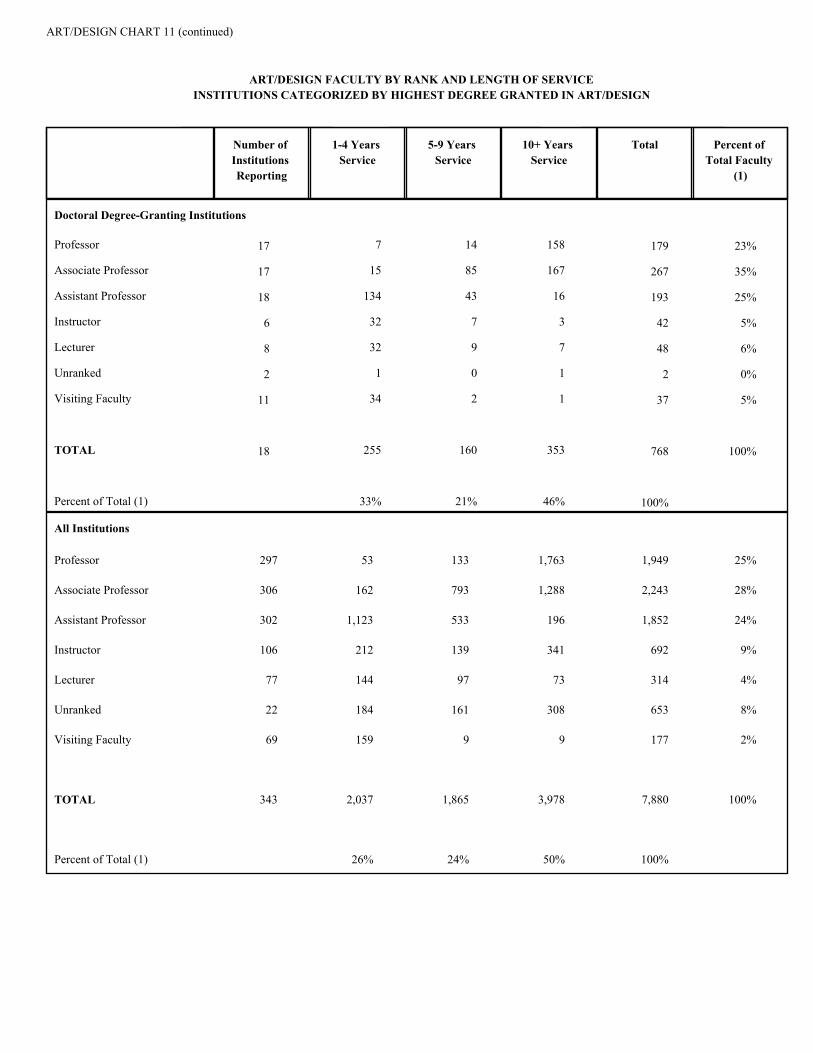
ART/DESIGN CHART 11 (continued)
ART/DESIGN FACULTY BY RANK AND LENGTH OF SERVICE
INSTITUTIONS CATEGORIZED BY HIGHEST DEGREE GRANTED IN ART/DESIGN
Number of
Institutions
Reporting
1-4 Years
Service
5-9 Years
Service
10+ Years
Service
Total Percent of
Total Faculty
(1)
Master's (Non-MFA) Degree-Granting Institutions
39Professor 4 13 177 194 28%
42Associate Professor 15 83 121 219 32%
41Assistant Professor 119 53 18 190 28%
7Instructor 12 19 16 47 7%
6Lecturer 6 5 2 13 2%
2Unranked 7 8 0 15 2%
6Visiting Faculty 9 1 0 10 1%
44TOTAL 172 182 334 688 100%
Percent of Total (1) 25% 26% 49% 100%
MFA Degree-Granting Institutions
117Professor 37 84 1,000 1,121 24%
118Associate Professor 107 430 748 1,285 28%
118Assistant Professor 596 313 120 1,029 22%
46Instructor 104 65 210 379 8%
37Lecturer 75 55 51 181 4%
9Unranked 141 130 249 520 11%
29Visiting Faculty 82 3 7 92 2%
127TOTAL 1,142 1,080 2,385 4,607 100%
Percent of Total (1) 25% 23% 52% 100%
ART/DESIGN CHART 11 (continued)
ART/DESIGN FACULTY BY RANK AND LENGTH OF SERVICE
INSTITUTIONS CATEGORIZED BY HIGHEST DEGREE GRANTED IN ART/DESIGN
Number of
Institutions
Reporting
1-4 Years
Service
5-9 Years
Service
10+ Years
Service
Total Percent of
Total Faculty
(1)
Doctoral Degree-Granting Institutions
17Professor 7 14 158 179 23%
17Associate Professor 15 85 167 267 35%
18Assistant Professor 134 43 16 193 25%
6Instructor 32 7 3 42 5%
8Lecturer 32 9 7 48 6%
2Unranked 1 0 1 2 0%
11Visiting Faculty 34 2 1 37 5%
18TOTAL 255 160 353 768 100%
Percent of Total (1) 33% 21% 46% 100%
All Institutions
297Professor 53 133 1,763 1,949 25%
306Associate Professor 162 793 1,288 2,243 28%
302Assistant Professor 1,123 533 196 1,852 24%
106Instructor 212 139 341 692 9%
77Lecturer 144 97 73 314 4%
22Unranked 184 161 308 653 8%
69Visiting Faculty 159 9 9 177 2%
343TOTAL 2,037 1,865 3,978 7,880 100%
Percent of Total (1) 26% 24% 50% 100%
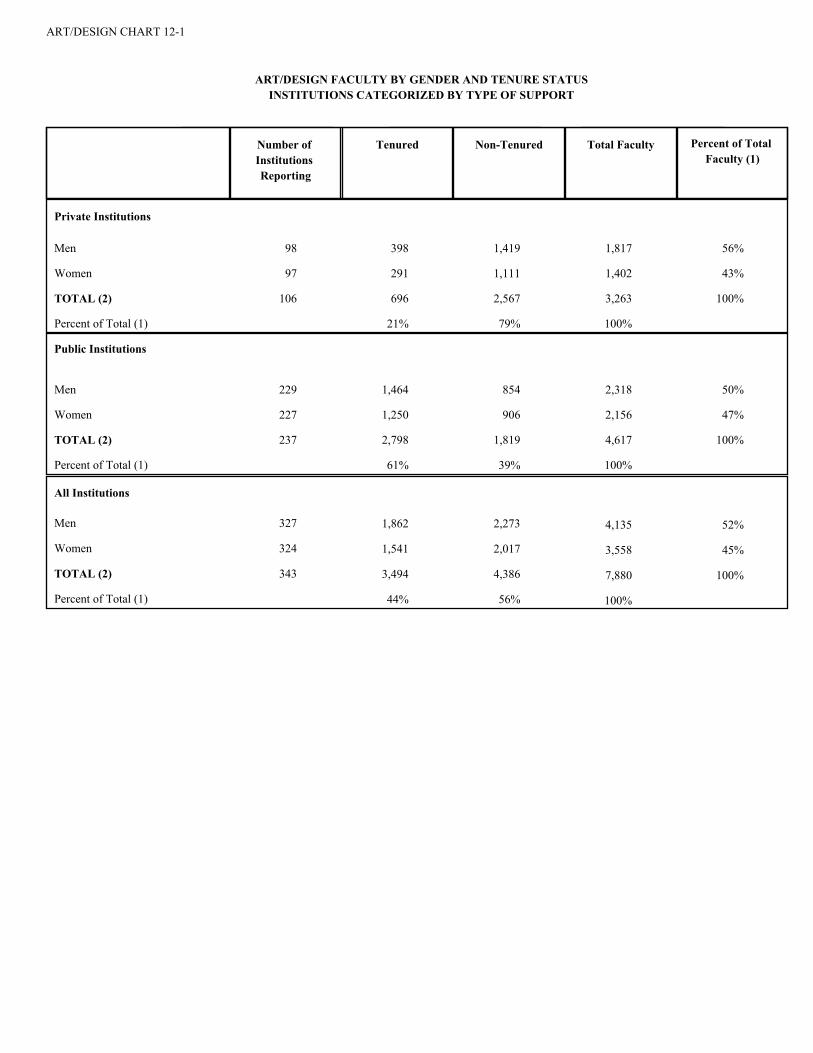
ART/DESIGN CHART 12-1
ART/DESIGN FACULTY BY GENDER AND TENURE STATUS
INSTITUTIONS CATEGORIZED BY TYPE OF SUPPORT
Number of
Institutions
Reporting
Tenured Non-Tenured Total Faculty Percent of Total
Faculty (1)
Private Institutions
98Men 398 1,419 1,817 56%
97Women 291 1,111 1,402 43%
106TOTAL (2) 696 2,567 3,263 100%
Percent of Total (1) 21% 79% 100%
Public Institutions
229Men 1,464 854 2,318 50%
227Women 1,250 906 2,156 47%
237TOTAL (2) 2,798 1,819 4,617 100%
Percent of Total (1) 61% 39% 100%
All Institutions
327Men 1,862 2,273 4,135 52%
324Women 1,541 2,017 3,558 45%
343TOTAL (2) 3,494 4,386 7,880 100%
Percent of Total (1) 44% 56% 100%

ART/DESIGN CHART 12-2
PERCENTAGE OF INSTITUTIONS WITHOUT THE TENURE SYSTEM
INSTITUTIONS CATEGORIZED BY SIZE AND TYPE OF INSTITUTION
Number of Institutions
Reporting
Number of Institutions
Non-Tenured
Percent of Institutions
Non-Tenured
Private Institutions
1-50 Art/Design Majors 11 1 9%
51-100 Art/Design Majors 8 1 13%
101-200 Art/Design Majors 26 10 38%
201+ Art/Design Majors 61 28 46%
Public Institutions
1-100 Art/Design Majors 32 2 6%
101-200 Art/Design Majors 55 5 9%
201-400 Art/Design Majors 71 1 1%
401+ Art/Design Majors 79 1 1%
All Institutions 343 49 14%

ART/DESIGN CHART 12-3
ART/DESIGN FACULTY AVERAGES
Number of
Institutions
Reporting
Avg.
Number of
Full-Time
Faculty
Avg.
Number of
Part-Time
Instructors
Avg. Total
FTE
Avg. Total
FTE
(Part-Time)
Percent of
Total FTE
(Part-Time)
Avg. Total
FTE
(Full-Time)
Percent of
Total FTE
(Full-Time)
Private Institutions
1.7 5.5 7 4 111-50 Art/Design Majors 22.6% 4.3 77.4%
4.6 9.9 9 6 851-100 Art/Design Majors 40.8% 5.9 59.2%
7.0 14.8 23 9 27101-200 Art/Design Majors 41.9% 9.0 58.1%
69.5 115.3 169 48 62201+ Art/Design Majors 58.3% 48.1 41.7%
Public Institutions
1.3 7.1 4 6 321-100 Art/Design Majors 13.8% 6.1 86.2%
4.4 14.6 12 10 55101-200 Art/Design Majors 28.5% 10.5 71.5%
8.1 24.2 19 16 71201-400 Art/Design Majors 32.0% 16.5 68.0%
20.9 54.0 61 34 79401+ Art Design Majors 37.2% 33.9 62.8%
21.1 42.4 54 23 345All Institutions 46.0% 23.0 54.0%
HIGHEST DEGREE OFFERED
12.1 22.4 30 11 30Associate 52.3% 10.7 47.7%
6.3 17.5 16 12 125Baccalaureate 31.5% 12.1 68.5%
10.7 25.6 28 16 44Master's (Non-MFA) 38.9% 15.6 61.1%
39.4 73.5 100 36 128MFA 50.7% 36.3 49.3%
27.9 70.6 88 43 18Doctorate 39.6% 42.7 60.4%

ART/DESIGN CHART 13
ART/DESIGN FACULTY BY GENDER AND TENURE STATUS
INSTITUTIONS CATEGORIZED BY HIGHEST DEGREE GRANTED IN ART/DESIGN
Number of
Institutions
Reporting
Tenured Non-Tenured Total Faculty Percent of Total
Faculty (1)
Associate Degree-Granting Institutions
27Men 55 83 138 43%
27Women 53 114 167 52%
30TOTAL (2) 117 204 321 100%
Percent of Total (1) 36% 64% 100%
Baccalaureate Degree-Granting Institutions
117Men 366 413 779 52%
115Women 329 348 677 45%
124TOTAL (2) 702 794 1,496 100%
Percent of Total (1) 47% 53% 100%
Master's (Non-MFA) Degree-Granting Institutions
42Men 200 151 351 51%
42Women 155 149 304 44%
44TOTAL (2) 380 308 688 100%
Percent of Total (1) 55% 45% 100%
MFA Degree-Granting Institutions
124Men 1,032 1,452 2,484 54%
124Women 828 1,247 2,075 45%
127TOTAL (2) 1,889 2,718 4,607 100%
Percent of Total (1) 41% 59% 100%
Doctoral Degree-Granting Institutions
17Men 209 174 383 50%
16Women 176 159 335 44%
18TOTAL (2) 406 362 768 100%
Percent of Total (1) 53% 47% 100%
All Institutions
52%4,1352,2731,862Men 327
45%3,5582,0171,541Women 324
100%7,8804,3863,494TOTAL (2) 343
100%56%44%Percent of Total (1)

Higher Education Arts Data Services DATA SUMMARIES
2014-2015
ART/DESIGN FACULTY SALARIES AND PART-TIME FACULTY DATA
Charts 14 through 19 provide data on salaries for faculty members, and more detailed information on part-time faculty members.
Charts 14 through 16 provide salary statistics for the 2014-2015 academic year by rank for male, female, and all full-time faculty members. The charts include lowest and highest individual salaries, as well as average institutional salaries and the various percentiles. Salaries are based on a nine-month academic year excluding benefits.
Example: Chart 14-2 – “Full-Time Faculty Salaries: Male - Public Institutions,” 101-200 Art/Design Majors. Forty-one institutions in this category reported male Associate Professors. Their average salary was $69,258. The lowest individual salary of any male Associate Professor of Art/Design in this category was $37,339 and the highest individual salary was $126,750. The other figures on this line represent percentile rankings of average salaries for male Associate Professors employed by institutions in this category.
Charts 17 through 19 provide data on part-time instruction at each school: average number of persons employed, average full-time equivalence (FTE), average part-time salaries, and average percentage of total instructional FTE (full- and part-time). There are sections for part-time faculty with faculty status (individuals who have rank and are considered faculty members by the institution), adjunct faculty and teaching associates (individuals without faculty rank who teach at the institution and who are not graduate students), and graduate teaching assistants and teaching associates (graduate students who teach courses at the institution). Chart 17 provides data for part-time male faculty, Chart 18 provides data for part-time female faculty, and Chart 19 covers all part-time faculty.
Example: Chart 19 – “Part-Time Instruction: All Part-Time Faculty,” Adjunct Faculty or Teaching Associates, Private Institutions, 101-200 Art/Design Majors.
At 25 institutions in this category with part-time adjunct faculty or teaching associates, the average number of persons was 20.72. The average combined part-time workload of all adjunct faculty or teaching associates at an institution was 6.04. The average salary expenditure per individual in this category was $7,942; and adjunct faculty or teaching associates on this line represented an average of 38% of the total instructional FTE.

ART/DESIGN CHART 14-1
FULL-TIME ART/DESIGN FACULTY SALARIES: MALE
PRIVATE INSTITUTIONS
Number of
Institutions
Reporting
Lowest
Individual
Salary
5th
Percentile
25th
Percentile
50th
Percentile
75th
Percentile
95th
Percentile
Highest
Individual
Salary
Average All
Institutions
1-50 Art/Design Majors
Professor 8 $ 37,000 $ 42,891 $ 56,227 $ 80,300 $ 81,599 $ 99,021 $ 106,029 $ 72,051
Associate Professor 6 45,630 49,778 61,000 61,000 61,656 70,533 73,229 60,851
Assistant Professor **Too Few Data Points to Display**Instructor
Lecturer 0 0 0 0 0 0 0 0 0
Unranked 0 0 0 0 0 0 0 0 0
Visiting Faculty **Too Few Data Points to Display**
51-100 Art/Design Majors
Professor 8 $ 62,409 $ 65,415 $ 77,742 $ 89,667 $ 102,013 $ 118,907 $ 126,193 $ 91,720
Associate Professor 3 70,489 70,517 77,244 97,179 97,179 97,179 106,077 88,301
Assistant Professor 5 48,973 50,444 52,651 60,952 60,952 64,083 68,743 57,815
Instructor 0 0 0 0 0 0 0 0 0
Lecturer 0 0 0 0 0 0 0 0 0
Unranked 0 0 0 0 0 0 0 0 0
Visiting Faculty **Too Few Data Points to Display**
101-200 Art/Design Majors
Professor 17 $ 53,061 $ 55,866 $ 68,484 $ 80,150 $ 93,053 $ 108,541 $ 116,306 $ 80,805
Associate Professor 17 37,160 48,835 60,796 68,465 76,451 81,261 88,000 68,336
Assistant Professor 18 38,500 47,500 52,950 55,000 62,087 64,956 71,172 56,562
Instructor 4 49,000 50,350 52,006 52,341 52,341 57,319 60,000 52,838
Lecturer
Unranked **Too Few Data Points to Display**Visiting Faculty
201+ Art/Design Majors
Professor 46 $ 32,000 $ 61,675 $ 71,307 $ 89,885 $ 108,612 $ 118,075 $ 277,496 $ 91,316
Associate Professor 51 30,000 49,024 62,713 76,364 86,021 97,949 173,400 74,767
Assistant Professor 44 31,470 42,555 53,180 66,284 73,412 77,795 100,323 63,424
Instructor 11 20,802 40,504 40,504 40,504 46,428 77,863 135,063 48,821
Lecturer 7 30,000 41,379 41,647 61,571 64,435 64,435 79,616 55,600
Unranked 9 27,249 65,391 75,698 83,760 83,760 83,760 265,000 78,986
Visiting Faculty 12 22,500 34,313 42,000 45,455 50,500 91,667 150,000 50,059
All Private Institutions
Professor 79 $ 32,000 $ 58,230 $ 70,531 $ 89,667 $ 108,405 $ 118,075 $ 277,496 $ 90,080
Associate Professor 77 30,000 49,024 61,810 73,692 85,277 97,949 173,400 73,985
Assistant Professor 69 31,470 42,567 53,015 64,872 73,412 77,795 100,323 62,374
Instructor 16 20,802 40,504 40,504 40,504 48,649 77,863 135,063 48,985
Lecturer 9 28,000 39,103 41,647 61,571 64,435 64,435 79,616 53,897
Unranked 11 27,249 65,391 75,698 83,760 83,760 83,760 265,000 78,856
Visiting Faculty 15 22,500 36,463 44,591 45,455 52,634 91,667 150,000 50,280

ART/DESIGN CHART 14-2
FULL-TIME ART/DESIGN FACULTY SALARIES: MALE
PUBLIC INSTITUTIONS
Number of
Institutions
Reporting
Lowest
Individual
Salary
5th
Percentile
25th
Percentile
50th
Percentile
75th
Percentile
95th
Percentile
Highest
Individual
Salary
Average All
Institutions
1-100 Art/Design Majors
Professor 15 $ 56,631 $ 58,019 $ 69,394 $ 72,724 $ 76,807 $ 89,628 $ 104,287 $ 73,953
Associate Professor 20 42,239 46,086 52,531 62,411 67,319 83,887 92,339 61,096
Assistant Professor 18 33,000 38,744 44,500 53,584 60,000 72,878 80,157 52,772
Instructor 7 39,000 40,577 42,255 46,334 46,334 55,375 59,750 45,696
Lecturer 4 25,000 27,292 32,640 36,954 36,954 42,306 44,600 35,106
Unranked **Too Few Data Points to Display**Visiting Faculty
101-200 Art/Design Majors
Professor 43 $ 43,200 $ 67,915 $ 72,185 $ 83,705 $ 89,886 $ 130,650 $ 178,500 $ 86,482
Associate Professor 41 37,339 48,404 54,200 67,147 87,110 94,538 126,750 69,258
Assistant Professor 40 30,000 41,085 49,500 52,400 61,613 73,667 83,829 56,262
Instructor 10 24,000 29,298 33,891 35,000 46,260 58,822 70,554 40,140
Lecturer 8 36,875 37,868 42,000 42,752 45,513 56,352 64,000 44,615
Unranked **Too Few Data Points to Display**Visiting Faculty 8 40,000 41,200 46,548 50,000 58,000 61,595 63,000 51,115
201-400 Art/Design Majors
Professor 56 $ 39,533 $ 67,247 $ 74,045 $ 81,158 $ 90,000 $ 114,464 $ 208,973 $ 84,385
Associate Professor 63 47,800 54,450 59,563 63,565 67,026 84,712 100,899 65,156
Assistant Professor 63 37,118 47,098 51,333 53,859 58,856 66,512 88,508 55,037
Instructor 21 20,800 21,281 38,370 40,956 48,497 57,823 69,535 42,082
Lecturer 14 21,000 27,268 42,744 42,866 44,231 45,864 65,789 42,013
Unranked 3 43,756 43,756 43,756 43,756 44,089 46,653 70,240 44,449
Visiting Faculty 10 32,000 36,400 42,000 42,756 44,791 46,350 52,000 42,622
401+ Art/Design Majors
Professor 75 $ 45,462 $ 69,847 $ 80,167 $ 89,917 $ 96,671 $ 119,614 $ 169,047 $ 90,899
Associate Professor 76 48,044 56,470 65,985 71,345 79,762 90,845 164,625 73,117
Assistant Professor 73 29,453 49,750 56,000 60,000 65,289 83,388 91,080 61,794
Instructor 21 30,000 35,092 35,828 39,731 48,457 60,732 75,110 42,495
Lecturer 24 27,000 40,360 44,548 48,167 54,165 64,714 71,964 49,329
Unranked **Too Few Data Points to Display**Visiting Faculty 17 20,311 34,850 40,000 44,700 53,333 60,332 85,400 46,558
All Public Institutions
Professor 189 $ 39,533 $ 67,247 $ 77,701 $ 86,070 $ 93,864 $ 120,576 $ 208,973 $ 88,211
Associate Professor 200 37,339 53,291 61,715 68,750 77,544 94,126 164,625 70,217
Assistant Professor 194 29,453 46,465 52,400 57,878 63,040 83,388 91,080 58,910
Instructor 59 20,800 33,188 35,828 41,245 48,436 57,903 75,110 42,490
Lecturer 50 21,000 31,230 41,737 44,548 50,039 64,179 71,964 45,591
Unranked 8 42,261 42,261 43,756 46,163 50,604 63,227 71,181 49,057
Visiting Faculty 36 20,311 35,000 40,000 44,861 52,500 62,852 85,400 46,755

ART/DESIGN CHART 15-1
FULL-TIME ART/DESIGN FACULTY SALARIES: FEMALE
PRIVATE INSTITUTIONS
Number of
Institutions
Reporting
Lowest
Individual
Salary
5th
Percentile
25th
Percentile
50th
Percentile
75th
Percentile
95th
Percentile
Highest
Individual
Salary
Average All
Institutions
1-50 Art/Design Majors
Professor 5 $ 55,500 $ 60,000 $ 68,000 $ 85,000 $ 86,046 $ 100,034 $ 106,029 $ 79,874
Associate Professor 5 38,154 43,700 59,227 63,033 65,110 65,150 72,530 59,323
Assistant Professor 5 43,696 46,073 51,643 58,941 59,800 61,926 63,070 55,775
Instructor 0 0 0 0 0 0 0 0 0
Lecturer 0 0 0 0 0 0 0 0 0
Unranked **Too Few Data Points to Display**Visiting Faculty 0 0 0 0 0 0 0 0 0
51-100 Art/Design Majors
Professor **Too Few Data Points to Display**Associate Professor
Assistant Professor 5 41,000 42,314 42,314 45,772 59,195 68,855 75,295 51,880
Instructor 0 0 0 0 0 0 0 0 0
Lecturer **Too Few Data Points to Display**Unranked 0 0 0 0 0 0 0 0 0
Visiting Faculty 0 0 0 0 0 0 0 0 0
101-200 Art/Design Majors
Professor 8 $ 53,061 $ 53,061 $ 53,061 $ 62,964 $ 92,870 $ 105,771 $ 107,570 $ 72,169
Associate Professor 13 49,834 53,962 56,899 62,670 69,717 79,413 107,162 64,299
Assistant Professor 11 44,880 46,109 50,891 53,523 57,026 59,606 75,000 53,720
Instructor 4 38,100 40,757 51,384 51,384 56,908 57,097 57,144 50,984
Lecturer
Unranked **Too Few Data Points to Display**Visiting Faculty
201+ Art/Design Majors
Professor 41 $ 30,000 $ 58,153 $ 67,743 $ 87,863 $ 98,269 $ 111,068 $ 206,101 $ 86,294
Associate Professor 43 36,050 53,245 63,686 76,884 82,736 92,924 131,125 74,015
Assistant Professor 41 32,000 42,829 50,867 63,638 71,296 74,616 100,000 61,442
Instructor 14 20,802 34,522 34,522 46,428 46,428 87,296 135,063 45,718
Lecturer 9 35,000 35,000 51,860 53,958 61,259 63,826 73,485 53,815
Unranked 8 39,821 64,974 73,351 77,620 77,620 81,231 225,000 75,660
Visiting Faculty 7 35,000 44,985 46,203 46,302 64,966 64,966 84,795 52,237
All Private Institutions
Professor 56 $ 30,000 $ 57,759 $ 67,728 $ 84,973 $ 95,961 $ 111,068 $ 206,101 $ 85,281
Associate Professor 63 36,050 53,245 62,670 75,154 81,767 92,924 131,125 72,846
Assistant Professor 62 32,000 42,829 50,867 59,598 70,259 74,616 100,000 60,424
Instructor 18 20,802 34,522 34,522 46,428 46,428 87,296 135,063 45,853
Lecturer 11 35,000 41,660 46,100 51,860 55,708 62,286 73,485 51,300
Unranked 11 38,000 64,974 73,351 77,620 81,231 81,231 225,000 76,115
Visiting Faculty 9 35,000 45,511 46,302 46,302 64,474 64,966 84,795 52,486

ART/DESIGN CHART 15-2
FULL-TIME ART/DESIGN FACULTY SALARIES: FEMALE
PUBLIC INSTITUTIONS
Number of
Institutions
Reporting
Lowest
Individual
Salary
5th
Percentile
25th
Percentile
50th
Percentile
75th
Percentile
95th
Percentile
Highest
Individual
Salary
Average All
Institutions
1-100 Art/Design Majors
Professor 10 $ 53,510 $ 55,998 $ 72,550 $ 76,103 $ 86,744 $ 100,065 $ 112,239 $ 78,139
Associate Professor 18 44,000 46,157 53,391 62,111 66,342 79,766 92,792 61,544
Assistant Professor 17 33,000 38,900 45,866 48,540 54,331 60,683 64,299 50,105
Instructor 7 33,000 34,500 39,648 46,610 60,580 60,580 70,900 49,007
Lecturer 3 26,865 31,588 31,588 31,682 42,812 46,491 46,799 36,587
Unranked **Too Few Data Points to Display**Visiting Faculty 0 0 0 0 0 0 0 0 0
101-200 Art/Design Majors
Professor 35 $ 38,796 $ 58,772 $ 68,526 $ 78,207 $ 95,642 $ 118,650 $ 143,371 $ 82,869
Associate Professor 42 42,990 50,492 55,686 61,251 81,368 92,042 101,906 66,254
Assistant Professor 38 36,597 41,700 48,246 53,541 60,510 68,919 75,264 54,330
Instructor 10 33,000 34,465 40,000 43,500 45,267 63,834 64,575 44,483
Lecturer 3 28,000 41,236 41,236 43,866 43,866 46,966 59,732 43,589
Unranked 0 0 0 0 0 0 0 0 0
Visiting Faculty 5 30,000 34,000 50,000 52,000 56,783 57,037 57,100 49,177
201-400 Art/Design Majors
Professor 59 $ 50,234 $ 66,423 $ 71,472 $ 79,789 $ 86,127 $ 97,121 $ 154,126 $ 80,207
Associate Professor 59 49,480 56,287 59,680 63,729 66,949 81,852 106,860 64,868
Assistant Professor 59 40,500 47,204 50,490 53,955 56,988 63,640 82,387 54,295
Instructor 14 32,000 33,986 37,850 40,089 44,000 51,228 55,356 41,491
Lecturer 14 22,248 37,562 43,151 45,733 47,950 51,429 52,695 44,609
Unranked **Too Few Data Points to Display**Visiting Faculty 7 32,000 33,800 41,000 50,000 50,637 64,382 70,000 47,896
401+ Art/Design Majors
Professor 69 $ 54,588 $ 71,025 $ 80,387 $ 88,974 $ 100,939 $ 119,498 $ 140,695 $ 90,875
Associate Professor 73 33,760 55,418 62,965 71,292 76,900 91,146 121,764 71,263
Assistant Professor 69 45,076 48,786 54,600 58,629 65,687 82,820 100,935 61,055
Instructor 23 20,458 33,416 40,026 45,320 46,610 53,018 64,103 43,557
Lecturer 22 27,000 31,950 43,333 45,260 50,770 56,268 102,000 46,565
Unranked **Too Few Data Points to Display**Visiting Faculty 19 26,250 32,083 41,667 47,750 55,240 60,000 152,311 49,952
All Public Institutions
Professor 173 $ 38,796 $ 66,567 $ 75,506 $ 84,992 $ 93,940 $ 118,967 $ 154,126 $ 86,693
Associate Professor 192 33,760 53,923 61,162 66,750 74,951 91,146 121,764 68,651
Assistant Professor 183 33,000 47,204 51,767 56,697 62,211 82,820 100,935 57,961
Instructor 54 20,458 33,440 38,253 43,500 48,498 60,580 70,900 43,871
Lecturer 42 22,248 31,588 43,085 45,260 48,872 56,268 102,000 45,624
Unranked 5 39,303 42,759 43,756 43,756 70,395 70,461 80,241 53,750
Visiting Faculty 31 26,250 32,083 41,667 49,000 55,240 60,000 152,311 49,587

ART/DESIGN CHART 16-1
FULL-TIME ART/DESIGN FACULTY SALARIES: ALL FACULTY
PRIVATE INSTITUTIONS
Number of
Institutions
Reporting
Lowest
Individual
Salary
5th
Percentile
25th
Percentile
50th
Percentile
75th
Percentile
95th
Percentile
Highest
Individual
Salary
Average All
Institutions
1-50 Art/Design Majors
Professor 11 $ 37,000 $ 47,472 $ 60,000 $ 81,599 $ 85,000 $ 106,029 $ 106,029 $ 75,272
Associate Professor 8 38,154 41,892 60,970 62,660 63,615 65,375 73,229 60,132
Assistant Professor 7 43,696 46,073 48,181 56,220 59,585 61,599 63,070 54,577
Instructor **Too Few Data Points to Display**Lecturer 0 0 0 0 0 0 0 0 0
Unranked **Too Few Data Points to Display**Visiting Faculty
51-100 Art/Design Majors
Professor 8 $ 62,409 $ 66,235 $ 72,809 $ 89,667 $ 98,612 $ 118,907 $ 126,193 $ 88,794
Associate Professor 3 64,310 70,992 71,385 96,331 96,331 96,331 106,077 87,188
Assistant Professor 7 41,000 43,979 48,862 55,923 59,402 65,764 75,295 54,848
Instructor 0 0 0 0 0 0 0 0 0
Lecturer **Too Few Data Points to Display**Unranked 0 0 0 0 0 0 0 0 0
Visiting Faculty **Too Few Data Points to Display**
101-200 Art/Design Majors
Professor 19 $ 53,061 $ 53,061 $ 65,973 $ 75,700 $ 92,946 $ 107,433 $ 116,306 $ 78,067
Associate Professor 20 37,160 51,718 59,491 65,535 74,612 80,863 107,162 66,524
Assistant Professor 20 38,500 48,740 51,500 54,410 60,798 64,956 75,000 55,537
Instructor 7 38,100 45,240 51,384 53,103 53,103 58,286 60,000 52,125
Lecturer **Too Few Data Points to Display**Unranked
Visiting Faculty 3 52,000 52,184 52,921 53,841 54,971 55,874 56,100 53,980
201+ Art/Design Majors
Professor 48 $ 30,000 $ 59,586 $ 70,769 $ 89,592 $ 102,300 $ 115,009 $ 277,496 $ 89,289
Associate Professor 51 30,000 52,245 63,113 78,518 83,719 96,016 173,400 74,425
Assistant Professor 48 31,470 42,750 53,139 63,831 74,057 76,479 100,323 62,474
Instructor 15 20,802 38,568 38,568 42,385 46,428 80,173 135,063 47,492
Lecturer 10 30,000 39,985 48,217 61,460 61,940 64,342 79,616 54,906
Unranked 9 27,249 67,148 74,627 80,216 81,379 81,379 265,000 77,646
Visiting Faculty 13 22,500 36,000 43,404 50,000 52,341 71,667 150,000 50,837
All Private Institutions
Professor 86 $ 30,000 $ 57,910 $ 69,009 $ 86,178 $ 102,300 $ 115,009 $ 277,496 $ 88,192
Associate Professor 82 30,000 51,718 63,113 74,489 83,102 96,016 173,400 73,468
Assistant Professor 82 31,470 42,750 51,882 63,814 72,440 75,904 100,323 61,451
Instructor 23 20,802 38,568 38,568 45,700 46,428 80,173 135,063 47,650
Lecturer 13 28,000 39,985 45,606 49,000 61,460 64,342 79,616 52,673
Unranked 12 27,249 67,148 74,627 80,216 81,379 81,379 265,000 77,740
Visiting Faculty 18 22,500 36,304 46,346 52,000 52,341 65,000 150,000 51,063

ART/DESIGN CHART 16-2
FULL-TIME ART/DESIGN FACULTY SALARIES: ALL FACULTY
PUBLIC INSTITUTIONS
Number of
Institutions
Reporting
Lowest
Individual
Salary
5th
Percentile
25th
Percentile
50th
Percentile
75th
Percentile
95th
Percentile
Highest
Individual
Salary
Average All
Institutions
1-100 Art/Design Majors
Professor 18 $ 53,510 $ 57,237 $ 71,601 $ 73,406 $ 78,036 $ 101,472 $ 112,239 $ 75,349
Associate Professor 25 42,239 46,535 51,463 62,329 66,342 83,395 92,792 61,290
Assistant Professor 23 33,000 39,308 46,001 48,343 58,562 70,734 80,157 51,346
Instructor 10 33,000 37,411 40,498 46,334 59,093 59,093 70,900 47,153
Lecturer 6 25,000 29,065 32,640 34,271 34,271 46,491 46,799 35,789
Unranked **Too Few Data Points to Display**Visiting Faculty
101-200 Art/Design Majors
Professor 49 $ 38,796 $ 63,252 $ 71,720 $ 78,376 $ 92,319 $ 123,110 $ 178,500 $ 85,081
Associate Professor 52 37,339 51,090 56,899 64,047 79,501 94,538 126,750 68,009
Assistant Professor 49 30,000 43,081 48,674 53,666 60,897 72,553 83,829 55,430
Instructor 15 24,000 33,107 34,833 41,316 46,452 63,834 70,554 42,601
Lecturer 9 28,000 38,420 41,618 43,504 44,754 52,103 64,000 44,273
Unranked **Too Few Data Points to Display**Visiting Faculty 10 30,000 36,500 47,411 50,000 57,550 59,838 63,000 50,423
201-400 Art/Design Majors
Professor 66 $ 39,533 $ 67,067 $ 74,741 $ 79,596 $ 87,960 $ 114,179 $ 208,973 $ 82,411
Associate Professor 68 47,800 54,345 60,004 63,390 66,857 84,569 106,860 65,011
Assistant Professor 69 37,118 46,631 50,977 53,772 58,026 64,552 88,508 54,679
Instructor 27 20,800 21,281 36,567 40,667 47,471 55,549 69,535 41,864
Lecturer 19 21,000 35,200 42,856 43,494 46,034 51,429 65,789 43,395
Unranked 3 43,756 43,756 43,756 43,756 43,756 45,999 70,240 44,172
Visiting Faculty 15 32,000 32,000 42,256 44,722 49,000 56,000 70,000 44,565
401+ Art/Design Majors
Professor 77 $ 45,462 $ 70,028 $ 79,742 $ 89,571 $ 95,464 $ 118,687 $ 169,047 $ 90,889
Associate Professor 78 33,760 57,200 64,572 71,616 78,591 92,407 164,625 72,245
Assistant Professor 78 29,453 49,483 55,376 58,789 65,398 83,081 100,935 61,435
Instructor 31 20,458 33,900 38,578 41,465 47,945 56,184 75,110 42,973
Lecturer 30 27,000 36,369 43,670 46,090 52,340 60,953 102,000 47,462
Unranked 4 42,261 42,261 42,261 49,000 50,000 66,263 70,329 50,770
Visiting Faculty 24 20,311 33,250 40,417 47,250 54,658 60,047 152,311 48,211
All Public Institutions
Professor 210 $ 38,796 $ 67,649 $ 77,064 $ 87,208 $ 92,741 $ 118,687 $ 208,973 $ 87,555
Associate Professor 223 33,760 54,305 61,682 68,079 76,438 92,407 164,625 69,479
Assistant Professor 219 29,453 46,182 52,719 57,558 62,517 83,081 100,935 58,454
Instructor 83 20,458 33,416 38,578 41,465 47,775 58,468 75,110 43,103
Lecturer 64 21,000 31,905 42,856 45,323 49,856 55,792 102,000 45,611
Unranked 10 39,303 42,859 43,756 47,989 50,000 66,844 80,241 50,837
Visiting Faculty 50 20,311 33,250 41,667 47,250 54,658 60,047 152,311 48,019

ART/DESIGN CHART 17
PART-TIME ART/DESIGN INSTRUCTION: MALE
Number of
Institutions
Reporting
Average
Number of
Persons
Average Total
FTE
Average
Part-Time
Salaries
Average
Percentage of
Total
Instructional
FTE
WITH FACULTY STATUS
Private Institutions
1-50 Art/Design Majors **Too Few Data Points to Display**
51-100 Art/Design Majors
101-200 Art/Design Majors 4 6.50 3.17 14,303 15%
201+ Art/Design Majors 29 71.52 29.14 14,586 14%
Public Institutions
1-100 Art/Design Majors **Too Few Data Points to Display**
101-200 Art/Design Majors 9 2.44 1.48 27,452 9%
201-400 Art/Design Majors 16 3.31 1.48 37,204 6%
401+ Art/Design Majors 25 12.28 3.77 15,130 6%
All Institutions 87 28.59 11.19 $ 15,322 10%
ADJUNCT FACULTY OR TEACHING ASSOCIATES
Private Institutions
1-50 Art/Design Majors 6 1.33 0.65 $ 6,650 9%
51-100 Art/Design Majors 5 3.00 1.20 5,505 13%
101-200 Art/Design Majors 20 9.85 2.82 7,060 17%
201+ Art/Design Majors 46 59.85 25.61 11,928 21%
Public Institutions
1-100 Art/Design Majors 24 2.33 0.67 $ 7,744 11%
101-200 Art/Design Majors 39 5.59 2.12 10,586 15%
201-400 Art/Design Majors 57 5.86 2.67 9,901 12%
401+ Art/Design Majors 60 19.03 7.70 10,039 13%
All Institutions 257 18.38 7.57 $ 10,984 14%

ART/DESIGN CHART 17 (continued)
PART-TIME ART/DESIGN INSTRUCTION: MALE
Number of
Institutions
Reporting
Average
Number of
Persons
Average Total
FTE
Average
Part-Time
Salaries
Average
Percentage of
Total
Instructional
FTE
GRADUATE TEACHING ASSISTANTS/ASSOCIATES
Private Institutions
1-50 Art/Design Majors 0 0.00 0.00 $ 0 0%
51-100 Art/Design Majors 0 0.00 0.00 0 0%
101-200 Art/Design Majors **Too Few Data Points to Display**
201+ Art/Design Majors 10 19.20 5.58 5,392 3%
Public Institutions
1-100 Art/Design Majors 0 0.00 0.00 $ 0 0%
101-200 Art/Design Majors 8 3.00 0.73 6,995 5%
201-400 Art/Design Majors 23 5.74 2.22 7,820 7%
401+ Art/Design Majors 39 8.67 2.88 8,384 5%
All Institutions 81 8.48 2.79 $ 7,396 5%
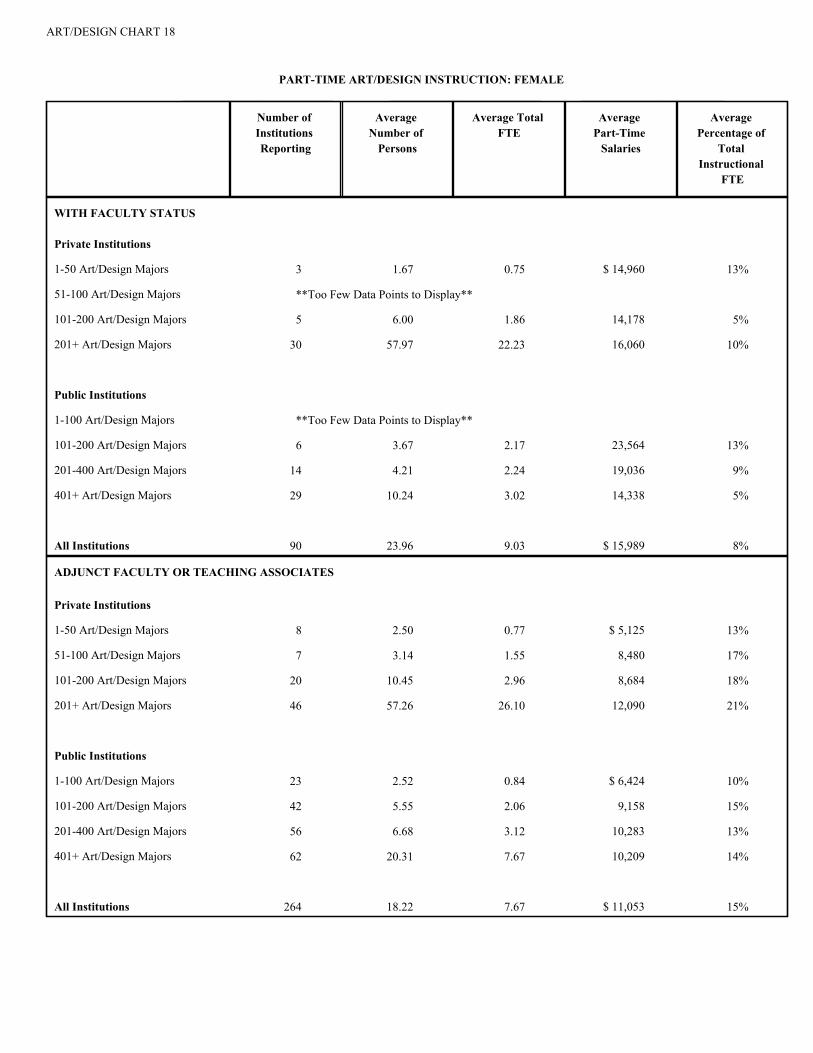
ART/DESIGN CHART 18
PART-TIME ART/DESIGN INSTRUCTION: FEMALE
Number of
Institutions
Reporting
Average
Number of
Persons
Average Total
FTE
Average
Part-Time
Salaries
Average
Percentage of
Total
Instructional
FTE
WITH FACULTY STATUS
Private Institutions
1-50 Art/Design Majors 3 1.67 0.75 $ 14,960 13%
51-100 Art/Design Majors **Too Few Data Points to Display**
101-200 Art/Design Majors 5 6.00 1.86 14,178 5%
201+ Art/Design Majors 30 57.97 22.23 16,060 10%
Public Institutions
1-100 Art/Design Majors **Too Few Data Points to Display**
101-200 Art/Design Majors 6 3.67 2.17 23,564 13%
201-400 Art/Design Majors 14 4.21 2.24 19,036 9%
401+ Art/Design Majors 29 10.24 3.02 14,338 5%
All Institutions 90 23.96 9.03 $ 15,989 8%
ADJUNCT FACULTY OR TEACHING ASSOCIATES
Private Institutions
1-50 Art/Design Majors 8 2.50 0.77 $ 5,125 13%
51-100 Art/Design Majors 7 3.14 1.55 8,480 17%
101-200 Art/Design Majors 20 10.45 2.96 8,684 18%
201+ Art/Design Majors 46 57.26 26.10 12,090 21%
Public Institutions
1-100 Art/Design Majors 23 2.52 0.84 $ 6,424 10%
101-200 Art/Design Majors 42 5.55 2.06 9,158 15%
201-400 Art/Design Majors 56 6.68 3.12 10,283 13%
401+ Art/Design Majors 62 20.31 7.67 10,209 14%
All Institutions 264 18.22 7.67 $ 11,053 15%

ART/DESIGN CHART 18 (continued)
PART-TIME ART/DESIGN INSTRUCTION: FEMALE
Number of
Institutions
Reporting
Average
Number of
Persons
Average Total
FTE
Average
Part-Time
Salaries
Average
Percentage of
Total
Instructional
FTE
GRADUATE TEACHING ASSISTANTS/ASSOCIATES
Private Institutions
1-50 Art/Design Majors 0 0.00 0.00 $ 0 0%
51-100 Art/Design Majors 0 0.00 0.00 0 0%
101-200 Art/Design Majors 3 2.00 0.30 6,429 1%
201+ Art/Design Majors 11 25.09 8.09 5,123 5%
Public Institutions
1-100 Art/Design Majors **Too Few Data Points to Display**
101-200 Art/Design Majors 9 3.67 0.88 5,220 5%
201-400 Art/Design Majors 24 7.17 3.17 7,083 9%
401+ Art/Design Majors 41 13.59 4.48 7,463 7%
All Institutions 89 11.76 4.12 $ 6,715 7%

ART/DESIGN CHART 19
PART-TIME ART/DESIGN INSTRUCTION: ALL PART-TIME FACULTY
Number of
Institutions
Reporting
Average
Number of
Persons
Average Total
FTE
Average
Part-Time
Salaries
Average
Percentage of
Total
Instructional
FTE
WITH FACULTY STATUS
Private Institutions
1-50 Art/Design Majors 4 2.00 1.23 $ 27,055 19%
51-100 Art/Design Majors **Too Few Data Points to Display**
101-200 Art/Design Majors 6 9.50 3.96 15,127 15%
201+ Art/Design Majors 38 101.32 40.26 15,291 21%
Public Institutions
1-100 Art/Design Majors 3 1.00 0.47 $ 23,866 5%
101-200 Art/Design Majors 12 3.67 2.20 25,508 14%
201-400 Art/Design Majors 20 5.70 2.87 27,729 12%
401+ Art/Design Majors 36 17.72 5.74 15,771 9%
All Institutions 121 39.23 15.62 $ 15,807 15%
ADJUNCT FACULTY OR TEACHING ASSOCIATES
Private Institutions
1-50 Art/Design Majors 9 5.89 1.26 $ 5,265 20%
51-100 Art/Design Majors 7 5.29 2.55 7,274 28%
101-200 Art/Design Majors 25 20.72 6.04 7,942 38%
201+ Art/Design Majors 53 116.42 50.24 12,153 41%
Public Institutions
1-100 Art/Design Majors 28 4.07 1.26 $ 7,072 18%
101-200 Art/Design Majors 47 10.98 4.17 9,584 29%
201-400 Art/Design Majors 64 13.06 5.83 9,859 25%
401+ Art/Design Majors 72 41.14 14.99 10,197 27%
All Institutions 305 36.74 14.79 $ 11,051 29%

ART/DESIGN CHART 19 (continued)
PART-TIME ART/DESIGN INSTRUCTION: ALL PART-TIME FACULTY
Number of
Institutions
Reporting
Average
Number of
Persons
Average Total
FTE
Average
Part-Time
Salaries
Average
Percentage of
Total
Instructional
FTE
GRADUATE TEACHING ASSISTANTS/ASSOCIATES
Private Institutions
1-50 Art/Design Majors 0 0.00 0.00 $ 0 0%
51-100 Art/Design Majors 0 0.00 0.00 0 0%
101-200 Art/Design Majors 3 2.33 0.55 7,225 2%
201+ Art/Design Majors 13 37.15 11.39 5,177 8%
Public Institutions
1-100 Art/Design Majors **Too Few Data Points to Display**
101-200 Art/Design Majors 10 6.30 1.57 6,446 9%
201-400 Art/Design Majors 28 11.68 4.79 7,018 15%
401+ Art/Design Majors 45 26.36 8.34 8,059 12%
All Institutions 100 20.69 6.88 $ 7,172 12%

Higher Education Arts Data Services DATA SUMMARIES
2014-2015
ART/DESIGN ADMINISTRATION
Charts 20 and 21 provide information on salaries for art/design executives and assistant/associate art/design executives for the 2014-2015 academic year. There are separate charts for salaries based on nine/ten months (Chart 20) and eleven/twelve months (Chart 21). The charts reflect gross annual salary excluding benefits.
Example: Chart 21 – “Art/Design Executives’ Salaries Based on Eleven or Twelve Months,” Public Institutions, 401+ Art/Design Majors.
Sixty institutions reported art/design executive salaries in this category. The average salary was $125,732. The percentiles range from $79,732 to $216,300.
Chart 22 describes the appointment process for art/design executives.
Example: Chart 22 – “Art/Design Executives’ Appointment Process,” Public Institutions, 201-400 Art/Design Majors. Of the 71 institutions in this category, 52% of executives are appointed by administration; 54% are elected by faculty; and 86% are subject to formal review on an average of every 2 years.
Chart 23 analyzes the average amount of time spent on specific responsibilities by art/design executives and assistant or associate art/design executives.
Example: Chart 23 – “Executives’ Job Analysis: Average Percentage of Time Spent,” Private Institutions, 201+ Art/Design Majors.
Art/design executives at 62 institutions in this category spend an average of 10% of time teaching, 8% on research/creative activities, 69% on administrative matters, 7% on service, and 8% on fundraising.
Chart 24 provides data on personnel assignments in the areas of secretarial/clerical assistance, library staff, and professional/technical staff.
Example: Chart 24-1 – “Art/Design Administrative and Staff Assistance,” Public Institutions, 101-200 Art/Design Majors. At 54 institutions, the average full-time equivalent (FTE) secretarial/clerical staff was 2.45, with an average total salary expenditure of $39,640.
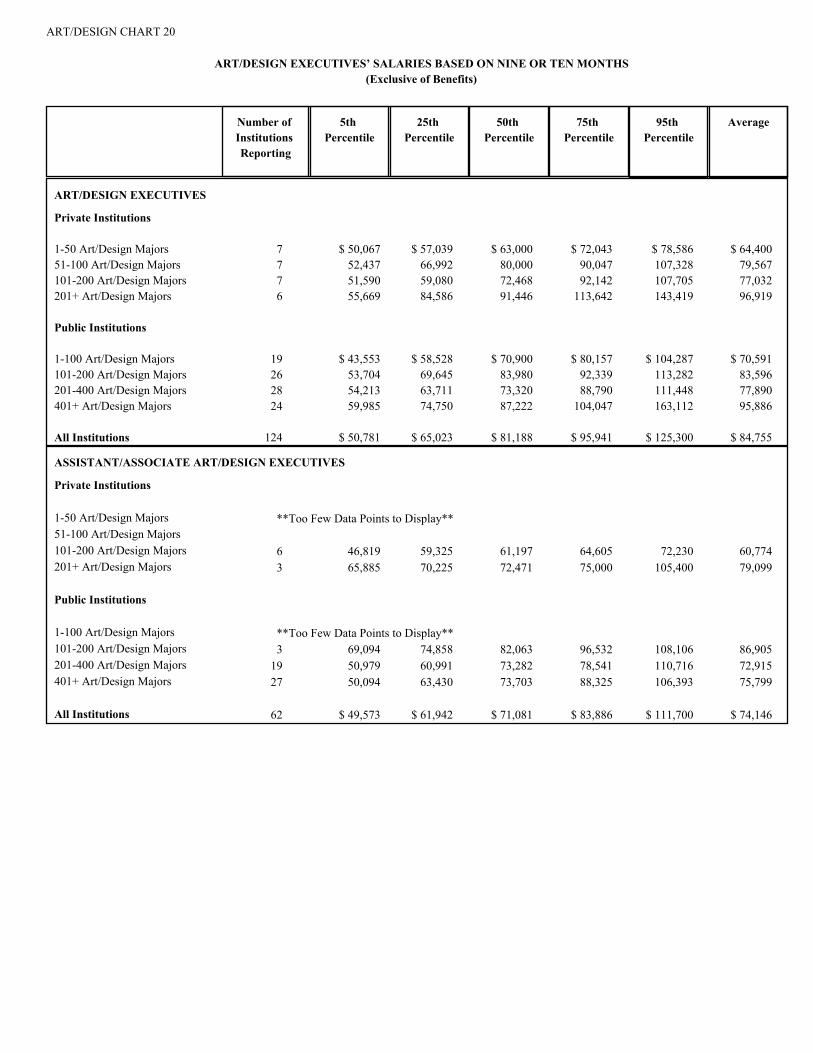
ART/DESIGN CHART 20
ART/DESIGN EXECUTIVES’ SALARIES BASED ON NINE OR TEN MONTHS
(Exclusive of Benefits)
Number of
Institutions
Reporting
25th
Percentile
50th
Percentile
75th
Percentile
95th
Percentile
Average5th
Percentile
ART/DESIGN EXECUTIVES
Private Institutions
1-50 Art/Design Majors 7 $ 57,039 $ 63,000 $ 72,043 $ 78,586 $ 64,400$ 50,067
51-100 Art/Design Majors 7 66,992 80,000 90,047 107,328 79,567 52,437
101-200 Art/Design Majors 7 59,080 72,468 92,142 107,705 77,032 51,590
201+ Art/Design Majors 6 84,586 91,446 113,642 143,419 96,919 55,669
Public Institutions
1-100 Art/Design Majors 19 $ 58,528 $ 70,900 $ 80,157 $ 104,287 $ 70,591$ 43,553
101-200 Art/Design Majors 26 69,645 83,980 92,339 113,282 83,596 53,704
201-400 Art/Design Majors 28 63,711 73,320 88,790 111,448 77,890 54,213
401+ Art/Design Majors 24 74,750 87,222 104,047 163,112 95,886 59,985
All Institutions 124 $ 65,023 $ 81,188 $ 95,941 $ 125,300 $ 84,755$ 50,781
ASSISTANT/ASSOCIATE ART/DESIGN EXECUTIVES
Private Institutions
1-50 Art/Design Majors **Too Few Data Points to Display**51-100 Art/Design Majors
101-200 Art/Design Majors 6 59,325 61,197 64,605 72,230 60,774 46,819
201+ Art/Design Majors 3 70,225 72,471 75,000 105,400 79,099 65,885
Public Institutions
1-100 Art/Design Majors **Too Few Data Points to Display**101-200 Art/Design Majors 3 74,858 82,063 96,532 108,106 86,905 69,094
201-400 Art/Design Majors 19 60,991 73,282 78,541 110,716 72,915 50,979
401+ Art/Design Majors 27 63,430 73,703 88,325 106,393 75,799 50,094
All Institutions 62 $ 61,942 $ 71,081 $ 83,886 $ 111,700 $ 74,146$ 49,573
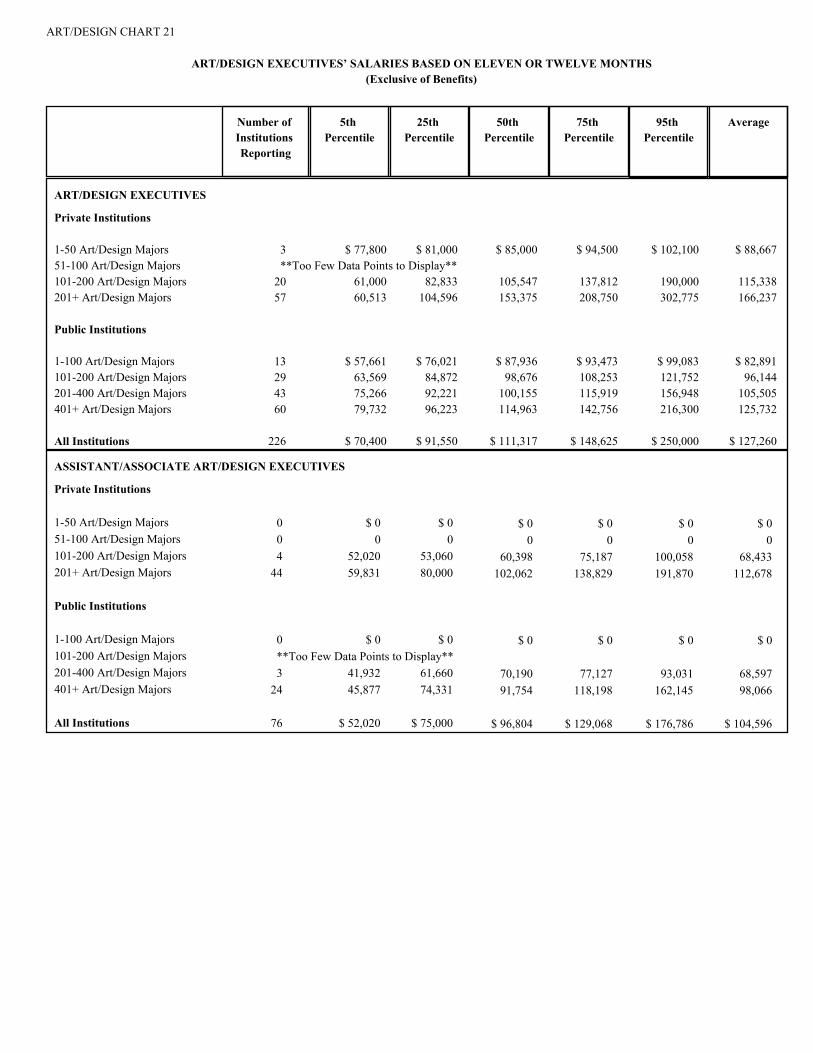
ART/DESIGN CHART 21
ART/DESIGN EXECUTIVES’ SALARIES BASED ON ELEVEN OR TWELVE MONTHS
(Exclusive of Benefits)
Number of
Institutions
Reporting
25th
Percentile
50th
Percentile
75th
Percentile
95th
Percentile
Average5th
Percentile
ART/DESIGN EXECUTIVES
Private Institutions
1-50 Art/Design Majors 3 $ 81,000 $ 85,000 $ 94,500 $ 102,100 $ 88,667$ 77,800
51-100 Art/Design Majors **Too Few Data Points to Display**101-200 Art/Design Majors 20 82,833 105,547 137,812 190,000 115,338 61,000
201+ Art/Design Majors 57 104,596 153,375 208,750 302,775 166,237 60,513
Public Institutions
1-100 Art/Design Majors 13 $ 76,021 $ 87,936 $ 93,473 $ 99,083 $ 82,891$ 57,661
101-200 Art/Design Majors 29 84,872 98,676 108,253 121,752 96,144 63,569
201-400 Art/Design Majors 43 92,221 100,155 115,919 156,948 105,505 75,266
401+ Art/Design Majors 60 96,223 114,963 142,756 216,300 125,732 79,732
All Institutions 226 $ 91,550 $ 111,317 $ 148,625 $ 250,000 $ 127,260$ 70,400
ASSISTANT/ASSOCIATE ART/DESIGN EXECUTIVES
Private Institutions
1-50 Art/Design Majors 0 $ 0 $ 0 $ 0 $ 0 $ 0$ 0
51-100 Art/Design Majors 0 0 0 0 0 0 0
101-200 Art/Design Majors 4 53,060 60,398 75,187 100,058 68,433 52,020
201+ Art/Design Majors 44 80,000 102,062 138,829 191,870 112,678 59,831
Public Institutions
1-100 Art/Design Majors 0 $ 0 $ 0 $ 0 $ 0 $ 0$ 0
101-200 Art/Design Majors **Too Few Data Points to Display**201-400 Art/Design Majors 3 61,660 70,190 77,127 93,031 68,597 41,932
401+ Art/Design Majors 24 74,331 91,754 118,198 162,145 98,066 45,877
All Institutions 76 $ 75,000 $ 96,804 $ 129,068 $ 176,786 $ 104,596$ 52,020
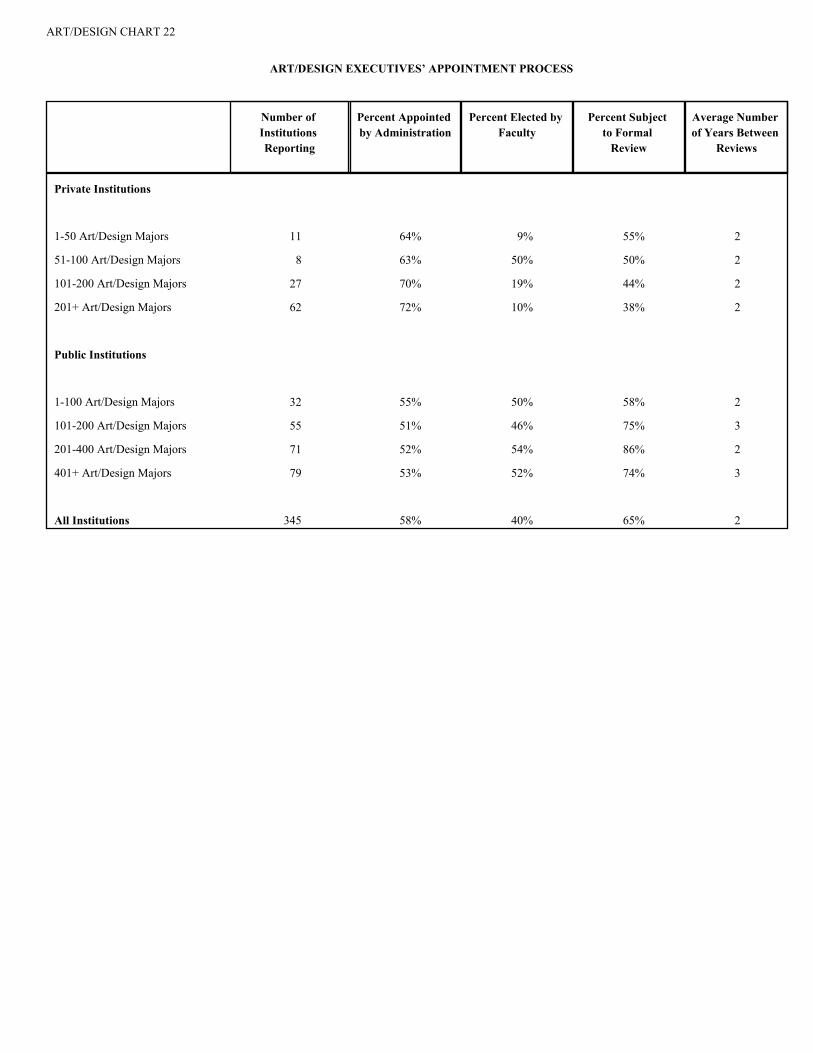
ART/DESIGN CHART 22
Number of
Institutions
Reporting
Percent Appointed
by Administration
Percent Elected by
Faculty
Percent Subject
to Formal
Review
Average Number
of Years Between
Reviews
Private Institutions
1-50 Art/Design Majors 11 64% 9% 55% 2
51-100 Art/Design Majors 8 63% 50% 50% 2
101-200 Art/Design Majors 27 70% 19% 44% 2
201+ Art/Design Majors 62 72% 10% 38% 2
Public Institutions
1-100 Art/Design Majors 32 55% 50% 58% 2
101-200 Art/Design Majors 55 51% 46% 75% 3
201-400 Art/Design Majors 71 52% 54% 86% 2
401+ Art/Design Majors 79 53% 52% 74% 3
All Institutions 345 58% 40% 65% 2
ART/DESIGN EXECUTIVES’ APPOINTMENT PROCESS

ART/DESIGN CHART 22 (continued)
ART/DESIGN EXECUTIVES’ GENDER ANALYSIS
Number of
Institutions
Reporting
Number of
Executives
(Male)
Number of
Executives
(Female)
Total
Number of
Executives
Percent of
Total
Executives
(Male)
Percent of
Total
Executives
(Female)
Private Institutions
1-50 Art/Design Majors 11 4 7 11 36.4% 63.6%
51-100 Art/Design Majors 8 4 4 8 50.0% 50.0%
101-200 Art/Design Majors 27 16 12 28 57.1% 42.9%
201+ Art/Design Majors 62 36 33 69 52.2% 47.8%
Public Institutions
1-100 Art/Design Majors 32 20 12 32 62.5% 37.5%
101-200 Art/Design Majors 55 35 22 57 61.4% 38.6%
201-400 Art/Design Majors 71 49 26 75 65.3% 34.7%
401+ Art/Design Majors 79 60 38 98 61.2% 38.8%
All Institutions 345 224 154 378 59.3% 40.7%
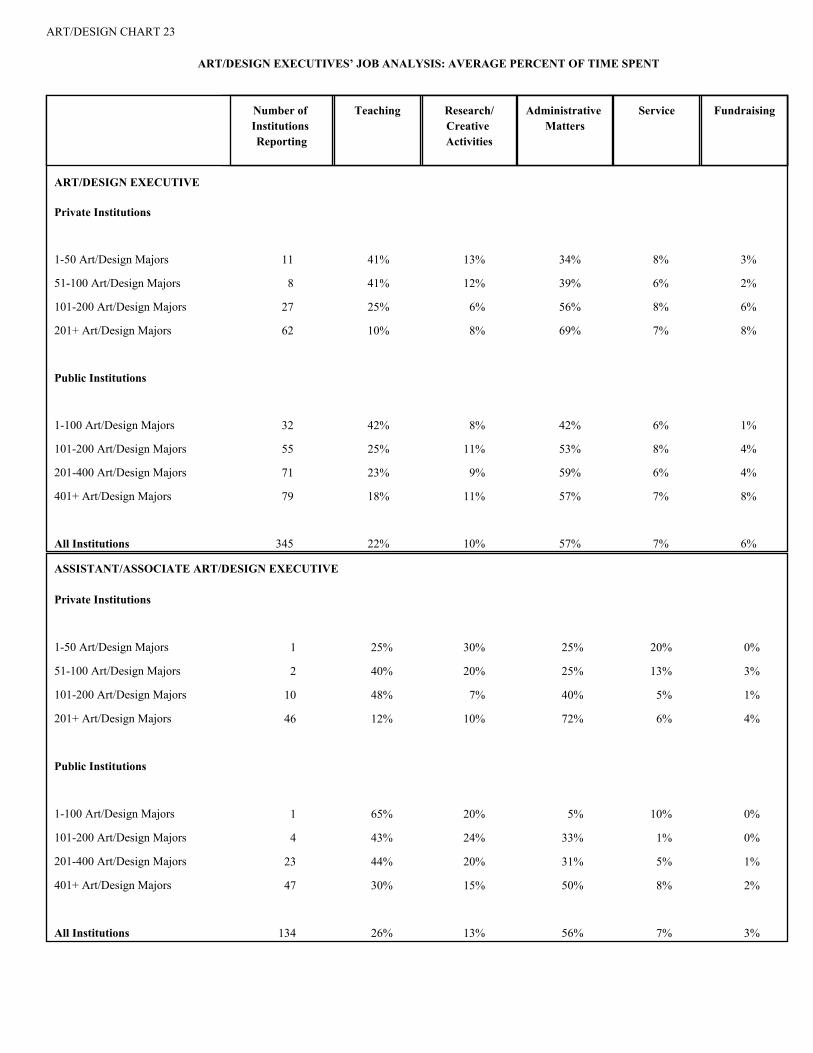
ART/DESIGN CHART 23
ART/DESIGN EXECUTIVES’ JOB ANALYSIS: AVERAGE PERCENT OF TIME SPENT
FundraisingServiceAdministrative
Matters
Research/
Creative
Activities
TeachingNumber of
Institutions
Reporting
ART/DESIGN EXECUTIVE
Private Institutions
1-50 Art/Design Majors 11 41% 13% 34% 8% 3%
51-100 Art/Design Majors 8 41% 12% 39% 6% 2%
101-200 Art/Design Majors 27 25% 6% 56% 8% 6%
201+ Art/Design Majors 62 10% 8% 69% 7% 8%
Public Institutions
1-100 Art/Design Majors 32 42% 8% 42% 6% 1%
101-200 Art/Design Majors 55 25% 11% 53% 8% 4%
201-400 Art/Design Majors 71 23% 9% 59% 6% 4%
401+ Art/Design Majors 79 18% 11% 57% 7% 8%
All Institutions 345 22% 10% 57% 7% 6%
ASSISTANT/ASSOCIATE ART/DESIGN EXECUTIVE
Private Institutions
1-50 Art/Design Majors 1 25% 30% 25% 20% 0%
51-100 Art/Design Majors 2 40% 20% 25% 13% 3%
101-200 Art/Design Majors 10 48% 7% 40% 5% 1%
201+ Art/Design Majors 46 12% 10% 72% 6% 4%
Public Institutions
1-100 Art/Design Majors 1 65% 20% 5% 10% 0%
101-200 Art/Design Majors 4 43% 24% 33% 1% 0%
201-400 Art/Design Majors 23 44% 20% 31% 5% 1%
401+ Art/Design Majors 47 30% 15% 50% 8% 2%
All Institutions 134 26% 13% 56% 7% 3%

ART/DESIGN CHART 24-1
ART/DESIGN ADMINISTRATIVE AND STAFF ASSISTANCE
Number of Institutions Reporting
Average Total FTE Average Total Expense
SECRETARIAL/CLERICAL
Private Institutions
1-50 Art/Design Majors 10 4.08 $ 31,170
51-100 Art/Design Majors 8 0.78 26,464
101-200 Art/Design Majors 26 1.34 48,771
201+ Art/Design Majors 62 21.91 1,013,992
Public Institutions
1-100 Art/Design Majors 28 0.89 $ 24,561
101-200 Art/Design Majors 54 2.45 39,640
201-400 Art/Design Majors 69 1.84 58,808
401+ Art/Design Majors 76 4.09 163,127
All Institutions 333 6.11 $ 252,080
Number of Institutions Reporting
Branch FTE Main FTE Other FTE Average Total Expense
LIBRARY STAFF
Private Institutions
1-50 Art/Design Majors 5 20.00 0.50 0.00 $ 16,056
51-100 Art/Design Majors 7RR�)HZ�'DWD�3RLQWV�WR�'LVSOD\
101-200 Art/Design Majors 12 2.50 3.80 0.20 56,224
201+ Art/Design Majors 51 3.27 6.07 2.20 259,347
Public Institutions
1-100 Art/Design Majors 8 0.20 0.41 0.00 $ 26,848
101-200 Art/Design Majors 28 1.16 0.62 0.75 37,417
201-400 Art/Design Majors 35 0.88 0.55 0.63 34,044
401+ Art/Design Majors 47 1.83 1.34 0.96 88,054
All Institutions 188 2.03 2.83 1.05 $ 111,484

ART/DESIGN CHART 24-2
ART/DESIGN ADMINISTRATIVE AND STAFF ASSISTANCE
Number of Institutions
Reporting
Average Total FTE Average Total Expense
TECHNICAL STAFF
Private Institutions
1-50 Art/Design Majors 4 1.05 $ 18,610
51-100 Art/Design Majors 4 0.93 15,500
101-200 Art/Design Majors 20 1.65 63,270
201+ Art/Design Majors 58 16.20 733,304
Public Institutions
1-100 Art/Design Majors 12 0.92 $ 32,906
101-200 Art/Design Majors 32 1.14 47,595
201-400 Art/Design Majors 49 1.68 61,994
401+ Art/Design Majors 70 4.49 221,725
All Institutions 249 5.72 $ 258,674
PROFESSIONAL AND MISCELLANEOUS STAFF
Private Institutions
1-50 Art/Design Majors 4 0.95 $ 20,438
51-100 Art/Design Majors 3 1.21 36,441
101-200 Art/Design Majors 13 13.18 559,886
201+ Art/Design Majors 57 53.04 3,410,340
Public Institutions
1-100 Art/Design Majors 7 0.45 $ 20,096
101-200 Art/Design Majors 22 1.07 50,557
201-400 Art/Design Majors 43 1.74 86,362
401+ Art/Design Majors 59 5.66 294,797
All Institutions 208 17.49 $ 1,077,973

Higher Education Arts Data Services DATA SUMMARIES
2014-2015
ART/DESIGN BUDGET
Charts 25-1 through 25-11 provide information on expenses for specific budget categories of art/design units by size (number of art/design majors) and type (public or private). Charts 25-1 to 25-5 include private institutions, Charts 25-6 to 25-10 include public institutions, and Chart 25-11 covers all institutions. In all cases, the charts represent average expenses and percentile rankings for various budget categories and totals.
Example: Chart 25-1 – “Expenses of the Art/Design Unit: All Private Institutions,” Specific Instructional, Operational, and Exhibition Expenses, Faculty/Professional Travel.
One hundred private institutions included faculty/professional travel in their 2014-2015 art/design unit budget. The average expense was $168,904.
Chart 25-12 provides information on actual expenses for specific budget categories in 2013-2014 of all art/design units. The chart represents average expenses and percentile rankings for various budget categories and totals.
Example: Chart 25-12 – “Expenses of the Art/Design Unit: All Institutions,” Actual Instructional, Operational, and Performance Budget for 2013-2014, Models.
Two hundred seventy-eight institutions included models in their 2013-2014 art/design unit budget. The average expense was $19,374.
Charts 26-1 through 26-11 provide information on specific sources of income in 2013-2014 for the art/design unit by size and type of institution. Charts 26-1 through 26-6 include private institutions, Charts 26-7 through 26-10 include public institutions, and Chart 26-11 covers all institutions. The data included in these charts are not meant to represent the total income of the art/design unit, but instead reflect specific types of income generated specifically for the art/design unit.
Example: Chart 26-5 – “Specific Income Sources for the Art/Design Unit,” Private Institutions, 201+ Majors.
Twenty-five institutions in this category received public grants, the average of which was $241,061. Percentile rankings are presented in each category to delineate the range of responses.

ART/DESIGN CHART 25-1
EXPENSES OF THE ART/DESIGN UNIT
All Private Institutions
Number of
Institutions
Reporting
5th
Percentile
25th
Percentile
50th
Percentile
75th
Percentile
95th
Percentile
Average
SPECIFIC INSTRUCTIONAL, OPERATIONAL AND EXHIBITION BUDGET FOR 2014-2015
Exhibition Expense 95 $ 2,811 $ 7,749 $ 23,852 $ 61,358 $ 347,953 $ 79,535
Faculty/Professional Travel 100 1,196 6,482 16,120 81,397 731,263 168,904
Instructional Supplies 104 2,023 21,419 48,395 136,659 539,428 191,445
Library 81 400 2,700 15,000 52,400 294,000 54,260
Models 83 800 2,000 8,174 35,058 179,863 46,503
Office Supplies 101 698 2,839 11,500 35,500 173,091 61,615
Operating Services 57 508 3,705 189,641 985,365 5,520,727 1,316,866
Postage 100 200 711 6,975 30,616 345,894 115,787
Printing/Duplication 104 315 2,500 13,035 62,076 727,899 91,561
Student Recruitment 62 802 8,451 129,091 360,369 1,360,289 574,760
Undergraduate Scholarships 59 19,794 162,000 1,149,499 5,414,525 14,627,454 4,301,235
Graduate Scholarships 41 20,000 153,174 351,437 858,000 3,403,271 901,019
Student Wages 83 2,542 15,097 46,063 198,699 965,846 234,690
Short-Term Visiting Artists/Lecturers 89 1,117 3,679 16,950 63,200 259,534 63,755
Technical Services 45 520 2,650 17,650 92,929 405,291 93,989
Technology Services 76 1,000 7,681 48,613 248,264 1,068,577 241,574
Telephone/Fax/Elec. Communications 73 50 2,796 21,650 71,738 348,302 99,843
Public Relations and Fundraising 58 400 3,508 72,220 236,841 946,014 261,577
All Other Expenses 93 1,210 9,000 85,708 1,914,338 12,514,514 2,824,476
TOTAL BUDGET FOR 2014-2015 107 36,049 124,656 724,021 5,739,645 41,790,082 7,609,584
BENEFIT EXPENSES OF THE ART/DESIGN UNIT FOR 2014-2015
TOTAL BENEFITS FOR
2014-2015
107 $ 62,625 $ 235,573 $ 556,299 $ 1,463,057 $ 9,626,470 $ 1,907,689
GRAND TOTAL ANNUAL BUDGET
FOR 2014-2015
(Including Salaries and Benefits)
107 $ 531,316 $ 1,387,270 $ 4,566,605 $ 15,328,737 $ 81,949,147 $ 16,298,300
EQUIPMENT AND BUILDING BUDGET
Number of
Institutions
Reporting
5th
Percentile
25th
Percentile
50th
Percentile
75th
Percentile
95th
Percentile
Average
Equipment
Purchases 92 $ 2,721 $ 11,513 $ 57,316 $ 175,857 $ 1,882,319 $ 576,325
Leases and Rentals 50 516 11,068 48,580 184,097 2,131,261 320,035
Repair 60 842 2,475 13,250 53,033 459,232 89,332
Building
Renovation 56 $ 545 $ 17,186 $ 100,000 $ 408,349 $ 1,193,425 $ 450,170
Leases and Rentals 32 6,403 76,250 276,995 1,127,930 6,533,379 2,851,652
New Construction 9 41,260 300,000 2,992,854 11,924,000 41,331,926 11,083,196
TOTAL 99 $ 3,231 $ 19,547 $ 186,770 $ 904,025 $ 9,777,583 $ 2,935,300
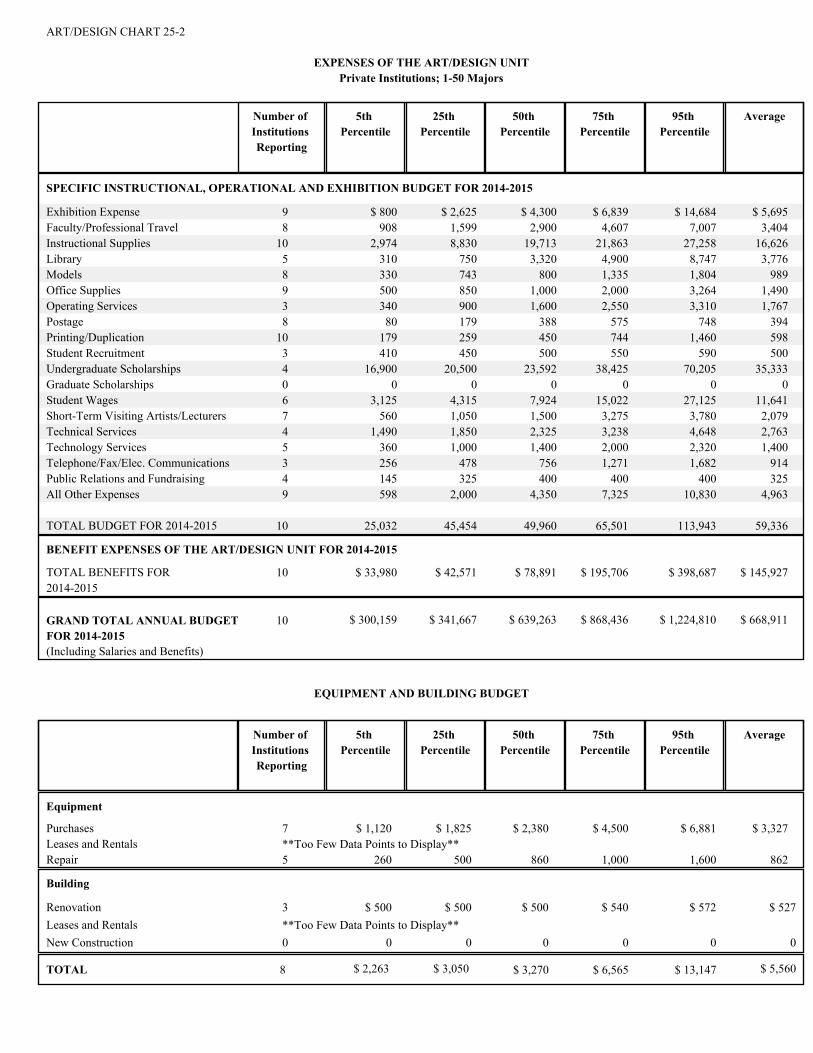
ART/DESIGN CHART 25-2
EXPENSES OF THE ART/DESIGN UNIT
Private Institutions; 1-50 Majors
Number of
Institutions
Reporting
5th
Percentile
25th
Percentile
50th
Percentile
75th
Percentile
95th
Percentile
Average
SPECIFIC INSTRUCTIONAL, OPERATIONAL AND EXHIBITION BUDGET FOR 2014-2015
Exhibition Expense 9 $ 800 $ 2,625 $ 4,300 $ 6,839 $ 14,684 $ 5,695
Faculty/Professional Travel 8 908 1,599 2,900 4,607 7,007 3,404
Instructional Supplies 10 2,974 8,830 19,713 21,863 27,258 16,626
Library 5 310 750 3,320 4,900 8,747 3,776
Models 8 330 743 800 1,335 1,804 989
Office Supplies 9 500 850 1,000 2,000 3,264 1,490
Operating Services 3 340 900 1,600 2,550 3,310 1,767
Postage 8 80 179 388 575 748 394
Printing/Duplication 10 179 259 450 744 1,460 598
Student Recruitment 3 410 450 500 550 590 500
Undergraduate Scholarships 4 16,900 20,500 23,592 38,425 70,205 35,333
Graduate Scholarships 0 0 0 0 0 0 0
Student Wages 6 3,125 4,315 7,924 15,022 27,125 11,641
Short-Term Visiting Artists/Lecturers 7 560 1,050 1,500 3,275 3,780 2,079
Technical Services 4 1,490 1,850 2,325 3,238 4,648 2,763
Technology Services 5 360 1,000 1,400 2,000 2,320 1,400
Telephone/Fax/Elec. Communications 3 256 478 756 1,271 1,682 914
Public Relations and Fundraising 4 145 325 400 400 400 325
All Other Expenses 9 598 2,000 4,350 7,325 10,830 4,963
TOTAL BUDGET FOR 2014-2015 10 25,032 45,454 49,960 65,501 113,943 59,336
BENEFIT EXPENSES OF THE ART/DESIGN UNIT FOR 2014-2015
TOTAL BENEFITS FOR
2014-2015
10 $ 33,980 $ 42,571 $ 78,891 $ 195,706 $ 398,687 $ 145,927
GRAND TOTAL ANNUAL BUDGET
FOR 2014-2015
(Including Salaries and Benefits)
10 $ 300,159 $ 341,667 $ 639,263 $ 868,436 $ 1,224,810 $ 668,911
EQUIPMENT AND BUILDING BUDGET
Number of
Institutions
Reporting
5th
Percentile
25th
Percentile
50th
Percentile
75th
Percentile
95th
Percentile
Average
Equipment
Purchases 7 $ 1,120 $ 1,825 $ 2,380 $ 4,500 $ 6,881 $ 3,327
Leases and Rentals **Too Few Data Points to Display**Repair 5 260 500 860 1,000 1,600 862
Building
Renovation 3 $ 500 $ 500 $ 500 $ 540 $ 572 $ 527
Leases and Rentals **Too Few Data Points to Display**New Construction 0 0 0 0 0 0 0
TOTAL 8 $ 2,263 $ 3,050 $ 3,270 $ 6,565 $ 13,147 $ 5,560

ART/DESIGN CHART 25-3
EXPENSES OF THE ART/DESIGN UNIT
Private Institutions; 51-100 Majors
Number of
Institutions
Reporting
5th
Percentile
25th
Percentile
50th
Percentile
75th
Percentile
95th
Percentile
Average
SPECIFIC INSTRUCTIONAL, OPERATIONAL AND EXHIBITION BUDGET FOR 2014-2015
Exhibition Expense 7 $ 4,992 $ 6,435 $ 8,000 $ 18,000 $ 33,100 $ 14,061
Faculty/Professional Travel 7 868 3,906 8,377 11,550 15,550 7,934
Instructional Supplies 8 13,234 14,953 22,098 30,750 37,425 23,652
Library 6 313 1,163 3,850 6,189 17,771 6,106
Models 4 399 795 1,355 2,563 4,513 2,003
Office Supplies 8 500 649 1,603 2,294 3,219 1,656
Operating Services 3 693 1,465 2,430 2,573 2,687 1,882
Postage 8 200 238 654 1,493 2,027 914
Printing/Duplication 8 729 1,123 1,550 2,220 4,353 1,986
Student Recruitment 3 1,204 1,820 2,590 3,845 4,849 2,913
Undergraduate Scholarships 3 12,145 28,725 49,450 111,725 161,545 77,150
Graduate Scholarships 0 0 0 0 0 0 0
Student Wages 6 3,700 8,000 13,210 17,985 45,308 18,165
Short-Term Visiting Artists/Lecturers 5 940 1,500 4,500 6,673 8,535 4,495
Technical Services 4 490 850 1,546 5,981 15,316 5,285
Technology Services 5 726 3,230 4,500 5,948 25,430 8,816
Telephone/Fax/Elec. Communications 4 29 44 50 1,348 4,462 1,341
Public Relations and Fundraising **Too Few Data Points to Display**All Other Expenses 7 1,454 3,226 4,500 8,868 11,747 5,938
TOTAL BUDGET FOR 2014-2015 8 41,152 59,714 90,190 109,555 274,112 114,502
BENEFIT EXPENSES OF THE ART/DESIGN UNIT FOR 2014-2015
TOTAL BENEFITS FOR
2014-2015
8 $ 72,900 $ 112,303 $ 165,638 $ 225,056 $ 509,470 $ 215,256
GRAND TOTAL ANNUAL BUDGET
FOR 2014-2015
(Including Salaries and Benefits)
8 $ 510,235 $ 549,794 $ 864,390 $ 1,207,993 $ 2,121,189 $ 1,045,436
EQUIPMENT AND BUILDING BUDGET
Number of
Institutions
Reporting
5th
Percentile
25th
Percentile
50th
Percentile
75th
Percentile
95th
Percentile
Average
Equipment
Purchases 4 $ 6,000 $ 6,000 $ 17,071 $ 31,823 $ 40,661 $ 20,753
Leases and Rentals **Too Few Data Points to Display**Repair
Building
Renovation **Too Few Data Points to Display**Leases and Rentals 0 0 0 0 0 0 0
New Construction 0 0 0 0 0 0 0
TOTAL 6 $ 713 $ 3,175 $ 7,500 $ 34,403 $ 63,811 $ 21,850

ART/DESIGN CHART 25-4
EXPENSES OF THE ART/DESIGN UNIT
Private Institutions; 101-200 Majors
Number of
Institutions
Reporting
5th
Percentile
25th
Percentile
50th
Percentile
75th
Percentile
95th
Percentile
Average
SPECIFIC INSTRUCTIONAL, OPERATIONAL AND EXHIBITION BUDGET FOR 2014-2015
Exhibition Expense 21 $ 2,890 $ 5,364 $ 9,650 $ 21,489 $ 96,620 $ 31,774
Faculty/Professional Travel 24 1,119 2,038 4,963 15,625 46,033 18,587
Instructional Supplies 26 929 10,500 26,695 46,168 131,386 41,456
Library 20 117 832 3,006 30,627 78,760 23,856
Models 20 990 1,500 3,110 9,472 39,937 11,613
Office Supplies 25 1,168 2,200 4,000 11,500 26,235 8,674
Operating Services 10 838 1,959 7,665 134,188 756,378 169,384
Postage 24 258 638 1,544 16,069 32,267 7,973
Printing/Duplication 27 282 2,653 3,762 17,299 61,097 15,190
Student Recruitment 12 1,500 3,000 10,968 48,400 172,678 45,077
Undergraduate Scholarships 10 32,421 82,025 256,075 620,013 1,208,581 436,091
Graduate Scholarships 9 15,426 36,000 292,500 488,250 833,450 320,531
Student Wages 17 2,236 11,583 26,404 50,000 122,491 40,194
Short-Term Visiting Artists/Lecturers 19 1,295 2,673 4,000 22,027 64,715 16,229
Technical Services 9 501 1,280 5,000 8,000 27,680 8,294
Technology Services 14 6,471 13,350 28,419 52,600 124,019 42,368
Telephone/Fax/Elec. Communications 13 338 2,796 8,100 25,785 44,322 15,899
Public Relations and Fundraising 10 1,175 2,265 4,856 76,088 248,187 65,250
All Other Expenses 21 575 5,239 11,917 41,000 2,644,275 494,391
TOTAL BUDGET FOR 2014-2015 27 27,713 85,530 248,436 729,068 4,311,170 966,672
BENEFIT EXPENSES OF THE ART/DESIGN UNIT FOR 2014-2015
TOTAL BENEFITS FOR
2014-2015
27 $ 136,543 $ 203,971 $ 266,000 $ 545,399 $ 815,759 $ 399,726
GRAND TOTAL ANNUAL BUDGET
FOR 2014-2015
(Including Salaries and Benefits)
27 $ 837,742 $ 1,109,128 $ 1,684,645 $ 2,678,197 $ 7,523,263 $ 2,652,780
EQUIPMENT AND BUILDING BUDGET
Number of
Institutions
Reporting
5th
Percentile
25th
Percentile
50th
Percentile
75th
Percentile
95th
Percentile
Average
Equipment
Purchases 22 $ 4,978 $ 9,207 $ 12,000 $ 29,832 $ 72,700 $ 28,799
Leases and Rentals 8 422 9,226 37,598 92,943 162,361 59,910
Repair 13 1,402 2,183 3,000 14,325 24,120 8,119
Building
Renovation 11 $ 5,150 $ 20,380 $ 57,305 $ 219,982 $ 751,000 $ 198,024
Leases and Rentals 6 2,350 18,875 510,556 1,130,938 1,268,452 585,109
New Construction **Too Few Data Points to Display**
TOTAL 23 $ 6,038 $ 11,520 $ 63,500 $ 541,500 $ 1,580,305 $ 413,362

ART/DESIGN CHART 25-5
EXPENSES OF THE ART/DESIGN UNIT
Private Institutions; 201+ Majors
Number of
Institutions
Reporting
5th
Percentile
25th
Percentile
50th
Percentile
75th
Percentile
95th
Percentile
Average
SPECIFIC INSTRUCTIONAL, OPERATIONAL AND EXHIBITION BUDGET FOR 2014-2015
Exhibition Expense 58 $ 4,229 $ 18,882 $ 45,325 $ 104,563 $ 430,885 $ 116,188
Faculty/Professional Travel 61 7,000 16,150 54,242 165,822 1,360,840 268,223
Instructional Supplies 60 3,744 51,500 118,763 262,878 1,325,695 307,950
Library 50 913 8,138 29,365 92,054 344,725 77,249
Models 51 2,000 7,669 22,060 70,202 269,273 70,815
Office Supplies 59 3,337 11,500 31,000 82,500 313,645 101,349
Operating Services 41 1,150 29,494 436,305 1,299,504 9,535,636 1,789,185
Postage 60 595 4,446 22,227 68,750 582,153 189,615
Printing/Duplication 59 2,450 13,035 49,600 114,638 942,963 154,073
Student Recruitment 44 4,824 71,250 257,372 590,250 2,128,317 797,363
Undergraduate Scholarships 42 78,270 495,238 4,313,554 9,362,511 20,304,360 5,929,504
Graduate Scholarships 32 35,501 240,485 421,249 927,860 3,616,721 1,064,282
Student Wages 54 4,756 34,702 96,768 302,167 1,019,677 344,762
Short-Term Visiting Artists/Lecturers 58 3,201 12,849 49,125 86,900 363,191 91,877
Technical Services 28 2,175 16,989 54,413 215,015 423,964 147,238
Technology Services 52 1,365 23,500 165,899 396,947 1,314,169 340,680
Telephone/Fax/Elec. Communications 53 621 6,000 32,300 116,324 467,651 133,467
Public Relations and Fundraising 42 2,045 11,250 128,925 322,868 1,131,239 345,604
All Other Expenses 56 11,400 84,131 422,107 4,154,857 17,040,048 4,503,712
TOTAL BUDGET FOR 2014-2015 62 141,935 698,027 3,805,674 15,200,719 50,771,750 12,687,355
BENEFIT EXPENSES OF THE ART/DESIGN UNIT FOR 2014-2015
TOTAL BENEFITS FOR
2014-2015
62 $ 251,505 $ 622,718 $ 1,220,406 $ 2,799,700 $ 14,867,589 $ 3,066,916
GRAND TOTAL ANNUAL BUDGET
FOR 2014-2015
(Including Salaries and Benefits)
62 $ 1,802,025 $ 4,952,319 $ 11,428,622 $ 28,177,221 $ 117,787,264 $ 26,729,685
EQUIPMENT AND BUILDING BUDGET
Number of
Institutions
Reporting
5th
Percentile
25th
Percentile
50th
Percentile
75th
Percentile
95th
Percentile
Average
Equipment
Purchases 59 $ 7,430 $ 52,213 $ 124,866 $ 437,039 $ 2,238,001 $ 886,136
Leases and Rentals 40 2,358 16,211 49,108 209,100 2,212,990 387,974
Repair 40 1,880 9,813 26,725 76,265 600,267 131,121
Building
Renovation 41 $ 808 $ 44,493 $ 141,000 $ 520,000 $ 1,281,950 $ 560,658
Leases and Rentals 25 15,400 148,100 289,989 1,109,169 8,414,716 3,509,208
New Construction 8 36,365 250,000 3,246,427 16,025,454 42,415,435 12,143,596
TOTAL 62 $ 10,386 $ 113,303 $ 433,950 $ 1,279,299 $ 20,450,534 $ 4,530,835

ART/DESIGN CHART 25-6
EXPENSES OF THE ART/DESIGN UNIT
All Public Institutions
Number of
Institutions
Reporting
5th
Percentile
25th
Percentile
50th
Percentile
75th
Percentile
95th
Percentile
Average
SPECIFIC INSTRUCTIONAL, OPERATIONAL AND EXHIBITION BUDGET FOR 2014-2015
Exhibition Expense 202 $ 1,000 $ 3,500 $ 10,000 $ 20,000 $ 75,923 $ 19,102
Faculty/Professional Travel 215 1,000 3,862 8,000 20,000 95,906 23,019
Instructional Supplies 217 2,440 15,165 33,700 75,000 213,450 64,793
Library 134 183 925 2,000 6,935 43,405 10,944
Models 194 683 2,015 4,338 7,376 25,163 7,948
Office Supplies 221 600 1,804 3,783 8,406 25,074 7,750
Operating Services 127 379 2,120 6,800 15,000 102,849 27,728
Postage 188 131 400 1,000 2,070 7,930 2,845
Printing/Duplication 205 500 1,400 3,150 7,000 22,797 8,587
Student Recruitment 130 300 1,200 2,500 5,000 31,132 17,105
Undergraduate Scholarships 158 1,485 8,000 17,212 49,713 209,403 88,259
Graduate Scholarships 90 2,675 23,087 71,349 282,246 1,112,700 254,546
Student Wages 196 1,350 7,550 15,062 38,209 92,537 34,939
Short-Term Visiting Artists/Lecturers 170 590 2,500 6,250 17,356 44,595 13,027
Technical Services 82 205 1,000 2,745 8,775 31,638 8,411
Technology Services 147 633 2,518 7,800 19,250 71,760 27,905
Telephone/Fax/Elec. Communications 168 206 2,270 5,235 11,318 48,705 16,056
Public Relations and Fundraising 81 275 1,000 2,188 8,503 57,149 14,068
All Other Expenses 168 808 3,000 10,000 27,141 247,658 345,606
TOTAL BUDGET FOR 2014-2015 236 17,963 84,168 157,645 335,224 1,711,500 628,365
BENEFIT EXPENSES OF THE ART/DESIGN UNIT FOR 2014-2015
TOTAL BENEFITS FOR
2014-2015
235 $ 69,174 $ 208,002 $ 369,178 $ 707,460 $ 2,047,993 $ 648,575
GRAND TOTAL ANNUAL BUDGET
FOR 2014-2015
(Including Salaries and Benefits)
236 $ 586,141 $ 1,241,472 $ 1,842,620 $ 3,709,750 $ 10,768,172 $ 3,504,439
EQUIPMENT AND BUILDING BUDGET
Number of
Institutions
Reporting
5th
Percentile
25th
Percentile
50th
Percentile
75th
Percentile
95th
Percentile
Average
Equipment
Purchases 166 $ 2,421 $ 9,624 $ 23,580 $ 51,955 $ 177,044 $ 50,935
Leases and Rentals 79 397 1,456 2,804 6,750 32,343 9,925
Repair 103 300 1,114 2,348 5,000 19,703 6,183
Building
Renovation 95 $ 619 $ 5,000 $ 17,000 $ 112,114 $ 1,782,161 $ 450,643
Leases and Rentals 30 1,253 5,400 17,545 54,492 122,832 39,351
New Construction 3 450,000 1,050,000 1,800,000 8,650,000 14,130,000 5,866,667
TOTAL 194 $ 1,966 $ 10,504 $ 38,532 $ 90,000 $ 878,673 $ 368,262

ART/DESIGN CHART 25-7
EXPENSES OF THE ART/DESIGN UNIT
Public Institutions; 1-100 Majors
Number of
Institutions
Reporting
5th
Percentile
25th
Percentile
50th
Percentile
75th
Percentile
95th
Percentile
Average
SPECIFIC INSTRUCTIONAL, OPERATIONAL AND EXHIBITION BUDGET FOR 2014-2015
Exhibition Expense 23 $ 1,000 $ 2,306 $ 3,150 $ 7,900 $ 14,225 $ 5,480
Faculty/Professional Travel 28 700 1,000 3,075 5,453 8,475 3,607
Instructional Supplies 27 825 2,024 14,465 23,641 51,600 15,862
Library 13 390 500 1,500 3,514 5,155 2,073
Models 19 200 700 1,300 2,000 3,132 1,431
Office Supplies 29 224 750 1,400 2,500 4,294 1,731
Operating Services 9 702 1,000 1,500 1,782 2,696 1,556
Postage 20 49 200 300 525 1,469 539
Printing/Duplication 25 400 1,000 1,500 2,450 4,374 1,936
Student Recruitment 12 228 975 1,625 2,750 4,450 1,946
Undergraduate Scholarships 19 1,500 6,750 9,600 18,850 42,890 16,620
Graduate Scholarships **Too Few Data Points to Display**Student Wages 21 2,000 4,000 7,888 12,500 16,900 9,195
Short-Term Visiting Artists/Lecturers 14 248 763 1,000 2,950 8,000 2,532
Technical Services 3 308 738 1,275 1,743 2,117 1,228
Technology Services 13 540 1,500 3,000 8,665 10,736 4,883
Telephone/Fax/Elec. Communications 16 188 1,450 2,140 3,688 5,984 2,684
Public Relations and Fundraising 5 200 200 500 500 1,300 580
All Other Expenses 20 1,000 1,680 4,231 8,456 40,237 8,931
TOTAL BUDGET FOR 2014-2015 32 5,275 17,963 43,625 77,564 110,458 52,192
BENEFIT EXPENSES OF THE ART/DESIGN UNIT FOR 2014-2015
TOTAL BENEFITS FOR
2014-2015
31 $ 51,791 $ 81,807 $ 130,225 $ 154,957 $ 228,576 $ 131,103
GRAND TOTAL ANNUAL BUDGET
FOR 2014-2015
(Including Salaries and Benefits)
32 $ 296,048 $ 566,460 $ 694,118 $ 792,116 $ 1,015,249 $ 682,586
Number of
Institutions
Reporting
5th
Percentile
25th
Percentile
50th
Percentile
75th
Percentile
95th
Percentile
Average
Equipment
Purchases 14 $ 1,890 $ 3,000 $ 5,638 $ 18,950 $ 62,762 $ 16,397
Leases and Rentals 3 510 950 1,500 2,150 2,670 1,567
Repair 8 235 300 1,000 2,000 3,950 1,475
Building
Renovation 12 $ 594 $ 2,426 $ 15,500 $ 39,724 $ 341,950 $ 75,100
Leases and Rentals 0 0 0 0 0 0 0
New Construction 0 0 0 0 0 0 0
TOTAL 20 $ 970 $ 2,955 $ 6,363 $ 43,675 $ 146,124 $ 56,113

ART/DESIGN CHART 25-8
EXPENSES OF THE ART/DESIGN UNIT
Public Institutions; 101-200 Majors
Number of
Institutions
Reporting
5th
Percentile
25th
Percentile
50th
Percentile
75th
Percentile
95th
Percentile
Average
SPECIFIC INSTRUCTIONAL, OPERATIONAL AND EXHIBITION BUDGET FOR 2014-2015
Exhibition Expense 49 $ 300 $ 1,500 $ 6,800 $ 19,570 $ 34,300 $ 12,148
Faculty/Professional Travel 48 1,165 2,819 4,344 6,549 15,163 5,635
Instructional Supplies 51 1,750 12,750 23,405 36,019 52,000 24,883
Library 27 100 1,000 2,242 7,872 38,763 9,268
Models 46 326 1,178 2,500 4,000 5,874 2,752
Office Supplies 49 510 1,500 2,700 4,200 7,418 3,413
Operating Services 25 406 1,650 3,093 6,968 29,535 6,721
Postage 39 154 373 700 1,063 1,642 851
Printing/Duplication 45 400 740 1,500 2,700 7,150 2,849
Student Recruitment 27 244 500 2,000 3,100 13,965 4,501
Undergraduate Scholarships 35 2,400 7,300 15,000 49,426 111,970 34,703
Graduate Scholarships 12 3,920 12,150 32,247 50,000 80,969 35,706
Student Wages 38 653 4,696 10,671 16,805 42,585 14,392
Short-Term Visiting Artists/Lecturers 38 387 1,050 2,650 7,701 20,921 6,009
Technical Services 12 320 1,000 2,539 4,500 16,543 4,733
Technology Services 31 560 1,000 3,195 6,222 22,099 10,032
Telephone/Fax/Elec. Communications 31 168 1,820 3,878 5,130 7,350 3,598
Public Relations and Fundraising 10 223 1,000 1,800 4,077 12,925 3,769
All Other Expenses 34 558 2,000 3,550 10,450 21,219 8,846
TOTAL BUDGET FOR 2014-2015 55 20,120 57,901 102,774 138,448 293,728 115,743
BENEFIT EXPENSES OF THE ART/DESIGN UNIT FOR 2014-2015
TOTAL BENEFITS FOR
2014-2015
55 $ 53,534 $ 151,405 $ 270,730 $ 351,776 $ 636,673 $ 284,489
GRAND TOTAL ANNUAL BUDGET
FOR 2014-2015
(Including Salaries and Benefits)
55 $ 569,449 $ 962,382 $ 1,373,987 $ 1,613,753 $ 2,747,497 $ 1,436,433
EQUIPMENT AND BUILDING BUDGET
Number of
Institutions
Reporting
5th
Percentile
25th
Percentile
50th
Percentile
75th
Percentile
95th
Percentile
Average
Equipment
Purchases 42 $ 1,228 $ 4,541 $ 12,000 $ 34,621 $ 63,077 $ 32,089
Leases and Rentals 20 500 974 2,004 3,250 7,300 3,730
Repair 23 347 1,000 1,800 2,500 5,896 2,145
Building
Renovation 13 $ 360 $ 800 $ 17,000 $ 109,228 $ 1,042,790 $ 217,255
Leases and Rentals **Too Few Data Points to Display**New Construction
TOTAL 46 $ 862 $ 5,160 $ 13,584 $ 52,547 $ 442,085 $ 432,582
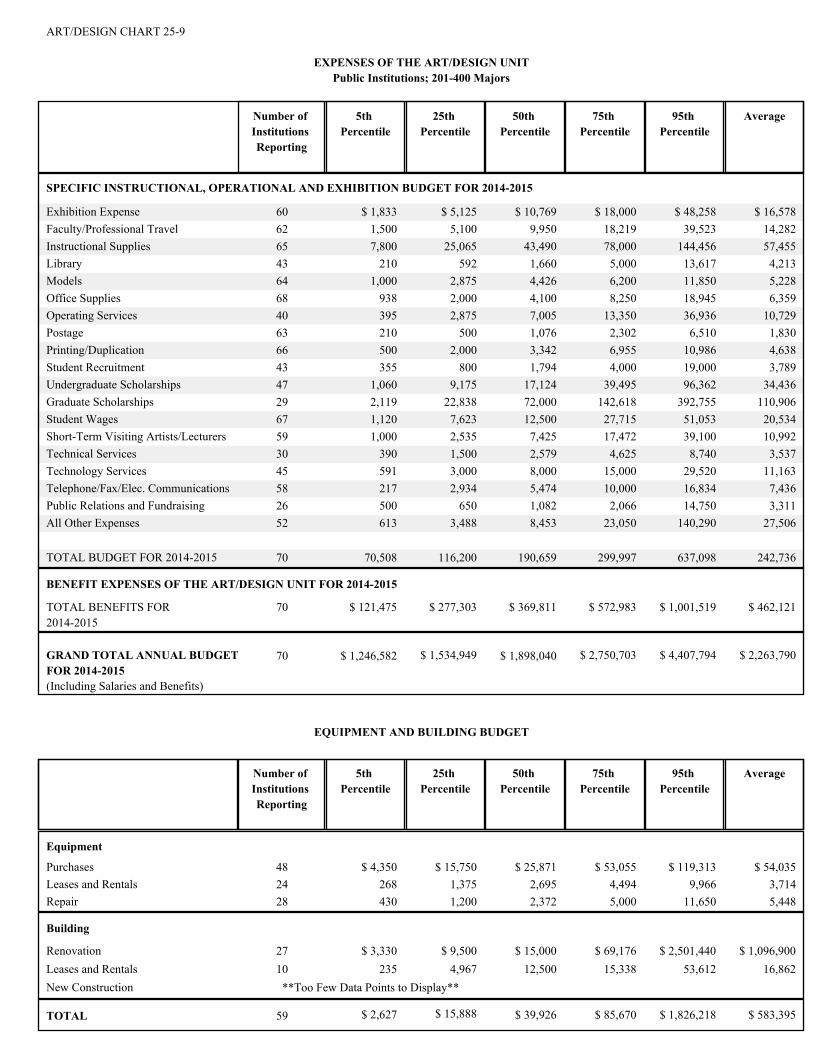
ART/DESIGN CHART 25-9
EXPENSES OF THE ART/DESIGN UNIT
Public Institutions; 201-400 Majors
Number of
Institutions
Reporting
5th
Percentile
25th
Percentile
50th
Percentile
75th
Percentile
95th
Percentile
Average
SPECIFIC INSTRUCTIONAL, OPERATIONAL AND EXHIBITION BUDGET FOR 2014-2015
Exhibition Expense 60 $ 1,833 $ 5,125 $ 10,769 $ 18,000 $ 48,258 $ 16,578
Faculty/Professional Travel 62 1,500 5,100 9,950 18,219 39,523 14,282
Instructional Supplies 65 7,800 25,065 43,490 78,000 144,456 57,455
Library 43 210 592 1,660 5,000 13,617 4,213
Models 64 1,000 2,875 4,426 6,200 11,850 5,228
Office Supplies 68 938 2,000 4,100 8,250 18,945 6,359
Operating Services 40 395 2,875 7,005 13,350 36,936 10,729
Postage 63 210 500 1,076 2,302 6,510 1,830
Printing/Duplication 66 500 2,000 3,342 6,955 10,986 4,638
Student Recruitment 43 355 800 1,794 4,000 19,000 3,789
Undergraduate Scholarships 47 1,060 9,175 17,124 39,495 96,362 34,436
Graduate Scholarships 29 2,119 22,838 72,000 142,618 392,755 110,906
Student Wages 67 1,120 7,623 12,500 27,715 51,053 20,534
Short-Term Visiting Artists/Lecturers 59 1,000 2,535 7,425 17,472 39,100 10,992
Technical Services 30 390 1,500 2,579 4,625 8,740 3,537
Technology Services 45 591 3,000 8,000 15,000 29,520 11,163
Telephone/Fax/Elec. Communications 58 217 2,934 5,474 10,000 16,834 7,436
Public Relations and Fundraising 26 500 650 1,082 2,066 14,750 3,311
All Other Expenses 52 613 3,488 8,453 23,050 140,290 27,506
TOTAL BUDGET FOR 2014-2015 70 70,508 116,200 190,659 299,997 637,098 242,736
BENEFIT EXPENSES OF THE ART/DESIGN UNIT FOR 2014-2015
TOTAL BENEFITS FOR
2014-2015
70 $ 121,475 $ 277,303 $ 369,811 $ 572,983 $ 1,001,519 $ 462,121
GRAND TOTAL ANNUAL BUDGET
FOR 2014-2015
(Including Salaries and Benefits)
70 $ 1,246,582 $ 1,534,949 $ 1,898,040 $ 2,750,703 $ 4,407,794 $ 2,263,790
EQUIPMENT AND BUILDING BUDGET
Number of
Institutions
Reporting
5th
Percentile
25th
Percentile
50th
Percentile
75th
Percentile
95th
Percentile
Average
Equipment
Purchases 48 $ 4,350 $ 15,750 $ 25,871 $ 53,055 $ 119,313 $ 54,035
Leases and Rentals 24 268 1,375 2,695 4,494 9,966 3,714
Repair 28 430 1,200 2,372 5,000 11,650 5,448
Building
Renovation 27 $ 3,330 $ 9,500 $ 15,000 $ 69,176 $ 2,501,440 $ 1,096,900
Leases and Rentals 10 235 4,967 12,500 15,338 53,612 16,862
New Construction **Too Few Data Points to Display**
TOTAL 59 $ 2,627 $ 15,888 $ 39,926 $ 85,670 $ 1,826,218 $ 583,395

ART/DESIGN CHART 25-10
EXPENSES OF THE ART/DESIGN UNIT
Public Institutions; 401+ Majors
Number of
Institutions
Reporting
5th
Percentile
25th
Percentile
50th
Percentile
75th
Percentile
95th
Percentile
Average
SPECIFIC INSTRUCTIONAL, OPERATIONAL AND EXHIBITION BUDGET FOR 2014-2015
Exhibition Expense 70 $ 1,945 $ 7,050 $ 14,805 $ 30,525 $ 120,793 $ 30,609
Faculty/Professional Travel 77 2,820 8,000 20,600 42,000 163,860 47,949
Instructional Supplies 74 4,326 28,764 67,859 163,844 435,184 116,596
Library 51 348 1,150 2,800 10,553 116,000 19,767
Models 65 2,180 5,500 8,000 18,000 46,120 16,209
Office Supplies 75 1,350 3,225 8,000 12,250 49,000 14,172
Operating Services 53 380 5,000 11,137 37,601 194,078 54,912
Postage 66 191 878 1,500 3,915 27,321 5,690
Printing/Duplication 69 1,500 3,673 6,000 14,938 57,760 18,515
Student Recruitment 48 734 2,000 5,000 14,013 255,559 39,913
Undergraduate Scholarships 57 1,900 10,000 25,433 63,550 356,032 189,406
Graduate Scholarships 48 4,070 31,769 128,585 487,692 1,748,898 400,925
Student Wages 70 5,450 17,038 38,918 60,237 264,385 67,603
Short-Term Visiting Artists/Lecturers 59 2,450 6,000 13,000 25,314 53,300 22,072
Technical Services 37 425 1,000 5,935 15,000 46,525 14,138
Technology Services 58 1,331 5,000 13,500 34,680 161,645 55,609
Telephone/Fax/Elec. Communications 63 555 4,492 9,700 22,171 87,567 33,517
Public Relations and Fundraising 40 1,000 2,166 5,713 18,500 102,804 25,322
All Other Expenses 62 1,525 9,091 22,650 62,815 623,064 905,678
TOTAL BUDGET FOR 2014-2015 79 85,194 177,997 393,679 889,853 3,437,395 1,560,336
BENEFIT EXPENSES OF THE ART/DESIGN UNIT FOR 2014-2015
TOTAL BENEFITS FOR
2014-2015
79 $ 257,128 $ 536,314 $ 980,000 $ 1,463,628 $ 3,710,920 $ 1,270,324
GRAND TOTAL ANNUAL BUDGET
FOR 2014-2015
(Including Salaries and Benefits)
79 $ 1,687,216 $ 2,866,992 $ 4,773,274 $ 7,823,381 $ 20,415,662 $ 7,186,527
EQUIPMENT AND BUILDING BUDGET
Number of
Institutions
Reporting
5th
Percentile
25th
Percentile
50th
Percentile
75th
Percentile
95th
Percentile
Average
Equipment
Purchases 62 $ 7,644 $ 20,000 $ 40,000 $ 62,920 $ 279,863 $ 69,102
Leases and Rentals 32 898 2,449 4,792 13,499 52,643 19,239
Repair 44 415 2,000 3,512 8,500 37,955 9,617
Building
Renovation 43 $ 874 $ 5,000 $ 20,888 $ 161,088 $ 837,784 $ 220,216
Leases and Rentals 18 2,996 6,525 27,000 80,279 144,750 50,506
New Construction **Too Few Data Points to Display**
TOTAL 69 $ 7,200 $ 23,119 $ 59,995 $ 265,689 $ 787,434 $ 231,906
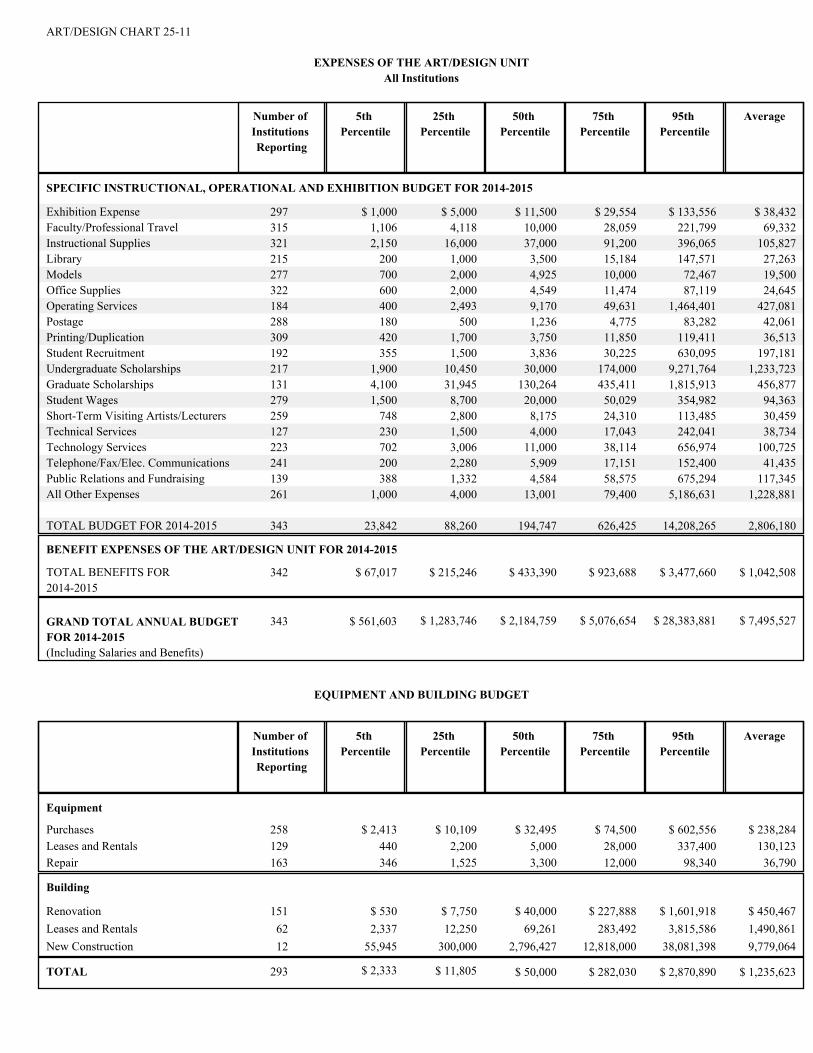
ART/DESIGN CHART 25-11
EXPENSES OF THE ART/DESIGN UNIT
All Institutions
Number of
Institutions
Reporting
5th
Percentile
25th
Percentile
50th
Percentile
75th
Percentile
95th
Percentile
Average
SPECIFIC INSTRUCTIONAL, OPERATIONAL AND EXHIBITION BUDGET FOR 2014-2015
Exhibition Expense 297 $ 1,000 $ 5,000 $ 11,500 $ 29,554 $ 133,556 $ 38,432
Faculty/Professional Travel 315 1,106 4,118 10,000 28,059 221,799 69,332
Instructional Supplies 321 2,150 16,000 37,000 91,200 396,065 105,827
Library 215 200 1,000 3,500 15,184 147,571 27,263
Models 277 700 2,000 4,925 10,000 72,467 19,500
Office Supplies 322 600 2,000 4,549 11,474 87,119 24,645
Operating Services 184 400 2,493 9,170 49,631 1,464,401 427,081
Postage 288 180 500 1,236 4,775 83,282 42,061
Printing/Duplication 309 420 1,700 3,750 11,850 119,411 36,513
Student Recruitment 192 355 1,500 3,836 30,225 630,095 197,181
Undergraduate Scholarships 217 1,900 10,450 30,000 174,000 9,271,764 1,233,723
Graduate Scholarships 131 4,100 31,945 130,264 435,411 1,815,913 456,877
Student Wages 279 1,500 8,700 20,000 50,029 354,982 94,363
Short-Term Visiting Artists/Lecturers 259 748 2,800 8,175 24,310 113,485 30,459
Technical Services 127 230 1,500 4,000 17,043 242,041 38,734
Technology Services 223 702 3,006 11,000 38,114 656,974 100,725
Telephone/Fax/Elec. Communications 241 200 2,280 5,909 17,151 152,400 41,435
Public Relations and Fundraising 139 388 1,332 4,584 58,575 675,294 117,345
All Other Expenses 261 1,000 4,000 13,001 79,400 5,186,631 1,228,881
TOTAL BUDGET FOR 2014-2015 343 23,842 88,260 194,747 626,425 14,208,265 2,806,180
BENEFIT EXPENSES OF THE ART/DESIGN UNIT FOR 2014-2015
TOTAL BENEFITS FOR
2014-2015
342 $ 67,017 $ 215,246 $ 433,390 $ 923,688 $ 3,477,660 $ 1,042,508
GRAND TOTAL ANNUAL BUDGET
FOR 2014-2015
(Including Salaries and Benefits)
343 $ 561,603 $ 1,283,746 $ 2,184,759 $ 5,076,654 $ 28,383,881 $ 7,495,527
EQUIPMENT AND BUILDING BUDGET
Number of
Institutions
Reporting
5th
Percentile
25th
Percentile
50th
Percentile
75th
Percentile
95th
Percentile
Average
Equipment
Purchases 258 $ 2,413 $ 10,109 $ 32,495 $ 74,500 $ 602,556 $ 238,284
Leases and Rentals 129 440 2,200 5,000 28,000 337,400 130,123
Repair 163 346 1,525 3,300 12,000 98,340 36,790
Building
Renovation 151 $ 530 $ 7,750 $ 40,000 $ 227,888 $ 1,601,918 $ 450,467
Leases and Rentals 62 2,337 12,250 69,261 283,492 3,815,586 1,490,861
New Construction 12 55,945 300,000 2,796,427 12,818,000 38,081,398 9,779,064
TOTAL 293 $ 2,333 $ 11,805 $ 50,000 $ 282,030 $ 2,870,890 $ 1,235,623

ART/DESIGN CHART 25-12
EXPENSES OF THE ART/DESIGN UNITAll Institutions
Number of Institutions Reporting
5th Percentile
25th Percentile
50th Percentile
75th Percentile
95th Percentile
Average
ACTUAL INSTRUCTIONAL, OPERATIONAL AND EXHIBITION BUDGET FOR 2013-2014
Exhibition Expense 302 $ 635 $ 4,700 $ 10,481 $ 29,074 $ 130,416 $ 38,571Faculty/Professional Travel 319 1,030 3,708 11,000 29,852 237,172 72,213Instructional Supplies 320 2,533 17,401 39,788 94,281 344,515 108,743Library 224 171 854 3,890 16,736 180,219 30,872Models 278 690 1,922 4,591 9,988 69,141 19,374Office Supplies 328 494 1,969 4,397 11,189 93,420 29,083Operating Services 180 352 2,435 8,815 61,800 2,078,772 448,415Postage 304 79 413 1,165 3,998 85,303 41,340Printing/Duplication 311 436 1,686 4,010 11,318 149,200 34,537Student Recruitment 184 270 1,248 3,022 36,414 684,219 202,264Undergraduate Scholarships 213 2,476 9,300 25,000 168,000 8,848,257 1,225,755Graduate Scholarships 130 3,870 25,750 125,750 441,474 1,762,069 426,742Student Wages 278 1,489 7,801 21,850 51,722 358,112 91,963Short-Term Visiting Artists/Lecturers 260 646 2,500 8,000 25,013 135,295 42,002Technical Services 129 238 1,000 5,000 17,857 210,237 40,761Technology Services 228 313 2,761 9,202 38,801 484,708 88,826Telephone/Fax/Elec. Communications 247 115 1,959 5,940 17,842 164,616 39,471Public Relations and Fundraising 138 309 1,104 5,000 55,900 603,759 124,709All Other Expenses 264 611 4,442 14,739 72,110 5,656,429 1,191,904 TOTAL BUDGET FOR 2013-2014 340 25,398 83,434 196,987 641,660 13,513,956 2,802,048
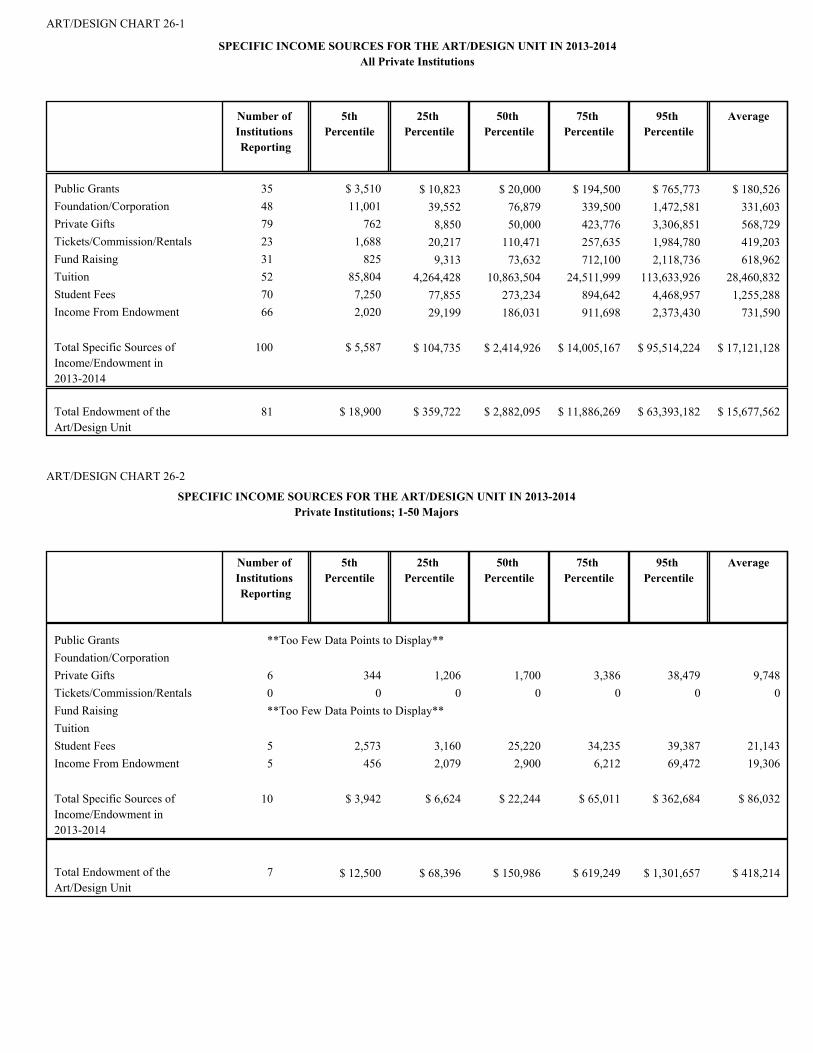
ART/DESIGN CHART 26-1
SPECIFIC INCOME SOURCES FOR THE ART/DESIGN UNIT IN 2013-2014
All Private Institutions
Number of
Institutions
Reporting
5th
Percentile
25th
Percentile
50th
Percentile
75th
Percentile
95th
Percentile
Average
Public Grants 35 $ 3,510 $ 10,823 $ 20,000 $ 194,500 $ 765,773 $ 180,526
Foundation/Corporation 48 11,001 39,552 76,879 339,500 1,472,581 331,603
Private Gifts 79 762 8,850 50,000 423,776 3,306,851 568,729
Tickets/Commission/Rentals 23 1,688 20,217 110,471 257,635 1,984,780 419,203
Fund Raising 31 825 9,313 73,632 712,100 2,118,736 618,962
Tuition 52 85,804 4,264,428 10,863,504 24,511,999 113,633,926 28,460,832
Student Fees 70 7,250 77,855 273,234 894,642 4,468,957 1,255,288
Income From Endowment 66 2,020 29,199 186,031 911,698 2,373,430 731,590
Total Specific Sources of
Income/Endowment in
2013-2014
100 $ 5,587 $ 104,735 $ 2,414,926 $ 14,005,167 $ 95,514,224 $ 17,121,128
Total Endowment of the
Art/Design Unit
81 $ 18,900 $ 359,722 $ 2,882,095 $ 11,886,269 $ 63,393,182 $ 15,677,562
ART/DESIGN CHART 26-2
SPECIFIC INCOME SOURCES FOR THE ART/DESIGN UNIT IN 2013-2014
Private Institutions; 1-50 Majors
Number of
Institutions
Reporting
5th
Percentile
25th
Percentile
50th
Percentile
75th
Percentile
95th
Percentile
Average
Public Grants **Too Few Data Points to Display**Foundation/Corporation
Private Gifts 6 344 1,206 1,700 3,386 38,479 9,748
Tickets/Commission/Rentals 0 0 0 0 0 0 0
Fund Raising **Too Few Data Points to Display**Tuition
Student Fees 5 2,573 3,160 25,220 34,235 39,387 21,143
Income From Endowment 5 456 2,079 2,900 6,212 69,472 19,306
Total Specific Sources of
Income/Endowment in
2013-2014
10 $ 3,942 $ 6,624 $ 22,244 $ 65,011 $ 362,684 $ 86,032
Total Endowment of the
Art/Design Unit
7 $ 12,500 $ 68,396 $ 150,986 $ 619,249 $ 1,301,657 $ 418,214

ART/DESIGN CHART 26-3
SPECIFIC INCOME SOURCES FOR THE ART/DESIGN UNIT IN 2013-2014
Private Institutions; 51-100 Majors
Number of
Institutions
Reporting
5th
Percentile
25th
Percentile
50th
Percentile
75th
Percentile
95th
Percentile
Average
Public Grants 0 $ 0 $ 0 $ 0 $ 0 $ 0 $ 0
Foundation/Corporation **Too Few Data Points to Display**Private Gifts 4 627 735 1,702 3,892 6,938 2,926
Tickets/Commission/Rentals 0 0 0 0 0 0 0
Fund Raising **Too Few Data Points to Display**Tuition 0 0 0 0 0 0 0
Student Fees **Too Few Data Points to Display**Income From Endowment 4 16,278 28,484 38,940 69,755 130,821 59,299
Total Specific Sources of
Income/Endowment in
2013-2014
7 $ 2,226 $ 9,414 $ 57,703 $ 141,931 $ 701,942 $ 181,454
Total Endowment of the
Art/Design Unit
6 $ 67,025 $ 186,959 $ 499,244 $ 757,686 $ 2,899,425 $ 928,592
ART/DESIGN CHART 26-4
SPECIFIC INCOME SOURCES FOR THE ART/DESIGN UNIT IN 2013-2014
Private Institutions; 101-200 Majors
Number of
Institutions
Reporting
5th
Percentile
25th
Percentile
50th
Percentile
75th
Percentile
95th
Percentile
Average
Public Grants 9 $ 2,826 $ 4,000 $ 5,000 $ 10,000 $ 141,200 $ 30,822
Foundation/Corporation 10 8,534 29,927 47,757 68,728 150,500 60,223
Private Gifts 17 2,631 7,494 26,353 42,173 212,940 65,289
Tickets/Commission/Rentals 7 2,164 7,040 14,000 41,207 165,716 45,929
Fund Raising 9 727 6,000 52,818 210,000 932,910 231,054
Tuition 12 48,984 134,115 3,667,831 5,084,682 6,953,673 3,219,714
Student Fees 15 8,500 71,035 178,759 319,560 558,084 225,493
Income From Endowment 12 890 5,249 27,907 337,355 1,834,085 382,506
Total Specific Sources of
Income/Endowment in
2013-2014
23 $ 10,015 $ 44,432 $ 177,129 $ 5,140,863 $ 7,438,354 $ 2,217,372
Total Endowment of the
Art/Design Unit
16 $ 9,794 $ 189,542 $ 516,108 $ 1,074,402 $ 13,665,403 $ 3,540,528

ART/DESIGN CHART 26-5
SPECIFIC INCOME SOURCES FOR THE ART/DESIGN UNIT IN 2013-2014
Private Institutions; 201+ Majors
Number of
Institutions
Reporting
5th
Percentile
25th
Percentile
50th
Percentile
75th
Percentile
95th
Percentile
Average
Public Grants 25 $ 7,912 $ 17,625 $ 70,000 $ 256,559 $ 838,892 $ 241,061
Foundation/Corporation 35 12,001 46,500 106,854 392,135 1,946,114 410,426
Private Gifts 52 2,018 32,272 208,133 667,948 3,632,364 841,337
Tickets/Commission/Rentals 16 16,269 63,500 166,087 1,156,498 2,054,179 582,511
Fund Raising 20 5,388 26,643 299,747 1,138,164 2,658,402 855,164
Tuition 39 882,489 8,679,268 15,112,710 42,452,047 139,712,322 36,942,862
Student Fees 48 32,136 170,438 625,184 1,636,250 8,010,824 1,755,949
Income From Endowment 45 10,378 112,262 228,459 1,422,000 3,259,036 963,581
Total Specific Sources of
Income/Endowment in
2013-2014
60 $ 104,892 $ 675,104 $ 9,884,000 $ 25,415,530 $ 109,463,512 $ 27,649,712
Total Endowment of the
Art/Design Unit
52 $ 138,351 $ 2,187,328 $ 8,286,372 $ 22,293,599 $ 71,290,750 $ 23,167,981
ART/DESIGN CHART 26-6
SPECIFIC INCOME SOURCES FOR THE ART/DESIGN UNIT IN 2013-2014
All Public Institutions
Number of
Institutions
Reporting
5th
Percentile
25th
Percentile
50th
Percentile
75th
Percentile
95th
Percentile
Average
Public Grants 54 $ 1,594 $ 5,950 $ 17,550 $ 53,608 $ 374,834 $ 114,360
Foundation/Corporation 87 973 5,492 25,000 86,512 504,430 176,450
Private Gifts 154 503 2,406 8,280 37,372 417,088 91,709
Tickets/Commission/Rentals 29 408 1,500 4,000 5,800 25,978 8,791
Fund Raising 60 1,057 4,375 9,682 23,650 282,595 505,724
Tuition 52 7,526 26,163 102,984 295,328 8,774,261 1,323,084
Student Fees 151 6,325 26,365 61,430 150,335 494,678 268,360
Income From Endowment 152 1,543 6,000 24,712 77,645 366,834 94,509
Total Specific Sources of
Income/Endowment in
2013-2014
218 $ 4,016 $ 36,595 $ 116,807 $ 323,602 $ 1,791,217 $ 871,155
Total Endowment of the
Art/Design Unit
184 $ 15,750 $ 91,603 $ 356,184 $ 1,266,939 $ 6,741,962 $ 5,182,850

ART/DESIGN CHART 26-7
SPECIFIC INCOME SOURCES FOR THE ART/DESIGN UNIT IN 2013-2014
Public Institutions; 1-100 Majors
Number of
Institutions
Reporting
5th
Percentile
25th
Percentile
50th
Percentile
75th
Percentile
95th
Percentile
Average
Public Grants 3 $ 10,605 $ 11,225 $ 12,000 $ 37,046 $ 57,082 $ 28,180
Foundation/Corporation 4 1,900 5,500 7,500 8,250 8,850 6,250
Private Gifts 13 256 1,000 3,250 26,150 67,568 18,735
Tickets/Commission/Rentals **Too Few Data Points to Display**Fund Raising
Tuition 3 17,223 22,116 28,231 35,851 41,947 29,234
Student Fees 14 3,810 6,738 15,383 20,196 54,732 18,278
Income From Endowment 13 3,848 5,840 8,900 18,168 34,317 13,735
Total Specific Sources of
Income/Endowment in
2013-2014
24 $ 1,265 $ 10,700 $ 21,864 $ 52,036 $ 106,660 $ 35,777
Total Endowment of the
Art/Design Unit
19 $ 8,036 $ 23,873 $ 86,869 $ 343,063 $ 950,998 $ 236,057
ART/DESIGN CHART 26-8
SPECIFIC INCOME SOURCES FOR THE ART/DESIGN UNIT IN 2013-2014
Public Institutions; 101-200 Majors
Number of
Institutions
Reporting
5th
Percentile
25th
Percentile
50th
Percentile
75th
Percentile
95th
Percentile
Average
Public Grants 11 $ 3,155 $ 7,500 $ 31,990 $ 89,250 $ 106,437 $ 46,351
Foundation/Corporation 16 747 3,375 6,142 42,500 163,250 38,617
Private Gifts 32 433 1,818 3,628 7,603 50,400 12,527
Tickets/Commission/Rentals **Too Few Data Points to Display**Fund Raising 14 1,270 3,175 8,093 11,988 23,700 9,009
Tuition 10 4,407 14,789 39,094 74,022 1,987,563 392,480
Student Fees 33 6,400 24,000 39,997 50,516 71,601 38,001
Income From Endowment 30 1,536 2,625 12,200 54,690 140,921 35,354
Total Specific Sources of
Income/Endowment in
2013-2014
52 $ 2,775 $ 13,183 $ 48,645 $ 128,053 $ 437,936 $ 152,001
Total Endowment of the
Art/Design Unit
36 $ 30,847 $ 74,655 $ 198,281 $ 522,588 $ 1,681,809 $ 910,938

ART/DESIGN CHART 26-9
SPECIFIC INCOME SOURCES FOR THE ART/DESIGN UNIT IN 2013-2014
Public Institutions; 201-400 Majors
Number of
Institutions
Reporting
5th
Percentile
25th
Percentile
50th
Percentile
75th
Percentile
95th
Percentile
Average
Public Grants 17 $ 732 $ 4,337 $ 12,500 $ 20,000 $ 279,468 $ 54,646
Foundation/Corporation 21 500 6,000 25,000 67,000 151,787 47,531
Private Gifts 48 590 2,514 9,725 33,388 100,892 90,509
Tickets/Commission/Rentals 7 856 2,670 3,000 4,250 12,477 4,698
Fund Raising 17 956 5,054 9,363 16,000 71,649 21,739
Tuition 18 8,963 53,535 127,258 154,380 1,120,799 236,705
Student Fees 49 20,910 52,000 89,196 150,000 234,079 116,251
Income From Endowment 56 2,000 9,953 24,168 51,461 166,718 77,990
Total Specific Sources of
Income/Endowment in
2013-2014
68 $ 13,270 $ 63,917 $ 150,327 $ 268,177 $ 1,334,242 $ 308,801
Total Endowment of the
Art/Design Unit
61 $ 22,678 $ 138,042 $ 466,786 $ 1,107,000 $ 5,018,455 $ 12,137,754
ART/DESIGN CHART 26-10
SPECIFIC INCOME SOURCES FOR THE ART/DESIGN UNIT IN 2013-2014
Public Institutions; 401+ Majors
Number of
Institutions
Reporting
5th
Percentile
25th
Percentile
50th
Percentile
75th
Percentile
95th
Percentile
Average
Public Grants 23 $ 2,050 $ 7,550 $ 26,500 $ 53,406 $ 393,672 $ 202,263
Foundation/Corporation 46 1,500 9,775 51,132 143,734 715,988 298,047
Private Gifts 61 1,325 3,598 20,000 106,038 589,293 149,743
Tickets/Commission/Rentals 18 822 1,625 4,985 12,878 37,831 11,722
Fund Raising 27 1,448 5,000 17,100 44,000 6,069,491 1,105,225
Tuition 21 11,500 30,000 276,575 4,091,261 11,925,272 2,882,246
Student Fees 55 7,210 50,216 147,900 305,177 1,015,304 605,747
Income From Endowment 53 1,500 7,300 51,000 253,357 450,408 165,260
Total Specific Sources of
Income/Endowment in
2013-2014
74 $ 10,650 $ 98,017 $ 322,556 $ 956,618 $ 15,932,336 $ 2,164,198
Total Endowment of the
Art/Design Unit
68 $ 32,545 $ 173,016 $ 633,299 $ 2,525,241 $ 11,176,309 $ 2,587,685

ART/DESIGN CHART 26-11
SPECIFIC INCOME SOURCES FOR THE ART/DESIGN UNIT IN 2013-2014
All Institutions
Number of
Institutions
Reporting
5th
Percentile
25th
Percentile
50th
Percentile
75th
Percentile
95th
Percentile
Average
Public Grants 89 $ 2,176 $ 8,015 $ 20,000 $ 86,500 $ 455,404 $ 140,380
Foundation/Corporation 135 1,350 9,350 48,000 143,500 879,788 231,616
Private Gifts 233 568 2,942 15,000 86,000 1,166,790 253,445
Tickets/Commission/Rentals 52 750 2,951 8,569 76,299 1,372,170 190,320
Fund Raising 91 935 5,000 12,000 69,714 1,562,694 544,300
Tuition 104 10,130 83,158 1,442,422 11,638,277 85,078,100 14,891,958
Student Fees 221 6,000 38,100 80,000 253,000 1,962,142 580,962
Income From Endowment 218 1,567 7,316 38,019 174,049 1,694,405 287,387
Total Specific Sources of
Income/Endowment in
2013-2014
318 $ 4,260 $ 46,063 $ 151,896 $ 757,585 $ 25,411,300 $ 5,981,209
Total Endowment of the
Art/Design Unit
265 $ 15,780 $ 123,373 $ 524,165 $ 2,365,800 $ 27,101,992 $ 8,390,668

Higher Education Arts Data Services DATA SUMMARIES
2014-2015
DEMOGRAPHIC SURVEY OF ART/DESIGN GRADUATE STUDENTS
Charts 27 and 28 provide demographic information about Master of Fine Arts and doctoral students in art/design. Chart 27-1 includes Master of Fine Arts students who graduated in 2013-2014. Chart 27-2 includes Master of Fine Arts students who were enrolled but did not graduate in 2013-2014. Charts 28-1 and 28-2 provide the same information for doctoral students.
Example: Chart 27-1 – “Demographic Survey of Master of Fine Arts Degree Students Who Graduated in 2013-2014.” Thirteen institutions graduated a total of 155 Master of Fine Arts students in Industrial Design. Among these were 3 Black/African-American males; 2 Black/African-American females; 0 American Indian or Alaskan Native males; 1 American Indian or Alaskan Native female; 15 Asian males; 13 Asian females; 5 Hispanic males; 2 Hispanic females; 0 Native Hawaiian/Pacific Islander males; 0 Native Hawaiian/Pacific Islander females; 49 White males; 28 White females; 15 males of other race or unknown ethnicity; and 22 females of other race or unknown ethnicity.

ART/DESIGN CHART 27-1
DEMOGRAPHIC SURVEY OF MFA STUDENTS WHO GRADUATED IN 2013-2014
Institutions
Reporting
TotalM F M F M F M F M F M F M F
Black/
African-
American
American
Indian/
Alaska Native
Asian Hispanic
(of any race)
Native
Hawaiian/
Pacific
Islander
White Other/
Ethnicity
Unknown
Advertising Design 2 0 1 0 0 1 3 2 3 0 0 7 9 7 32 65
Animation 3 4 1 0 0 10 4 6 2 0 0 28 13 75 62 205
Ceramics 30 0 0 1 0 3 4 0 0 0 0 21 37 3 5 74
Communication
Design (Graphic
Design, Visual
Communication
Design)
29 5 8 0 0 9 41 7 9 0 0 38 62 17 46 242
Design 9 3 6 0 2 8 40 1 10 1 0 39 64 19 37 230
Drawing 11 0 0 0 0 1 1 1 1 0 0 8 6 9 11 38
Environmental
Design
7 0 0 0 0 0 2 1 0 0 0 2 8 0 0 13
Fashion Design 3 0 0 0 0 1 5 0 0 0 1 3 5 1 0 16
Fashion Illustration 4 0 7 0 1 1 7 2 8 0 1 4 24 11 151 217
Fiber 4 0 1 0 0 0 2 0 1 0 0 1 7 0 1 13
Film 10 4 2 0 0 26 16 9 9 1 0 67 38 22 15 209
Furniture Design 3 0 0 0 0 1 0 1 0 0 0 6 2 5 4 19
General Crafts 3 3 0 0 0 0 1 0 0 0 0 4 12 1 4 25
Glassworking 6 0 1 0 0 0 0 1 0 0 0 6 2 3 4 17
Illustration 9 2 0 0 0 6 11 2 1 0 0 28 20 25 43 138
Industrial Design 13 3 2 0 1 15 13 5 2 0 0 49 28 15 22 155
Interior Design 11 1 3 0 0 3 24 4 9 0 0 11 53 32 61 201
Jewelry/Fine
Metals
15 0 1 0 0 0 5 0 2 0 0 7 15 2 10 42
Painting 47 3 6 1 2 5 3 4 5 0 0 87 92 22 29 259
Photography 37 1 2 2 1 8 8 8 7 0 0 68 62 48 39 254
Printmaking 33 1 0 0 0 0 3 2 2 0 0 23 30 1 8 70
Product Design 2 0 0 0 0 0 0 0 0 0 0 0 2 1 0 3
Sculpture 36 0 0 0 0 1 2 2 3 1 0 38 32 12 6 97
Studio Arts 38 8 7 1 3 11 25 13 12 3 2 138 167 48 96 534
Textile
Design/Weaving
3 0 0 0 0 0 0 0 0 0 0 0 9 0 2 11
Theatre Design 0 0 0 0 0 0 0 0 0 0 0 0 0 0 0 0
Video 3 4 1 1 0 3 2 0 2 0 0 10 8 25 29 85
Visual
Communications
5 1 0 0 0 0 5 0 1 0 0 9 10 4 1 31
Other 51 9 20 5 6 54 68 21 30 6 3 152 275 121 159 929
Total 140 52 69 11 16 167 295 92 118 12 7 854 1,092 529 877 4,191

ART/DESIGN CHART 27-2
DEMOGRAPHIC SURVEY OF MFA STUDENTS WHO WERE ENROLLED BUT DID NOT GRADUATE IN 2013-2014
Institutions
Reporting
TotalM F M F M F M F M F M F M F
Black/
African-
American
American
Indian/
Alaska Native
Asian Hispanic
(of any race)
Native
Hawaiian/
Pacific
Islander
White Other/Race
Ethnicity
Unknown
Advertising Design 1 2 8 0 0 2 3 5 3 0 0 5 27 70 85 210
Animation 3 23 10 3 0 18 19 23 8 2 0 77 49 238 177 647
Ceramics 35 2 0 0 0 5 4 3 3 0 0 58 60 14 13 162
Communication
Design (Graphic
Design, Visual
Communication
Design)
35 12 12 0 1 27 49 13 35 0 2 85 148 91 244 719
Design 12 11 13 1 2 21 48 12 13 0 0 57 82 48 80 388
Drawing 8 4 3 1 0 11 9 3 7 0 0 28 22 36 46 170
Environmental
Design
11 0 0 0 0 3 3 0 1 0 0 10 11 1 3 32
Fashion Design 3 0 1 0 0 4 5 2 0 0 0 7 17 2 11 49
Fashion Illustration 4 12 106 0 1 4 39 7 28 0 2 6 74 58 400 737
Fiber 7 0 1 0 0 0 1 0 2 0 0 1 18 0 1 24
Film 10 12 6 2 3 35 36 22 16 2 0 107 60 70 55 426
Furniture Design 4 0 0 0 0 0 0 0 0 0 0 6 5 5 6 22
General Crafts 3 1 1 0 0 0 0 0 0 0 0 6 11 2 5 26
Glassworking 4 0 0 0 0 0 1 0 0 0 0 5 6 3 2 17
Illustration 10 8 5 1 1 13 26 12 12 0 0 70 87 83 159 477
Industrial Design 14 8 7 0 0 31 41 24 6 2 0 86 46 113 94 458
Interior Design 14 2 18 0 2 15 43 3 22 2 1 25 160 85 207 585
Jewelry/Fine
Metals
24 0 1 0 1 2 14 1 3 0 0 26 37 7 34 126
Painting 50 8 11 1 1 8 7 14 12 2 1 89 131 17 32 334
Photography 46 19 14 0 0 25 24 16 26 0 1 129 218 116 137 725
Printmaking 38 1 3 0 0 1 1 7 4 1 1 44 70 3 7 143
Product Design 0 0 0 0 0 0 0 0 0 0 0 0 0 0 0 0
Sculpture 48 1 0 1 2 5 1 3 7 0 0 59 57 6 13 155
Studio Arts 37 18 20 2 8 24 45 38 40 3 2 195 302 99 181 977
Textile
Design/Weaving
5 0 0 0 0 0 1 0 1 0 0 0 9 1 5 17
Theatre Design 0 0 0 0 0 0 0 0 0 0 0 0 0 0 0 0
Video 2 25 18 2 1 9 4 11 5 1 0 52 30 118 103 379
Visual
Communications
7 2 2 0 1 3 7 1 1 0 0 24 14 8 12 75
Other 53 44 35 8 5 80 112 41 45 11 9 260 388 282 380 1,700
Total 140 215 295 22 29 346 543 261 300 26 19 1,517 2,139 1,576 2,492 9,780

ART/DESIGN CHART 28-1
DEMOGRAPHIC SURVEY OF DOCTORAL STUDENTS WHO GRADUATED IN 2013-2014
Institutions
Reporting
TotalM F M F M F M F M F M F M F
Black/
African-
American
American
Indian/
Alaska Native
Asian Hispanic
(of any race)
Native
Hawaiian/
Pacific
Islander
White Other/Race
Ethnicity
Unknown
Art History and
Criticism
8 0 0 0 0 0 0 1 1 0 0 3 33 1 2 41
Art Education 8 1 2 0 0 3 1 0 1 0 0 4 15 1 1 29
Other 3 0 0 0 0 0 0 2 0 0 0 6 4 1 1 14
Total 16 1 2 0 0 3 1 3 2 0 0 13 52 3 4 84

ART/DESIGN CHART 28-2
DEMOGRAPHIC SURVEY OF DOCTORAL STUDENTS WHO WERE ENROLLED BUT DID NOT GRADUATE IN 2013-2014
Institutions
Reporting
TotalM F M F M F M F M F M F M F
Black/
African-
American
American
Indian/
Alaska Native
Asian Hispanic
(of any race)
Native
Hawaiian/
Pacific
Islander
White Other/
Ethnicity
Unknown
Art History and
Criticism
10 2 3 0 1 1 8 3 13 0 2 16 106 6 8 169
Art Education 7 4 4 1 4 1 10 4 3 0 0 17 76 5 16 145
Other 6 1 1 0 0 3 12 3 2 0 0 13 24 4 7 70
Total 18 7 8 1 5 5 30 10 18 0 2 46 206 15 31 384

Higher Education Arts Data Services
DATA SUMMARIES 2014-2015
ART/DESIGN RATIOS
Charts 35 through 40, and Chart 43 provide further calculations of data derived from the data survey. Each chart correlates two aspects of the art/design unit's operation in order to make operational and budgetary comparisons.
Chart 35 provides semester and quarter credit hour production per FTE faculty member, including both full- and part-time faculty.
Chart 36 provides instructional salaries for both full- and part-time faculty per semester and quarter credit hour.
Chart 37 provides total expenditures per semester and quarter credit hour production.
There are two parts to each of these three charts: one for institutions reporting semester credit hour systems and one for institutions reporting quarter credit hour systems.
Example: Chart 37 – “Total Expenditures Per Semester Credit Hour,” Public Institutions, 1-100 Art/Design Majors.
At 31 institutions in this category, the average expenditure per semester credit hour was $352. The percentile rankings are also provided.
Charts 38 through 40, and Chart 43 provide ratios using total number of art/design majors as their bases. The figures used to develop the ratios are reflected in “Total Expenditures Per Art/Design Major Student” (Chart 38), “Number of Art/Design Majors Per Full-Time Faculty Member” (Chart 39), “Number of Art/Design Majors Per FTE Faculty Member” (Chart 40), and “Average Instructional Salary (Full- and Part-Time) Per Art/Design Major Student” (Chart 43). Each of these charts is presented in two versions: one covers institutions divided by size and type, and the other is based on the highest degree offered in art/design.
Example: Chart 39 – “Number of Art/Design Majors Per Full-Time Faculty Member,” Highest Degree Offered in Art/Design: Baccalaureate. At 124 baccalaureate degree-granting institutions, the average number of art/design majors per full-time faculty member is 17.1. The percentile rankings are also provided.

ART/DESIGN CHART 35
SEMESTER CREDIT HOURS PRODUCTION PER FTE FACULTY MEMBER
(Institutions that Use a Semester-Hour System)
Number of
Institutions
Reporting
5th
Percentile
25th
Percentile
50th
Percentile
75th
Percentile
95th
Percentile
Average
Private Institutions
1-50 Art/Design Majors 10 148.4 177.5 187.4 277.2 399.6 233.6
51-100 Art/Design Majors 8 187.6 208.2 263.4 384.6 450.4 297.6
101-200 Art/Design Majors 27 128.9 198.4 234.1 308.5 375.9 243.5
201+ Art/Design Majors 58 134.4 177.1 207.9 265.8 362.7 324.1
Public Institutions
1-100 Art/Design Majors 31 132.7 208.9 279.5 382.4 483.1 297.3
101-200 Art/Design Majors 55 159.7 257.5 312.9 395.5 486.2 324.0
201-400 Art/Design Majors 70 226.0 280.1 330.6 423.4 564.5 359.9
401+ Art/Design Majors 75 221.4 269.5 353.6 401.6 596.1 356.1
All Institutions 334 147.4 228.2 297.9 376.5 517.8 326.4
HIGHEST DEGREE OFFERED
Associate 29 227.8 275.9 306.0 373.1 502.1 326.3
Baccalaureate 120 146.8 206.4 302.4 379.5 486.1 308.7
Master's (Non-MFA) 43 120.0 226.1 269.8 371.8 437.6 293.5
MFA 125 173.7 222.0 288.7 388.3 591.1 359.9
Doctorate 17 204.0 233.5 251.1 323.8 446.3 288.1
QUARTER CREDIT HOURS PRODUCTION PER FTE FACULTY MEMBER
(Institutions that Use a Quarter-Hour System)
Number of
Institutions
Reporting
5th
Percentile
25th
Percentile
50th
Percentile
75th
Percentile
95th
Percentile
Average
Private Institutions
1-50 Art/Design Majors 1 727.0 727.0 727.0 727.0 727.0 727.0
51-100 Art/Design Majors 0 0.0 0.0 0.0 0.0 0.0 0.0
101-200 Art/Design Majors 0 0.0 0.0 0.0 0.0 0.0 0.0
201+ Art/Design Majors 4 286.7 324.8 420.6 542.5 643.3 446.7
Public Institutions
1-100 Art/Design Majors 1 282.0 282.0 282.0 282.0 282.0 282.0
101-200 Art/Design Majors 0 0.0 0.0 0.0 0.0 0.0 0.0
201-400 Art/Design Majors 1 585.4 585.4 585.4 585.4 585.4 585.4
401+ Art/Design Majors 4 515.1 518.5 667.9 991.6 1413.2 842.2
All Institutions 11 279.6 420.6 519.9 697.8 1167.3 613.6
HIGHEST DEGREE OFFERED
Associate 1 340.7 340.7 340.7 340.7 340.7 340.7
Baccalaureate 5 342.7 585.4 668.5 727.0 1360.3 756.3
Master's (Non-MFA) 1 500.5 500.5 500.5 500.5 500.5 500.5
MFA 3 300.9 395.7 514.2 665.1 785.8 535.8
Doctorate 1 519.9 519.9 519.9 519.9 519.9 519.9
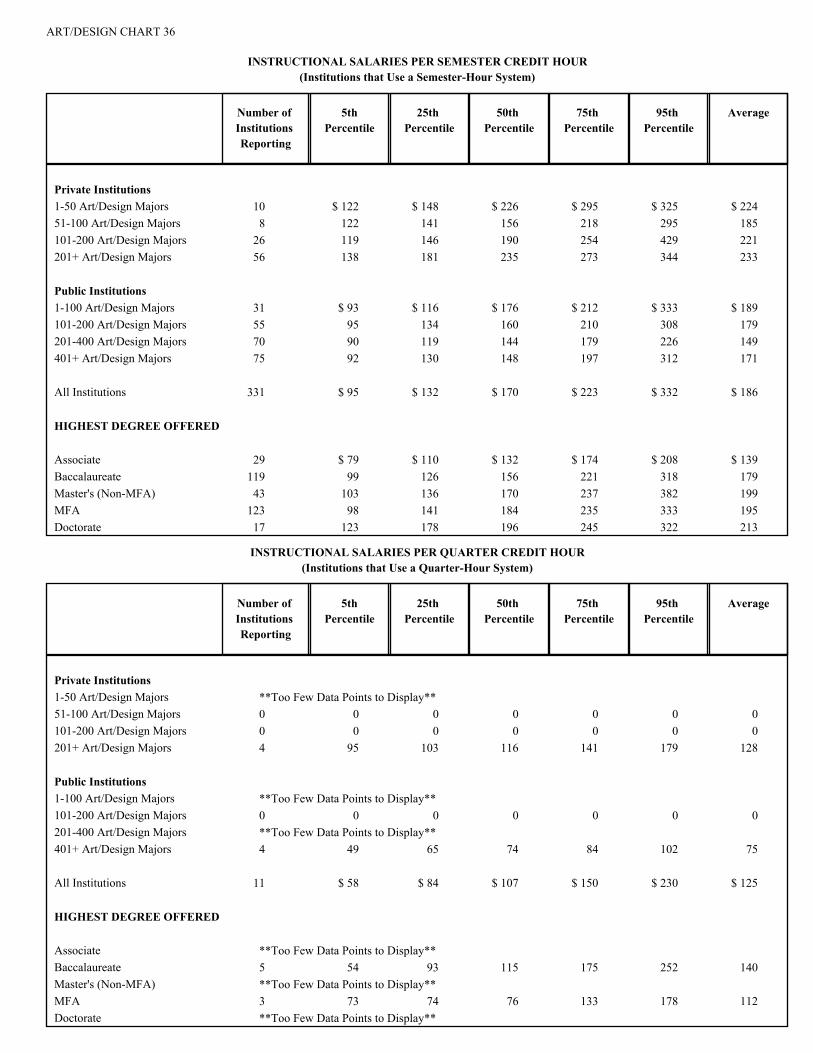
ART/DESIGN CHART 36
INSTRUCTIONAL SALARIES PER SEMESTER CREDIT HOUR
(Institutions that Use a Semester-Hour System)
Number of
Institutions
Reporting
5th
Percentile
25th
Percentile
50th
Percentile
75th
Percentile
95th
Percentile
Average
Private Institutions
1-50 Art/Design Majors 10 $ 122 $ 148 $ 226 $ 295 $ 325 $ 224
51-100 Art/Design Majors 8 122 141 156 218 295 185
101-200 Art/Design Majors 26 119 146 190 254 429 221
201+ Art/Design Majors 56 138 181 235 273 344 233
Public Institutions
1-100 Art/Design Majors 31 $ 93 $ 116 $ 176 $ 212 $ 333 $ 189
101-200 Art/Design Majors 55 95 134 160 210 308 179
201-400 Art/Design Majors 70 90 119 144 179 226 149
401+ Art/Design Majors 75 92 130 148 197 312 171
All Institutions 331 $ 95 $ 132 $ 170 $ 223 $ 332 $ 186
HIGHEST DEGREE OFFERED
Associate 29 $ 79 $ 110 $ 132 $ 174 $ 208 $ 139
Baccalaureate 119 99 126 156 221 318 179
Master's (Non-MFA) 43 103 136 170 237 382 199
MFA 123 98 141 184 235 333 195
Doctorate 17 123 178 196 245 322 213
INSTRUCTIONAL SALARIES PER QUARTER CREDIT HOUR
(Institutions that Use a Quarter-Hour System)
Number of
Institutions
Reporting
5th
Percentile
25th
Percentile
50th
Percentile
75th
Percentile
95th
Percentile
Average
Private Institutions
1-50 Art/Design Majors **Too Few Data Points to Display**51-100 Art/Design Majors 0 0 0 0 0 0 0
101-200 Art/Design Majors 0 0 0 0 0 0 0
201+ Art/Design Majors 4 95 103 116 141 179 128
Public Institutions
1-100 Art/Design Majors **Too Few Data Points to Display**101-200 Art/Design Majors 0 0 0 0 0 0 0
201-400 Art/Design Majors **Too Few Data Points to Display**401+ Art/Design Majors 4 49 65 74 84 102 75
All Institutions 11 $ 58 $ 84 $ 107 $ 150 $ 230 $ 125
HIGHEST DEGREE OFFERED
Associate **Too Few Data Points to Display**Baccalaureate 5 54 93 115 175 252 140
Master's (Non-MFA) **Too Few Data Points to Display**MFA 3 73 74 76 133 178 112
Doctorate **Too Few Data Points to Display**

ART/DESIGN CHART 37
TOTAL EXPENDITURES PER SEMESTER CREDIT HOUR
(Institutions that Use a Semester-Hour System)
Number of
Institutions
Reporting
5th
Percentile
25th
Percentile
50th
Percentile
75th
Percentile
95th
Percentile
Average
Private Institutions
1-50 Art/Design Majors 10 $ 252 $ 301 $ 487 $ 523 $ 790 $ 471
51-100 Art/Design Majors 8 204 257 346 420 544 355
101-200 Art/Design Majors 27 233 362 458 738 2,216 761
201+ Art/Design Majors 58 263 542 958 1,425 1,968 1,051
Public Institutions
1-100 Art/Design Majors 31 $ 182 $ 229 $ 299 $ 438 $ 678 $ 352
101-200 Art/Design Majors 55 178 235 278 352 550 316
201-400 Art/Design Majors 69 164 214 261 324 405 271
401+ Art/Design Majors 75 154 224 284 390 747 350
All Institutions 333 $ 175 $ 238 $ 325 $ 498 $ 1,594 $ 487
HIGHEST DEGREE OFFERED
Associate 29 $ 132 $ 212 $ 230 $ 349 $ 438 $ 298
Baccalaureate 120 172 228 296 471 1,293 421
Master's (Non-MFA) 43 184 240 303 455 1,338 451
MFA 124 191 261 377 754 1,729 617
Doctorate 17 230 332 364 495 804 429
TOTAL EXPENDITURES PER QUARTER CREDIT HOUR
(Institutions that Use a Quarter-Hour System)
Number of
Institutions
Reporting
5th
Percentile
25th
Percentile
50th
Percentile
75th
Percentile
95th
Percentile
Average
Private Institutions
1-50 Art/Design Majors 0 $ 0 $ 0 $ 0 $ 0 $ 0 $ 0
51-100 Art/Design Majors 0 0 0 0 0 0 0
101-200 Art/Design Majors 0 0 0 0 0 0 0
201+ Art/Design Majors 4 265 361 424 504 642 441
Public Institutions
1-100 Art/Design Majors **Too Few Data Points to Display**101-200 Art/Design Majors 0 0 0 0 0 0 0
201-400 Art/Design Majors **Too Few Data Points to Display**401+ Art/Design Majors 4 145 173 217 804 2,131 759
All Institutions 10 $ 159 $ 243 $ 313 $ 435 $ 1,659 $ 543
HIGHEST DEGREE OFFERED
Associate **Too Few Data Points to Display**Baccalaureate 4 269 345 526 1,123 2,195 941
Master's (Non-MFA) **Too Few Data Points to Display**MFA 3 143 161 184 315 420 256
Doctorate **Too Few Data Points to Display**

ART/DESIGN CHART 38
TOTAL EXPENDITURES PER ART/DESIGN MAJOR STUDENT
Number of
Institutions
Reporting
5th
Percentile
25th
Percentile
50th
Percentile
75th
Percentile
95th
Percentile
Average
Private Institutions
1-50 Art/Design Majors 10 $ 8,067 $ 10,800 $ 18,718 $ 30,002 $ 37,795 $ 21,012
51-100 Art/Design Majors 8 8,620 9,170 12,140 16,092 23,883 13,901
101-200 Art/Design Majors 27 5,247 8,874 11,001 20,518 49,214 18,026
201+ Art/Design Majors 62 5,648 11,308 21,844 35,876 43,854 24,288
Public Institutions
1-100 Art/Design Majors 32 $ 4,070 $ 7,728 $ 11,518 $ 14,118 $ 21,633 $ 12,364
101-200 Art/Design Majors 55 4,008 6,735 9,039 11,475 14,795 9,439
201-400 Art/Design Majors 70 4,211 5,721 6,728 9,173 13,897 7,756
401+ Art/Design Majors 79 3,839 4,709 6,632 10,150 15,500 8,644
All Institutions 343 $ 4,013 $ 6,349 $ 9,271 $ 13,890 $ 40,551 $ 12,987
HIGHEST DEGREE OFFERED
Associate 30 $ 2,514 $ 3,862 $ 4,782 $ 9,526 $ 27,926 $ 8,773
Baccalaureate 124 4,427 6,440 9,173 13,758 33,763 12,273
Master's (Non-MFA) 44 5,068 6,398 9,117 11,224 27,202 10,513
MFA 127 4,658 6,749 10,217 16,167 42,706 15,713
Doctorate 18 5,494 8,547 11,983 12,807 18,347 11,739

ART/DESIGN CHART 39
NUMBER OF ART/DESIGN MAJORS PER FULL-TIME FACULTY MEMBER
Number of
Institutions
Reporting
5th
Percentile
25th
Percentile
50th
Percentile
75th
Percentile
95th
Percentile
Average
Private Institutions
1-50 Art/Design Majors 11 4.3 5.8 8.5 12.8 15.3 9.3
51-100 Art/Design Majors 8 9.1 10.5 11.2 13.6 23.4 13.4
101-200 Art/Design Majors 26 10.0 14.6 17.3 26.6 36.9 20.0
201+ Art/Design Majors 61 11.2 16.1 19.9 22.8 37.6 21.2
Public Institutions
1-100 Art/Design Majors 32 5.2 8.0 9.9 12.7 37.1 14.3
101-200 Art/Design Majors 55 9.2 11.9 14.4 18.3 46.8 18.0
201-400 Art/Design Majors 71 11.6 15.0 18.0 21.9 56.4 21.9
401+ Art/Design Majors 79 12.7 17.6 22.4 35.0 56.3 28.3
All Institutions 343 8.0 12.8 17.6 23.3 48.3 21.2
HIGHEST DEGREE OFFERED
Associate 30 7.5 17.8 37.2 56.8 79.3 39.9
Baccalaureate 124 5.9 11.7 15.2 19.9 34.1 17.1
Master's (Non-MFA) 44 9.2 12.5 17.1 23.4 36.3 19.1
MFA 127 10.0 14.8 19.5 22.8 44.4 21.3
Doctorate 18 9.1 13.2 17.2 19.9 49.0 22.6

ART/DESIGN CHART 40
NUMBER OF ART/DESIGN MAJORS PER FTE FACULTY MEMBER
Number of
Institutions
Reporting
5th
Percentile
25th
Percentile
50th
Percentile
75th
Percentile
95th
Percentile
Average
Private Institutions
1-50 Art/Design Majors 9 2.3 3.8 6.2 8.4 11.8 6.4
51-100 Art/Design Majors 8 4.5 6.8 7.8 8.5 10.4 7.6
101-200 Art/Design Majors 27 6.4 7.7 9.9 12.6 16.8 10.4
201+ Art/Design Majors 62 6.4 7.6 9.2 10.9 18.2 13.4
Public Institutions
1-100 Art/Design Majors 32 4.7 6.2 7.6 10.5 22.1 9.6
101-200 Art/Design Majors 55 6.3 8.1 10.9 12.3 17.1 10.8
201-400 Art/Design Majors 71 6.8 10.0 12.6 14.9 18.9 12.8
401+ Art/Design Majors 79 9.1 12.1 15.4 19.0 26.7 16.5
All Institutions 343 6.0 8.3 10.9 14.6 20.7 12.7
HIGHEST DEGREE OFFERED
Associate 30 5.7 11.5 15.3 21.0 28.1 15.9
Baccalaureate 123 5.5 7.5 10.5 13.9 19.5 11.4
Master's (Non-MFA) 44 6.8 9.0 11.0 13.0 14.8 11.0
MFA 128 6.3 8.9 10.6 15.4 20.2 13.9
Doctorate 18 6.0 8.4 9.9 13.0 16.7 10.8

ART/DESIGN CHART 43
AVERAGE INSTRUCTIONAL SALARY (FULL- AND PART-TIME) PER ART/DESIGN MAJOR STUDENT
Number of
Institutions
Reporting
5th
Percentile
25th
Percentile
50th
Percentile
75th
Percentile
95th
Percentile
Average
Private Institutions
1-50 Art/Design Majors 11 $ 3,901 $ 6,035 $ 9,495 $ 13,279 $ 20,813 $ 10,648
51-100 Art/Design Majors 8 4,747 5,330 6,005 7,470 13,318 7,326
101-200 Art/Design Majors 26 2,705 3,675 4,087 6,450 8,771 5,219
201+ Art/Design Majors 60 2,957 4,034 5,121 6,188 8,908 5,409
Public Institutions
1-100 Art/Design Majors 32 $ 2,080 $ 4,373 $ 6,219 $ 7,648 $ 11,923 $ 6,608
101-200 Art/Design Majors 55 2,297 3,747 5,148 7,075 8,438 5,379
201-400 Art/Design Majors 71 2,269 3,245 3,966 5,037 7,321 4,288
401+ Art/Design Majors 79 2,018 2,726 3,501 4,679 6,694 3,851
All Institutions 342 $ 2,256 $ 3,341 $ 4,469 $ 6,132 $ 8,902 $ 5,122
HIGHEST DEGREE OFFERED
Associate 30 $ 1,093 $ 2,143 $ 2,715 $ 4,082 $ 7,654 $ 3,964
Baccalaureate 124 2,422 3,519 4,512 6,639 10,636 5,391
Master's (Non-MFA) 44 2,770 3,482 4,747 6,025 8,176 5,055
MFA 126 2,598 3,652 4,606 5,904 8,603 5,061
Doctorate 18 2,642 4,559 5,888 6,450 9,708 5,794

Higher Education Arts Data Services DATA SUMMARIES
2014-2015
ETHNIC CHARACTERISTICS OF FACULTY AND STUDENTS
Charts 60 and 61 provide information concerning the ethnic breakdown of faculty by rank, and students by degree level.
Example: Chart 60 – “Art/Design Faculty By Rank and Ethnic Characteristics,” All Institutions, Associate Professor.
Two hundred ninety-six institutions reported a total of 2,172 Associate Professors with an ethnic breakdown as follows: 64 Black/African-American males, representing 2.9% of the total faculty; 31 Black/African-American females, representing 1.4% of the total faculty; 2 American Indian or Alaskan Native males, representing 0.1% of the total faculty; 3 American Indian or Alaskan Native females, representing 0.1% of the total faculty; 72 Asian males, representing 3.3% of the total faculty; 75 Asian females, representing 3.5% of the total faculty; 45 Hispanic males, representing 2.1% of the total faculty; 33 Hispanic females, representing 1.5% of the total faculty; 4 Native Hawaiian/Pacific Islander males, representing 0.2% of the total faculty; 0 Native Hawaiian/Pacific Islander females, representing 0.0% of the total faculty; 871 White males, representing 40.1% of the total faculty; 851 White females, representing 39.2% of the total faculty; 66 males of other race or unknown ethnicity, representing 3.0% of the total faculty; and 55 females of other race or unknown ethnicity, representing 2.5% of the total faculty.

ART/DESIGN CHART 60
ART/DESIGN FACULTY BY RANK AND ETHNIC CHARACTERISTICS
Black/
African-
American
American
Indian/
Alaska Native
Asian Hispanic
(of any race)
Native
Hawaiian/
Pacific
Islander
White Other/
Ethnicity
Unknown
Institutions
Reporting
M F M F M F M F M F M F M F Total
Professor
293 44 30 6 2 56 44 28 15 2 2 918 706 68 41 1,962
% 2.2 1.5 0.3 0.1 2.9 2.2 1.4 0.8 0.1 0.1 46.8 36.0 3.5 2.1 100.0
Associate Professor
296 64 31 2 3 72 75 45 33 4 0 871 851 66 55 2,172
% 2.9 1.4 0.1 0.1 3.3 3.5 2.1 1.5 0.2 0.0 40.1 39.2 3.0 2.5 100.0
Assistant Professor
287 33 32 4 4 44 72 38 24 6 1 703 694 91 78 1,824
% 1.8 1.8 0.2 0.2 2.4 3.9 2.1 1.3 0.3 0.1 38.5 38.0 5.0 4.3 100.0
Instructor
107 12 10 2 2 13 15 21 13 0 0 324 272 19 6 709
% 1.7 1.4 0.3 0.3 1.8 2.1 3.0 1.8 0.0 0.0 45.7 38.4 2.7 0.8 100.0
Lecturer
67 11 12 0 1 1 9 5 2 0 0 107 143 12 8 311
% 3.5 3.9 0.0 0.3 0.3 2.9 1.6 0.6 0.0 0.0 34.4 46.0 3.9 2.6 100.0
Unranked
22 14 8 3 1 13 18 8 9 1 3 311 210 35 21 655
% 2.1 1.2 0.5 0.2 2.0 2.7 1.2 1.4 0.2 0.5 47.5 32.1 5.3 3.2 100.0
Visiting Faculty
64 7 2 1 1 0 2 3 4 0 0 72 58 13 10 173
% 4.0 1.2 0.6 0.6 0.0 1.2 1.7 2.3 0.0 0.0 41.6 33.5 7.5 5.8 100.0
Total
337 185 125 18 14 199 235 148 100 13 6 3,306 2,934 304 219 7,806
% 2.4 1.6 0.2 0.2 2.5 3.0 1.9 1.3 0.2 0.1 42.4 37.6 3.9 2.8 100.0
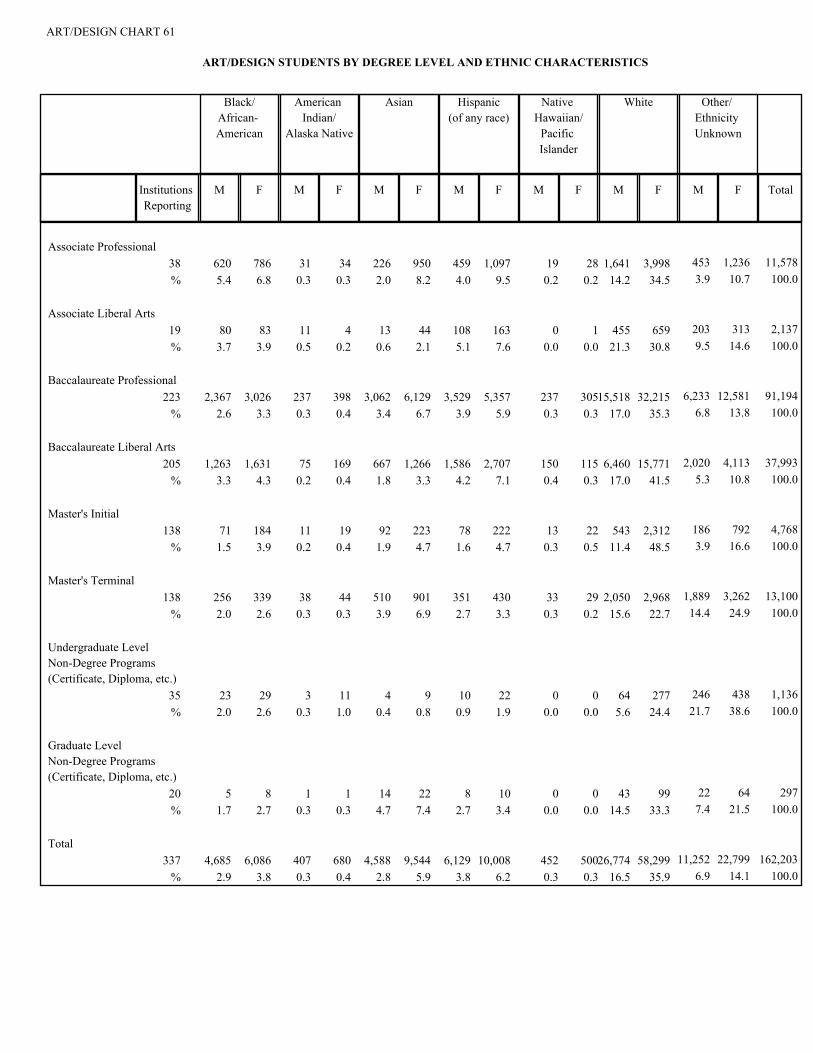
ART/DESIGN CHART 61
ART/DESIGN STUDENTS BY DEGREE LEVEL AND ETHNIC CHARACTERISTICS
Black/
African-
American
American
Indian/
Alaska Native
Asian Hispanic
(of any race)
Native
Hawaiian/
Pacific
Islander
White Other/
Ethnicity
Unknown
Institutions
Reporting
M F M F M F M F M F M F M F Total
Associate Professional
38 620 786 31 34 226 950 459 1,097 19 28 1,641 3,998 453 1,236 11,578
% 5.4 6.8 0.3 0.3 2.0 8.2 4.0 9.5 0.2 0.2 14.2 34.5 3.9 10.7 100.0
Associate Liberal Arts
19 80 83 11 4 13 44 108 163 0 1 455 659 203 313 2,137
% 3.7 3.9 0.5 0.2 0.6 2.1 5.1 7.6 0.0 0.0 21.3 30.8 9.5 14.6 100.0
Baccalaureate Professional
223 2,367 3,026 237 398 3,062 6,129 3,529 5,357 237 30515,518 32,215 6,233 12,581 91,194
% 2.6 3.3 0.3 0.4 3.4 6.7 3.9 5.9 0.3 0.3 17.0 35.3 6.8 13.8 100.0
Baccalaureate Liberal Arts
205 1,263 1,631 75 169 667 1,266 1,586 2,707 150 115 6,460 15,771 2,020 4,113 37,993
% 3.3 4.3 0.2 0.4 1.8 3.3 4.2 7.1 0.4 0.3 17.0 41.5 5.3 10.8 100.0
Master's Initial
138 71 184 11 19 92 223 78 222 13 22 543 2,312 186 792 4,768
% 1.5 3.9 0.2 0.4 1.9 4.7 1.6 4.7 0.3 0.5 11.4 48.5 3.9 16.6 100.0
Master's Terminal
138 256 339 38 44 510 901 351 430 33 29 2,050 2,968 1,889 3,262 13,100
% 2.0 2.6 0.3 0.3 3.9 6.9 2.7 3.3 0.3 0.2 15.6 22.7 14.4 24.9 100.0
Undergraduate Level
Non-Degree Programs
(Certificate, Diploma, etc.)
35 23 29 3 11 4 9 10 22 0 0 64 277 246 438 1,136
% 2.0 2.6 0.3 1.0 0.4 0.8 0.9 1.9 0.0 0.0 5.6 24.4 21.7 38.6 100.0
Graduate Level
Non-Degree Programs
(Certificate, Diploma, etc.)
20 5 8 1 1 14 22 8 10 0 0 43 99 22 64 297
% 1.7 2.7 0.3 0.3 4.7 7.4 2.7 3.4 0.0 0.0 14.5 33.3 7.4 21.5 100.0
Total
337 4,685 6,086 407 680 4,588 9,544 6,129 10,008 452 50026,774 58,299 11,252 22,799 162,203
% 2.9 3.8 0.3 0.4 2.8 5.9 3.8 6.2 0.3 0.3 16.5 35.9 6.9 14.1 100.0
Higher Education Arts Data Services DATA SUMMARIES
2014-2015
INSTITUTIONS REPORTING NEW CONSTRUCTION AND/OR RENOVATION OF ART/DESIGN FACILITIES IN 2014-2015
This addendum provides a list of institutions reporting new construction and/or renovations of existing art/design facilities under way during the 2014-2015 academic year.
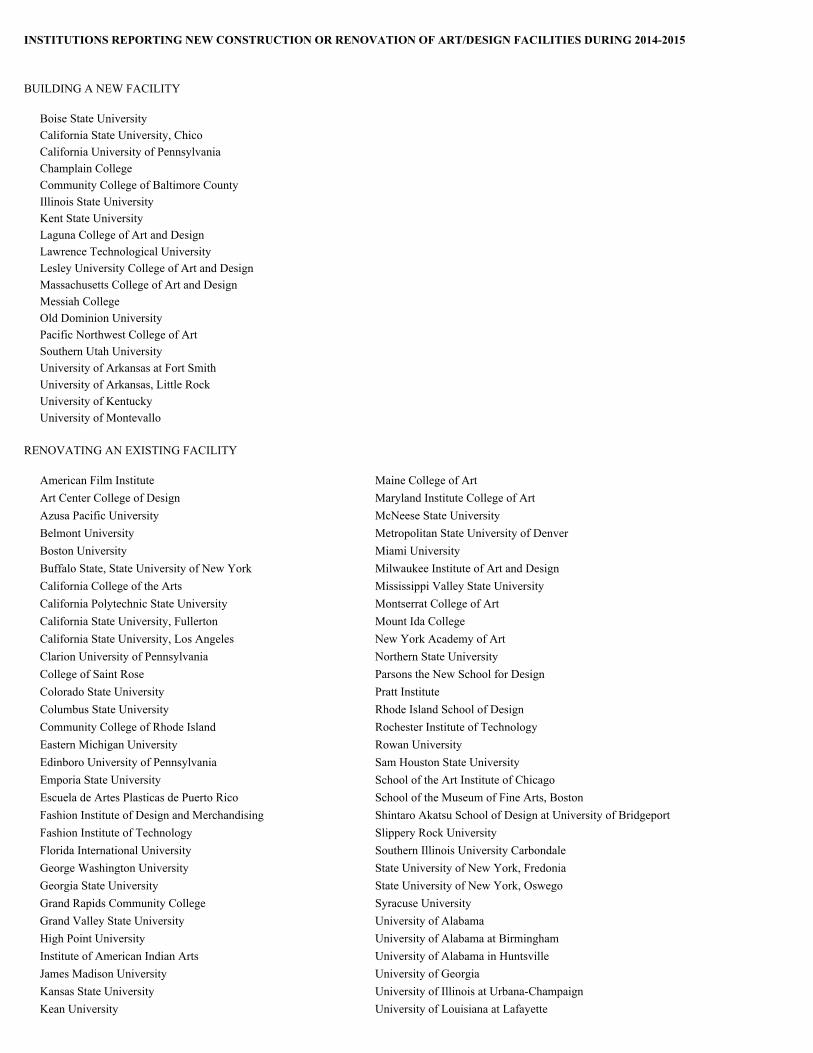
INSTITUTIONS REPORTING NEW CONSTRUCTION OR RENOVATION OF ART/DESIGN FACILITIES DURING 2014-2015
BUILDING A NEW FACILITY
Boise State University
California State University, Chico
California University of Pennsylvania
Champlain College
Community College of Baltimore County
Illinois State University
Kent State University
Laguna College of Art and Design
Lawrence Technological University
Lesley University College of Art and Design
Massachusetts College of Art and Design
Messiah College
Old Dominion University
Pacific Northwest College of Art
Southern Utah University
University of Arkansas at Fort Smith
University of Arkansas, Little Rock
University of Kentucky
University of Montevallo
RENOVATING AN EXISTING FACILITY
American Film Institute
Art Center College of Design
Azusa Pacific University
Belmont University
Boston University
Buffalo State, State University of New York
California College of the Arts
California Polytechnic State University
California State University, Fullerton
California State University, Los Angeles
Clarion University of Pennsylvania
College of Saint Rose
Colorado State University
Columbus State University
Community College of Rhode Island
Eastern Michigan University
Edinboro University of Pennsylvania
Emporia State University
Escuela de Artes Plasticas de Puerto Rico
Fashion Institute of Design and Merchandising
Fashion Institute of Technology
Florida International University
George Washington University
Georgia State University
Grand Rapids Community College
Grand Valley State University
High Point University
Institute of American Indian Arts
James Madison University
Kansas State University
Kean University
Maine College of Art
Maryland Institute College of Art
McNeese State University
Metropolitan State University of Denver
Miami University
Milwaukee Institute of Art and Design
Mississippi Valley State University
Montserrat College of Art
Mount Ida College
New York Academy of Art
Northern State University
Parsons the New School for Design
Pratt Institute
Rhode Island School of Design
Rochester Institute of Technology
Rowan University
Sam Houston State University
School of the Art Institute of Chicago
School of the Museum of Fine Arts, Boston
Shintaro Akatsu School of Design at University of Bridgeport
Slippery Rock University
Southern Illinois University Carbondale
State University of New York, Fredonia
State University of New York, Oswego
Syracuse University
University of Alabama
University of Alabama at Birmingham
University of Alabama in Huntsville
University of Georgia
University of Illinois at Urbana-Champaign
University of Louisiana at Lafayette

INSTITUTIONS REPORTING NEW CONSTRUCTION OR RENOVATION OF ART/DESIGN FACILITIES DURING 2014-2015
(continued)
University of Michigan
University of Nebraska at Omaha
University of New Orleans
University of North Alabama
University of North Carolina at Charlotte
University of North Florida
University of North Georgia
University of North Texas
University of Southern Indiana
University of Southern Mississippi
University of Texas at Arlington
University of Wisconsin - Whitewater
Utah State University
Valdosta State University
Vincennes University
Wayne State College
Youngstown State University
BUILDING A NEW FACILITY AND RENOVATING AN EXISTING FACILITY
Cleveland Institute of Art
Otis College of Art and Design