IGARSS_DESDynI_2011.pptx
20
by Scott Hensley, Greg Sadowy, Roger Chao, Ernie Chuang, David Escoto, Hirad Ghaemi, Maurio Grando, Anthony Guarnera, Brian Hawkins, Brandon Heavey, Barron Latham, Eric Liao, Sean Lin, Jan Martin, Thierry Michel, Timothy Miller, Ron Muellerschoen, Dragana Perkovic, Momin Quddus, Paul Rosen, Mauricio Sanchez- Barbetty, Scott Shaffer, Joanne Shimada, Ian Tan, Jordan Tanabe, Kean Tham, Tushar Thrivikraman & Louise Veilleux Jet Propulsion Laboratory, California Institute of Technology July 28, 2011 DESDynI : ACHIEVING MULTI - DISPLINE SCIENCE OBJECTIVES THROUGH a COMBINATION of SweepSAR TECHNOLOGY AND MISSION DESIGN is now First Results from an Airborne SweepSAR Demonstration at Ka-band Copyright 2011, Jet Propulsion Laboratory, California Institute of Technology
-
Upload
grssieee -
Category
Technology
-
view
569 -
download
0
Transcript of IGARSS_DESDynI_2011.pptx

by
Scott Hensley, Greg Sadowy, Roger Chao, Ernie Chuang, David
Escoto, Hirad Ghaemi, Maurio Grando, Anthony Guarnera, Brian
Hawkins, Brandon Heavey, Barron Latham, Eric Liao, Sean Lin, Jan
Martin, Thierry Michel, Timothy Miller, Ron Muellerschoen, Dragana
Perkovic, Momin Quddus, Paul Rosen,
Mauricio Sanchez- Barbetty, Scott Shaffer, Joanne Shimada, Ian Tan,
Jordan Tanabe, Kean Tham, Tushar Thrivikraman & Louise Veilleux
Jet Propulsion Laboratory, California Institute of Technology
July 28, 2011
DESDynI: ACHIEVING MULTI-DISPLINE SCIENCE OBJECTIVES THROUGH a
COMBINATION of SweepSAR TECHNOLOGY AND MISSION DESIGN
is now
First Results from an Airborne
SweepSAR Demonstration at Ka-band
Copyright 2011, Jet Propulsion Laboratory, California Institute of Technology

DESDynI and SweepSAR
• Large swath widths, particularly
when operating in fully
polarimetric modes, is
challenging due to range
ambiguity increases at the larger
PRFs.
• Scansar modes are the
traditional way to overcome
these limitations, however they
come the price of reduced
azimuth resolution.
• SweepSAR, which tracks the
received echo, can achieve wide
swaths with fine azimuth
resolution.
– The cost to achieve this
performance is having
multiple receivers and a
beam former.
• As part of the DESDynI risk
reduction studies we conducted
an airborne demonstration of

SweepSAR Airborne Demo
• Now that the shuttle has finished flying…

SweepSAR Airborne Demo Overview
• Ka-band (35.6 GHz) airborne SweepSAR using
array-fed reflector and digital beamforming
– 8simultaneous receive beams generated by
40-cm offset-fed reflector an 8-element active
array feed
– 8 digital receiver channels, all raw data recorded
– Receive antenna system is approximately 1/28th
scale of DESDynI
• Supports radar instrument development and risk
mitigation for DESDynI:
– Demonstrates first-of-it’s-kind, real-world
performance of SweepSAR with array-fed reflector
– Reduces risk by shaking out engineering issues
that are not predicted by simulation
– Demonstrates performance of critical beamforming
and calibration techniques
• Identify, quantify and mitigate error sources
• Trade algorithm performance vs.
computational resource consumption
– By manipulating the data can also
• Demonstrates suppression of range
ambiguities
• Demonstrates “transmit-gap” mitigation
Nadir-2
experiment port
SweepSAR Demo Block Diagram
NASA DC-8

SweepSAR Airborne Demo Hardware
16-channel Digital Receiver Array
(Mounts on top plate, not shown in solid model)
40 cm Reflector
16-channel Active
Receiver Feed
DC-8 Nadir-2 Port
Pressure Box
Transmit Array
Inertial Measurement Unit
(LN-251 EGI)
Radome
High-stability
feed arm

Hardware Photos
INU
Reflector
Feed Array
Transmit Antenna
DC-8

Measured Receive Antenna Patterns
• Complex antenna patterns (amplitude and phase) measured for the 8
receive beams.
• Beamwidth is approximately 1° and the peak sidelobe level is around
-10 dB.
SweepSAR Antenna System
on near-field scanner
Radome Pressure Box

Radar Parameters and Mapping Geometry
• The eight beams map a swath extending from 33.3°-39.5° that gives
a swath width of 1.4 km.
Not drawn to scale
17 6 458 3 2
5.3 km
1.4 km
33.3°
39.5°
660 m
8750 m
or
10500 m
Parameter Value
Wavelength 8 mm
PRF 1300 Hz
Bandwidth 80 MHz
Sampling Frequency 240 MHz
Flight Altitudes8750 or
10500 m
Transmit Power 250 W
Radar Parameters

SweepSAR Test Site an
• Data Collection Flights
– Data collected using corner reflectors deployed in
radar dark areas at Edwards AFB
– Two sites identified:
• Rosamond Lake – UAVSAR calibration array
with large 2.4 m reflectors
• Rogers Lake – Smaller 1 m reflectors deployed
to
• Reflector spacing designed to effectively
measure beamformed pattern performance
Rosamond Lake Rogers Lake
Experiment Locations at Edwards AFB
Flig
ht D
irection
80°
Headin
g
R9R1
1.5 km
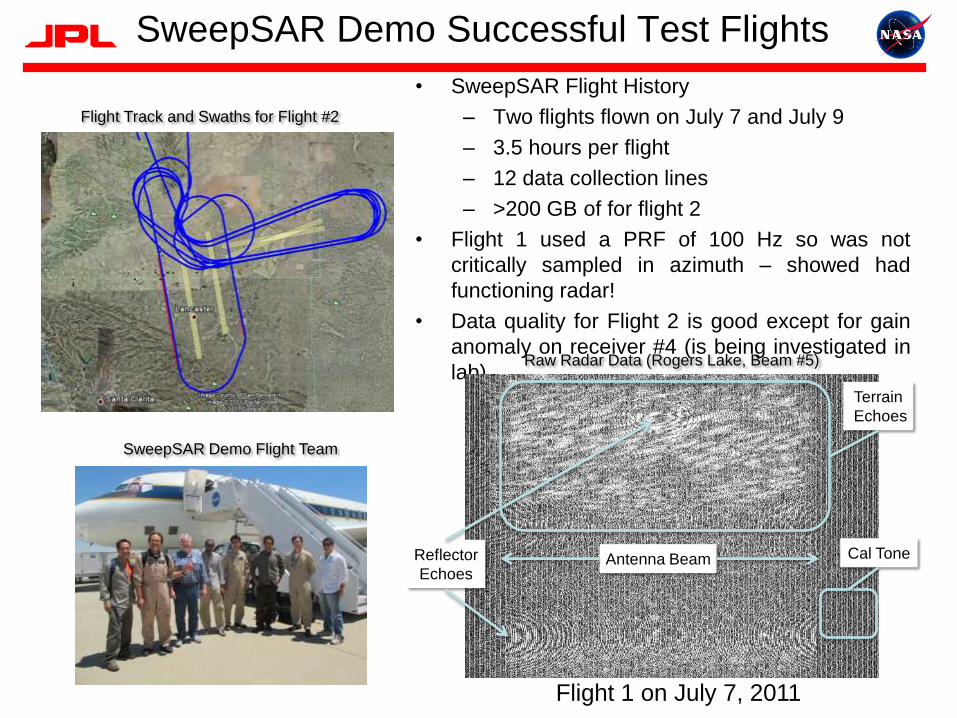
SweepSAR Demo Successful Test Flights
• SweepSAR Flight History
– Two flights flown on July 7 and July 9
– 3.5 hours per flight
– 12 data collection lines
– >200 GB of for flight 2
• Flight 1 used a PRF of 100 Hz so was not
critically sampled in azimuth – showed had
functioning radar!
• Data quality for Flight 2 is good except for gain
anomaly on receiver #4 (is being investigated in
lab).
Flight Track and Swaths for Flight #2
SweepSAR Demo Flight Team
Raw Radar Data (Rogers Lake, Beam #5)
Terrain
Echoes
Reflector
EchoesAntenna Beam Cal Tone
Flight 1 on July 7, 2011
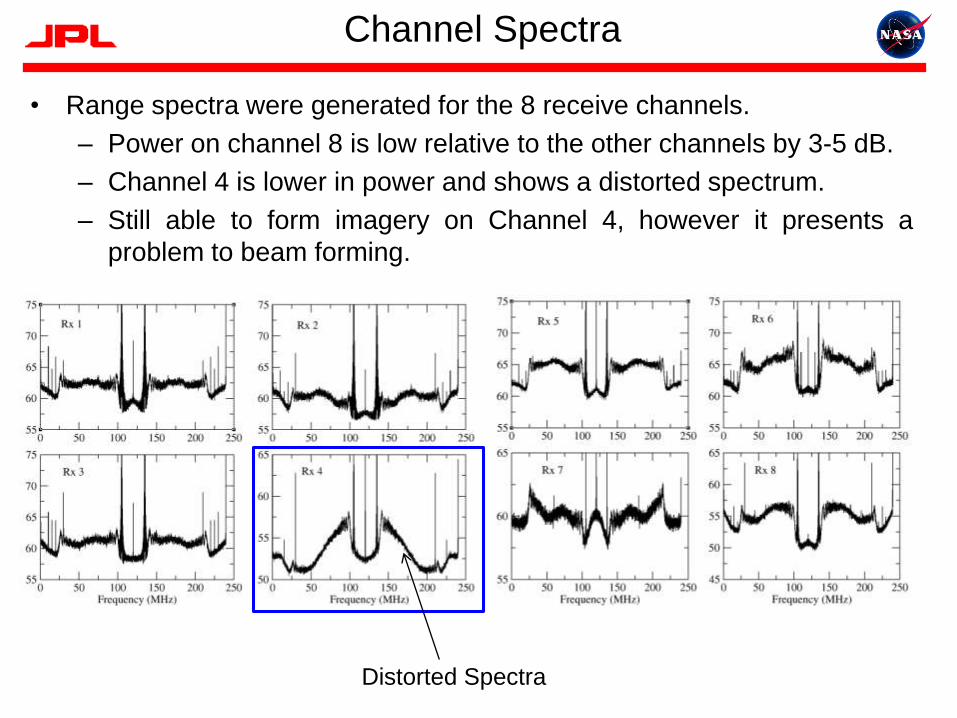
Channel Spectra
• Range spectra were generated for the 8 receive channels.
– Power on channel 8 is low relative to the other channels by 3-5 dB.
– Channel 4 is lower in power and shows a distorted spectrum.
– Still able to form imagery on Channel 4, however it presents a
problem to beam forming.
Distorted Spectra

Individual Beam Imagery
Beam 8 Beam 7 Beam 6 Beam 5
Beam 1Beam 2Beam 3Beam 4
Mainlobe
Sidelobes

Power Profiles
• Power profiles are in reasonable agreement with measured antenna
patterns.
• Note power in channel 4 and 8 are low as expected from the spectral
plots.

Corner Reflector Image
• Simple maximum power combining algorithm used to generate a
simple mosaic of the individual beam images.
Beam Mosaic Image Beam Number Image Google Earth Image
7 1
46
5
2
3
8

14 Freeway Imagery
• Simple maximum power beam mosaic of over section of the 14
freeway.

SweepSAR Digital Beam Forming
Algorithm• Block diagram of a basic beam forming
algorithm adopted for use for the
SweepSAR demonstration.

• Beam forming is done in the phase history domain similar to what is
planned for DESDynI in order to minimize the downlink data
bandwidth.
• The complex weights for the beamformer at time sample tj are given
by
where
Beam Forming Coefficients

and
• Letting
be the vectors of received signals and weights at fast time tjand
• Then the beam formed signal for time tj is given by
where
Beamforming II

Beam Formed Imagery
• Pass 11 imagery before and after beam forming.
Simple Mosaic Beamformed Image

Conclusions
• First of a kind airborne demonstration of the SweepSAR concept at
Ka-band.
• Validated calibration and antenna pattern data sufficient for beam
forming in the fast time domain.
– Provides validation evidence that the DESDynI basic system
architecture is sound.
• Additional testing will include the injection of synthetic targets to
validate the range ambiguity predictions of SweepSAR.
• Future plans include using prototype DESDynI digital flight hardware
to do the beam forming in real-time onboard the aircraft.


![[MS-PPTX]: PowerPoint (.pptx) Extensions to the …interoperability.blob.core.windows.net/files/MS-PPTX/[MS...1 / 78 [MS-PPTX] - v20150904 PowerPoint (.pptx) Extensions to the Office](https://static.fdocuments.in/doc/165x107/5ad11a0c7f8b9aff738b549d/ms-pptx-powerpoint-pptx-extensions-to-the-ms1-78-ms-pptx-v20150904.jpg)
![[MS-PPTX]: PowerPoint (.pptx) Extensions to the Office ...MS-PPTX].pdfPowerPoint (.pptx) Extensions to the Office Open XML File FormatFile Size: 4MBPage Count: 145](https://static.fdocuments.in/doc/165x107/5ed5954ddb0f8b20f04b0446/ms-pptx-powerpoint-pptx-extensions-to-the-office-ms-pptxpdf-powerpoint.jpg)