IFPRI - NAES Conference on Sustainable & Resilient Agriculture - Hiro Takeshima - Typology of...
41
Typology of tractor use growths patterns in Terai Regional Workshop on Agricultural Transformation: Challenges and Opportunities in South Asia Hiro Takeshima, IFPRI Kathmandu, Nepal February 13, 2015
-
Upload
international-food-policy-research-institute -
Category
Education
-
view
173 -
download
2
Transcript of IFPRI - NAES Conference on Sustainable & Resilient Agriculture - Hiro Takeshima - Typology of...

Typology of tractor use growths patterns in
Terai
Regional Workshop on Agricultural Transformation:
Challenges and Opportunities in South Asia
Hiro Takeshima, IFPRI
Kathmandu, Nepal
February 13, 2015

INTERNATIONAL FOOD POLICY RESEARCH INSTITUTE
Objectives
• Examine tractor use growths in Terai (and some
Siwalik)
• Patterns – ownership / rental
• Trends of potential drivers (factor endowments)
• Typology of farm inputs use intensification
• Large variations even within Terai
• Differential policies for specific households types
• Why Terai?
• Focus on where mechanization is actually happening
• Half of population in Nepal now live in Terai (Nepal
Population Census 2011)
• Later on, analyses will include Hills / MountainsDefinitions of Terai, Hills and
Mountains in this study
INTERNATIONAL FOOD POLICY RESEARCH INSTITUTE
Significant growths in tractor uses in Terai between
1995 and 2010
8
29
46
35
8
1995 2003 2010
using tractors
Terai
Hills
Mountains
0.91
2
0.7
0.3 0.3
1995 2003 2010
owning tractors
Terai
Hills
MountainsSource: Presenter’s estimate based on Nepal Living Standard Survey (NLSS)
2010
2003
1995
% of farm households

INTERNATIONAL FOOD POLICY RESEARCH INSTITUTE
In Terai, female headed households are
also catching up
9
30
47
1
24
40
24
8
2 35
1995 2003 2010
% of farm households using tractors, by gender of household heads
Terai - male Terai - female
Hills - male Hills - female
In Terai, tractor uses are growing among
not only male headed households, but also
among female headed households.

INTERNATIONAL FOOD POLICY RESEARCH INSTITUTE
% of cultivated area plowed by tractors
Tractor use growth in Nepal Terai is
comparable to other fast
mechanizing countries like
Cambodia
The pace for Nepal as a whole is
slower.
Bangladesh
Bangladesh
India
Sri Lanka (Rice)
Vietnam …
0
10
20
30
40
50
60
70
80
90
1975 1980 1985 1990 1995 2000 2005 2010
Nigeria
Bangladesh
Brazil
Cambodia
China
India
Indonesia (rice)
Nepal
Nepal Terai
Sri Lanka (Rice)
Vietnam (Rice)
Source: Various. aFigures for Nepal are based on share of households using tractors estimated from NLSS.
INTERNATIONAL FOOD POLICY RESEARCH INSTITUTE
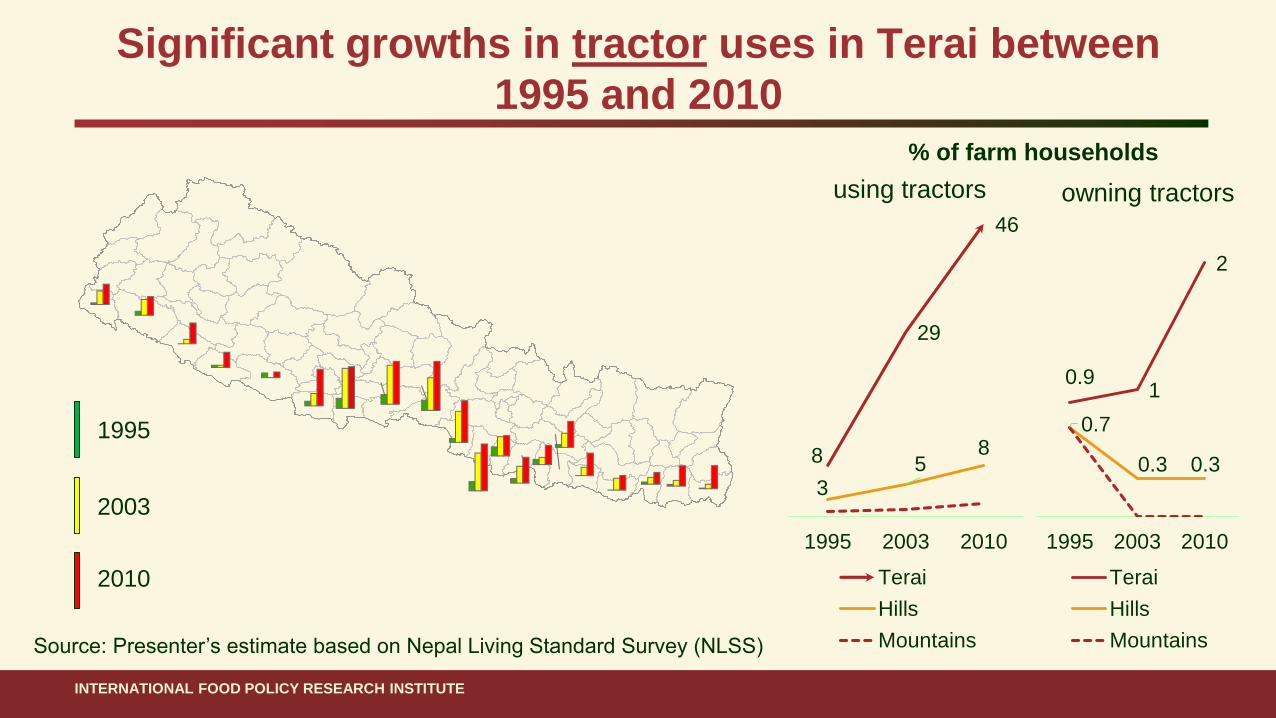
Tractor use is growing mostly by custom hired tractors,
rather than owned tractors
1995 2003 2010
Terai
Owned tractors 59 108 260
Rented tractors 440 954 1,570
Total 499 1,062 1,830
Nepal
Owned tractors 73 125 264
Rented tractors 468 994 1,683
Estimated area cultivated by tractors, by sources of tractors (owned vs rented), 1000 ha
Rented tractors account for 80% of growths in tractored areas.
Source: Author’s estimation from NLSS.
*Assuming farmers use tractors to all the plots they cultivate.

INTERNATIONAL FOOD POLICY RESEARCH INSTITUTE
FACTOR ENDOWMENTS
Trends of changes in factor endowments partly explain tractor use growths in Terai

INTERNATIONAL FOOD POLICY RESEARCH INSTITUTE
Slight increase in land-to-labor ratio
0.11
0.11
0.16
0.9
0.15
0.09
0.14
0.13
0.5
0.13
0.17
0.12
0.22
0.29
0.17
0 0.5 1
Non-mechanizedfarm households
Draft animal only
Tractor renters
Tractor owners
All farm households
Owned land per working age members among farm households (ha)
1995
2003
2010
Farm land per working age
members started rising since 2003
• Due to declining agricultural
population (despite overall
population growths)

INTERNATIONAL FOOD POLICY RESEARCH INSTITUTE
Rising human capital and farm wages
Source: Authors’ calculations from NLSS.aWages are averages of daily male wages for plowing, planting, weeding and harvesting.
0
1
2
3
4
5
6
1995 2003 2010
Average years of formal education completed (working age)
Terai
Eastern
Central
Western
Mid-western
Far-western
Hills
Mountains
All0
2
4
6
8
10
12
14
1995 2003 2010
Real farm wage (kg of cereals / day)
Terai
Hills
• Consistent with the growing mechanization in Terai
• Not fully explain slow mechanization growth in the Hills and Mountains
INTERNATIONAL FOOD POLICY RESEARCH INSTITUTE
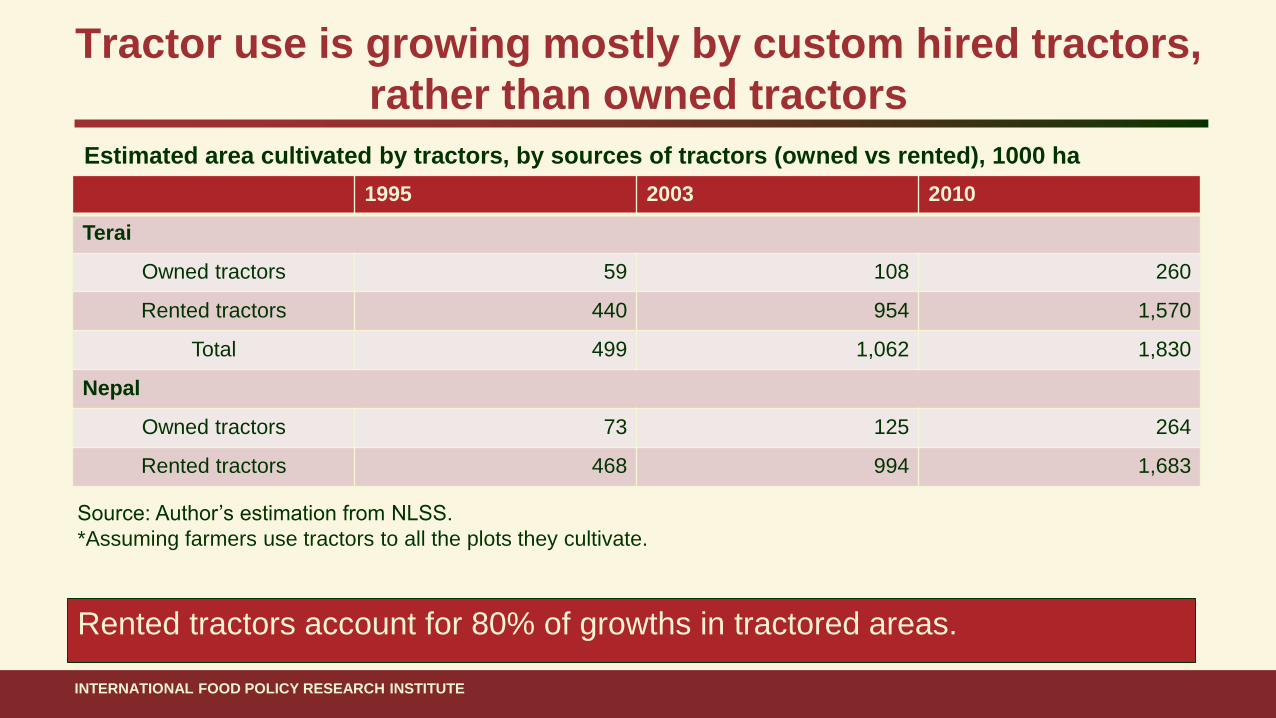
Tractor rental price declined relative to wages
Source: Authors’ calculations from NLSS.
5.4
4.9
3.84.9
4.5
3.5
1995 2003 2010
Ratio of hourly tractor rental rate / daily wage
Terai
Hills / Mountains
Tractor rental rates had declined relative
to wages by 20-25% compared to 2003
Consistent with the growth in tractor
rentals in Terai
However, does not explain relatively slow
tractor use growth in Hills and Mountains

INTERNATIONAL FOOD POLICY RESEARCH INSTITUTE
Declining tractor prices in Terai (real term)
1989 1992 2010
Four wheel tractors 5066 6464 30000
Power tillers 1100 1300 12000
Share of power tillers (%) 18 17 29
0.2
.4.6
.81
cum
ula
tive d
ensity
0 20000 40000 60000 80000real tractor price (kg of rice/wheat)
2003 2010
Changes in distributions of (real) tractor prices
in Terai - 2003 and 2010
Source: Authors.
Number of four wheel tractors and power tillers in Nepal
Source: CSAM (2014) for figures in 1989 and 1992; Justice & Biggs (2013)
for figure in 2010.
In Terai, real prices of owned tractors have declined on
average between 2003 and 2010
Median price in 2010 is worth around 24 tons of cereals =
400,000 rupees
Median price in 2003 was worth around 37 tons of
cereals (though nominal price was around 300,000
rupees, this was much higher in real terms in 2003)
Consistent with increasing shares of power tillers
Consistent with growing tractor ownership in Terai

INTERNATIONAL FOOD POLICY RESEARCH INSTITUTE
Larger farm owners in Terai - switched from draft
animal to tractors between 2003 and 2010
0
10
20
30
40
50
60
70
80
90
100
< 0
.05
0.0
5 -
0.1
0.1
- 0
.2
0.2
- 0
.3
0.3
- 0
.5
0.5
-0.7
5
0.7
5 -
1
1 -
1.5
1.5
- 2
.5
2.5
- 5
> 5
Share
(%
)
area owned (ha)
tractor rental (2003)
tractor rental (2010)
tractor own / rent (2003)
2040
6080
shar
e (%
)
0.05 0.1 0.2 0.5 1 2.5 5 10area owned (ha)
2003 2003 CI
2010 2010 CI
02
04
06
0
shar
e (%
)
0.05 0.1 0.2 0.5 1 2.5 5 10area owned (ha)
2003 2003 CI
2010 2010 CI
Larger own farm => more substitution from draft animals to tractor
rentals between 2003 and 2010
< 0.1 ha: significantly lower tractor rental
> 2.5 ha: significantly more tractor owner
% renting tractors % using only draft animals

INTERNATIONAL FOOD POLICY RESEARCH INSTITUTE
INTENSIFIED USE OF EXTERNAL, NON-
LAND INPUTS AS MAJOR DRIVERS OF
TRACTOR USE GROWTHS IN TERAI
However, farm size and factor endowments alone does not explain tractor use growths in
Terai.

INTERNATIONAL FOOD POLICY RESEARCH INSTITUTE
In Terai, tractor renters not only cultivate larger areas but
uses more external inputs per area, than draft animal users Type of
farm
househol
ds
Inputs use per cultivated area (equivalent to kg of cereal / ha) Mean
cultivat
ed area
per
year
(ha)
Fertilizer Hired labor Uses of
external
inputs per
cultivated
area
(excluding
tractor)
Tractor
use per
cultivated
area
Farm
labor
Inputs
uses per
cultivated
area
(excluding
opportunit
y cost of
land)
Tractor
renter
205** 248** 612** 137** 1907* 2657 1.7**
Draft
animal
users
137 167 431 0 2272 2704 1.0
Differences in inputs use per cultivated area between tractor renters and draft
animal only users in Terai, 2010 (values measured equivalent to kg of cereal / ha)a
Source: Authors. Figures are weighted by sample weights and cultivated areas. aAsterisks indicate statistically significant difference based on t-test: ** 1%, * 5%.
Tractor renters use the
amount of fertilizer, whose
monetary value is worth
205 kg / ha of cereals.
This is higher than 137 by
draft animal users.
=> Somewhat different
from outside Nepal, where
fertilizer and hired labor are
substitutes to tractors and
land.
INTERNATIONAL FOOD POLICY RESEARCH INSTITUTE
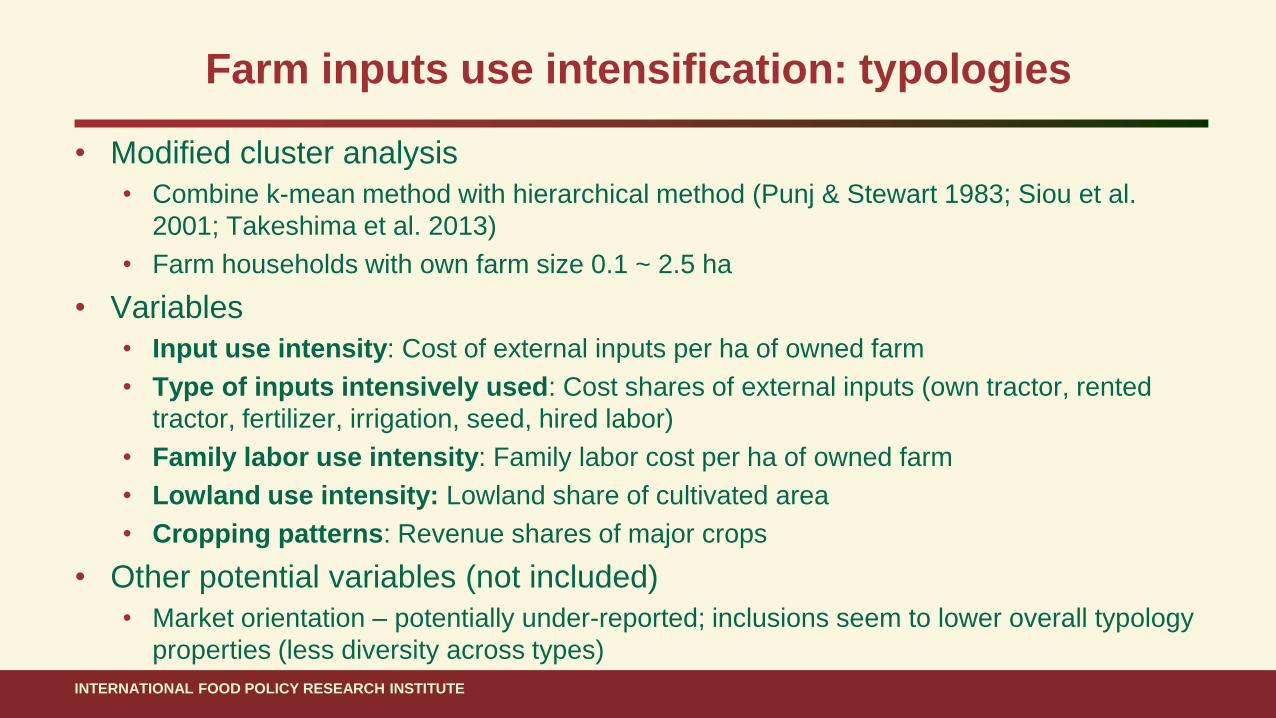
Farm inputs use intensification: typologies
• Modified cluster analysis
• Combine k-mean method with hierarchical method (Punj & Stewart 1983; Siou et al.
2001; Takeshima et al. 2013)
• Farm households with own farm size 0.1 ~ 2.5 ha
• Variables
• Input use intensity: Cost of external inputs per ha of owned farm
• Type of inputs intensively used: Cost shares of external inputs (own tractor, rented
tractor, fertilizer, irrigation, seed, hired labor)
• Family labor use intensity: Family labor cost per ha of owned farm
• Lowland use intensity: Lowland share of cultivated area
• Cropping patterns: Revenue shares of major crops
• Other potential variables (not included)
• Market orientation – potentially under-reported; inclusions seem to lower overall typology
properties (less diversity across types)

INTERNATIONAL FOOD POLICY RESEARCH INSTITUTE
Farm household typologies in Terai, 2010
Descriptions Inputs
costs /
ha
Own
ed
(ha)
Cultiv
ated
(ha)
1 Middle income, small subsistence 713 0.5 0.5
2 Cash crop (sugar cane) growers 888 0.9 1.8
3 Fertilizer-based intensifier 644 0.6 1.3
4 Power intensive mechanizers 896 0.5 1.3
5 Traditional (lowland) 149 0.5 1.1
6 Intensive labor hirers 863 0.8 1.7
7 Upland based intensifiers 689 0.5 1.5
8 Traditional (upland based), non-rice 196 0.5 1.0
9 Small (own farm < 0.1 ha)
10 Large (own farm >= 2.5 ha)
TractorIrrigationFertilizerHired labor
Inputs per ha

INTERNATIONAL FOOD POLICY RESEARCH INSTITUTE
Tractor users in Terai, 2010
Tractorowners
Tractorrenters
Middle income, small subsistence(family labor based)
Cash crop (sugar cane) growers
Fertilizer-based intensifier
Power intensive mechanizer
Traditional (lowland)
Intensive labor hirers
Upland based intensifiers
Traditional (upland), non-rice
Small farm (< 0.1 ha of own farm)
Large farm (> 2.5 ha of own farm)
Tractor use
costs among
actual users (kg
of cereal / ha of
cultivated area)
Small farm 60
Large farm 86
1 Middle income, small subsistence
(family labor based)
98
2 Cash crop (sugar cane) growers 120
3 Fertilizer-based 101
4 Power intensive mechanizer 296
5 Lowland, traditional irrigators 40
6 Intensive labor hirers 129
7 Upland based intensifiers 139
8 Upland based, traditional, non-rice 106

INTERNATIONAL FOOD POLICY RESEARCH INSTITUTE
Messages from typology
• Several mechanization patterns, variations across regions
• Power intensive mechanizers = intensify inputs use by using tractors
intensively per hectare of cultivated area for power intensive activities like
plowing (Western, Central)
• Intensive labor hirers = intensify inputs use by hiring many laborers, and
substitute part of them with tractors (though tractor use less intensive per
ha) (Eastern, Mid-Western) – also a majority of tractor owners
• Fertilizer-based intensifiers = still rely mostly on fertilizer to intensify inputs
use; some tractor renters are found among this type (Far-Western)

INTERNATIONAL FOOD POLICY RESEARCH INSTITUTE
Why is this typology important?
• Different policy recommendations (and hypotheses) - Examples:
• Power intensive mechanizers:
• Productivity highly depends on intensive, repeated plowing
• Reducing cost of deep plowing; more efficient plowing machines can have large benefit
• Intensive labor hirers
• Productivity depends on labor intensive production practices (plowing, labor intensive planting, weeding,
etc) on larger areas
• Potential demand for diverse machineries that can mechanize different practices (planters, weeders etc)
• Fertilizer-based intensifiers
• Productivity depends on soil nutrients, but not so much on labor intensive practices or intensive repeated
plowing
• Demand for mechanization may largely depend on the fertilizer price / availability, soil fertility
• Increasing their tractor use requires change in technology characteristics that raise returns to intensive
plowing or labor intensive practices
• Traditional lowland farmers
• Returns from mechanization may be low; policies to induce general intensification are needed (improved
varieties etc); without sufficient intensification, returns from mechanization is likely to be limited
=> These hypotheses need to be further investigated

INTERNATIONAL FOOD POLICY RESEARCH INSTITUTE
Overall summary
• Intensification per unit of land has been common in Terai between 1995-2010, rather than achieving
economies of scales from farm size expansion
• Tractor use in Terai has grown as part of such land-saving intensification, although larger farm owners
do hire in more tractors
• Despite the small, atomistic farm types in Terai, tractor uses grew through custom hiring by a small
number of specialized tractor owners, rather than through widespread ownership of smaller tractors
• Tractor use growth in Terai is consistent with the trends of wage increases relative to tractor rental
price, but it is also driven by the general inputs use intensification.
• Farm household types in Terai
• Farm size is the major determinant of wealth, income, poverty; but the levels of inputs use intensification also
vary, and associated with higher wealth.
• Diverse patterns of inputs use intensifiers per unit of land – association with each region
• 3 major types of tractor renters (power intensive mechanizers, intensive labor hirer, fertilizer-based intensifiers).
They are also among those with the highest levels of inputs use intensity
• The presence of distinct types suggest that differential mechanization policy options can be more
efficient

INTERNATIONAL FOOD POLICY RESEARCH INSTITUTE
Thank you!

INTERNATIONAL FOOD POLICY RESEARCH INSTITUTE
Summary of patterns
• Tractor use has been growing fast in Terai, while slow in other regions
• Despite the small, atomistic farm types in Terai, tractor uses grew through custom hiring by a small
number of specialized tractor owners, rather than through widespread ownership of smaller tractors
• Mechanization patterns differ between tractor renters and tractor owners. Understanding tractor use
patterns of both types is important.
• Inequality has widened between tractor owner households and other farm households (revenues,
consumption and asset holdings). In 2010, their differences are in the range of 4 ~ 6 times. Wealth of
tractor owners has also surpassed those of non-farm households.
• In 1995 and 2003, tractor owners were often located in remote areas, compared to tractor renters.
Between 2003 and 2010, more tractor owners emerged in sub-urban areas, or areas where access
had improved (closer to various facilities than non-owners, unlike in 2003). Much growth in tractor
ownership between 2003 and 2010 occurred in sub-urban areas instead of remote areas.
• A fraction of farm households, cultivating less than 0.2 ha of land, has converged as non-mechanized
farm households (using neither tractors nor draft animals), specializing into vegetables, non-citrus
fruits, or spices, as well as renting out of land, shifting away from rice production.
• To some extent, but tractor is not the driver of land consolidation

INTERNATIONAL FOOD POLICY RESEARCH INSTITUTE
Summary hypotheses
Growths of tractor rentals in Terai
• Tractor rental costs account for only a small share of total crop production costs of farm
households. This pattern possibly reflects generally small land size in Nepal Terai.
• Tractor rental is growing along intensification rather than extensification – it is growing
alongside intensified uses of hired labor, fertilizer, irrigation per unit of cultivated land. To be
more precise, tractor as well as other external inputs may be substituting family labor.
• Tractor rental may be also driven by motives for expanding cultivated area, but only to a
modest extent.
• Switching from draft animals to tractor rentals may make sense only if overall input
intensification becomes profitable (for example with improved varieties, improved
infrastructure). Cost savings of substituting manual work may be insufficient in inducing
tractor uses.
• Tractor rental is partly motivated by market oriented production, but subsistence production
still dominates (intensified inputs use may be financed by growing remittances). Tractor
rental may be also motivated by increased subsistence food consumption.

INTERNATIONAL FOOD POLICY RESEARCH INSTITUTE
Summary hypotheses
Tractor ownerships in Terai
• Compared to tractor rentals, association is clearer between tractor ownership
and farm size; owning tractors make sense if 5 or more ha of land can be
cultivated per year.
• They invest into tractors because of anticipated farming revenue increases,
while remittances play little roles in this decision.
• By 2010, market accesses seem to have increasingly induced tractor
ownership.
• Aside from commercial rice production, large scale cash crops production
like sugarcane is part of the motivation for tractor ownership.
• Characteristics of tractor owners have diverged; its growth are led by growths
of both commercial farmers, as well as higher-income non-farm households
interested in using tractors in small scale

INTERNATIONAL FOOD POLICY RESEARCH INSTITUTE
Summary hypotheses
Labor market and mechanization in Terai
• Tractor use in Terai has grown as real farm wages have risen while real
tractor rental prices have remained constant
• Growing agricultural labor market - while real wages have risen, more labors
seem to have entered ag labor market instead of remaining as family labor (which
may be reflected in the growth of landless workers), seeking employment in larger
farms / tractor renting farms. This growth in labor hiring may have been
somehow an important parallel process in growing tractor adoption.
• Rising human capital and real farm wage are, however, also observed in the
Hills and Mountains, where tractor uses have grown much more slowly.
These factors appear to affect the mechanization differently in Hills and
Mountains, compared to Terai.

INTERNATIONAL FOOD POLICY RESEARCH INSTITUTE
Summary hypotheses
Cropping patterns and tractor rentals – generally weak linkage
• Tractor rental growth in Terai is only partly driven by the cropping pattern –
rice has remained dominant (80% of farm households have specialized in
rice or rice based production system) since 1995 despite changes in farm
sizes, and increased adoptions of tractors have nevertheless happened
despite relatively stable cropping patterns throughout this period
• Changes in tractor adoptions associated with cropping pattern changes
seem relatively small.

INTERNATIONAL FOOD POLICY RESEARCH INSTITUTE
Summary hypotheses - additional
• There is some threshold (about 0.2 ha) of owned farmland size to
receive tractor rental service
• For agricultural growth in Terai in the short term, economies of
scale is unlikely to be the driver, but intensification per unit of land
is likely to be so; and mechanization can still play roles in the
latter
INTERNATIONAL FOOD POLICY RESEARCH INSTITUTE
Why are these hypotheses important?

INTERNATIONAL FOOD POLICY RESEARCH INSTITUTE
Why are these hypotheses important?
• Why … not happening?
• Leasing / renting out

INTERNATIONAL FOOD POLICY RESEARCH INSTITUTE
• Growing pop of mini tillers (?)
• 500 => 5000 in 10 years or so for the whole of Nepal, mostly Hills

INTERNATIONAL FOOD POLICY RESEARCH INSTITUTE
Implications to current agricultural mechanization
policy
• Is the adoption determined by key economic factors? => then, the
effects of gov’s policies for promoting mechanization may be also
bound by these factors; adoption is driven by larger forces

INTERNATIONAL FOOD POLICY RESEARCH INSTITUTE

INTERNATIONAL FOOD POLICY RESEARCH INSTITUTE
Middle income, small subsistence(family labor based)Cash crop (sugar cane) growers
Fertilizer-based intensifier
Intensive mechanizer
Traditional (lowland)
Intensive labor hirers
Upland based intensifiers
Traditional (upland-based), non-rice
Remoteness
Average of minutes to agric center, bank, bus stop,
cooperatives, market center, phones, paved road, shop
Education
Expenditure
per capita Remittances

INTERNATIONAL FOOD POLICY RESEARCH INSTITUTE
% of landed farm households in Terai using tractors
and fertilizer, by operational size (ha)
0
10
20
30
40
50
60
70
80
90
100
< 0
.1
0.1
- 0
.2
0.2
- 0
.3
0.3
- 0
.5
0.5
- 1
1 -
1.5
1.5
- 2
2 -
3
3 -
4
4 -
5
5 -
10
10
- 2
0
> 2
0
Sh
are
(%
)
Total area cultivated by households annually (ha)
tractor rental (2003)
tractor rental (2010)
tractor renter + owner (2003)
tractor renter + owner (2010)
fertilizer (2003)
fertilizer (2010)
Source: Authors calculations based on NLSS.
Operational size < 0.2 ha => slow
mechanization => distinct
characteristics
Between 2003 and 2010, tractor use
has become increasingly important
for farm above 0.2 ha operational
size.
Operational size 0.2 ~ 5 ha => share
of mechanization relatively constant
across size => role of tractors
unclear

INTERNATIONAL FOOD POLICY RESEARCH INSTITUTE
Terai household types by crops and mechanization
status (including subsistence crop production)
0% 20% 40% 60% 80% 100%
All farm households…
2003
2010
Tractor owner (1995)
2003
2010
Tractor renter
2003
2010
Draft animal
2003
2010
Non-mechanized
2003
2010
Shares (%)
Rice
Vegetables
Cash crops (sugarcane,jute, tobacco)Non citrus
Wheat
Maize
Spices
Pulses
Tuber
Oilseeds
Other grains
Rice-wheat
Rice-pulses
Rice-vegetables
Relation between crop
specialization and
tractor uses are
generally weak. This is
particularly so between
tractor renters and draft
animal only users.
Tractor ownership tend
to more specialize in
cash crops (mostly
sugarcane).
Non-mechanized
households tend to be
specializing in
vegetables.

INTERNATIONAL FOOD POLICY RESEARCH INSTITUTE
% of tractor owners earning revenues from hiring out
Source: Authors.
57
43
Yes No
56
44
Yes No
56
44
Yes No
58
42
Yes No
2003 2010
Owning
expensive
tractors
Owning
cheaper
tractors
No change between 2003 and 2010
No difference between different types
of tractors

INTERNATIONAL FOOD POLICY RESEARCH INSTITUTE
Per capita revenues and expenditures in Terai; by types
(median) (national average in 1995 = 100)
39 49 99 89 49 49
118 59
296
99 59 20
16899
502
128 89 59
1995 2003 2010
114 76133 101 82 70
190108
222139 101 95
190139
380
152 120 133
1995 2003 2010
Per capita revenue (deflated by cereal price) Per capita expenditures (deflated by cereal price)
Source: Authors calculations based on NLSS.
• In Terai, tractor owners are becoming increasingly distinctive in characteristics
• Tractor renters are have been generally wealthier than other farm households, but in small ways

INTERNATIONAL FOOD POLICY RESEARCH INSTITUTE
Shares (%) of farm households with access to rented
tractors or power tillers
58
4
0
4
0
0
89
5
0
10
2
0
86
10
0
9
2
4
Tractors (Terai)
Tractors (Hills)
Tractors(Mountains)
Tillers (Terai)
Tillers (Hills)
Tillers(Mountains) 2010
2003
1995
Source: Author’s estimation based on NLSS.
*Figures are the shares of communities which reported the availability of tractors, weighted
by the number of households and sample weights of the communities.
Low adoption of tractors in
the Hills and Mountains
may be partly due to the
low availability.
Availability of tillers appear
low as well across all
regions.
However, it is unclear
whether the low
availability is due to the
lack of demand.

INTERNATIONAL FOOD POLICY RESEARCH INSTITUTE
Per capita revenues and expenditures in Terai; by types
(median) (national average in 1995 = 100)
114
76
133
101
82
70
190
108
222
139
101
95
190
139
380
152
120
133
Non-farm households
Farm households
Tractor owners
Tractor renters
Draft animal users
Non-mechanized farmhouseholds
2010 2003 1995
Per capita expenditures (deflated by cereal price)
Source: Authors calculations based on NLSS.
• In Terai, tractor owners are becoming
increasingly distinctive in characteristics
• Tractor renters are have been generally wealthier
than other farm households, but in small ways

INTERNATIONAL FOOD POLICY RESEARCH INSTITUTE
Terai household types by the largest revenue source
(including the value of subsistence crop production)
0% 20% 40% 60% 80% 100%
All households…
2003
2010
Tractor owner…
2003
2010
Tractor renter
2003
2010
Draft animal
2003
2010
Non-mechanized
2003
2010
Shares (%)
Agriculture
Livestock
Off-farm enterprise
Remittances
Other major sources
Ag + renting out oftractors / animals
Ag + remittances
Ag + off-farmenterprises
Others
By 2010, growing share
of tractor owners are
found among households
earning more than half of
revenues from off-farm
enterprise
INTERNATIONAL FOOD POLICY RESEARCH INSTITUTE
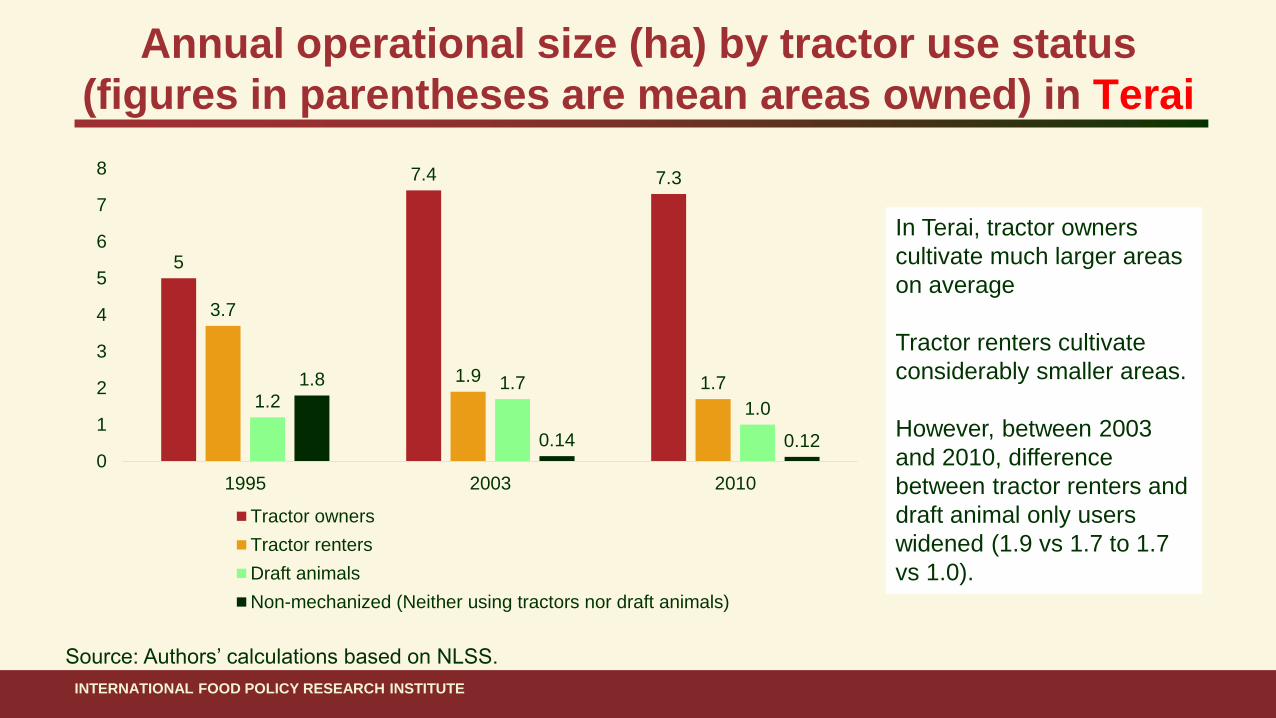
Annual operational size (ha) by tractor use status
(figures in parentheses are mean areas owned) in Terai
Source: Authors’ calculations based on NLSS.
5
7.4 7.3
3.7
1.9 1.71.2
1.7
1.0
1.8
0.14 0.120
1
2
3
4
5
6
7
8
1995 2003 2010
Tractor owners
Tractor renters
Draft animals
Non-mechanized (Neither using tractors nor draft animals)
In Terai, tractor owners
cultivate much larger areas
on average
Tractor renters cultivate
considerably smaller areas.
However, between 2003
and 2010, difference
between tractor renters and
draft animal only users
widened (1.9 vs 1.7 to 1.7
vs 1.0).