PAYG pensions with endogenous fertility Volker Meier Ifo Institute for Economic Research.

ifoWORLD ECONOMIC SURVEY
2019February
Vol. 18
ifo World Economic Climateifo World Economic Climate suffers another setback
Advanced economies Pace of economic growth in advanced economies likely to slow
Emerging and developing economiesEconomic climate in emerging markets and developing economies remains subdued
Special boxTrade and foreign policy in Latin America
Special topicEnergy transition around the world: is it going far enough?

ifo World Economic SurveyISSN 2511-7831 (print version)ISSN 2511-784X (electronic version)A quarterly publication on the world economic climatePublisher and distributor: ifo InstitutePoschingerstr. 5, D-81679 Munich, GermanyTelephone ++49 89 9224-0, Telefax ++49 89 985369, e-mail [email protected] subscription rate: €40.00Single subscription rate: €10.00 Shipping not included Editor of this issue: Dorine Boumans, Ph.D., e-mail [email protected] Reproduction permitted only if source is stated and copy is sent to the ifo Institute.
All time series presented in this document plus additional series for about 70 countries may be ordered from the ifo Institute. For further information please contactMrs. Ikonomou-Baumann ([email protected])
Authors of this publication:Dorine Boumans, Ph.D., e-mail [email protected] (ifo Center for Macroeconomics and Surveys)Johanna Garnitz, e-mail [email protected] (ifo Center for Macroeconomics and Surveys)
Author of the special boxLia Baker Valls Pereira, e-mail [email protected] (Research Associate at FGV and Professor at State University of Rio de Janeiro
Authors of the special topicDorine Boumans, Ph.D. Dr. Johann Wackerbauer, e-mail [email protected] (ifo Center for Energy, Climate and Resources)
ifo WORLD ECONOMIC SURVEY VOLUME 18, NUMBER 1, FEBRUARY 2019
ifo World Economic Climate suffers another setback
Pace of economic growth in advanced economies likely to slow 3
Economic climate in emerging markets and developing economies remains subdued 6
Trade and foreign policy in Latin America 10
Energy transition around the world: is it going far enough? 12
Figures 16

NOTES
The World Economic Survey (WES) assesses worldwide economic trends by polling transnational as well as national organizations worldwide on current economic developments in their respective countries. Its results offer a rapid, up-to-date assessment of the current economic situation internationally. In January 2019, 1,293 economic experts in 122 countries were polled.
METHODOLOGY AND EVALUATION TECHNIQUE
The survey questionnaire focuses on qualitative information: assessments of a country’s general economic situa-tion and expectations regarding key economic indicators. It has proven to be a useful tool, since it reveals eco-nomic changes earlier than conventional business statistics.
The qualitative questions in the World Economic Survey have three possible categories: “good / better / higher” (+) for a positive assessment resp. improvement, “satisfactory / about the same / no change” (=) for a neutral assessment, and “bad / worse / lower” (−) for a negative assessment resp. deterioration.The individual replies are combined for each country without weighting as an arithmetic mean of all survey responses in the respective country. Thus, the respective percentage shares (+), (=) and (−) are calculated for the time t for each qualitative question and for each country. The balance is the difference between (+)- and (−)-shares. As a result, the balance ranges from -100 points and +100 points. The mid-range lies at 0 points and is reached if the share of positive and negative answers is equal.
The survey results are published as aggregated data. For aggregating the country results to country groups or regions, the weighting factors are calculated using the gross domestic product based on purchasing-power-par-ity of each country.

3ifo World Economic Survey 01/ 2019 February Volume 18
ifo World Economic Climate suffers another setback
The ifo World Economic Climate deteriorated for the fourth time in succession. In the first quarter, the indi-cator dropped from -2.2 points to -13.1 points. Expecta-tions and assessments of the current economic situation dropped significantly, although experts’ overall view is still slightly positive. The global economy is slowing down more and more (see Figure 1). Deterioration of the eco-nomic climate was especially strong in advanced econ-omies. The United States in particular saw a slump in economic expectations and assessments of the present situation, and in the European Union, experts also revised their estimates significantly downward. In contrast, the economic climate in emerg-ing and developing countries remained largely unchanged, after declining sharply over the two previous quarters. The cli-mate cooled significantly in the Middle East and North Africa (see Figure 2). Experts worldwide expect weaker growth in private consumption, investment, and trade. Although a large propor-tion of respondents still expect short- and long-term interest rates to rise, their share has fallen sharply. They expect the US dol-lar to depreciate worldwide.
PACE OF ECONOMIC GROWTH IN ADVANCED ECONOMIES LIKELY TO SLOW
In the first quarter of 2019, the economic climate indicator for the advanced economies has tumbled to its lowest value since the fourth quarter of 2012, at -10.3 on the balance scale. After two solid years, this dete-rioration suggests only mild growth among the advanced economies in this quarter, espe-cially since the assessments for the current economic situation, although revised downward, remain favorable at 29.6 points. The economic outlook for the next six months continued to be pessimistic, falling from -15.7 to
-43.3 balance points. The business financing environ-ment seems favorable in the advanced economies, with only 32% of the experts reporting any constraint of bank lending to firms (see Table 1).
The different aggregates within the advanced economies show a similar development. The sentiment of economic experts in the euro area also flipped: the economic climate fell from 6.6 to -11.1 points, dipping below zero for the first time since 2014. Experts are more pessimistic about the current situation and future developments. These results point to a slower pace of economic growth in the euro area (see Figure 2).
-100
-80
-60
-40
-20
0
20
40
60
80
100
2010 2011 2012 2013 2014 2015 2016 2017 2018 2019
ifo World Economic Climate
© ifo Institute
Balances
Source: ifo World Economic Survey (WES) I/2019.
Economic climateAssessment of economic situationEconomic expectations
Figure 1
World
Euro areaCISᵃ
Latin America
Advanced economies
Emerging and developing Asia
Emerging and developing Europe
Emerging market and developing economies
Middle East and North Africa
Other advanced economies
Sub-Saharan Africa
-100
-80
-60
-40
-20
0
20
40
60
80
100
-100 -80 -60 -40 -20 0 20 40 60 80 100
Upswing
DownswingRecession
Change from IV/2018 to I/2019; balances
Economic expectations
Assessment of economic situation© ifo InstituteSource: ifo World Economic Survey (WES) I/2019.
Boom
I/2019IV/2018
ifo Business Cycle Clock for selected aggregates
ᵃ Commonwealth of Independent States.
Figure 2

4 ifo World Economic Survey 01/ 2019 February Volume 18
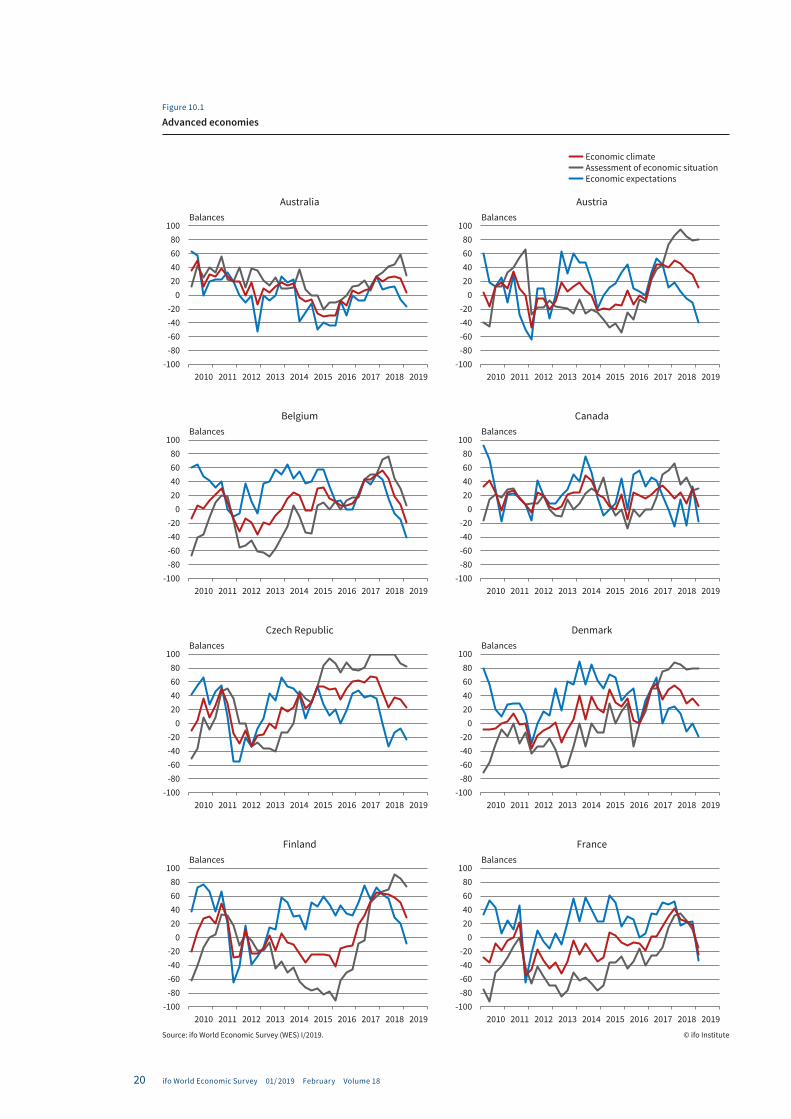
The heaviest downward revisions to assessments came from experts in France and Belgium. Economic expectations in France have flat-out plummeted. Assessments of the current economic situation have also been scaled back, though not quite so dramati-cally. They now point to -14.7 (see Figure 10.1). Fewer respondents than half a year ago report bank lending to firms to be constrained (see Table 1). In Belgium, both the current economic situation and expectations have deteriorated significantly. Assessments of the present situation remained positive and this indicator now points to 5.0 balance points. Financial conditions for firms seem to have eased as only 31.6% of the experts report constraints in bank lending to firms, compared with 50% half a year ago. In Italy, the indicator for assessments of the current economic situation declined again and is now the lowest of all euro-area countries. In contrast, the expectations of experts in Italy are stagnating at a very low level. Almost all respondents agree that the supply of credit to firms is considerably constrained (see Figure 10.2 and Table 1). Indicators in Spain saw a comparatively small drop. Assessments of the current situation remained stable at 2.3 balance points. The supply of bank credit to firms is relatively constrained here, as well, with 67.4% of the experts reporting constraints. The downward trend also extends to Germany. Here, the economic outlook indi-cator dropped by -21.3 and now points to -31.9 points. Nevertheless, experts assess the current situation as favorable, at 66.0 points. Amid a wider slowdown in the euro area, economic indicators for the Baltic countries as well as for Slovenia and Slovakia were more posi-tive (see Figure 10.3). Here, experts consider the cur-rent situation to be favorable, with indicators ranging between 95.0 points for Estonia and 38.5 for Latvia. A satisfactory economic situation also prevails in Ire-land, The Netherlands, and Portugal, but experts continue to lose confidence in the economic outlook. In Portugal, the economic climate indicator moved into negative territory with -8.9 on the balance scale (see Figure 10.2). Experts in the euro area are generally increasingly pessimistic about future exports, invest-ments, and private consumption, and expect inflation of 1.7% in 2019 (see Figure 4). Short- and long-term interest rates are likely to rise more slowly in the next six months (see Figure 8). In addition, the experts assume that share prices will fall soon.
In the United States, the economic climate indica-tor points to a loss of momentum in the economy. Both climate components deteriorated considerably. The current situation was downwardly revised by -21.3 points, but remains favorable at 57.6. The economic outlook clouded over considerably and now points to -49.2 (see Figure 10.3). In the US, bank lending to firms seems very favorable, with only 13.6% of the experts reporting constraints in this field. Experts continue to expect low levels of trade as the volume of both imports and exports is expected to decrease in the coming months. Experts set the expected inflation rate for 2019
Box1
IFO BUSINESS CYCLE CLOCK FOR THE WORLD ECONOMYA glance at the ifo Business Cycle Clock, showing the development of the two components of the economic climate in recent years, can provide a useful overview of the global medium-term forecast. The business cycle typically proceeds clockwise in a circular fashion, with expectations leading assessments of the present situation.According to the January 2019 survey, the ifo indicator for the world economy dropped for the fourth time in a row (see Figure 3.1). Experts’ assessments of the current economic situation and their economic expectations deteriorated significantly compared to the previous quarter. The indicator has dropped sharply as a result and is now very close to the recession quadrant. Figure 3.1
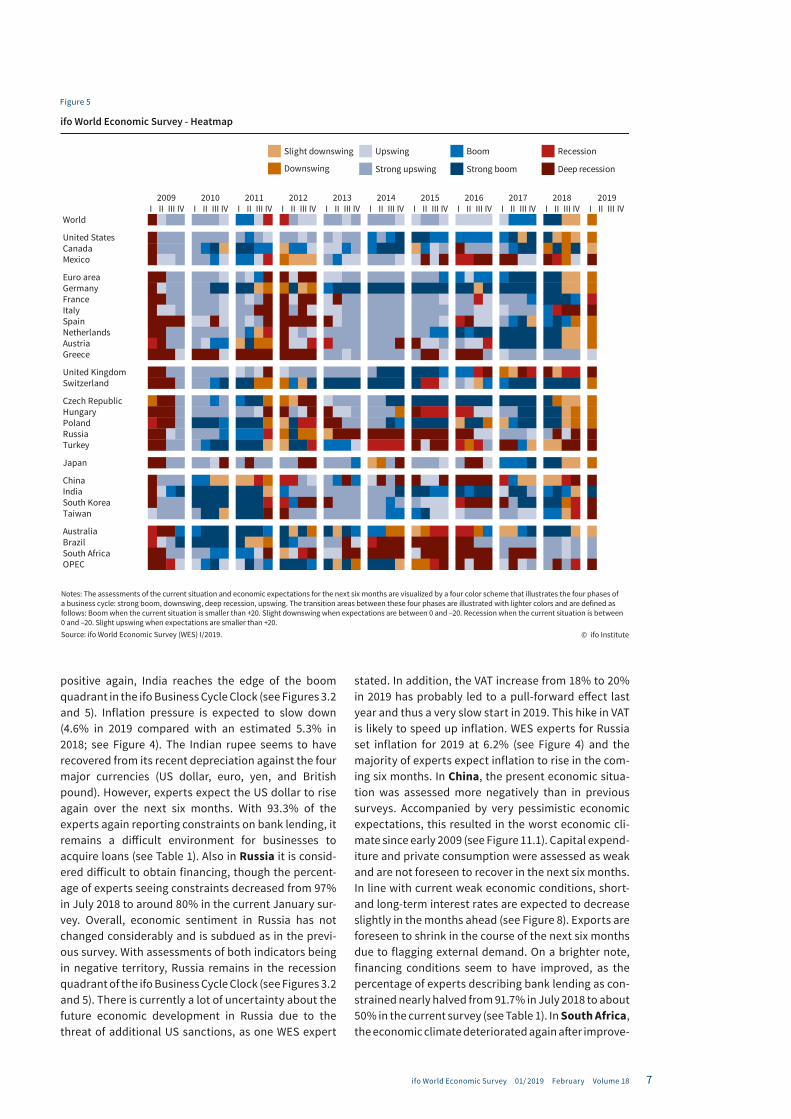
To further analyze which countries are the main drivers behind this downturn, we plotted the main advanced economies and key emerging markets in the Business Cycle Clock below and visualized the change from last quarter to the current quarter (see Figure 3.2). The advanced economies have moved towards, or further into, the recession quadrant. France saw the largest downward movement, sliding from the boom quadrant directly into the recession quadrant. While Italy and the United Kingdom are moving further into the recession quadrant, Japan and Spain are still in the downswing quadrant, although very close to the recession quadrant. The Netherlands, Germany, and the United States are moving deeper into the downswing quadrant; however, the assessments of their present economic situation remain favorable. Of the key emerging markets, both South Africa and Brazil remain in the upswing quadrant, but while South Africa’s assessments of the present economic situation and economic expectations have deteriorated somewhat, Brazil is seeing major improvement in both components. India, too, has moved slightly upward, and is now straddling the boom and downswing quadrants. To sum up, despite the two exceptions of Brazil and India, assessments were generally more pessimistic compared to last quarter and most countries are now in either the downswing or recession quadrants of the ifo Business Cycle Clock. Figure 3.2
The ifo World Economic Climate is the arithmetic mean of the assessments of the current situation and economic expectations for the next six months. The correlation of the two components can be illustrated in a four-quadrant diagram (the ifo Business Cycle Clock). The assessments on the present economic situation are positioned along the abscissa, the responses on economic expectations on the ordinate. The diagram is divided into four quadrants, representing the four phases of the world business cycle. For example, should the current economic situation be assessed as negative but expectations be positive, the world business cycle will be in an upswing phase (top left quadrant).
-100
-80
-60
-40
-20
0
20
40
60
80
100
-100 -80 -60 -40 -20 0 20 40 60 80 100
Development of the last five quarters
I/2007
I/2009
I/2008
I/2010
I/2011
I/2012
I/2013
Upswing Boom
DownswingRecession
ifo Business Cycle Clock world economy
I/2019
I/2014
I/2015I/2016
Economic expectations
Assessment of economic situation© ifo InstituteSource: ifo World Economic Survey (WES) I/2019.
Balances
France
United StatesItaly Spain
Netherlands
Brazil
China
Germany
United Kingdom
Japan
India
Russian Federation
South Africa
-100
-80
-60
-40
-20
0
20
40
60
80
100
-100 -80 -60 -40 -20 0 20 40 60 80 100
Upswing
DownswingRecession
Change from IV/2018 to I/2019; balances
Economic expectations
Assessment of economic situation© ifo InstituteSource: ifo World Economic Survey (WES) I/2019.
ifo Business Cycle Clock for selected countries
Boom
I/2019IV/2018

5ifo World Economic Survey 01/ 2019 February Volume 18
Figure 4
0 5 10 15
2019 2024
© ifo Institute
%
37.3%
18.5%
0 5 10 15
Advanced economies
Euro areaLatvia
Estonia
Lithuania
Slovakia
Austria
Slovenia
Netherlands
Luxembourg
Germany
Spain
Belgium
France
Portugal
Italy
Ireland
Finland
GreeceOther advanced
economiesUnited Kingdom
Czech Republic
Norway
Sweden
Israel
Denmark
Switzerland
United States
Australia
Canada
New Zealand
Hong Kong
Republic of Korea
Taiwan
JapanEm. market anddev. economies
CISUkraine
Kazakhstan
Russian Federation
Georgia
Latin AmericaArgentina
Uruguay
Mexico
Aggregates * and countries
%
30.8%
* To calculate aggregates, country weights are based on gross domestic product based on purchasing-power-parity (PPP) in international dollars (database IMF’s World Economic Outlook). Source: ifo World Economic Survey (WES) I/2019.
Guatemala
Brazil
Bolivia
Paraguay
Colombia
Chile
Peru
El Salvador
EcuadorEmerging and
developing AsiaPakistan
Sri Lanka
India
Malaysia
China
ThailandEmerging and
developing EuropeTurkey
Romania
Hungary
Bulgaria
Poland
Croatia
KosovoMiddle East and
North AfricaEgypt
Tunisia
Morocco
Sub-Saharan Africa
Zimbabwe
Zambia
Kenya
Nigeria
Namibia
Lesotho
South Africa
Cabo Verde
Togo
Bosnia and Herzegovina
Inflation rate expectations for 2019 and in 5 years (2024)
at 2.2% and the rate in five years at 2.4% (see Figure 4). Economic sentiment in Japan followed the economic slowdown that is present across the countries of the advanced economies. The economic climate indicator reached a three-year low, now pointing to -18.8 points on the balance scale. However, the current situation remains positive, although at the low level of 6.9 points. The economic outlook clouded over considerably as
this indicator fell by almost 30 balance points to -41.4 (see Figure 10.2). Regarding banks’ willingness to extend loans to firms, 33.3% of the experts assessed it as constrained (see Table 1). This is an improvement of the financing environment in Japan, as it marks a decrease of 10% compared with the survey in the third quarter of 2018. Respondents assessed the yen as being at the proper value in relation to the other three major
6 ifo World Economic Survey 01/ 2019 February Volume 18
currencies, the US dollar, the euro, and the British pound. Inflation for 2019 was set at 0.8% (see Figure 4). In Canada, assessments of the current economic situa-tion remain stable at 29.4 points. Experts’ economic expectations have been seeing huge swings over the last year due to the turbulent political situation, mak-ing it difficult to forecast the economic development in the next six months. Nevertheless, at 4.5 points, the economic climate remains well above the zero line on the balance scale (see Figure 10.1). Inflation rates for 2019 are expected to be 2.0% and expected inflation rates in five years remained at 2.1% (see Figure 4).The supply of bank credit to firms is constrained, according to 23.5% of respondents, which is slightly below the average of this time series for Canada (see Table 1). In the United Kingdom, all available economic senti-ment indicators in this survey point to further stagna-tion, with no change in the foreseeable future. As some of the experts commented, everything depends on the outcome of the Brexit negotiations. If the parties involved could agree on a deal, this could likely boost both investment and consumer sentiment. However, a no-deal Brexit might cause a serious economic prob-lem. Clearly due to this uncertainty, experts expect a further slowdown in trade. The annual inflation rate in 2019 and in 2024 is expected to be 2.6% and 2.5%, respectively (see Figure 4).
The other advanced economies show a similar picture, as their economic performance is slowing down as well. The economic climate indicator for this aggregate dropped by 21.4 points, falling to -13.7 points on the balance scale (see Figure 9.2). This is comparable to the level of October 2016. The economic climate indi-cator moved downward in all countries in this aggre-gate except for New Zealand. Here, assessments of current economic performance were stronger than in previous surveys and now point to 66.7. This resulted in the economic climate indicator moving upward and now pointing to 30.9 on the balance scale. Experts believe that this level of economic activity will continue in the months ahead (see Figure 10.2). According to the respondents, businesses experience fewer constraints when applying for loans than they did half a year ago (see Table 1). The inflation rate for 2019 was set at 1.8% (see Figure 4). As Figure 5 shows, South Korea and Tai-wan are moving deeper into recession after being in a downswing phase for two quarters. This loss of momen-tum is likely to continue as the Taiwanese economy faces the continuing risks of a slowdown in China (see BRICS section) and ongoing trade friction. Norway continues to boast the best economic climate, but the indicator dropped by 16.3 and now points to 36.5 on the balance scale. This is mainly due to waning optimism among the Norwegian experts regarding the economic outlook. Optimism among the respondents is markedly waning in Sweden, too; the economic outlook indica-tor saw a drop of 24.6 and now points to -31.3 balance points. Yet, the economic climate remains positive at 13.0 on the balance scale. The present economic situa-
tion in Sweden, according to the January survey results, remains very favorable.
ECONOMIC CLIMATE IN EMERGING MARKETS AND DEVELOPING ECONOMIES REMAINS SUBDUED
The economic climate in the emerging markets and developing economies as a group remained largely unchanged, having declined sharply in the two previ-ous quarters. Assessments of both the present eco-nomic situation and economic expectations remain at about -17 points on the balance scale (see Figure 9.1). Trade expectations are lower again (see Figure 7). The economic climate remains negative in all sub-groups of this aggregate (see Figure 9.2) but results in different stages of the business cycle (see Figure 2). Countries in emerging and developing Asia, emerging markets in Europe, and the Commonwealth of Independent States remain in “recession” according to the classifi-cation of the ifo Business Cycle Clock (see Figure 2), as experts’ assessments of the present situation and eco-nomic expectations both remain pessimistic. No major improvements have been recorded in Latin America or Sub-Saharan Africa, either, but as the economic out-look remains positive overall in these regions, they are situated in the upswing phase of the ifo Business Cycle Clock (see Figure 2). In the Middle East and North Africa, the climate even cooled down significantly. Assessments of both the present economic situation and economic expectations clearly turned more pessi-mistic, and this aggregate slipped from the upswing into the recession quadrant of the ifo Business Cycle Clock (see Figure 2).
The economic climate for important emerging markets (Brazil, Russia, India, China, and South Africa – BRICS) improved only marginally and, with -20.7 balance points, remains in far-negative territory (see Figure 9.1). Out of this group, the sharpest improve-ment in the economic climate was seen in Brazil (see Figure 11.1). Assessments of the present economic sit-uation are less negative than three quarters prior. Eco-nomic expectations also brightened and reached their most optimistic value in a year. The survey results for Brazil point to a more consolidated upswing phase (see Figures 3.2 and 5). One expert pointed out that there is a lot of optimism at the moment because of the newly inaugurated government. However, it is too early to tell whether their politics will provide the necessary boost to improve the economic situation in Brazil. A reduction of the fiscal deficit, for example, was mentioned as a welcome policy outcome. In contrast to the previous two surveys, experts don’t expect an increase in short- and long-term interest rates (see Figure 8). The rate of inflation for 2019 and in five years is expected to rise more slowly compared with results of the previous sur-vey (see Figure 4). India also saw an improvement in its economic climate. The present economic situation was assessed more positively than in the previous six months. With experts’ economic expectations turning
7ifo World Economic Survey 01/ 2019 February Volume 18
ifo World Economic Survey - Heatmap
Slight downswing
Downswing
Recession
Deep recession
Upswing
Strong upswing
Boom
Strong boom
© ifo Institute
�������������������������������������������������������������� ��������������������� ���� ��������������������������������������������������������������������������������������������������������������������������������������������������������������������������������������������������������������������������������������������������������������������������������������������������������������������������������� ����������������������������������������������������������������������������������������������������������������� ������������������������������Source: ifo World Economic Survey (WES) I/2019.
I II III IV I II III IV I II III IV I II III IV I II III IV I II III IV I II III IV I II III IV I II III IV I II III IV I II III IVWorld
United StatesCanadaMexico
Euro areaGermanyFranceItalySpainNetherlandsAustriaGreece
United KingdomSwitzerland
Czech RepublicHungaryPolandRussiaTurkey
Japan
ChinaIndiaSouth KoreaTaiwan
AustraliaBrazilSouth AfricaOPEC
2015 2016 2017 2018 201920142009 2010 2011 2012 2013
Figure 5
positive again, India reaches the edge of the boom quadrant in the ifo Business Cycle Clock (see Figures 3.2 and 5). Inflation pressure is expected to slow down (4.6% in 2019 compared with an estimated 5.3% in 2018; see Figure 4). The Indian rupee seems to have recovered from its recent depreciation against the four major currencies (US dollar, euro, yen, and British pound). However, experts expect the US dollar to rise again over the next six months. With 93.3% of the experts again reporting constraints on bank lending, it remains a difficult environment for businesses to acquire loans (see Table 1). Also in Russia it is consid-ered difficult to obtain financing, though the percent-age of experts seeing constraints decreased from 97% in July 2018 to around 80% in the current January sur-vey. Overall, economic sentiment in Russia has not changed considerably and is subdued as in the previ-ous survey. With assessments of both indicators being in negative territory, Russia remains in the recession quadrant of the ifo Business Cycle Clock (see Figures 3.2 and 5). There is currently a lot of uncertainty about the future economic development in Russia due to the threat of additional US sanctions, as one WES expert
stated. In addition, the VAT increase from 18% to 20% in 2019 has probably led to a pull-forward effect last year and thus a very slow start in 2019. This hike in VAT is likely to speed up inflation. WES experts for Russia set inflation for 2019 at 6.2% (see Figure 4) and the majority of experts expect inflation to rise in the com-ing six months. In China, the present economic situa-tion was assessed more negatively than in previous surveys. Accompanied by very pessimistic economic expectations, this resulted in the worst economic cli-mate since early 2009 (see Figure 11.1). Capital expend-iture and private consumption were assessed as weak and are not foreseen to recover in the next six months. In line with current weak economic conditions, short- and long-term interest rates are expected to decrease slightly in the months ahead (see Figure 8). Exports are foreseen to shrink in the course of the next six months due to flagging external demand. On a brighter note, financing conditions seem to have improved, as the percentage of experts describing bank lending as con-strained nearly halved from 91.7% in July 2018 to about 50% in the current survey (see Table 1). In South Africa, the economic climate deteriorated again after improve-

8 ifo World Economic Survey 01/ 2019 February Volume 18
ments were recorded in the last quarter of 2018. The present economic situation was assessed more nega-tively. In combination with less positive economic expectations, this country lost some ground in the upswing quadrant of the Business Cycle Clock (see Fig-ures 11.3, 3.2 and 5). Inflation is expected to shrink in the next six months. For 2019 and in 2024, experts have inflation rate expectations of 5.2% (see Figure 4), which is slightly lower than the inflation figures expressed in the previous quarter. Fewer experts than in the previ-ous survey anticipate a rise in short- and long-term interest rates (see Figure 8). The South African rand seems to have recovered from its recent depreciation against the euro, yen, and British pound. With regard to the US dollar, WES experts now even see the rand as overvalued.
OTHER EMERGING MARKETS
In emerging and developing Asia, the climate indica-tor remained unchanged at -17.0 balance points this quarter. This figure mainly reflects the economic devel-opments in China and India. The relatively poor eco-nomic conditions in China were offset by positive devel-opments in India, which resulted in a nearly unchanged economic climate for this composed time series.1 The ASEAN-5 countries (aggregate composed of Indone-sia, Malaysia, Philippines, Thailand, and Vietnam) saw a slight upturn in the economic climate. While the present economic situation recovered strongly, eco-nomic expectations turned slightly negative on bal-ance (see Figure 9.1). The economic climate in Pakistan deteriorated significantly, from -28.2 to -48.5 balance points, due to far more negative assessments of the present economic situation. Economic expectations, on the other hand, continued to brighten, but are only slightly positive on balance. Inflation is expected to rise in the next six months. WES experts expect inflation to be 8.3% in 2019, putting it among the highest in emerg-ing Asia (see Figure 4). Capital expenditure and private consumption are still regarded as weak but are likely to strengthen in the months ahead. Both short- and long-term interest rates are still forecast to rise within the next six months, but this is expressed by a decreasing share of economic experts compared with the end of 2018. The Pak rupee appears to be undervalued against the US dollar, which is likely to strengthen further in the course of the next six months.
The economic climate in emerging and develop-ing Europe improved slightly from -25.6 to -20.7 points on the balance scale. Assessments of both the present economic situation and economic expectations were described slightly less negatively than three months ago. Despite this small improvement, the aggregated survey results still remain in the recession quadrant of the ifo Business Cycle Clock (see Figures 9.1 and 2). This pattern also applies for Turkey. Assessments of both
1 For a more detailed description of China and India, see the BRICS section.
Table 1
Supply of bank credit to firms
Percentage of experts who report moderate or strong constraints
Euro area and/or G7Greece 100.0Italy 96.8Portugal 85.7Latvia 69.2Spain 67.4Ireland 62.5Austria 50.0Slovenia 44.4United Kingdom 36.8France 36.4Japan 33.3Slovakia 33.3Netherlands 43.5Belgium 31.6Germany 26.1Canada 23.5United States 13.6Finland 13.0
Other advanced economiesAustralia 77.8Israel 60.0Denmark 50.0Republic of Korea 45.5New Zealand 44.4Taiwan 33.3Sweden 31.3Norway 30.8Switzerland 24.1Czech Republic 23.5
Emerging and dev. EuropeRomania 95.2Turkey 87.5Bosnia and Herzegovina 83.3Hungary 64.3Albania 60.0Bulgaria 58.3Poland 53.8Croatia 44.4
Emerging and dev. AsiaMalaysia 100.0India 93.3Sri Lanka 80.0Pakistan 64.3Philippines 60.0China 53.8
Latin AmericaBolivia 100.0Argentina 78.6Mexico 76.5Brazil 60.0Chile 50.0Paraguay 50.0Peru 41.2Colombia 25.0Uruguay 25.0
CISKazakhstan 100.0Georgia 86.7Azerbaijan 80.0Russian Federation 79.4Ukraine 76.9
MENA & Sub-Sah. AfricaUnited Arab Emirates 60.0Cabo Verde 66.7South Africa 41.2
Only countries with more than four responses were includedin the analysis. Source: ifo World Economic Survey (WES) I/2019.

9ifo World Economic Survey 01/ 2019 February Volume 18
the present economic situation and, even more so, eco-nomic expectations, recovered slightly, but remain at a low level. As a result, the climate indicator recovered by only 8.4 balance points to -53.3 (see Figure 11.3 and 5). Both capital expenditure and private consumption are considered to be weak at present, with no recovery expected by the end of the next six months. According to WES experts, the Turkish lira seemed to have recov-ered from its past devaluation against the four major currencies (US dollar, euro, British pound, and yen), but it is expected to lose value against the US dollar again over the next six months. Inflation rate expectations for 2019, at 18.5%, are slightly lower compared with 22.7% in 2018 but still rank among the highest figures in the emerging markets (see Figure 4). The percentage of experts who report bank lending as constrained increased significantly from 58.3% in July 2018 to 87.5% in January 2019. Of the countries in emerging Europe, only in Romania did more experts report higher con-straints on bank credit to firms (95.2%, see Table 1). The economic climate indicator for Hungary and Poland fell slightly but remained above the zero line. In both countries, the present economic situation was again rated as favorable, but the economic outlook remains pessimistic. Thus, the economy of these countries is in a cyclical downswing according to the ifo WES heatmap (see Figures 10.1, 10.3, and 5). In both countries, short- and long-term interest rates are expected to rise. How-ever, in the case of Hungary, this scenario seems to be more likely as this is expected by a vast majority of experts. The economic climate for Bulgaria continued to cloud over and the indicator slipped from +9.3 to -4.2 balance points, mainly due to a deterioration of the present economic situation. The six-month economic outlook remains as pessimistic as in the previous sur-vey. According to WES experts, only private consump-tion is performing satisfactorily at present, but it, too, is likely to lose impetus in the months ahead. Capital expenditure is considered to be weak at present, with no signs of any recovery in the next six months. There were no major revisions of inflation figures, which were set at 3.0% in 2019 and 3.1% in 2024 (see Figure 4). Nota-bly, next to Hungary, the experts perceive the best eco-nomic climate in emerging Europe to be in Croatia. The present economic situation recovered slightly in Janu-ary. However, economic expectations continued the downward tendency they’ve taken since mid-2017. The respective indicator now points at 0.0, indicating eco-nomic stabilization at current satisfactory levels.
As described previously Latin America, together with Sub-Saharan Africa, is the only aggregate of emerging and developing markets located in the upswing phase of the ifo Business Cycle Clock (see Fig-ure 2). Among the indicators, however, there was not much dynamic. Assessments of the present economic situation remained subdued, while economic expecta-tions are slightly more positive for this region, leading to a marginally less negative economic climate of -9.1 balance points (see Figure 9.1). The climate indicator
remains very negative for Argentina. While assess-ments of the present economic situation remained sub-dued, economic expectations continued to brighten, promising some improvement in the current weak economic conditions in the near future (see Figure 10.1). On a brighter note, the expected inflation rate for 2019 sank to 30.8% (the figure for 2018 was 41.1%). WES experts see inflation slowing down further in the months ahead. The Argentine peso was considered to be at proper value vis-à-vis the US dollar and the euro, but undervalued against the British pound and the Jap-anese yen. Economic sentiment in Mexico deteriorated significantly, with far more pessimistic assessments of both the present economic situation and economic expectations (see Figure 11.2). The climate indicator dropped sharply from -3.1 to -41.9 balance points. In particular, private consumption and investments are considered to be very bleak at present and are expected to weaken further in the next six months. In the export sector, too, not much impetus is foreseen for the next half year. The Mexican peso is considered to be under-valued against the US dollar and is likely to lose further value in the months ahead. Chile and Colombia saw their economic climate indicators worsen consider-ably. However, as both countries started at a very high level, the economic climate remains positive at 13.6 points for Chile and 8.8 points for Colombia (see Fig-ure 11.3). Inflation rate expectations for 2019 increased compared with the figures estimated for the previous year, from 3.3% to 3.9% in Colombia and from 2.7% to 2.9% in Chile (see Figure 4). While 50% of Chilean WES experts reported bank lending to firms as constrained, the share of respondents reporting this from Colombia is 25%, indicating a relatively good supply of bank credit (see Table 1). The highest score for the economic climate within Latin America now belongs to Paraguay (23.6 on the balance scale). The present economic situation was assessed less positively than three months ago, but economic expectations continue to point toward sta-bilization at current good levels in the months ahead. Among the Latin American countries, the strongest recovery in the economic climate took place in Brazil,2 which, however, started at a very low level.
The negative economic climate of the Common-wealth of Independent States (CIS) remained nearly unchanged at -17.5 balance points. The results continue to indicate weak economic performance with no signs of recovery in the months ahead (see Figures 2 and 9.2). This pattern certainly reflects economic developments in Russia, whose weight accounts for nearly 80% of this aggregate and where uncertainty over the impact of US sanctions still prevails.3 In Ukraine, assessments of the present economic situation deteriorated again and remained in unfavorable territory. The economic out-look, however, brightened and WES experts are some-what more confident regarding the next six months
2 For a more detailed description of Brazil, see the BRICS section.3 For a more detailed description of the situation in Russia, see the BRICS section.

10 ifo World Economic Survey 01/ 2019 February Volume 18
Box 2
TRADE AND FOREIGN POLICY IN LATIN AMERICA: DO NEW IDEOLOGIES MEAN NEW TRADE PARTNERS?
Lia Baker Valls Pereira, Research Associate at FGV and Professor at State University of Rio de Janeiro
In January 2019, the new president of Brazil, Jair Bolsonaro—identified as a right-wing politician—took office. This marks a political turning point after a series of four mandates (16 years) for the Labor Party. In Mexico, the second largest economy in Latin America, the recent election was won by López Obrador, a left-wing candidate from outside the circle of dominant parties in Mexican politics. In light of these recent developments, this section sets out to clarify the main political trends in Latin America and how they influence the region’s inter-national economic relations.
In the 2000s, only Colombia and Peru were ruled by centrist or right-wing parties; the other coun-tries were governed by center-left, left-wing, or social-democratic coalitions. This period saw two notable developments. First was China’s impact on commodity-exporting countries: its demand for agricultural commodities and minerals led to gains in terms of trade over the 2002–2012 period, ensur-ing economic growth across the region. Commodi-ty-trading countries especially benefitted from the demand coming from China. Terms of trade saw the strongest growth in Argentina (36.2%), Brazil (29.2%), Chile (99.3%), Colombia (62.6%), and Peru (66%). In contrast, Mexico, which is not a major commodity exporter in the Latin American region, registered a gain of just 8.6% in its terms of trade.1
After commodity prices started to drop in 2013, countries’ responses varied. Brazil and Argentina, for example, opted for expansive fiscal policies and incentives for domestic industrial production, which led to a deterioration of public accounts.
The other major development of this period was an uptick in initiatives for South American integra-tion and efforts to solidify the role of South Amer-ican countries in multilateral organizations. For example, the Union of South American Nations was established, in part to create a free trade area in the region. However, it made little progress regarding commercial and economic areas.
Since 2010, against the backdrop of the interna-tional economic slowdown and the fall in commod-ity prices, further South American integration has become a subject for debate. Countries with left-wing governments, such as Venezuela, Ecuador, and Bolivia have taken an anti-globalist stance and challenged developed countries, especially the United States. Chile, even when governed by center-left parties, has always had a more open foreign policy, and has a free trade agreement with
1 Source: World Bank database
the United States, the European Union, and China. In response to the global financial crisis, Peru and Colombia introduced a series of reforms and made agreements with major world economies. The Mer-cosur countries2 differ quite substantially in their policy positions, and with Venezuela’s entry into the group, it has been difficult to advance an agenda of agreements with other countries.
The South American continent was further split in 2013, when Mexico, Chile, Peru, and Colom-bia formed the Pacific Alliance. In addition, Brazil joined the BRICS group in the belief that common interests, especially with India and China, could increase their decision-making power in multi-lateral economic organizations. One goal was to ensure more flexible rules covering development funding, for example for state-owned enterprises. During this period, Brazil continued to negoti-ate with the European Union and signed bilateral agreements with the United States on certification of standards and trade facilitation. Failure to sign a free trade agreement can be explained by possible negative effects this would have on the Brazilian industrial sector.
In short, when South America was dominated by left-wing or center-left parties, anti-trade liberali-zation or the introduction of protectionist policies were not generalized across the continent. They began to occur in Brazil and Argentina as a response to the crisis that worsened after 2013. Uruguay and Chile remain exceptions.
Now, in 2019, all governments in Latin America except Uruguay, Bolivia, and Venezuela are identi-fied as right-wing. But there are some national elec-tions coming up this year: In Argentina, the current centre-right president is the favorite. In Uruguay, re-election of the center-left party is expected, and in Bolivia, Evo Morales from the left wing MAS-IPSP party is aiming at re-election for a controver-sial fourth time. So the question remains: Will the election results change current economic policy in South America?
The new Brazilian government’s program includes economic measures such as social security reform, tax reform, privatization, changes in bureaucracy that allow for the reduction of public spending, and reduction of import tariffs. These policies are per-ceived as important for improving Brazil’s business environment and increasing productivity, which will in turn contribute to a new cycle of expansion for the Brazilian economy. This policy is similar to
2 Argentina, Brazil, Paraguay, Uruguay, and Venezuela.

11ifo World Economic Survey 01/ 2019 February Volume 18
(see Figure 11.3). The economic climate in Georgia and Kazakhstan improved. In both countries, the present economic situation was assessed more positively than three months ago. The economic outlook, however, remained unchanged: for Georgia, economic activity is expected to remain as satisfactory as at present, while WES experts in Kazakhstan expect a deterioration in economic development in the next six months.
The economic climate for countries in the Middle East and North Africa (MENA) deteriorated signifi-cantly and now stands at -33.6 balance points. Experts scaled back their assessments of the present situation considerably, as well as their economic expectations for the region (see Figures 2 and 8.2). This trend is driven mainly by the United Arab Emirates and Tunisia, where both climate indicators worsened substantially. In Egypt, the present economic situation deteriorated further, but with economic expectations being far more optimistic, the economy is likely to recover soon. In Sub-Saharan Africa, the economic climate deterio-rated from -17.0 to -20.4 balance points. Assessments of the present situation were again revised downward, indicating a very weak economic condition at present. The economic outlook for the next six months, how-ever, improved slightly (see Figures 2 and 9.2). In Namibia, the economic outlook continued to brighten, but with the present economic situation being very
negative, the economic climate remains extremely poor (see Figure 11.2). In Nigeria, no changes were recorded compared with last year’s survey: the present economic situation remains unfavorable with no signs of recovery in the months ahead. The economic situa-tion in Zimbabwe continues to be very weak. Economic expectations turned pessimistic and signal a further deterioration of current weak economic conditions (see Figure 11.3). Among these countries, Kenya pro-vides the best economic climate, at 25.0 points on the balance scale. Here, the economic situation was again assessed as favorable and the economic outlook turned positive again (see Figure 11.2).
the policies of other right-wing governments in the region. Even governments more worried about social issues tend to agree with some of these pro-posals. This has led to economic indicators to point to optimism and increased confidence. However, for trade and foreign policy, the new Brazilian gov-ernment initially had more controversial goals. Pre-viously announced plans included moving Brazilian trade away from China and more toward the United States, and distancing themselves from further integration in South America.
However, China remains a key strategic market for Brazil as well as other South American coun-tries. In 2018, China was the largest importer of Brazilian exports (26.8%), followed by the United States (12.0%) and Argentina (6.2%). It accounted for 79% of Brazil’s total soybean exports, 44% of crude oil, and 54% of iron ore. For manufactured products, however, the South American markets and the United States are the main destination of Brazilian exports. China is also the main market for two countries in the Pacific Alliance –Chile and Peru – with the United States, European Union, and South America accounting for similar shares. The United States, however, is the main market for Colombia and Mexico, and the latter continues to be motivated to renegotiate the NAFTA agreement. Ecuador and Venezuela are also highly dependent
on the United States as their main market for oil, with China occupying second place. Regarding multilateral organizations, the Brazilian govern-ment has set securing OECD membership as one of its priorities, which would help in consolidating its commitment to macroeconomic stability. Brazil is hosting the BRICS summit this year, which is when the host country is expected to announce its prior-ities for the bloc.
Overall, the initial anti-China and anti-Mercosur stance of the new Brazilian government appears to have retreated, while continuing to prioritize increasing trade with the United States. The new government wants to diversify its export products and is therefore looking for new partners. Its stance on South America integration has also shifted, and now includes making it a priority to secure the Mer-cosur area as a fully functioning free trade area and to achieve rapprochement with the Pacific Alliance. Thus, regardless of the government’s ideological bent, Brazil will continue to seek ways to ensure trade with China. At a time when WTO negotia-tions have been producing few results, perhaps one should keep the Chilean approach in mind—regardless of which party is in power, key strat-egy is always to extend its network of bilateral agreements.

12 ifo World Economic Survey 01/ 2019 February Volume 18
ENERGY TRANSITION AROUND THE WORLD: IS IT GOING FAR ENOUGH?
By Dorine Boumans and Johann Wackerbauer
Around two-thirds of global greenhouse gas (GHG) emissions stem from energy production and use, which puts the energy sector at the core of efforts to combat climate change. In many European countries, renewa-bles are increasingly replacing conventional energy sources, and globally the use of renewable energy is on the rise. This has wide-ranging implications for global energy industries and actors, not least oil-exporting countries. The special question in the current WES focuses on this energy transition. We analyze economic experts’ views on energy transition in their country’s energy policy and how this is perceived in relation to climate change. First, we assess the perceived impor-tance of an energy transition for each country’s energy policy, and whether this is affecting its economy. Sec-ond, we look at how including an energy transition in government energy policies has developed since the Paris Agreement on climate change. Third, we ask our respondents if they think enough governments will act to reduce climate change, enabling us to determine where the most pessimistic experts are.
FACTORS THAT INFLUENCE WHETHER A COUNTRY PRIORITIZES ENERGY TRANSITION
The term “energy transition” means the switch from fossil and nuclear power (non-renewable energy) to renewable energies and energy saving. How an energy transition affects different countries depends on the extent to which they are affected by climate change; whether they are net importers or net exporters of fos-sil fuels; and how far they have developed renewable energies. Finally, public opinion about climate change in the different countries plays a major role. Nations
around the world have plans to expand renewable energy or improve energy efficiency. By the end of 2017, targets for the renewable share of primary and final energy were in place in 87 countries, while sector-spe-cific targets for renewable power were in place in 146; 48 countries had established targets for renewable heating and cooling, and 42 countries had them in place for renewable transport. A total of 57 countries had developed plans to decarbonize their electricity sectors completely, and 179 had set renewable energy targets on the national or state level. At least 145 coun-tries had implemented energy efficiency policies, and at least 157 countries had set energy efficiency targets. The European Union has made a collective regional commitment to renewable energy.1
It is not only net importers of fossil energy that are setting targets for increasing the proportion of renew-ables in their energy mix; many major oil-producing countries are doing the same. Nevertheless, it makes sense to assess the impact of the energy transition on different world regions with respect to their status as net importers or net exporters of fossil energy. In the Commonwealth of Independent States, the Middle East and North Africa, and Sub-Saharan Africa, dependence on fossil energy exports is particularly high compared to GDP; the same is true to a lesser extent in Latin Amer-ica. By contrast, the biggest beneficiaries of the energy transition due to their high dependency on fossil energy imports are expected to be Japan, South Asia, Europe, and China.2 There would be a slightly positive impact for Southeast Asia and North America as well.3
Therefore, the survey analysis takes this characteristic of the world regions into account.4
1 REN21, Renewables 2018 – Global Status Report, Renewable Energy Policy Network for the 21st Century, 2018.2 The IRENA report also identifies Small Island Developing States as a potential net benefit of the energy transition. However, due to the small number of partici-pants within this category, we have excluded this aggregate from our analysis. 3 International Renewable Energy Agency IRENA, A New World – The Geopoli-tics of the Energy Transformation, 2019.4 Australia is also a major exporter of fossil fuels. But as Australia and New Zealand are not considered in the IRENA report, the corresponding results are shown in the charts but not further discussed.
Mean of answers
4 – Not important
3 – Fairly Important
2 – Important
1 – Very important
Source: ifo World Economic Survey (WES) I/2019. © ifo Institute
How important is energy transition to your country’s energy policy?
Figure 6

13ifo World Economic Survey 01/ 2019 February Volume 18
Figure 6.1 gives an overview of the extent to which economic experts regard energy transition to be impor-tant for the energy policy of their country. Governments in Europe and Asia seem to give importance to energy transition into their energy policies. Especially in Ger-many, Netherlands and Sweden do the respondents regard energy transition to be important for their energy policy. Whereas the US and Russia seem to give a lower priority to the inclusion of energy transition into their energy policy.
Following the analysis of the IRENA report, Figure 6.2 shows how opinions are divided among the aggre-gates. Interestingly, 60% of respondents in the United States and 43% of CIS report that an energy transition is “not important” to their current energy policy. In Latin America, too, this is the opinion of a considerable share of experts (27%). Taking all countries together, roughly 20% report that no importance is given to energy transition.
To assess whether including an energy transition in a country’s energy policy has an impact on its economy, we analyzed the experts’ answers based on whether or not they said energy transition is important.5 In Europe6, of the 87% of respondents who said that an energy transition is important to their country’s energy policy, 38% report that the current policy affects the economy negatively. In contrast, 35% report a positive effect on the economy and 27% report no impact (see Table 2). Of
5 We regrouped the categories into “Important” and “Not important,” where “important” encompasses the “Very important,” “Important,” and “Fairly important” categories. 6 The survey includes 510 respondents from Europe.
the respondents who said that the government attrib-utes no importance to energy transition, most (56%) say this has a negative impact on their country’s econ-omy, while around 40% report no impact. Of those experts who report that an energy transition is cur-rently important to their country’s energy policy, but that it is negatively affecting the economy, 80% call for even higher priority to be given to promoting energy transition.
In the US7, a clear majority (60%) report that the current energy policy does not focus on energy transi-tion. Of those, 54% report that this has a negative impact on the US economy, while 31% report no impact. Those experts that believe government policy does not attribute any importance to energy transition and that this affects the economy negatively call almost unani-mously for higher priority to be given to energy transi-tion. In Canada, Japan, and China, energy policies do give importance to energy transition. However, 81% of the respondents in Canada believe this to have a nega-tive impact on the country’s economy. Opinions in China and Japan are more diverse, with the tendency toward reporting a positive impact on the economy. In Canada, those experts that report a negative effect on the economy by the current inclusion of energy transi-tion in their energy policy do not agree on the direction the government should take: whether promoting energy transition should take lower (42%) or higher pri-ority (33%).
7 In total there were 58 respondents from the US.
Source: ifo World Economic Survey (WES) I/2019. © ifo Institute
Importance of energy transition to country’s energy policy by aggregates and selected countries
Europe
US
Canada
Japan
China
Emerging / developing Asia
Latin America
CIS
Middle East / North Africa
Sub-Saharan Africa
Australia and New Zealand
Very important Fairly importantNot important Don’t knowImportant
0 20 40 60 80 100 %
Figure 6.2
Source: ifo World Economic Survey (WES) I/2019. © ifo Institute
In your opinon, how should your government prioritize promotion of energy transition?
Europe
US
Canada
Japan
China
Emerging / developing Asia
Latin America
CIS
Middle East / North Africa
Sub-Saharan Africa
Australia and New Zealand
Higher priority Lower priorityNot at allJust as it is
0 20 40 60 80 100 %
Figure 6.3

14 ifo World Economic Survey 01/ 2019 February Volume 18
In those aggregates where the IRENA report found negative impacts on these countries’ economies due to dependency on fossil energy exports—Latin America, CIS, MENA8, and Sub-Saharan Africa—most of the respondents share the opinion that their governments do in fact take notice of energy transition in some regard. Nevertheless, they believe that further action can be taken and that higher priority should be given to energy transition. In emerging and developing Asia, of those experts who say energy transition is important for their country’s energy policy, most (53%) believe this also has a positive effect on their country’s econ-omy. Still, respondents say more can be done, and they also urge their governments to give higher priority to promoting energy transition (see Figure 6.3).
When asked if the government of their country should promote energy transition differently, a clear majority of all respondents (71%) reported that their government should promote an energy transition with higher priority. Respondents in China seem to be most satisfied with the current policy, with 41% indicating that their government should promote energy transi-tion just as it is doing now (see Figure 6.3). Neverthe-
8 Middle East and North Africa
less, 58% still want the government to give it higher priority. In Canada, experts were evenly split, with the categories of higher priority and lower priority each earning 37.5% of responses.
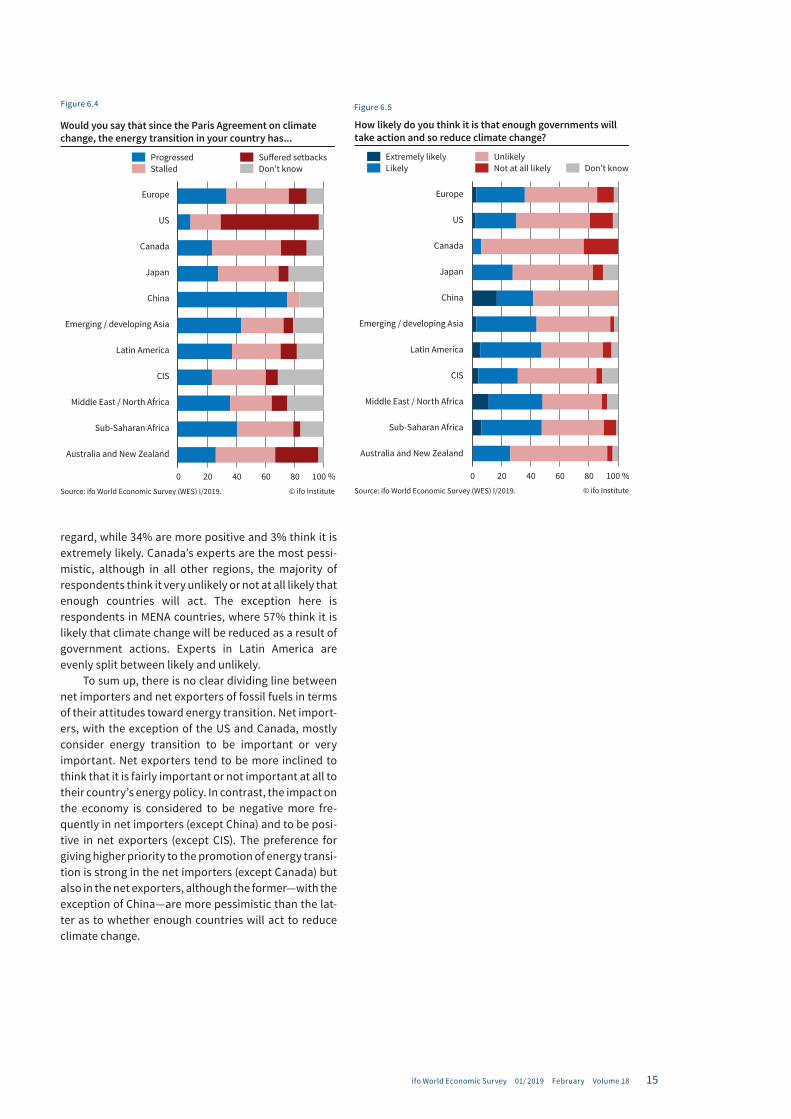
To get a sense of the latest developments in the energy transition, we asked the WES experts to assess these developments since the Paris Agreement on cli-mate change (see Figure 6.4). Overall, 38% of the experts believe progress has stalled in their countries. Roughly the same amount (32%), however, believe energy transition to have progressed. The latter opin-ion is particularly pronounced in China, where 75% of the experts report that the energy transition seems to be progressing. In the US, a clear majority (67%) report setbacks in this policy area. Experts in Latin America and emerging and developing Asia are practically evenly split as to whether developments have pro-gressed or stalled, with progressed taking a slight edge. In Europe, most respondents (45%) report energy tran-sition to have stalled since the Paris Agreement.
We posed another question to the WES panel to gauge how pessimistic the respondents are with regard to whether governments will act together to reduce cli-mate change (see Figure 6.5). Of the respondents, 49% find it unlikely that enough governments will act in this
Table 2
What impact will the current energy transition, or lack thereof, have on your country’s economy?
Country/region Importance of energy transition in the country’s energy policy Count Highly positive
(in %)Positive
(in %)No impact
(in %)Negative
(in %)Very negative
(in %)
Europe important 516 2.0 33.2 27.3 35.2 2.4
not important 77 1.3 3.9 39.0 48.1 7.8
US important 23 0.0 4.4 21.7 73.9 0.0
not important 35 0.0 14.3 31.4 45.7 8.6
Canada important 16 6.3 0.0 12.5 75.0 6.3
not important 1 0.0 0.0 100.0 0.0 0.0
Japan important 28 3.6 28.6 28.6 35.7 3.6
not important 0 0.0 0.0 0.0 0.0 0.0
China important 12 0.0 75.0 8.3 16.7 0.0
not important 0 0.0 0.0 0.0 0.0 0.0
Emerging and developing Asia important 61 6.7 48.3 23.3 16.7 5.0
not important 15 0.0 13.3 60.0 20.0 6.7
Latin America important 98 9.2 50.0 26.5 14.3 0.0
not important 36 2.8 5.6 55.6 22.2 13.9
CIS important 40 12.5 30.0 30.0 27.5 0.0
not important 31 0.0 0.0 86.7 13.3 0.0
Middle East and North Africa important 23 8.7 56.5 21.7 8.7 4.4
not important 4 0.0 0.0 66.7 33.3 0.0
Sub-Saharan Africa important 71 11.3 50.7 23.9 11.3 2.8
not important 12 8.3 8.3 50.0 25.0 8.3
Australia and New Zealand important 18 0.0 16.7 50.0 27.8 5.6
not important 9 0.0 11.1 33.3 33.3 22.2
Total important 906 4.5 36.6 26.5 30.1 2.3
not important 220 1.4 6.4 49.5 34.4 8.3
Source: ifo World Economic Survey (WES) I/2019.
15ifo World Economic Survey 01/ 2019 February Volume 18
Source: ifo World Economic Survey (WES) I/2019. © ifo Institute
Would you say that since the Paris Agreement on climate change, the energy transition in your country has...
Europe
US
Canada
Japan
China
Emerging / developing Asia
Latin America
CIS
Middle East / North Africa
Sub-Saharan Africa
Australia and New Zealand
Progressed Suffered setbacksDon’t knowStalled
0 20 40 60 80 100 %
Figure 6.4
0 20 40 60 80 100 %
Extremely likely UnlikelyNot at all likely Don’t knowLikely
Source: ifo World Economic Survey (WES) I/2019. © ifo Institute
How likely do you think it is that enough governments will take action and so reduce climate change?
Europe
US
Canada
Japan
China
Emerging / developing Asia
Latin America
CIS
Middle East / North Africa
Sub-Saharan Africa
Australia and New Zealand
Figure 6.5
regard, while 34% are more positive and 3% think it is extremely likely. Canada’s experts are the most pessi-mistic, although in all other regions, the majority of respondents think it very unlikely or not at all likely that enough countries will act. The exception here is respondents in MENA countries, where 57% think it is likely that climate change will be reduced as a result of government actions. Experts in Latin America are evenly split between likely and unlikely.
To sum up, there is no clear dividing line between net importers and net exporters of fossil fuels in terms of their attitudes toward energy transition. Net import-ers, with the exception of the US and Canada, mostly consider energy transition to be important or very important. Net exporters tend to be more inclined to think that it is fairly important or not important at all to their country’s energy policy. In contrast, the impact on the economy is considered to be negative more fre-quently in net importers (except China) and to be posi-tive in net exporters (except CIS). The preference for giving higher priority to the promotion of energy transi-tion is strong in the net importers (except Canada) but also in the net exporters, although the former—with the exception of China—are more pessimistic than the lat-ter as to whether enough countries will act to reduce climate change.

16 ifo World Economic Survey 01/ 2019 February Volume 18
Figure 7
Source: ifo World Economic Survey (WES) I/2019; CPB Netherlands Bureau for Economic Policy Analysis (CPB). © ifo Institute
-12-10-8-6-4-202468
-100-80-60-40-20
020406080
100
2000 2002 2004 2006 2008 2010 2012 2014 2016 2018
Advanced economiesBalances Rate of change in %
-12-10-8-6-4-202468
-100-80-60-40-20
020406080
100
2000 2002 2004 2006 2008 2010 2012 2014 2016 2018
Emerging market and developing economiesBalances Rate of change in %
-12-10-8-6-4-202468
-100-80-60-40-20
020406080
100
2000 2002 2004 2006 2008 2010 2012 2014 2016 2018
Euro areaBalances Rate of change in %
-12-10-8-6-4-202468
-100-80-60-40-20
020406080
100
2000 2002 2004 2006 2008 2010 2012 2014 2016 2018
Latin AmericaBalances Rate of change in %
-10-8-6-4-20246810
-100-80-60-40-20
020406080
100
2000 2002 2004 2006 2008 2010 2012 2014 2016 2018
Middle East and North AfricaBalances Rate of change in %
-10-8-6-4-20246810
-100-80-60-40-20
020406080
100
2000 2002 2004 2006 2008 2010 2012 2014 2016 2018
AsiaBalances Rate of change in %
-12-10-8-6-4-202468
-100-80-60-40-20
020406080
100
2000 2001 2002 2003 2004 2005 2006 2007 2008 2009 2010 2011 2012 2013 2014 2015 2016 2017 2018 2019
WorldBalances Rate of change in %
WES trade expectations CPB World Trade Monitor
Comparison of WES experts trade expectations and the CPB World Trade Monitor in selected aggregates
Lorem ipsum

17ifo World Economic Survey 01/ 2019 February Volume 18
Figure 8
Source: ifo World Economic Survey (WES) I/2019. © ifo Institute
-100-80-60-40-20
020406080
100
2010 2011 2012 2013 2014 2015 2016 2017 2018 2019
JapanBalances
-100-80-60-40-20
020406080
100
2010 2011 2012 2013 2014 2015 2016 2017 2018 2019
United StatesBalances
-100-80-60-40-20
020406080
100
2010 2011 2012 2013 2014 2015 2016 2017 2018 2019
United KingdomBalances
-100-80-60-40-20
020406080
100
2010 2011 2012 2013 2014 2015 2016 2017 2018 2019
BrazilBalances
-100-80-60-40-20
020406080
100
2010 2011 2012 2013 2014 2015 2016 2017 2018 2019
South AfricaBalances
-100-80-60-40-20
020406080
100
2010 2011 2012 2013 2014 2015 2016 2017 2018 2019
World economyBalances
-100-80-60-40-20
020406080
100
2010 2011 2012 2013 2014 2015 2016 2017 2018 2019
Euro areaBalances
-100-80-60-40-20
020406080
100
2010 2011 2012 2013 2014 2015 2016 2017 2018 2019
ChinaBalances
Short-term Long-term
Expected trend for the next 6 months for short- and long-term interest rates

18 ifo World Economic Survey 01/ 2019 February Volume 18
Figure 9.1
Source: ifo World Economic Survey (WES) I/2019. © ifo Institute
-100-80-60-40-20
020406080
100
2010 2011 2012 2013 2014 2015 2016 2017 2018 2019
European UnionBalances
-100-80-60-40-20
020406080
100
2010 2011 2012 2013 2014 2015 2016 2017 2018 2019
G7Balances
-100-80-60-40-20
020406080
100
2010 2011 2012 2013 2014 2015 2016 2017 2018 2019
BRICSBalances
-100-80-60-40-20
020406080
100
2010 2011 2012 2013 2014 2015 2016 2017 2018 2019
ASEAN 5Balances
-100-80-60-40-20
020406080
100
2010 2011 2012 2013 2014 2015 2016 2017 2018 2019
Emerging and developing EuropeBalances
-100-80-60-40-20
020406080
100
2010 2011 2012 2013 2014 2015 2016 2017 2018 2019
Emerging and developing AsiaBalances
-100-80-60-40-20
020406080
100
2010 2011 2012 2013 2014 2015 2016 2017 2018 2019
Advanced economiesBalances
-100-80-60-40-20
020406080
100
2010 2011 2012 2013 2014 2015 2016 2017 2018 2019
Emerging market and developing economiesBalances
Economic climate Assessment of economic situation Economic expectations
Selected aggregates

19ifo World Economic Survey 01/ 2019 February Volume 18
Figure 9.2
Source: ifo World Economic Survey (WES) I/2019. © ifo Institute
-100-80-60-40-20
020406080
100
2010 2011 2012 2013 2014 2015 2016 2017 2018 2019
Middle East and North AfricaBalances
-100-80-60-40-20
020406080
100
2010 2011 2012 2013 2014 2015 2016 2017 2018 2019
Sub-Saharan AfricaBalances
-100-80-60-40-20
020406080
100
2010 2011 2012 2013 2014 2015 2016 2017 2018 2019
OPECBalances
-100-80-60-40-20
020406080
100
2010 2011 2012 2013 2014 2015 2016 2017 2018 2019
OECDBalances
-100-80-60-40-20
020406080
100
2010 2011 2012 2013 2014 2015 2016 2017 2018 2019
Asian TigersBalances
-100-80-60-40-20
020406080
100
2010 2011 2012 2013 2014 2015 2016 2017 2018 2019
Other advanced economiesBalances
-100-80-60-40-20
020406080
100
2010 2011 2012 2013 2014 2015 2016 2017 2018 2019
Latin AmericaBalances
-100-80-60-40-20
020406080
100
2010 2011 2012 2013 2014 2015 2016 2017 2018 2019
Commonwealth of Independent StatesBalances
Economic climate Assessment of economic situation Economic expectations
Selected aggregates
20 ifo World Economic Survey 01/ 2019 February Volume 18
Figure 10.1
Source: ifo World Economic Survey (WES) I/2019. © ifo Institute
-100-80-60-40-20
020406080
100
2010 2011 2012 2013 2014 2015 2016 2017 2018 2019
BelgiumBalances
-100-80-60-40-20
020406080
100
2010 2011 2012 2013 2014 2015 2016 2017 2018 2019
CanadaBalances
-100-80-60-40-20
020406080
100
2010 2011 2012 2013 2014 2015 2016 2017 2018 2019
Czech RepublicBalances
-100-80-60-40-20
020406080
100
2010 2011 2012 2013 2014 2015 2016 2017 2018 2019
DenmarkBalances
-100-80-60-40-20
020406080
100
2010 2011 2012 2013 2014 2015 2016 2017 2018 2019
FinlandBalances
-100-80-60-40-20
020406080
100
2010 2011 2012 2013 2014 2015 2016 2017 2018 2019
FranceBalances
-100-80-60-40-20
020406080
100
2010 2011 2012 2013 2014 2015 2016 2017 2018 2019
AustraliaBalances
-100-80-60-40-20
020406080
100
2010 2011 2012 2013 2014 2015 2016 2017 2018 2019
AustriaBalances
Economic climate Assessment of economic situation Economic expectations
Advanced economies

21ifo World Economic Survey 01/ 2019 February Volume 18
Figure 10.2
Source: ifo World Economic Survey (WES) I/2019. © ifo Institute
-100-80-60-40-20
020406080
100
2010 2011 2012 2013 2014 2015 2016 2017 2018 2019
ItalyBalances
-100-80-60-40-20
020406080
100
2010 2011 2012 2013 2014 2015 2016 2017 2018 2019
JapanBalances
-100-80-60-40-20
020406080
100
2010 2011 2012 2013 2014 2015 2016 2017 2018 2019
KoreaBalances
-100-80-60-40-20
020406080
100
2010 2011 2012 2013 2014 2015 2016 2017 2018 2019
NetherlandsBalances
-100-80-60-40-20
020406080
100
2010 2011 2012 2013 2014 2015 2016 2017 2018 2019
New ZealandBalances
-100-80-60-40-20
020406080
100
2010 2011 2012 2013 2014 2015 2016 2017 2018 2019
PortugalBalances
-100-80-60-40-20
020406080
100
2010 2011 2012 2013 2014 2015 2016 2017 2018 2019
GermanyBalances
-100-80-60-40-20
020406080
100
2010 2011 2012 2013 2014 2015 2016 2017 2018 2019
GreeceBalances
Economic climate Assessment of economic situation Economic expectations
Advanced economies

22 ifo World Economic Survey 01/ 2019 February Volume 18
Figure 10.3
Source: ifo World Economic Survey (WES) I/2019. © ifo Institute
-100-80-60-40-20
020406080
100
2010 2011 2012 2013 2014 2015 2016 2017 2018 2019
SpainBalances
-100-80-60-40-20
020406080
100
2010 2011 2012 2013 2014 2015 2016 2017 2018 2019
SwedenBalances
-100-80-60-40-20
020406080
100
2010 2011 2012 2013 2014 2015 2016 2017 2018 2019
SwitzerlandBalances
-100-80-60-40-20
020406080
100
2010 2011 2012 2013 2014 2015 2016 2017 2018 2019
TaiwanBalances
-100-80-60-40-20
020406080
100
2010 2011 2012 2013 2014 2015 2016 2017 2018 2019
United KingdomBalances
-100-80-60-40-20
020406080
100
2010 2011 2012 2013 2014 2015 2016 2017 2018 2019
United StatesBalances
-100-80-60-40-20
020406080
100
2010 2011 2012 2013 2014 2015 2016 2017 2018 2019
Slovak RepublicBalances
-100-80-60-40-20
020406080
100
2010 2011 2012 2013 2014 2015 2016 2017 2018 2019
SloveniaBalances
Economic climate Assessment of economic situation Economic expectations
Advanced economies

23ifo World Economic Survey 01/ 2019 February Volume 18
Figure 11.1
Source: ifo World Economic Survey (WES) I/2019. © ifo Institute
-100-80-60-40-20
020406080
100
2010 2011 2012 2013 2014 2015 2016 2017 2018 2019
BulgariaBalances
-100-80-60-40-20
020406080
100
2010 2011 2012 2013 2014 2015 2016 2017 2018 2019
ChileBalances
-100-80-60-40-20
020406080
100
2010 2011 2012 2013 2014 2015 2016 2017 2018 2019
ChinaBalances
-100-80-60-40-20
020406080
100
2010 2011 2012 2013 2014 2015 2016 2017 2018 2019
ColombiaBalances
-100-80-60-40-20
020406080
100
2010 2011 2012 2013 2014 2015 2016 2017 2018 2019
EgyptBalances
-100-80-60-40-20
020406080
100
2010 2011 2012 2013 2014 2015 2016 2017 2018 2019
HungaryBalances
-100-80-60-40-20
020406080
100
2010 2011 2012 2013 2014 2015 2016 2017 2018 2019
ArgentinaBalances
-100-80-60-40-20
020406080
100
2010 2011 2012 2013 2014 2015 2016 2017 2018 2019
BrazilBalances
Economic climate Assessment of economic situation Economic expectations
Emerging market and developing economies

24 ifo World Economic Survey 01/ 2019 February Volume 18
Figure 11.2
Source: ifo World Economic Survey (WES) I/2019. © ifo Institute
-100-80-60-40-20
020406080
100
2010 2011 2012 2013 2014 2015 2016 2017 2018 2019
LesothoBalances
-100-80-60-40-20
020406080
100
2010 2011 2012 2013 2014 2015 2016 2017 2018 2019
MalaysiaBalances
-100-80-60-40-20
020406080
100
2010 2011 2012 2013 2014 2015 2016 2017 2018 2019
MexicoBalances
-100-80-60-40-20
020406080
100
2010 2011 2012 2013 2014 2015 2016 2017 2018 2019
NamibiaBalances
-100-80-60-40-20
020406080
100
2010 2011 2012 2013 2014 2015 2016 2017 2018 2019
NigeriaBalances
-100-80-60-40-20
020406080
100
2010 2011 2012 2013 2014 2015 2016 2017 2018 2019
PeruBalances
-100-80-60-40-20
020406080
100
2010 2011 2012 2013 2014 2015 2016 2017 2018 2019
IndiaBalances
-100-80-60-40-20
020406080
100
2010 2011 2012 2013 2014 2015 2016 2017 2018 2019
KenyaBalances
Economic climate Assessment of economic situation Economic expectations
Emerging market and developing economies

25ifo World Economic Survey 01/ 2019 February Volume 18
Figure 11.3
Source: ifo World Economic Survey (WES) I/2019. © ifo Institute
-100-80-60-40-20
020406080
100
2010 2011 2012 2013 2014 2015 2016 2017 2018 2019
Russian FederationBalances
-100-80-60-40-20
020406080
100
2010 2011 2012 2013 2014 2015 2016 2017 2018 2019
South AfricaBalances
-100-80-60-40-20
020406080
100
2010 2011 2012 2013 2014 2015 2016 2017 2018 2019
TogoBalances
-100-80-60-40-20
020406080
100
2010 2011 2012 2013 2014 2015 2016 2017 2018 2019
TurkeyBalances
-100-80-60-40-20
020406080
100
2010 2011 2012 2013 2014 2015 2016 2017 2018 2019
UkraineBalances
-100-80-60-40-20
020406080
100
2010 2011 2012 2013 2014 2015 2016 2017 2018 2019
ZimbabweBalances
-100-80-60-40-20
020406080
100
2010 2011 2012 2013 2014 2015 2016 2017 2018 2019
PhilippinesBalances
-100-80-60-40-20
020406080
100
2010 2011 2012 2013 2014 2015 2016 2017 2018 2019
PolandBalances
Economic climate Assessment of economic situation Economic expectations
Emerging market and developing economies