
IFMA Airports Council Conference Presentation
47
Scott Nelles, Director of Sales, [email protected] Onsite Reclamation and Reuse for Utilities: Extending the Lifecycle of our Water Good Afternoon !
Transcript of IFMA Airports Council Conference Presentation

Scott Nelles, Director of Sales, [email protected]
Onsite Reclamation and Reuse for Utilities:
Extending the Lifecycle of our Water
Good Afternoon !

Who We Are…
Helping Clients Utilize Water Resources More Efficiently
Water Management Consultants
• Water Balances & Footprint
• Water Reuse Feasibility
• Risk Management
• Flow Monitoring/Metering
• Water Management Plans
Turn Key Developer
• Technology Integrator
• Planning/Design/Build
• Financing
• Operations

Water: The Lynchpin of Our Way of Life
Solutions for a Diverse Range of End Users

Impactful Solutions Derived from Blackwater Reclamation
Holistic Water Management

Water Related Stresses
Together These Factors Will Completely Change Water Management
Rate Pressure Aging Infrastructure
Scarcity Environmental Constraints

Water Scarcity
Drought Risk Strategies Prevent Downtime and Equipment Failure
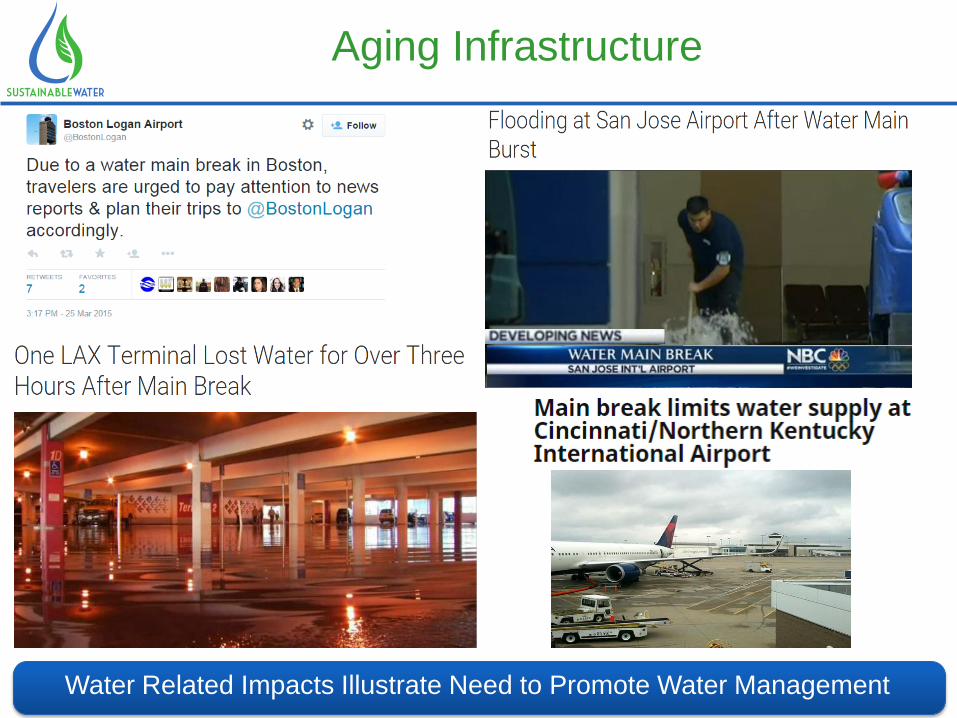
Aging Infrastructure
Water Related Impacts Illustrate Need to Promote Water Management

Environmental Pressure
Rules for Reducing Nutrients and Storm Runoff are Accelerating

Major Metros-Rising Water & Sewer Rates
Water & Sewer Rates Averaging 10% CAGR
CSO Consent
Decrees
WWTP Infrastructure
Maintenance/Repair
$5.52 $5.70 $6.26
$6.99
$7.98
$9.03
$10.21 $10.96
$11.73 $12.40
$0.00
$2.00
$4.00
$6.00
$8.00
$10.00
$12.00
$14.00
Sewer Water combined

Projected Water Spend
Hundreds of Millions of Dollars Demands Executive Attention
$340 M
$475 M
$675 M
$1.17 B
EVAP CREDIT?
$-
$10,000,000
$20,000,000
$30,000,000
$40,000,000
$50,000,000
$60,000,000
$70,000,000Y1 Y2 Y3 Y4 Y5 Y6 Y7 Y8 Y9
Y10
Y11
Y12
Y13
Y14
Y15
Y16
Y17
Y18
Y19
Y20
Y21
Y22
Y23
Y24
Y25
Y26
Y27
Y28
Y29
Y30
CAGR @ 3% CAGR @ 5% CAGR @ 7% CAGR @ 10%
(2014 Volume and Rates)
Annual Water Demand: 454 M gallons
Billed Sewer: 193 M gallons
Water Cost : ~ $4.79 per 1,000 gallons
Sewer Cost : ~ $7.61 per 1,000 gallons
$173 M
$599 M
$344 M
$242 M

A Sustainable Water Cycle…
Decentralized Reclamation and Reuse
~Risk Management ~Cost Savings ~Environmental Responsibility
Before
After

Reduces
freshwater
withdrawal
Zero Discharge: reduced
contribution to CSOs and
wastewater discharge to
environment
Can restore
Rivers / Lakes /
Groundwater
Levels
Net energy reductions
& lower carbon
footprints
Reliable & local
water supply
Lower Life
Cycle Costs
Expands Muni.
Infrastructure Capacity
Enhances recreational
areas
Water Reclamation & Reuse
Multiple Benefits Allow for Cross Facility Collaboration

The Evolution of Water Conservation
The Most Impactful Solution That Does Not Require Behavioral Change
Building-Based
Solutions
Facility-Wide
Solutions
Simple
Solutions
Stickers
Low Flow
Fixtures
Rain Barrels
Stormwater
Reuse
Reclamation
and Reuse
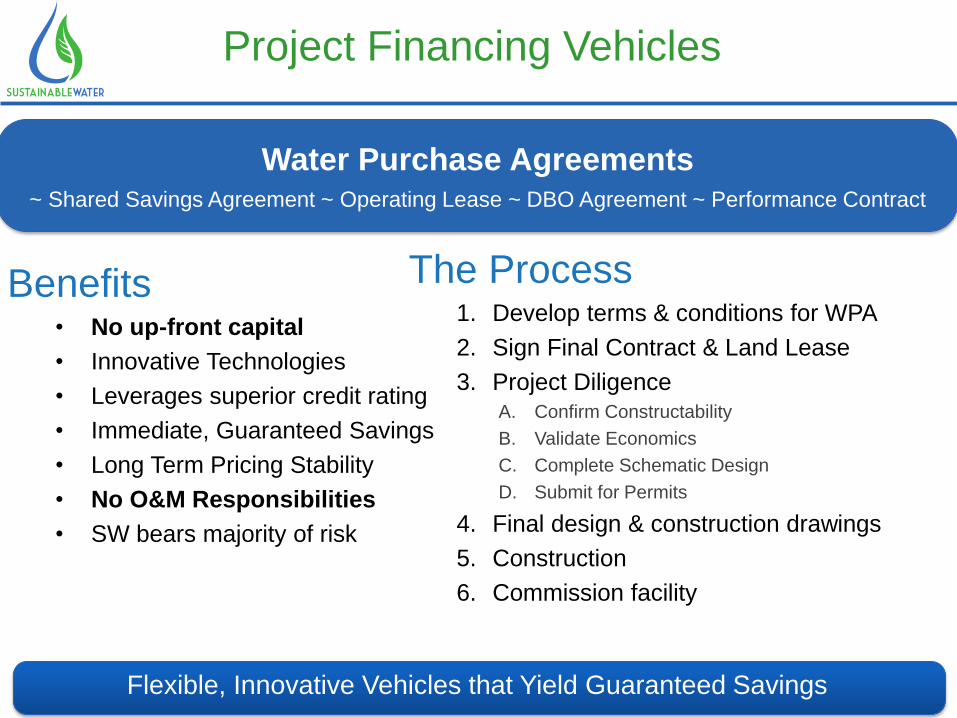
Project Financing Vehicles
Flexible, Innovative Vehicles that Yield Guaranteed Savings
Benefits • No up-front capital
• Innovative Technologies
• Leverages superior credit rating
• Immediate, Guaranteed Savings
• Long Term Pricing Stability
• No O&M Responsibilities
• SW bears majority of risk
The Process 1. Develop terms & conditions for WPA
2. Sign Final Contract & Land Lease
3. Project Diligence A. Confirm Constructability
B. Validate Economics
C. Complete Schematic Design
D. Submit for Permits
4. Final design & construction drawings
5. Construction
6. Commission facility
Water Purchase Agreements
~ Shared Savings Agreement ~ Operating Lease ~ DBO Agreement ~ Performance Contract

• Labor
• Energy
• Permit Fees
• Compliance Testing
• Taxes
• Insurance
• Chemicals
• Discharge Fees
• Maintenance
O & M under WPA
Operations Performed in Accordance to State Standards/Protocols
• Highly Automated Operations
• Remote Monitoring Capabilities
• State Certified Operator On-Site
• Compliance Testing
• Preventative & Predictive Maintenance
• Includes All Operating Expenses

Risk Mitigation
Reliable and Safe Alternatives to Potable Water
Provides Organizations with:
• Redundant Water Supply
– Drought
– Municipal infrastructure failures
• Additional On-Site Storage
• Flexibility & Resilience
• Independence
• Availability in the event of failure
• Minimum recovery time
• Insulation from rising water costs
Drought
Rising Rates
Aging
Infrastructure

Some Independent Power Producers
Currently Using Reclaimed Water
Water Reuse is Prevalent Amongst IPPs
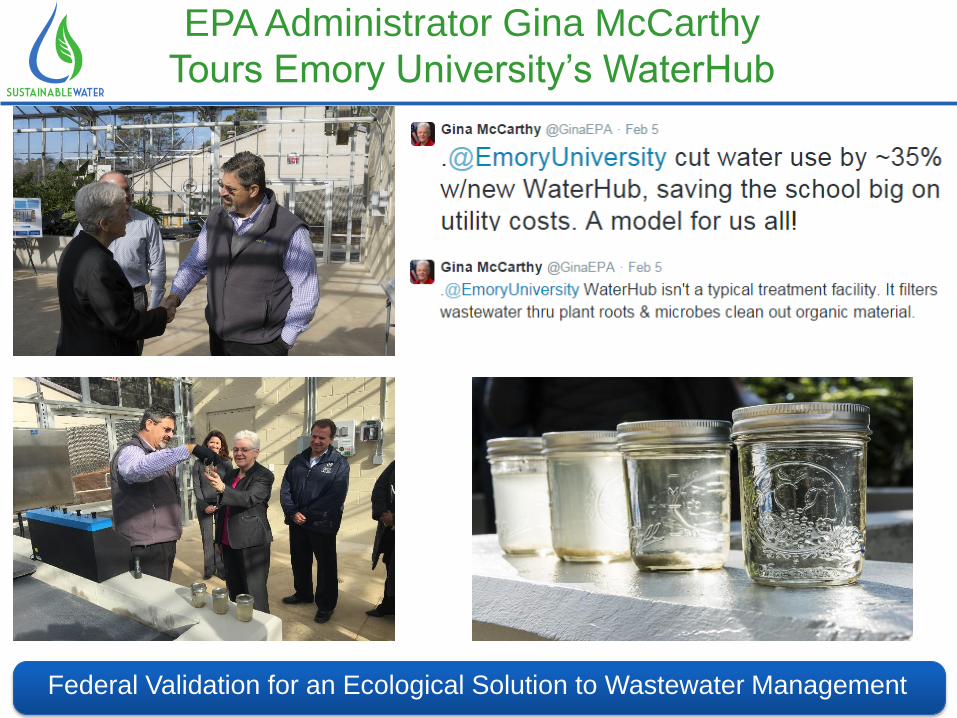
EPA Administrator Gina McCarthy
Tours Emory University’s WaterHub
Federal Validation for an Ecological Solution to Wastewater Management

EPA Administrator Tours WaterHub
“The WaterHub will make it possible for
Emory to save tens of millions of gallons of
potable water every year. That is a real
achievement.” – Gina McCarthy
Federal Validation on Treatment Approach and Financing Model

The WaterHub™ at Emory University

The WaterHub at Emory University
Atlanta, GA
Permitted for Use i~ 50 MGPY NonPotable Demand (NPD)
Permitted for Use in Utility Operations, Irrigation, and Toilet Flushing
105-140M GPY Displaced
35% of Total Campus Demand
90% of Utility Water Demand
3 Chiller Plants/1 Power Plant
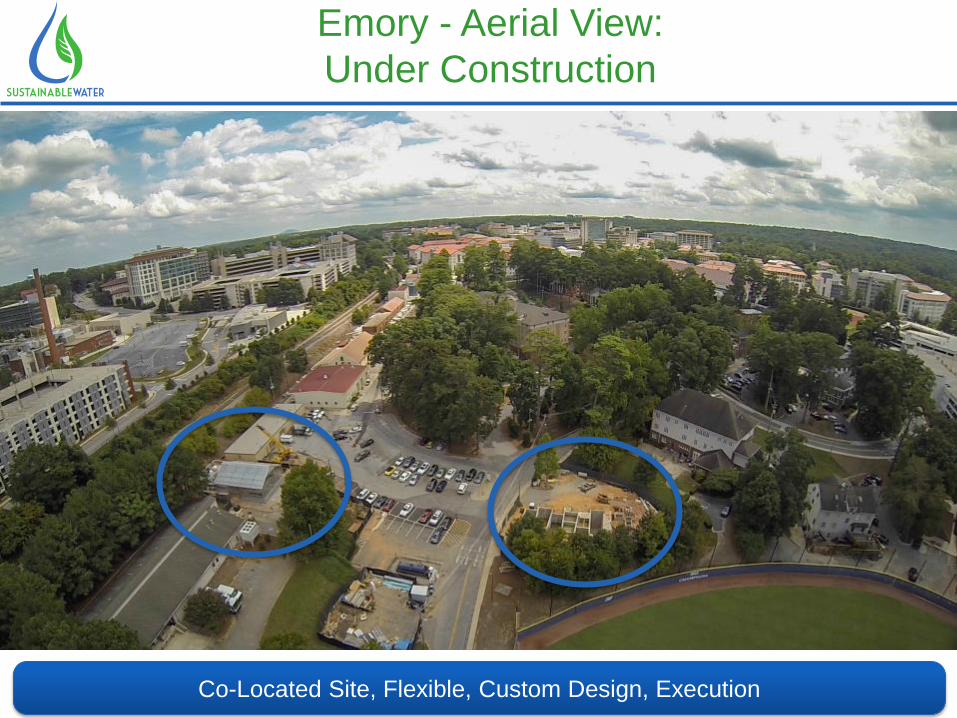
Emory - Aerial View:
Under Construction
Small Physical Footprint, Sited in the Middle of Campus Co-Located Site, Flexible, Custom Design, Execution

Ecological Treatment Design
Integrated into the Built Environment with Small Footprint
- The WaterHub mimics natural methods of
water treatment found in wetlands, tidal
marshes, and rivers
Process Designed to Work with Available Space to Construct Project

Outdoor System (Lower Site)
Convergence of Multiple Ecological Treatment Technologies Convergence of Multiple Ecological Treatment Technologies

GlassHouse (Upper Site)
GlassHouse Footprint Compact and Efficient at 2,200 ft2
Textile Media
Plant Racks
Aeration Bed
Root Zone
MBBR
GlassHouse Footprint Compact and Efficient at 2,100 SF

The WaterHub at Emory
Fully Secured Facility Serves as a Sustainable Beacon
Multi-Functional Facility to Showcase Sustainability Initatives

PR Opportunity to Showcase Aggressive Sustainability Strategies
Sustainability Platform

Feasibility Study Overview
Knowledge and Expertise Drives Project to Effective Implementation
• Equipment inventory
• Program admin.
• WW flow projections
• Economic assessment
• Water balance & use
• Non-potable demand
• Infrastructure review
• Regulatory review
Water Footprint Assessment & Economic Validation
Utility Water Assessment
Site & Infrastructure Assessment
• Water quality needs
• Reclaimed water modeling
• Prelim. siting & design
• Lifecycle Savings

Major Non-Potable Water Users
Identification of Non-potable Demand Requires Collaboration
Chiller Plant
CoGen Dulles
Calpine Plant - NYC
Dallas/Ft. Worth
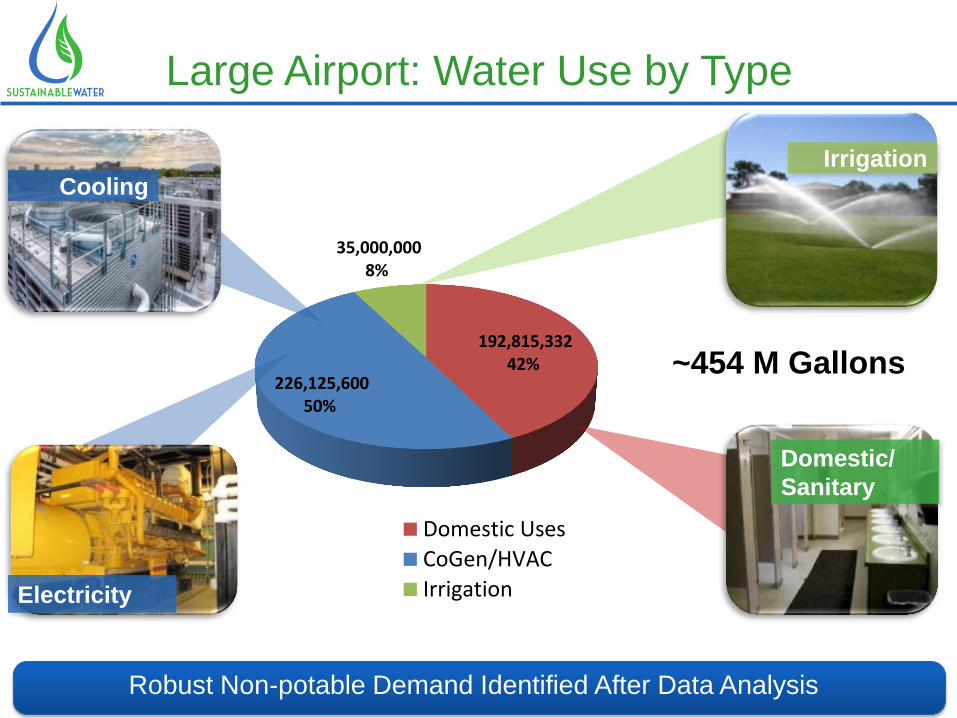
192,815,332 42%
226,125,600 50%
35,000,000 8%
Domestic Uses
CoGen/HVAC
Irrigation
Large Airport: Water Use by Type
Robust Non-potable Demand Identified After Data Analysis
Cooling
Irrigation
~454 M Gallons
Domestic/
Sanitary
Electricity

Utility/Process Water Use by Type at UMD
Further Refinement of Critical Heating and Cooling Demands
66,586,932 , 40%
12,209,750 , 7% 10,453,096 , 6%
46,588,500 , 28%
3,343,312 , 2%
2,814,872 , 2%
6,334,250 , 4%
2,316,143 , 1%
7,552,288 , 5%
5,857,987 , 3%
3,020,915 , 2%
CHP
Scub 2
Scub 3
Scub 4
Scub 5
CSS Scub
Scub MM
SCUB 1 (Estimate)
Oakland Hall (Estimate)
Eppley Rec Center (Estimate)
Prince Frederick (Estimate)
• Monthly Make-up used for 6 SCUB & CHP
• Estimates made for SCUB 1, Oakland,
Eppley, and Prince Frederick

HVAC Demand at UAB
Extensive Utility Demand on Potable Water Resources
-
5,000,000
10,000,000
15,000,000
20,000,000
25,000,000
30,000,000
35,000,000
40,000,000
45,000,000
Gal
lon
s p
er M
on
th
Central Utilities 1 Central Utilities 3 CU 5 (2824490)
CU 5 (0919145) UAB Steam (3021110) UAB Steam (3021120)
607,000 GPD Average
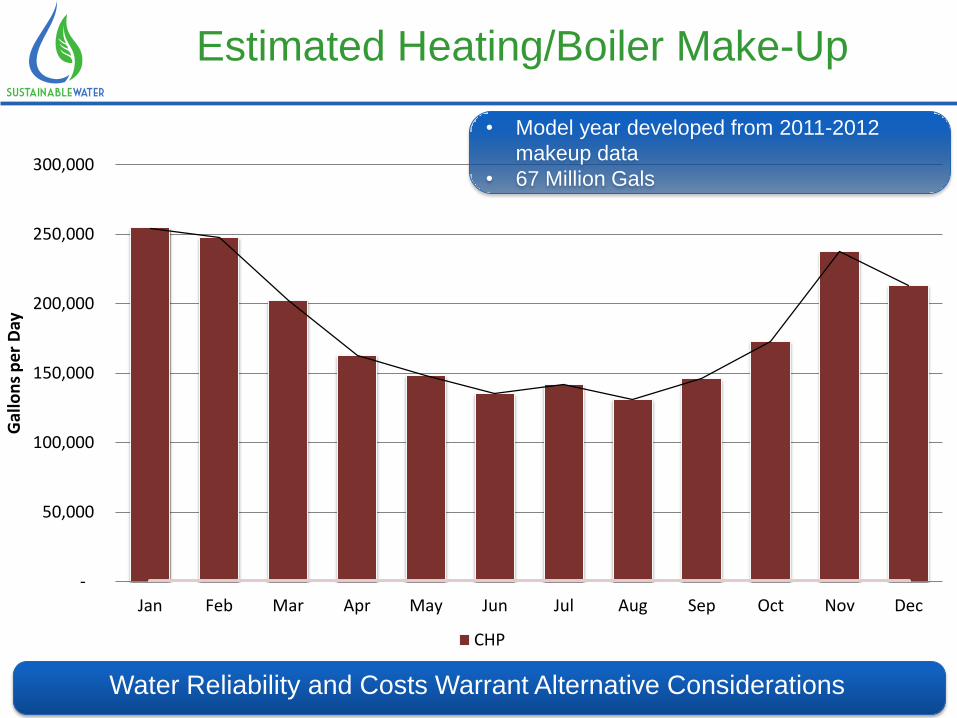
Estimated Heating/Boiler Make-Up
Water Reliability and Costs Warrant Alternative Considerations
-
50,000
100,000
150,000
200,000
250,000
300,000
Jan Feb Mar Apr May Jun Jul Aug Sep Oct Nov Dec
Gal
lon
s p
er
Day
CHP
• Model year developed from 2011-2012
makeup data
• 67 Million Gals

Total HVAC Make-up
Risk Mitigation is Essential to Critical Heating and Cooling Operation
-
100,000
200,000
300,000
400,000
500,000
600,000
700,000
800,000
Jan Feb Mar Apr May Jun Jul Aug Sep Oct Nov Dec
Gal
lon
s p
er
Day
TOTAL COOLING TOTAL HEATING Total HVAC

Existing and Estimated Cooling Make-up
Critical Cooling Dependent Upon Reliable Water Supply
-
100,000
200,000
300,000
400,000
500,000
600,000
Jan Feb Mar Apr May Jun Jul Aug Sep Oct Nov Dec
Gal
lon
s p
er
Day
Scub 2 Scub 3 Scub 4
Scub 5 CSS Scub Scub MM-
SCUB 1 (Estimate) Oakland Hall (Estimate) Eppley Rec Center (Estimate)
Prince Frederick (Estimate) TOTAL COOLING
• 100 Million Gals
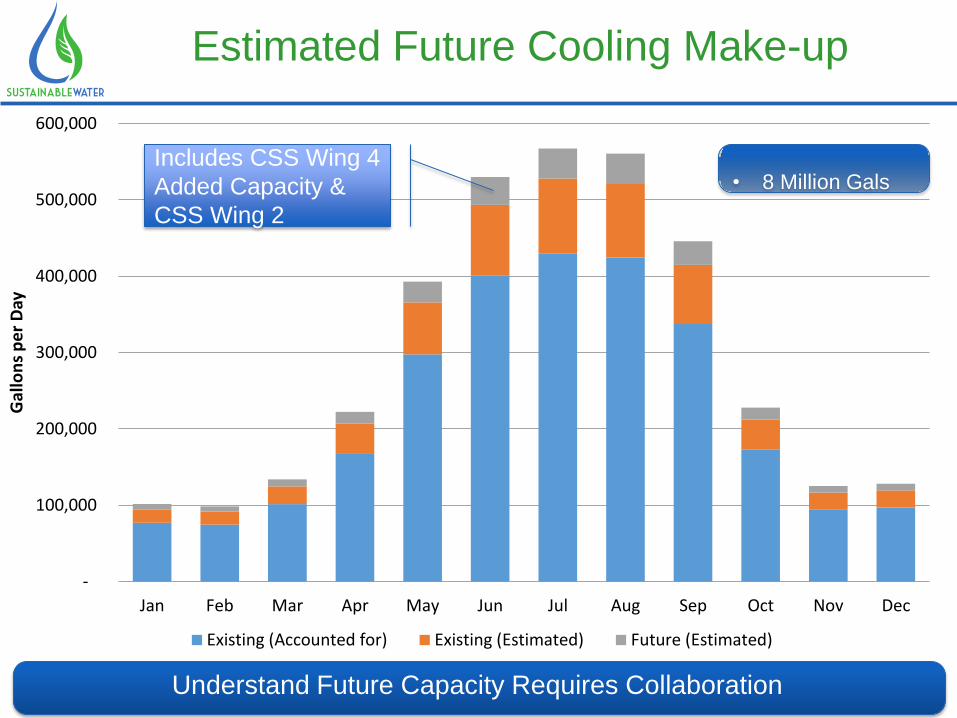
Estimated Future Cooling Make-up
Understand Future Capacity Requires Collaboration
-
100,000
200,000
300,000
400,000
500,000
600,000
Jan Feb Mar Apr May Jun Jul Aug Sep Oct Nov Dec
Gal
lon
s p
er
Day
Existing (Accounted for) Existing (Estimated) Future (Estimated)
Includes CSS Wing 4
Added Capacity &
CSS Wing 2
• 8 Million Gals
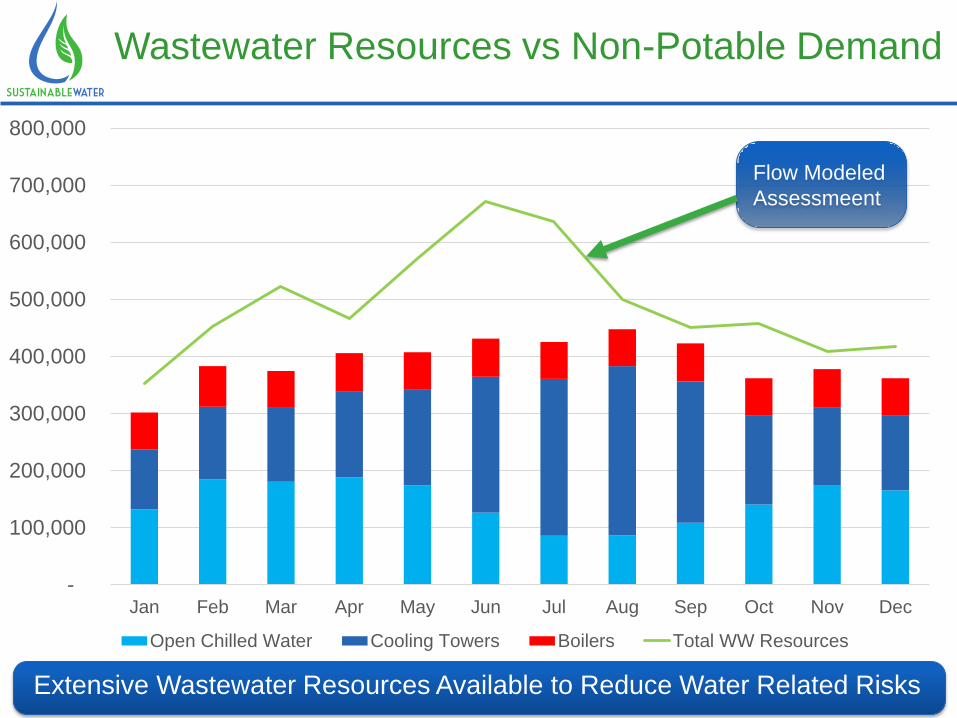
Wastewater Resources vs Non-Potable Demand
Extensive Wastewater Resources Available to Reduce Water Related Risks
-
100,000
200,000
300,000
400,000
500,000
600,000
700,000
800,000
Jan Feb Mar Apr May Jun Jul Aug Sep Oct Nov Dec
Open Chilled Water Cooling Towers Boilers Total WW Resources
Flow Modeled
Assessmeent

Sewer Map 2 Site and Infrastructure Assessment

Geographical Data
Validation of Water Distribution and Availability Confirms Project Viability
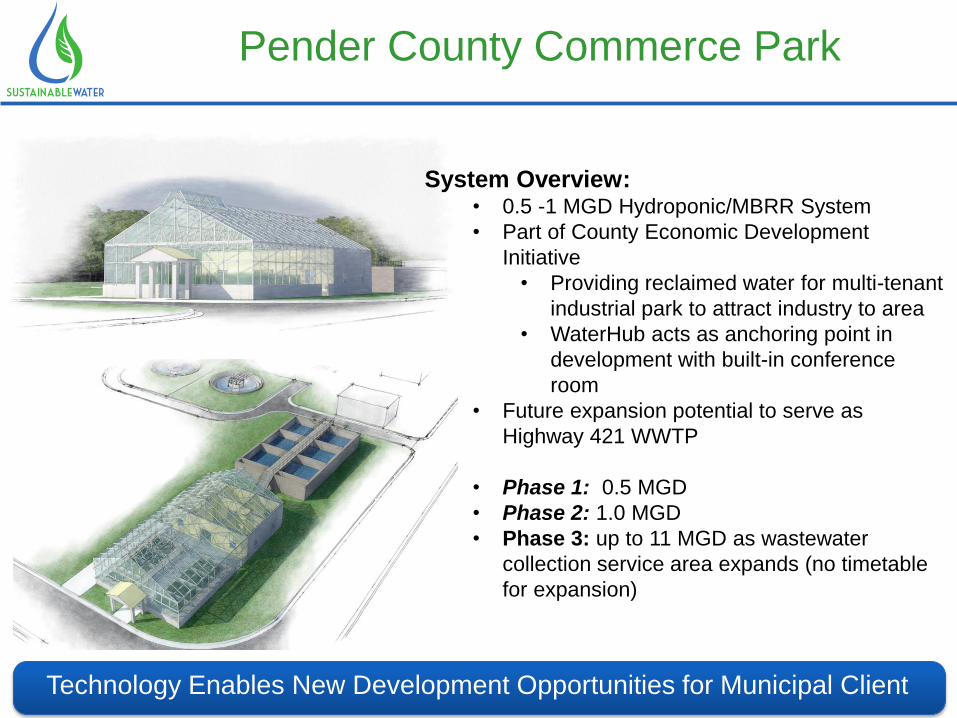
Pender County Commerce Park
Technology Enables New Development Opportunities for Municipal Client
System Overview: • 0.5 -1 MGD Hydroponic/MBRR System
• Part of County Economic Development
Initiative
• Providing reclaimed water for multi-tenant
industrial park to attract industry to area
• WaterHub acts as anchoring point in
development with built-in conference
room
• Future expansion potential to serve as
Highway 421 WWTP
• Phase 1: 0.5 MGD
• Phase 2: 1.0 MGD
• Phase 3: up to 11 MGD as wastewater
collection service area expands (no timetable
for expansion)

WaterHub Concepts
Seamless Integration with Diverse Design Options

Project Execution: Next Steps
Full Project Execution by Experienced Team
Feb June Nov - Dec Mar May Apr Jan Aug - Mar
Preliminary Investigation: • Water Balance • Site Exploration • Lifecycle Savings
Final Permits Obtained
July
Preliminary Feasibility
Internal Review
2015
July – Oct
Contract Execution
Schematic Design / Project Diligence
Final Schematic
Design WW Flow & Quality Study • Corp. Process
• QA Review
Commissioning
2016
Permitting / Construction

Nature’s Idea. Our Science.
Scott Nelles| Office: (804) 965-5590 | Mobile:
(336) 587-9000
QUESTIONS?
EXTENDING THE LIFECYCLE OF WATER.

Ecological Water Treatment Technologies
Innovative Technology Increases Biodiversity & Reduces Energy Requirements
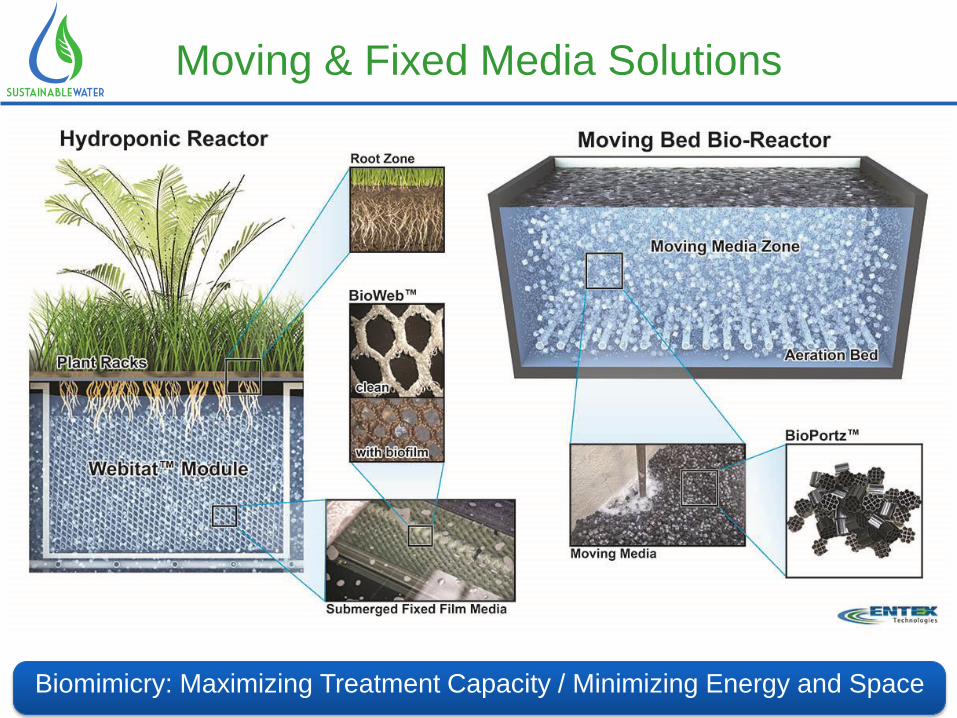
Moving & Fixed Media Solutions
Biomimicry: Maximizing Treatment Capacity / Minimizing Energy and Space

WaterHub in GlassHouse- Hydroponics
GlassHouse Footprint Compact and Efficient
Plant Racks
Aeration Bed
Root Zone Textile Media
MBBR
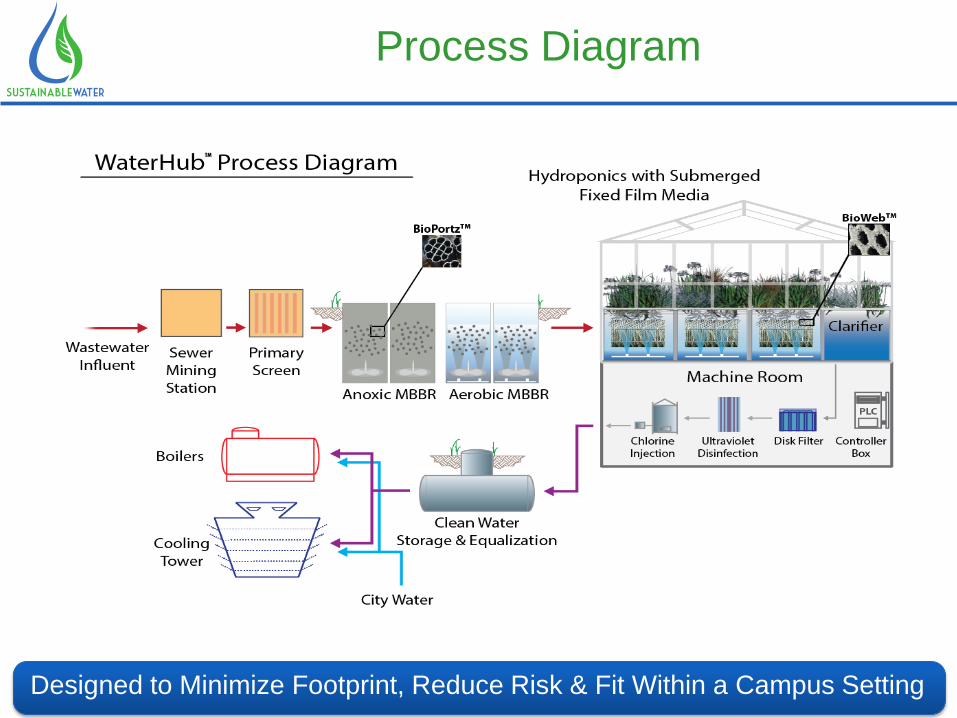
Process Diagram
Designed to Minimize Footprint, Reduce Risk & Fit Within a Campus Setting