If women hold up the sky, how much of the world's food do ... · If women hold up half the sky, how...
31
If women hold up half the sky, how much of the world’s food do they produce? Cheryl Doss ESA Working Paper No. 11-04 March 2011 Agricultural Development Economics Division The Food and Agriculture Organization of the United Nations www.fao.org/economic/esa
Transcript of If women hold up the sky, how much of the world's food do ... · If women hold up half the sky, how...

If women hold up half the sky, how much of the world’s food do they produce? Cheryl Doss
ESA Working Paper No. 11-04
March 2011
Agricultural Development Economics Division
The Food and Agriculture Organization of the United Nations
www.fao.org/economic/esa
1
If women hold up half the sky, how much of the world’s food do they produce?1
November 2010
Cheryl Doss
Yale University
Abstract: This paper explores, conceptually and empirically, the question of how much food is produced by women. Data for labour inputs and agricultural output are used to assess women’s contribution to food and agricultural production. The study also assesses gender differences in productivity. The paper finds that a precise measure of women’s contribution to food production is impossible to establish. In general women do not produce food separately from men and it is impossible to disaggregate men and women’s contributions either in terms of labor supplied or in terms of output produced. Ultimately the precise contribution women make to food production is irrelevant. It is enough to recognize that women are important to agriculture and agriculture is important to women. There is evidence that shows that women farm as productively as men do, when they have access to the same resources. But they often do not have access to the improved technologies, credit, land and other resources. Additional data is needed to understand better women’s roles and constraints in agriculture so as to appropriately design interventions that target women. Key words: Women, gender, labor, food production, agriculture, productivity, data, time use. JEL: Q10, J16, J21, J22, J24,
Acknowledgement: I benefited from the excellent research assistance provided by Sinead Hunt, Ben Meyer, Stefano Gerosa, and Gina Alvarado. In addition, this paper was strengthened by comments from Doug Gollin and participants at the SOFA writers’ workshop, Sept. 2009, Rome. Any errors are the responsibility of the author. ESA Working Papers represent work in progress and are circulated for discussion and comment. Views and opinions expressed here are those of the authors, and do not represent official positions of the Food and Agriculture Organization of the United Nations (FAO). The designations employed and the presentation of material in this information product do not imply the expression of any opinion whatsoever on the part of FAO concerning the legal status of any country, territory, city or area or of its authorities, or concerning the delimitation of its frontiers or boundaries.
1 The research presented in this background paper to The State of Food and Agriculture 2010-2011, “Women in agriculture: closing the gender gap in development” was funded by FAO. The report is to be released on March 7 2011 and will be available at http://www.fao.org/publications/sofa/en/.

2
3
INTRODUCTION
“Women produce between 60 and 80 percent of the food in most developing countries
and are responsible for half of the world's food production.”(FAO, 1997)
This statement is widely quoted and used – in varying phrasings and rephrasings – as
justification for focusing attention on women farmers throughout the world. Referring to the
same FAO document cited above, a similar claim is that “Rural women produce half of the
world’s food and, in developing countries, between 60 percent and 80 percent of food crops
(Mehra and Rojas, 2008).” It has also been adapted to claim, “Women produce more than half of
the locally-grown food in developing countries and as much as 80 per cent in Africa (Momsen,
1991, p. 2).” Possibly the earliest related claim was published in 1972, “Few persons would
argue against the estimate that women are responsible for 60-80% of the agricultural labour
supplied on the continent of Africa…(UNECA, 1972)” And a recent newspaper column claims,
“In reality, half of the world's food and, in developing countries, between 60 and 80 percent of
food crops, grow from seeds that are planted by a woman's hand (Gupta, 2009).”
While all of these claims represent a powerful truth –women are important food producers – the
empirical content behind them is less clear.2 Instead, they should probably be viewed as a
metaphor, much like the claim Women hold up half the sky.” In addition, each of these claims
about women’s contribution to food production makes a very different empirical claim. Food
production would certainly include both crop and animal products and could include processing
and preparation. The claim about women producing locally grown food suggests that in
developing countries women are the primary producers of food that is grown and consumed
locally.3
2 The one reference that indicates that these numbers are not accurate is Jackson (2005), who says, “It is interesting that this statement is so enduring, so effective—and so wrong…”
The 1972 claim simply refers to women’s labor inputs in agriculture (presumably
measured by the number of workers or the number of hours worked), and doesn’t address the
amount of output that they produce. The metaphor of seeds planted by a woman’s hand is also a
3 It is not clear what it would mean for food not to be locally grown. Usually the context implies that it is consumed near where it is produced.

4
powerful one, but it leaves out most of the additional steps of food production, such as weeding
and harvesting.
In this paper, I explore various sources of data that can tell us something about the “stylized fact”
that women produce 60-80% of the food in developing countries. One central argument of the
paper is that a claim of this kind does not have any literal meaning, and it does not lend itself to
direct empirical tests. Women do not in general produce food separately from men. Quantifying
the share of food produced by women involves making many arbitrary assumptions about gender
roles in the production process. Since most food is produced with labor contributions of both
men and women, to assign the output separately to men and women would be very complex. To
take a stylized example, if men provided the labor to clear the field, women planted and weeded
the crops, and both men and women were involved in harvesting, how would we determine how
much of the output was produced by women?
Empirically, this becomes even more of a challenge. Even if the concept were clearly defined,
there are not adequate global data to measure the share of food produced by women. Considering
only the labor contributions of men and women in crop production – and setting aside gendered
patterns of land ownership and control over other resources – we would need very detailed
agricultural production data that included labor inputs for different tasks for men and women and
agricultural outputs across a wide range of production systems. If we were interested in the
contributions to the final food products that people eat, rather than the crops that are harvested,
we would need data on the labor inputs in food processing and preparation. As more of this
moves out of the home into the commercial sector, we would have to estimate production
functions that included sex and task disaggregated data in the commercial food processing and
production sectors. The level of detail needed for this type of analysis is far beyond what is
currently available. And we would still have to match the labor inputs to outputs. This would be
a formidable task and one that would not necessarily help to illuminate important policy
questions.
In spite of these difficulties, there is a range of data available on labor inputs and on agricultural
output that can help to shed light on women’s contributions to food and agricultural production.
5
In this paper, three different bodies of empirical literature and data are used to explore this
contribution. First, the paper analyzes the labor inputs to agricultural production, using both
employment data and time use data. Second, using four nationally representative household
survey data sets, it examines several different ways to assign agricultural output by gender,
including the gender of the household head, the owner of the land and the decision-maker or
farm manager. Third, national level agricultural productivity data across time and countries is
used to estimate women’s labor productivity relative to that of men at the macro level. These
macro-level estimates are then compared to micro-level evidence on men’s and women’s
agricultural productivity. Thus, unlike the claim that “women hold up half the sky,” there is
considerable information on women’s contributions to food production.
Because of the available data, a variety of different measures of both inputs and outputs are used
in this paper. Each of the measures has its own limitations and strengths. Outputs include both
crop production and agricultural production. Crop production excludes animal products – notably
milk, eggs, and meat. Agricultural production includes not only food production, both crop and
livestock, but also the production of goods such as fiber and flowers. Thus, neither one is a
specific measure of food.
None of the analyses presented here differentiates between subsistence production and
commercial or export production. Food is produced in all of these sectors. Many types of food
are produced by smallholder farmers both for home subsistence consumption and for sale in the
market. Many of the discussions about the importance of women’s role in food production in
developing countries stress women’s important role in growing, processing, and preparing the
food to feed their families. This is typically portrayed as different – and perhaps more important
– than the work that women provide in the commercial and export sectors.
Another measurement issue faced in this paper concerns the use of the aggregate term “food”.
There are, of course, many types of food, including (literally) apples and oranges. The approach
that is used here for aggregation is the standard one of adding the monetary value of each type of
food. That lets us come up with a consistent aggregate, but implicitly it assigns high weights to
the more expensive items. Other methods of aggregating across different food categories might
6
result in very different totals. For example, if we aggregated by the caloric value, then starchy
high-calorie staple crops would have a higher value than crops such as coffee which have a
higher monetary value. To the extent that women tend to be more heavily involved in the
production of staple crops, comparing the caloric value of the food produced by men and women
might indicate a significantly higher share being produced by women. This aggregation becomes
more of a challenge if we are considering food on the table, rather than simply agricultural
products. Much of the work of processing and preparing food for the table is done outside of the
market sector, and thus more difficult to value consistently in monetary terms.
MEN’S AND WOMEN’S LABOR INPUTS TO AGRICULTURAL PRODUCTION
Food production requires a number of different factors of production, including labor, land, and
capital, as well as inputs and intermediate goods such as animal and mechanical power, seeds,
fertilizer and water. The claim about women’s contributions to food production is often made in
a context in which it appears to be referring simply to labor inputs and comparing men’s and
women’s labor inputs, rather than considering a more complete range of inputs. In this section, I
examine the labor inputs of men and women in agricultural production.
The most comprehensive data available are the FAO data on the economically active population
in agriculture. In this measure, an individual is reported as being in the agricultural labor force if
he or she reports that agriculture is his or her main economic activity. Sex-disaggregated data are
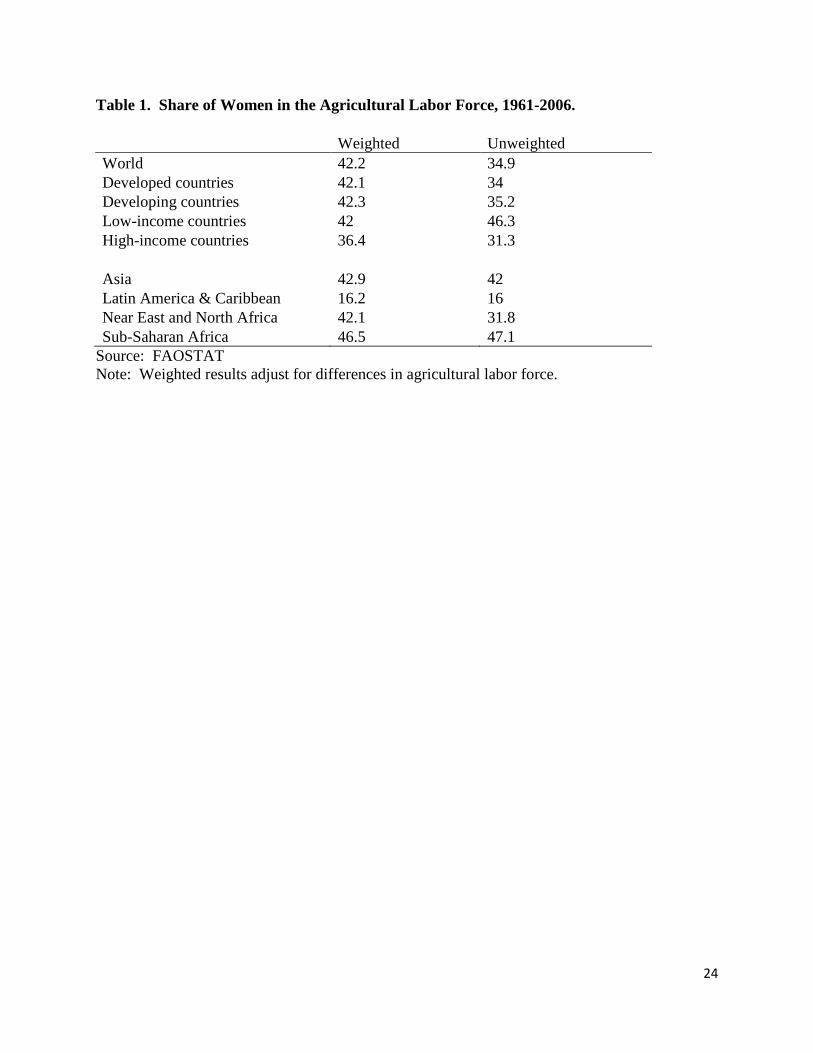
available for most countries. Table 1 presents these data for 235 countries for the period 1961 to
2006. The unweighted averages simply use each country and time period as an observation. They
can be weighted by the size of the agricultural labor force.
Using these measures, the proportion of the agricultural labor force that is female is less than
50% for the world as a whole and for all the usual country groups. Overall, using the weighted
measure, women are only 42.2% of the agricultural labor force. Even for sub-Saharan Africa,
which is the region where women are typically most involved in agricultural production, these
7
measures suggest that women make up fewer than half of the number of people who are reported
as economically active in agriculture.
Many researchers have questioned the gender patterns that emerge from this data. In particular,
the reported 16% share for women in Latin America is strikingly low. Deere (2005) identifies a
number of potential sources of under enumeration of women in agriculture. In particular, she
notes that rural women in Latin America are likely to reply that “their home” is their primary
responsibility, even if they are heavily engaged in agriculture. Other difficulties arise because the
censuses tend to emphasize income generating activities, underestimating subsistence
production; and because agricultural production is often defined as field work, so that activities
such as rearing small livestock, kitchen gardening, and post-harvest processing are undercounted.
While Deere focuses on critiquing the numbers for Latin America, similar criticisms are relevant
for other regions. Using household survey data collected by the Comisión Económica para
América Latina y el Caribe (CEPAL), Deere (2005, p. 21) re-calculates the female fraction of the
population occupied in agriculture in 1999 for eleven Latin American and Caribbean countries.
She finds percentages ranging from 3.7% in Panama to 44.7% in Brazil. Overall 26.2% of those
reporting themselves as occupied in agriculture are women.4
While this is substantially more
than the 16% in the FAO data, the numbers still fall far short of the 60-80 % benchmark.
Using the FAO data, only six countries report that 60% or more of the agricultural workforce is
women.5
Somewhat surprisingly, these are not African countries in which women work on
smallholder farms, but instead they are primarily Middle Eastern countries where women work
as wage laborers in agriculture.
Thus, although these data are problematic and probably substantially underestimate women’s
role in agriculture, they do not support the idea that women produce most of the world’s food.
Evidence from Time Use Studies
4 Katz (2003) has similar estimates. 5 These include Congo, Jordan, Libya, Palestinian Territory, Portugal and Turkey.
8
One shortcoming of data on women’s share of the agricultural labor force is that these data do
not account for differences in hours worked. If men who are identified as part of the
“economically active population in agriculture” provide fewer hours of agricultural labor than
women in the same sector, we could underestimate the importance of women. For example,
some literature suggests that men in Africa work fewer hours than women, across all
activities.(Blackden and Wodon, 2006).
To address this possibility, we can look at detailed time use studies that document the time that
men and women spend in agriculture and in other activities. The detailed time use studies,
especially those that include activities for more than one agricultural season, are usually for very
small samples. Many studies are now quite old. While some nationally representative time-use
studies have been recently collected, the reports do not provide summaries for time spent in
agricultural activities.6
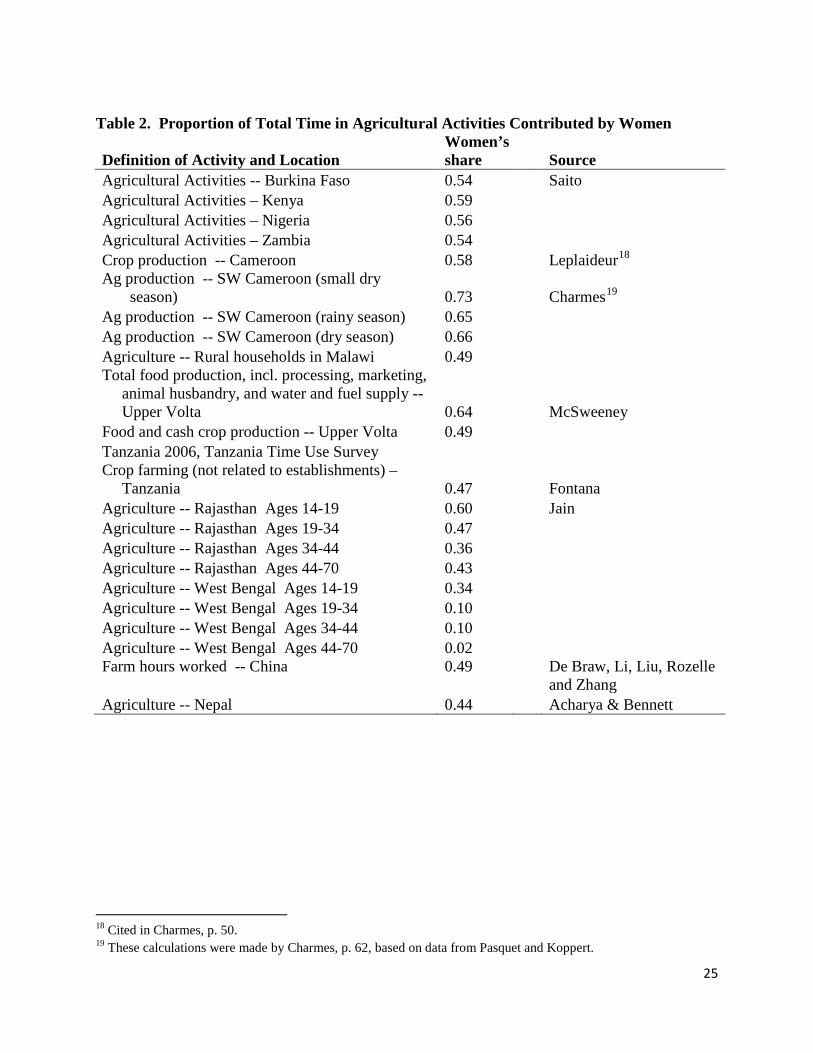
Table 2 summarizes a number of time use studies for which it is possible to calculate the share of
total time spent in agricultural activities that is provided by women. Some of the reported
numbers are just for crop production, while others include animal agriculture. These studies all
support the claim that women are heavily involved in agricultural production, with the exception
of the study of West Bengal. In some regions within Africa, women do contribute over 60% of
the total time spent in agricultural activities. Yet there is wide variation across sites and across
seasons within sites. And overall, there is no support for the 60-80% figure at a global scale.
Only a few of the studies report the time spent in other food production activities, such as food
processing and preparation (See Table 3). Time spent cooking and cleaning is often reported as a
single entry, so we cannot separate out the portion that is allocated to food preparation. In one
study, fuel and water collection are treated as food preparation activities, but cooking is not
included. In others, cooking is combined with other household chores, such as cleaning, so we
cannot separate out the time spent in food preparation. Nevertheless, the limited evidence
6 For example, a discussion of these studies in Africa by Charmes (2006) provides an analysis of the non-market time spent in agricultural activities, but does not include the measure of agricultural activities in the market sector.
9
suggests that women are the ones who overwhelmingly provide the greatest proportion of time to
food processing and preparation.
The time use studies are able to give us a sense of how men and women allocate their time across
various activities. They are not able to tell us anything about the productivity of that labor, nor
do these data provide a means to map the labor inputs into specific outputs. In other words, we
are still faced with the question of whether women providing 54% of the total household hours
devoted to agriculture can be interpreted to mean that they have produced 54% of the agricultural
output. An additional concern with the time use studies is that they are not necessarily drawn
from representative samples, so that it is difficult to make meaningful inference to national or
international populations. Finally, many of the studies are quite old and the employment patterns
in rural areas are changing. They probably still reflect women’s time allocation in the subsistence
farming sector, but may be less reflective of areas where commercialization is occurring.
To summarize however, the time use studies do suggest (but do not actually demonstrate in any
statistical sense) that if “food production” includes food processing and preparation, then women
probably provide 60-80% of the total labor used in bringing food to the table in developing
countries. But if “food production” refers instead to the cultivation and harvest of food crops, or
to the labor used in producing unprocessed agricultural outputs, women probably do not account
for the majority of hours worked.
The time use studies also leave unanswered the question of whether men’s and women’s labor is
complementary. Are both required for agricultural production? Or are they entirely substitutable?
Social norms, customs, and technologies all impact the extent to which they are complements or
substitutes. These differ across and within countries, and these social relationships are not fixed
over time.
One final approach to examining women’s labor contributions would be to look at the share of
agricultural wages that women receive. If men and women were each paid the marginal value of
their labor, then the wages would represent their contributions to agricultural output.
Unfortunately, this approach would have two problems. First, it would only count agricultural
10
labor in the wage sector, ignoring the unpaid family labor that characterizes much of the
agricultural sector worldwide. Second, it would require the assumption that men and women are
actually paid their marginal value and that labor markets are competitive. Particularly based on
evidence coming out of Latin America,7
MEASURING MEN AND WOMEN’S AGRICULTURAL OUTPUT
it is clear that the agricultural labor markets are
segmented, with women concentrated in jobs that are low paid and seasonal. Similar wage
differentials are found in India (Ganguly, 2003; Jose, 1988). There are sufficient claims of
gender discrimination in agricultural labor markets to indicate that this would significantly
undercount women’s contributions.
If we focus our attention on agricultural output instead of labor inputs, we might try to quantify
how much output is produced by men and how much by women. This is complicated, however:
as noted above, in many agricultural households, both men and women are involved in crop
production, so it is a challenge to determine which individuals are producing it. To compare
outputs across men and women, we need a way to assign agricultural outputs by gender. In order
to examine this question, household survey data is used from four countries: China, Bosnia-
Herzogovenia, Ghana and Nicaragua. These countries were chosen because available household
survey data allow for analysis using multiple measures of assigning output to men and women.
There are relatively few nationally-representative household surveys that meet this criterion.
For China, the data come from the China National Rural Survey – a nearly nationally
representative sample of 60 villages in six provinces of rural China surveyed during November
and December 2000. The numbers presented here are based on the definitions and estimations
presented in De Brauw et al., (2008).
The Bosnia-Hergovenia data come from the Living Standards Measurement Survey (LSMS)
conducted in 2001. The value of the crops (including vineyards and orchards, but not pastures) is
based on the amount harvested during the 2000-01 season.
7 See Deere (2005) and Lastarria-Cornheil (2009) for reviews of this literature and Jarvis and Vera-Toscan (2004) for an econometric analysis of agricultural wages in Chile for men and women.
11
Similarly, the Ghana Living Standards Survey (1998-99) was used to calculate the value of crops
produced on land farmed by the household and to calculate the value of crops grown on land
held by different individuals. Finally, the Nicaragua data come from the MECOVI survey, a
nationally representative survey conducted in 2001 (Gobierno de Nicaragua, 2001) The value of
the crops produced includes that produced on the agricultural production unit (UPA) and on the
patio or backyard garden.
None of these surveys provides an adequate means to calculate the value of food processing and
preparation. While they do include measures of food processing and preparation for items
produced for sale; they do not include a value of that produced for home consumption. As a
result, the discussion that follows focuses on the value of crop output.8
As a lower bound on women’s production, the output could be assigned to women if the crop
was produced in a household headed by a woman. While women frequently live in male-headed
households, the definition of a female-headed household usually precludes the possibility than
men are members of the household. While these female heads may use some male labor on their
farms, either from a male relative or through hired labor, it would be reasonable to treat this as
output produced by women.
Table 4 shows the share of the value of crops produced by female headed households in these
four countries. The proportion of households that are reported as female headed vary from 3.1%
in China to 38% in Nicaragua. Yet, in each country, the value of crops produced by female-
headed households is less than would be expected if male and female headed households
produced the same amount of crops. This is, at least in part, because female headed households
are typically smaller (in numbers of people) and have less access to resources (including land
and labour) than male headed households.
This measure ignores the food produced by women living in male-headed households, but given
that female-headed households produce proportionately low amounts of crop output, these
8 Livestock products are also not included in this section of the analysis.
12
numbers cast some doubt on the stylized fact that women produce 60-80% of agricultural output.
Even in the country with the highest level of female-headed households, Nicaragua, to reach the
60% threshold, women would have to produce 57% of the food in male-headed households.
While this is not outside the realm of possibility, it would be a surprisingly high number.
Another way to assign output to men and women is to allocate it to the owner of the plot of land.
In Bosnia-Herzogovenia, 16% of plots were reported as owned by women. Of the total value of
crops produced, 16% were grown on plots owned by women.
A final approach is to look at the person who is the manager, decision-maker or person
responsible for the agricultural production in a household or on a particular plot.
For Ghana, we have data on the person reported as the holder of each plot and what is grown. In
16% of male headed households and 56% of female headed households, at least one plot of land
is held by a woman. Of the total value of crops produced, 15 % is grown on plots that are held by
women.9
In Nicaragua, we can look at several different measures. For each agricultural production unit,
we have data on which household member is the primary decision-maker and for each patio, we
have data on the person responsible for this production. For each household, there may be more
than one agricultural production unit, each with a different decision-maker. Assigning the
production to the individual who is the decision-maker for the agricultural production unit or the
person responsible for patio production, 17.6% of the total value of crops are produced by
women.
For China, two measures of female management of farms are used, based on definitions from de
Brauw, Liu, Rozelle and Zhang (2008). The first considers women as the managers of the farm
based on the employment history of the husband and wife. Using this definition, 16% of the plots
9 While the data is also available on land owned by men and women, it isn’t possible to sort out which outputs are produced on land that is owned by an individual, separate from that simply held by them.
13
were managed by women, and 13% of the crop revenues were produced on the plots managed by
women.
In addition, de Brauw, Liu, Rozelle and Zhang (2008) create a measure of women’s management
based on the number of hours that women put in to farm labor compared with their husbands.
The farm is considered to be managed by the woman if farm work is her primary occupation and
if the man had primary work off the farm or worked on the farm only during the harvest season.
In this case, women manage 9% of the plots, and generate 8% of the revenue.
All of these measures considerably underestimate women’s contributions to agricultural output,
because they do not include the labor of women working in male-headed households, on male-
owned land or on male-managed farms. While they should not be used to suggest that women do
not contribute substantially to food production, they also do not provide empirical evidence that
women are the primary food producers.
A final way to allocate output by gender would be if we could assume that specific crops were
grown by women and others were grown by men. Then we could aggregate the value of
women’s crops and men’s crops to see the share grown by women. Researchers have
occasionally used this approach, especially in West Africa, where there are patterns of cropping
by gender.10
WOMEN’S LABOR PRODUCTIVITY
Yet, a careful analysis of agriculture in Ghana finds while there are gendered
patterns of cropping, the distinctions between men’s and women’s crops do not hold up well
enough to use them to make inferences about men’s and women’s incomes (Doss, 2002). In
addition, we know that gendered patterns of cropping may change over time as crops move from
subsistence foods to commercial foods or vice versa.
The preceding approaches to calculating women’s contributions to agricultural production do not
speak of the labor productivity of women. Ideally, we would like to assess labor productivity in
10 For example, Hoddinott and Haddad (1995) and Duflo and Udry (2001) use gender patterns of cropping in Côte d’Ivoire to separate men’s and women’s incomes.
14
some way other than simply counting hours of work. As noted above, wages in agriculture may
be a poor measure of relative productivity, because labor markets may not accurately value
women’s productivity and because some (perhaps most) of women’s labor inputs in food
production takes the form of non-market activities. Even if women are less than half of the
agricultural labor force (measured as the proportion of the economically active people who
report their primary activity as agriculture) or if women do not provide the majority of total
hours worked in agricultural production, it may be that their contributions are particularly
critical.
One approach that might help to assess the value of women’s time would be to estimate
agricultural production functions at the farm level, using micro data and treating women’s time
as a separate input from men’s time. However, neither time use studies nor household survey
data typically provide sufficient information to make these estimates on a systematic basis across
countries.
Macro Evidence
One approach would be to use cross-country panel data to estimate agricultural production
functions that include a measure of women’s share of labor in agriculture. The coefficient on this
variable could then be used to calculate a measure of women’s effective share of agricultural
labor. Thus, if men’s labor and women’s labor had different impacts on agricultural output, we
could capture this.
This section uses national-level measures of agricultural productivity and women’s share of labor
in agriculture to measure the productivity impacts of women in agriculture. This work follows in
the footsteps of numerous previous studies that use cross-country regressions to estimate
aggregate production functions for the agricultural sector. Almost without exception, these
papers are subject to the criticism that they suffer from endogeneity and simultaneity biases.
Unfortunately, there are not alternative identification strategies that avoid this criticism, and
15
instrumental variables techniques are not useful because it is difficult to find plausible
instruments to use to in these estimations.11
The basic structure of the econometric specification used in most of the literature on cross-
country agricultural productivity differences12
itit
P
jijtjitit LRXAY lnlnlnlnln
1βφα +++= ∑
=
is given by a Cobb-Douglas production function
in log terms:
where Yit is agricultural output, Xijt are a set of inputs (livestock, tractors, fertilizer), Rit is land
and Lit is labor; i indexes countries and t indexes over time. Dividing through by labor, we
obtain:
it
itP
j it
ijtjit
it
it
LR
LX
ALY
lnlnlnln1
φα ++= ∑=
For this exercise, we are interested in the potential impact of women’s share of labor on
agricultural productivity. We might expect that reported women’s agricultural labor has a
different impact on agricultural output than men’s labor. Thus, we treat women’s share of labor
as an externality in the model. This formulation allows us to empirically test this across time and
country.13
We can estimate a model of the form:
itFitit
P
jijtjitit SrxAy εγφα ++++= ∑
=
lnlnlnlnln1
Where SFit is the share of women in the agricultural labor force (female economically active
population in agriculture divided by the total economically active population in agriculture.)
11 The econometric estimations all were done both with and without a measure of GNP per/capita. This is occasionally used as a measure of labor quality, but is certainly simultaneously determined with agricultural output per worker in the agricultural labor force. While lagged GNP could be included, the levels are still highly correlated with agricultural output per worker. The coefficients on women’s share of labor were robust to the inclusion or exclusion of this variable. 12 For example, see Craig, Pardey and Roseboom (1997), Wiebe et al., (2000), Vollrath (2007). 13 This specification assumes constant returns to scale in the production technology.
16
The output measure is the value of net agricultural production in dollars divided by total
economically active population in agriculture. While we are primarily interested in the
coefficient on women’s share of the agricultural labor force, we need to control for a variety of
other factors that impact agricultural productivity. Land is measured as the total agricultural area
in hectares. Fertilizer is measured in metric tons. We include a measure of the total number of
agricultural tractors in use. Livestock is the total number of livestock, (aggregated with weights
used in Hayami and Ruttan (1985)). In addition, to take land quality into consideration, we use
the total area equipped for irrigation divided by the total agricultural area, and the total arable
land divided by the total agricultural area. Each estimation also includes both indicators for the
year, to control for time trends, and for the country to control for country fixed effects.14
The
observations are unweighted, each country and year is a single observation in the estimation.
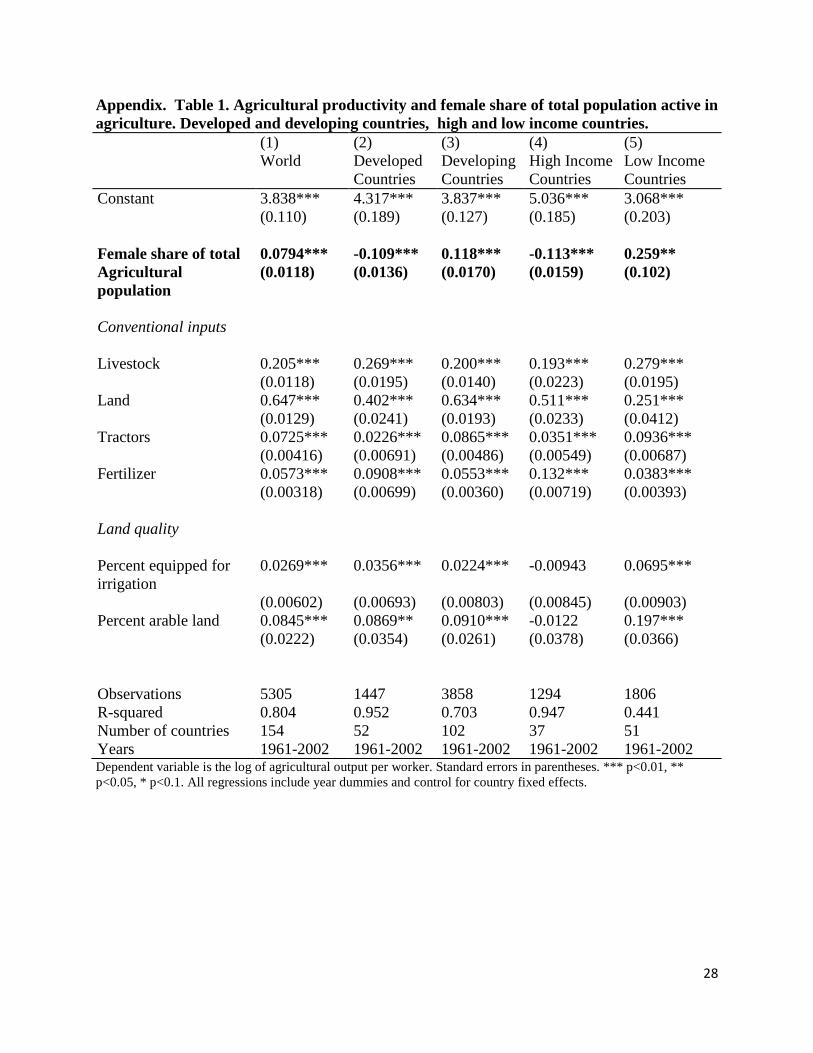
Data from 154 countries for each year from 1961-2002 results in 5305 observations.
The full results are presented in Appendix Tables 1 and 2. The coefficients on share of female
labor are in Table 5. For the world as a whole, over the period 1961-2002, there is a positive
coefficient of .08 on the proportion of women in the agricultural labor force. This suggests that,
at the margin, the average productivity of a woman reported as being in the agricultural labor
force is 1.08 that of men. If we calculate this across all time periods and countries, women’s
labor contributes 37.7-45.6 percent of the labor share of agricultural output, depending on
whether we use unweighted or weighted averages.
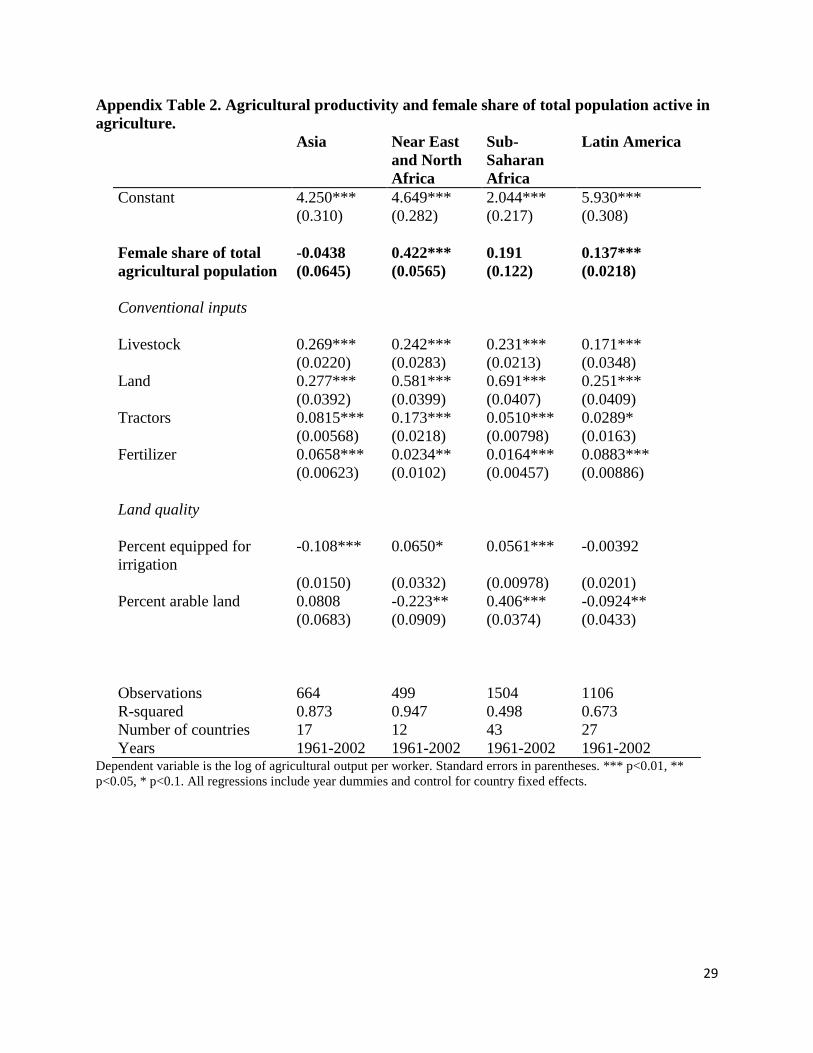
The estimated coefficients are also calculated by region of the world. The coefficient for Latin
America is quite high, .42, which corresponds with the research discussed earlier that indicates
that women are undercounted in the agricultural labor data. For Africa, effective labor
productivity of women is 53-54%. The effective shares of women’s agricultural labor are higher
for developing countries than for developed countries; and for low-income countries compared to
high income countries. This may primarily reflect the undercounting that is more likely in
subsistence and smallholder production than in commercial agricultural production.
14 Using the indicator variables for the year does not impose the structure of a smooth growth rate that would be implied by including a time trend; this is a more general specification.
17
These estimated differential contributions to output could be the result of a number of factors.
We expect that women are undercounted in the national level data on employment in agriculture.
Thus, each woman reported in the data may actually represent additional women providing labor.
To the extent that men and women perform different agricultural tasks that have a different
impacts on productivity, the coefficient on women’s labor might be significant. Finally, because
of social norms, other responsibilities, etc. men and women’s measured labor could enter the
production function differently. Each woman measured in the data could be involved in other
tasks that are complementary or competing with the actual time and effort spent in agricultural
production.
Of course it is also true that women’s participation in agricultural labor is itself endogenously
determined. In countries with good institutions, it may be the case that women have more ability
to participate in the labor market. These institutions might include good governance, rule of law,
well-functioning state institutions and markets, and political, social and economic freedoms. This
might lead to a correlation between women’s labor force participation and productivity levels,
but both would essentially be driven by institutional quality. Nevertheless, the correlation is itself
interesting.
Micro evidence
There is an extensive microeconomic literature comparing men’s and women’s productivity in
agriculture. Quisumbing reviews the methodology and results of such studies and concludes,
“female farmers are equally efficient as male farmers, once individual characteristics and input
levels are controlled for (Quisumbing, 1996, p. 1590).” These inputs include quality and quantity
of land, fertilizer, improved varieties, extension services and credit. For example, the study cited
above on China finds that they cannot reject the null hypothesis that women are as efficient as
farm managers as men, using several different definitions of women as farm managers.
Peterman, Quisumbing and Behrman (2010) propose a decomposition of the gender differences
in productivity to determine whether the differences in levels of output are due to differences in
resource endowments or due to men being able to use a given set of resources more efficiently.
18
They attribute productivity differences in Nigeria and Uganda to both of these factors. They
argue that choices of crop, technologies used, and management techniques are all endogenous to
the production decisions and influenced by gender.
The adoption of technologies for agricultural production frequently differs by gender.15
Much of
the literature on agricultural technology adoption simply demonstrates that women are less likely
to adopt these technologies, without exploring why these gender differences exist. Doss and
Morris (2001) examine the case of improved maize technology in Ghana and find that the gender
differences are a result of the gender linked differences in access to complementary inputs. They
also find that famers living in female-headed households are less likely to adopt improved
technologies than farmers, whether male or female, living in male headed households.
It is important to note here that even if women were exactly as productive as men, given the
same access to resources and inputs, we would expect to see women producing lower levels of
output precisely because they have much less access to these resources and inputs.16
Women
often produce food on small plots of land of relatively poor quality, with limited access to
improved technologies, credit or information. Thus, their output, whether calculated per unit of
land or per unit of labor is typically lower than that for male farmers.
The macro and micro evidence reported here are not necessarily contradictory. The macro
evidence – suggesting that aggregate productivity rises with the proportion of women in the labor
force – may simply reflect the fact that women’s labor is underrepresented in the macro data.
Thus, each woman reported in the data may actually reflect additional women whose labor is
unreported.
CONCLUSIONS
Overwhelming empirical evidence points to the importance of women as agricultural producers.
Although it is not possible to substantiate the claim that women produce 60-80% of the food in
15 See Doss (2001) for a review of this literature on Africa. 16 See Peterman et al, (2010) for a review of the literature on non-land agricultural inputs.

19
developing countries – or even that they provide 60-80% of the labor in agriculture, this should
not be interpreted as evidence that women are insignificant in the agricultural sector. In fact,
given women’s continuing lack of access to secure land tenure, cash and credit for inputs, and
information about new technologies, and given their primary responsibility for many other
household tasks, it would be surprising if they were able to produce over half of food crops.
Even if women did produce over half of food crops, it would be even more surprising – given the
measurement challenges – if the data supported this claim. Instead, we see that women contribute
a large portion of the measured contributions to agriculture labor and the women’s share of the
measured agricultural labor forces has a positive impact on national level agricultural
productivity.
And while women are not the majority of those reported to be working in agriculture, the
agricultural sector is important for women. Of those women in the least developed countries who
report being economically active, 79% of them report agriculture as their primary economic
activity. Overall, 48% of the economically active women in the world report that their primary
activity is agriculture.17
Better data are needed, but data should not be collected simply to demonstrate women’s
contribution to food production. Instead, better data are needed to document the constraints that
women face. Data collection has improved substantially since the 1972 UNECA estimate that
“women are responsible for 60-80 % of the agricultural labour supplied on the continent of
Africa.” Among other advances, we have learned that to understand women’s roles in
agriculture, we need to ask not only about their primary economic activities, but about all the
activities in which women engage. In addition, data are needed to better understand gender roles
in agriculture and how they change over time and in response to new opportunities. Simply
finding a better way to calculate women’s share of food production will not necessarily help us
to understand how gender roles and responsibilities shape agricultural production.
Ultimately, the important issue is not whether women produce 60-80% of the world’s food. We
know that women are important as food producers, and we know that development efforts that
17 FAOSTAT.
20
target food and agriculture must recognize the unique roles and constraints that face women. We
also know that interventions targeting women are complicated. The stylized fact that women
produce 60-80% of the world’s food resonates with many people – researchers, policy-makers
and activists – who work on rural women’s issues. But perhaps the statistical claim obscures the
complex underlying reality, which is that women’s labor in agriculture cannot be neatly
separated from their other time uses; neither can it be separated from men’s labor; nor can
women’s labor in agriculture be understood properly without also understanding their differential
access to land, capital, assets, human capital, and other productive resources.
For many reasons, we need to support women as food producers and to ensure that the structural
changes now underway in world agriculture benefit women, as well as men, both as producers
and consumers of food.
21
REFERENCES Acharya, M. and L. Bennett. 1982. Women and the Subsistence Sector: Economic Participation and Household Decisionmaking in Nepal.World Bank Staff Working Papers, No. 526. Blackden, C. M. and Q. Wodon. Eds. 2006. Gender, Time Use and Poverty in Sub-Saharan Africa. World Bank Working Paper No. 73. Bosnia-Herzogovenia, Living Standards Study Survey. 2001. Charmes, J. 2006. “A review of empirical evidence on time use in Africa from UN-sponsored surveys.” In C.M. Blackden and W. Wodon. Gender, Time Use, and Poverty in Sub- Saharan Africa, World Bank Working Paper No. 73. Washington, DC. Craig, B., P. Pardey, and J. Roseboom. 1997. International productivity patterns: Accounting for input quality, infrastructure, and research. American Journal of Agricultural Economics, Vol. 79(4): 1064-1076 De Brauw, A., Q. Li, C. Liu, S. Rozelle and L. Zhang. 2008. “Feminization of agriculture in China? Myths surrounding women’s participation in farming,” The China Quarterly, 327- 348. Deere, C. D. 2005. The Feminization of Agriculture? Economic Restructuring in Rural Latin America. United National Research Institute for Social Development, Occasional Paper 1. Doss, C. 2002. Men’s crops? Women’s crops? The gender patterns of cropping in Ghana. World Development, Vol. 30(11): 1987-2000. Doss, C. and M. Morris. 2001. How does gender affect the adoption of agricultural innovations? The case of improved maize technology in Ghana. Agricultural Economics, 25: 27-39. Doss, C. 2001. Designing agricultural technology for African women farmers: lessons from 25 years of experience. World Development 29(12): 2075-2092. Duflo, E. and C. Udry. 2001. Intrahousehold Resource Allocation in Cote d’Ivoire: Social Norms, Separate Accounts, and Consumption Choices. Processed. Department of Economics, MIT, Cambridge, MA. FAO. 1997. FAO Focus on Women and Food Security. FAO. http://www.fao.org/focus/e/women/sustin-e.htm FAO. 1985. Women and developing agriculture. Women in Agriculture Series No 4. Rome.
22
FAO. FAOSTAT. http://faostat.fao.org/ Fontana, M. and L. Natali. 2008. Gendered patterns of time use in Tanzania: Public investment in infrastructure can help? Paper prepared for the IFPRI Project on ‘Evaluating the Long –Term Impact of Gender-focused Policy Interventions.’ Ganguly, A. T. S.. 2003. Feminization of India’s agricultural workforce. Labor Education. No. 131–32: 29–3 Ghana Statistical Services. Ghana Living Standards Survey. 1998-99. Accra, Ghana. Gupta, G. R.. October 11, 2009. De Moines Register. Guest column: “When women farm, crops and economies grow.” Hayami, Y. and V. Ruttan. 1985. Agricultural Development : An International Perspective. Baltimore : Johns Hopkins University Press. Hoddinott, J. and L. Haddad. 1995 Does female income share influence household expenditure patterns? Oxford Bulletin of Economics and Statistics, Vol. 57(1): 77-96. Gobierno de Nicaragua. 2001.ss Encuesta Nacional de Hogares sobre medición de nivel de vida. Instituto de Estadísticas y Censos. Proyecto MECOVI Jackson, C. 2005. Strengthening Food Policy Through Gender and Intrahousehold Analysisç Impact Assessment of IFPRI Multicountry Research. Impact Assessment Discussion Paper, 2005. International Food Policy Research Institute, Washington, DC. Jain, D. 1996. Valuing work: Time as a measure. Economic and Political Weekly 31(43): WS46– 57: 48-49. Jarvis, L. and E. Vera-Toscano. 2004. Seasonal Adjustment in a Market for Female Agricultural Workers. American Journal of Agricultural Economics, 86(1): 254–266. Jose, A.V. 1989. Limited Options: Women Workers in Rural India. ILO. Katz, E. 2003. “The changing role of women in the rural economies of Latin America.” In B. Davis (ed.). Food, Agriculture and Rural Development: Current and Emerging Issues for Economic Analysis and Policy Research – II. Vol. I: Latin America and the Caribbean. Food and Agriculture Organization of the United Nations, Rome. Lastarria-Cornhiel, S. 2006. Feminization of Agriculture: Trends and Driving Forces. RIMISP, Background paper for the World Development Report 2008. McSweeney, B. G. 1979. Collection and analysis of data on rural women's time use. Studies in Family Planning, Vol. 10(11/12), Learning about Rural Women: 379-383.
23
Mehra, R. and M. H. Rojas. A Significant Shift: Women, Food Security and Agriculture in a Global Marketplace. International Center for Research on Women (ICRW), 2008, p.2, citing FAO Focus on Women and Food Security. FAO. http://www.fao.org/focus/e/women/sustin-e.htm Momsen, J. H. 1991. Women and development in the Third World, Routledge, 1991. Quisumbing, A. 1996. Male-Female differences in agricultural productivity: Methodological Issues and Empirical Evidence. World Development, Vol. 24:10(1579-1595. Peterman, A., A. Quisumbing, J. Behrman, and E. Nkonya. 2010. Understanding gender differences in agricultural productivity in Uganda and Nigeria. Paper prepared for the FAO State of Food and Agriculture 2010. Peterman, A., A. Quisumbing and J. Behrman. 2010. A review of empirical evidence on gender differences in non-land agricultural inputs, technology, and services in developing countries. Background paper prepared for the FAO State of Food and Agriculture 2010. Saito, K. A., H. Mekonnen, D. Spurling, Raising the productivity of women farmers in Sub- Saharan Africa. Discussion Paper No. 230, World Bank Publications, 1994. United Nations Economic Commission for Africa. 1972. Women: The Neglected Human Resource for African Development. Canadian Journal of African Studies / Revue Canadienne des Études Africaines, Special Issue: The Roles of African Women: Past, Present and Future, Vol. 6(2): 359-370. Vollrath, Dietrich. 2007. Land Distribution and International Agricultural Productivity. American Journal of Agricultural Economics, 89(1):202-216. Wiebe, K., M. Soule, C. N. and V. Breneman. 2000. Resource Quality and Agricultural Productivity: A Multi-Country Comparison. Paper presented at the annual meeting of the American Agricultural Economics Association, Tampa, Florida July. http://ageconsearch.umn.edu/bitstream/21723/1/sp00wi01.pdf
24
Table 1. Share of Women in the Agricultural Labor Force, 1961-2006. Weighted Unweighted World 42.2 34.9 Developed countries 42.1 34 Developing countries 42.3 35.2 Low-income countries 42 46.3 High-income countries 36.4 31.3 Asia 42.9 42 Latin America & Caribbean 16.2 16 Near East and North Africa 42.1 31.8 Sub-Saharan Africa 46.5 47.1
Source: FAOSTAT Note: Weighted results adjust for differences in agricultural labor force.
25
Table 2. Proportion of Total Time in Agricultural Activities Contributed by Women
Definition of Activity and Location Women’s share Source
Agricultural Activities -- Burkina Faso 0.54 Saito Agricultural Activities – Kenya 0.59 Agricultural Activities – Nigeria 0.56 Agricultural Activities – Zambia 0.54 Crop production -- Cameroon 0.58 Leplaideur18
Ag production -- SW Cameroon (small dry
season) 0.73 Charmes19
Ag production -- SW Cameroon (rainy season)
0.65 Ag production -- SW Cameroon (dry season) 0.66 Agriculture -- Rural households in Malawi 0.49 Total food production, incl. processing, marketing, animal husbandry, and water and fuel supply -- Upper Volta 0.64 McSweeney Food and cash crop production -- Upper Volta 0.49 Tanzania 2006, Tanzania Time Use Survey Crop farming (not related to establishments) – Tanzania 0.47 Fontana Agriculture -- Rajasthan Ages 14-19 0.60 Jain Agriculture -- Rajasthan Ages 19-34 0.47 Agriculture -- Rajasthan Ages 34-44 0.36 Agriculture -- Rajasthan Ages 44-70 0.43 Agriculture -- West Bengal Ages 14-19 0.34 Agriculture -- West Bengal Ages 19-34 0.10 Agriculture -- West Bengal Ages 34-44 0.10 Agriculture -- West Bengal Ages 44-70 0.02 Farm hours worked -- China 0.49
De Braw, Li, Liu, Rozelle and Zhang
Agriculture -- Nepal 0.44 Acharya & Bennett
18 Cited in Charmes, p. 50. 19 These calculations were made by Charmes, p. 62, based on data from Pasquet and Koppert.

26
Table 3. Proportion of Total Time in Food Production Contributed by Women
Definition of Activity and Location Women’s Share Source
Food production, supply and distribution, incl. processing and fuel and water collection, but not cooking – Upper Volta
0.65 McSweeny
Activities related to food preparation -- Tanzania 0.87 Fontana Ag processing and cooking – Rajasthan Age 14-19 1.00 Jain Ag processing and cooking -- Rajasthan Age 19-34 0.98 Ag processing and cooking -- Rajasthan Age 34-44 0.91 Ag processing and cooking -- Rajasthan Age 44-70 0.90 Food processing and Cooking—Nepal 0.84 Aharya & Bennett
Table 4. Share of Food produced by Female-headed household.
% of households headed by women
% of total value of food produced by FHHs
China 3.1 2.1 Bosnia-Herzogovenia 25 13.2 Ghana 33 12 Nicaragua 38 17
Source: Calculated by author from data reported in DeBrauw et al, and from the BiH LSMS survey, the Nicaragua MECOVI survey and Ghana Living Standards Survey.

27
Table 5. Aggregate Productivity Estimates for Female Share of Agricultural Labor.
Estimated Relative Productivity of Female Ag Labor
Share of Effective Labor Units Provided by Women
Weighted Unweighted World 1.08 45.6 37.7 Developed countries 0.89 37.5 30.3 Developing countries 1.12 47.3 39.4 Low-income countries 1.26 52.9 58.3 High-income countries 0.89 32.3 27.8 Asia 0.96 41.0 40.2 Latin America & Caribbean 1.42 23.0 22.8 Near East and North Africa 1.19 50.3 38.0 Sub-Saharan Africa 1.14 52.9 53.6
Note: Weighted results adjust for differences in agricultural labor force.
28
Appendix. Table 1. Agricultural productivity and female share of total population active in agriculture. Developed and developing countries, high and low income countries. (1) (2) (3) (4) (5) World Developed
Countries Developing Countries
High Income Countries
Low Income Countries
Constant 3.838*** 4.317*** 3.837*** 5.036*** 3.068*** (0.110) (0.189) (0.127) (0.185) (0.203) Female share of total 0.0794*** -0.109*** 0.118*** -0.113*** 0.259** Agricultural population Conventional inputs
(0.0118) (0.0136) (0.0170) (0.0159) (0.102)
Livestock 0.205*** 0.269*** 0.200*** 0.193*** 0.279*** (0.0118) (0.0195) (0.0140) (0.0223) (0.0195) Land 0.647*** 0.402*** 0.634*** 0.511*** 0.251*** (0.0129) (0.0241) (0.0193) (0.0233) (0.0412) Tractors 0.0725*** 0.0226*** 0.0865*** 0.0351*** 0.0936*** (0.00416) (0.00691) (0.00486) (0.00549) (0.00687) Fertilizer 0.0573*** 0.0908*** 0.0553*** 0.132*** 0.0383*** (0.00318) (0.00699) (0.00360) (0.00719) (0.00393) Land quality Percent equipped for irrigation
0.0269*** 0.0356*** 0.0224*** -0.00943 0.0695***
(0.00602) (0.00693) (0.00803) (0.00845) (0.00903) Percent arable land 0.0845*** 0.0869** 0.0910*** -0.0122 0.197*** (0.0222) (0.0354) (0.0261) (0.0378) (0.0366) Observations 5305 1447 3858 1294 1806 R-squared 0.804 0.952 0.703 0.947 0.441 Number of countries 154 52 102 37 51 Years 1961-2002 1961-2002 1961-2002 1961-2002 1961-2002 Dependent variable is the log of agricultural output per worker. Standard errors in parentheses. *** p<0.01, ** p<0.05, * p<0.1. All regressions include year dummies and control for country fixed effects.
29
Appendix Table 2. Agricultural productivity and female share of total population active in agriculture.
Asia Near East and North Africa
Sub-Saharan Africa
Latin America
Constant 4.250*** 4.649*** 2.044*** 5.930*** (0.310) (0.282) (0.217) (0.308) Female share of total -0.0438 0.422*** 0.191 0.137*** agricultural population (0.0645) (0.0565) (0.122) (0.0218) Conventional inputs
Livestock 0.269*** 0.242*** 0.231*** 0.171*** (0.0220) (0.0283) (0.0213) (0.0348) Land 0.277*** 0.581*** 0.691*** 0.251*** (0.0392) (0.0399) (0.0407) (0.0409) Tractors 0.0815*** 0.173*** 0.0510*** 0.0289* (0.00568) (0.0218) (0.00798) (0.0163) Fertilizer 0.0658*** 0.0234** 0.0164*** 0.0883*** (0.00623) (0.0102) (0.00457) (0.00886) Land quality Percent equipped for irrigation
-0.108*** 0.0650* 0.0561*** -0.00392
(0.0150) (0.0332) (0.00978) (0.0201) Percent arable land 0.0808 -0.223** 0.406*** -0.0924** (0.0683) (0.0909) (0.0374) (0.0433) Observations 664 499 1504 1106 R-squared 0.873 0.947 0.498 0.673 Number of countries 17 12 43 27 Years 1961-2002 1961-2002 1961-2002 1961-2002
Dependent variable is the log of agricultural output per worker. Standard errors in parentheses. *** p<0.01, ** p<0.05, * p<0.1. All regressions include year dummies and control for country fixed effects.
ESA Working Papers WORKING PAPERS The E SA Working P apers ar e pr oduced by t he A griculture and E conomic
Development Analysis Division (ESA) of the Economic and Social Department of the
United Nations Food and Agriculture Organization (FAO). The series presents ESA’s
ongoing r esearch. W orking paper s ar e c irculated t o s timulate di scussion
and comments. They are made available to the public through the Division’s website.
The a nalysis and c onclusions are t hose of t he a uthors an d do n ot i ndicate
concurrence by FAO.
AGRICULTURAL DEVELOPMENT ECONOMICS Agricultural Development Economics (ESA) i s F AO’s f ocal poi nt for ec onomic
research and policy analysis on issues relating to world food security and sustainable
development. E SA c ontributes t o t he g eneration of k nowledge and ev olution o f
scientific t hought on hunger a nd poverty al leviation t hrough i ts economic s tudies
publications w hich i nclude t his w orking paper s eries as w ell as per iodic a nd
occasional publications.
Agricultural Development Economics (ESA)
The Food and Agriculture Organization Viale delle Terme di Caracalla
00153 Rome, Italy
Contact: Office of the Director
Telephone: +39 06 57054368 Facsimile: + 39 06 57055522
Website: www.fao.org/economic/esa e-mail: [email protected]


![Deep Sky Modeling for Single Image Outdoor Lighting Estimationopenaccess.thecvf.com/content_CVPR_2019/papers/Hold... · 2019-06-10 · al. [12] model outdoor lighting with the parametric,](https://static.fdocuments.in/doc/165x107/5ecad2e5ce656651bd165d9b/deep-sky-modeling-for-single-image-outdoor-lighting-2019-06-10-al-12-model.jpg)