IEX Bulletin VOLUME 3 - Indian Energy Exchange Bulletin...NEWS AND INFORMATION IEX Bulletin ... the...
8
www.iexindia.com | 01 NEWS AND INFORMATION IEX Bulletin REGULATORY NEWS CERC proposes Draft DSM Procedure for Renewable Energy On 12th February, 2016, CERC proposed draft procedure for implementation of the framework on forecasting, scheduling and imbalance handling for Renewable Energy (RE) generating stations based on wind and solar energy at inter-state level. The key highlights of the procedure are as below: Commercial Settlement: − RE generators which are regional entities to be paid as per schedule. − Deviations to be charged as per DSM Regulations 2015 from 1.11.2015. Losses and Charges: − Applicable transmission charges and losses to be as per the IEGC and CERC (Sharing of ISTC and Losses) Regulations. − RLDC fee and charges to be paid as per CERC’s relevant Regulations after getting registered with respective RLDCs as a user. The draft procedure further defines treatment of RECs: − Deviations by all RE generators to be first netted off by the concerned RPC for the entire pool on a monthly basis. − If actual generation is more than scheduled generation, RECs will be credited to the respective regional DSM pool and carried forward for settlement in future. − After netting off, the remaining shortfall shall be balanced through purchase of equivalent RECs through power exchanges. − The periodicity of buying of RECs for the shortfall RE generation shall be on financial year basis. More information: www.cercind.gov.in CERC determines markup charge for Regulation up service CERC vide its order dated 29th February, 2016, determined the mark-up for participation in Regulation Up Ancillary Services at 50 paise/kWh. The Commission also clarified that the schedule under Ancillary Services Regulation is not proposed to be considered for PLF-linked incentive for the generating station. Thus, the calculation of incentive shall be based only on schedule from beneficiaries, excluding schedule under the Ancillary Service. More information: www.cercind.gov.in MARCH'16 ISSUE 3 | VOLUME 3 IN THIS ISSUE... PAGE REGULATORY NEWS BULLETIN LLET IEX IEX LETIN IEX IEX IEX IEX IEX IEX IEX IEX BULLETIN BULLETIN BULLETIN IEX BULL BULLETIN LL BULL BULL 01 CERC proposes Draft DSM Procedure for Renewable Energy BULLETIN LLET IEX IEX LETIN IEX IEX IEX IEX IEX IEX IEX IEX BULLETIN BULLETIN BULLETIN IEX BULL BULLETIN LL BULL BULL 01 CERC determines markup charge for Regulation up service BULLETIN LLET IEX IEX LETIN IEX IEX IEX IEX IEX IEX IEX IEX BULLETIN BULLETIN BULLETIN IEX BULL BULLETIN LL BULL BULL 01 NLDC proposes bi-monthly frequency of REC Market BULLETIN LLET IEX IEX LETIN IEX IEX IEX IEX IEX IEX IEX IEX BULLETIN BULLETIN BULLETIN IEX BULL BULLETIN LL BULL BULL 02 HPERC determines additional surcharge @ 78 paisa/kwh BULLETIN LLET IEX IEX LETIN IEX IEX IEX IEX IEX IEX IEX IEX BULLETIN BULLETIN BULLETIN IEX BULL BULLETIN LL BULL BULL 02 Chhattisgarh issues Draft Intra-state ABT and DSM Regulations, 2016 PAGE INTERNATIONAL NEWS BULLETIN LLET IEX IEX LETIN IEX IEX IEX IEX IEX IEX IEX IEX BULLETIN BULLETIN BULLETIN IEX BULL BULLETIN LL BULL BULL 02 Renewable energy rise drives shorter term deals in European wholesale power PAGE MARKET INSIGHTS BULLETIN LLET IEX IEX LETIN IEX IEX IEX IEX IEX IEX IEX IEX BULLETIN BULLETIN BULLETIN IEX BULL BULLETIN LL BULL BULL 03 Economic Survey 2016 - Power Sector PAGE MARKET NEWS BULLETIN LLET IEX IEX LETIN IEX IEX IEX IEX IEX IEX IEX IEX BULLETIN BULLETIN BULLETIN IEX BULL BULLETIN LL BULL BULL 04 REC Market Update: February’16 BULLETIN LLET IEX IEX LETIN IEX IEX IEX IEX IEX IEX IEX IEX BULLETIN BULLETIN BULLETIN IEX BULL BULLETIN LL BULL BULL 05 Power Market Update: February’16 PAGE TRADE INFO BULLETIN LLET IEX IEX LETIN IEX IEX IEX IEX IEX IEX IEX IEX BULLETIN BULLETIN BULLETIN IEX BULL BULLETIN LL BULL BULL 06 Trade Data: February’16
-
Upload
nguyencong -
Category
Documents
-
view
215 -
download
0
Transcript of IEX Bulletin VOLUME 3 - Indian Energy Exchange Bulletin...NEWS AND INFORMATION IEX Bulletin ... the...

www.iexindia.com | 01
N E W S A N D I N F O R M A T I O NIEX Bulletin
REGULATORY NEWS
CERC proposes Draft DSM Procedure for Renewable Energy
On 12th February, 2016, CERC proposed draft procedure for implementation of the framework on forecasting, scheduling and imbalance handling for Renewable Energy (RE) generating stations based on wind and solar energy at inter-state level. The key highlights of the procedure are as below:
� Commercial Settlement:
− RE generators which are regional entities to be paid as per schedule.
− Deviations to be charged as per DSM Regulations 2015 from 1.11.2015.
� Losses and Charges:
− Applicable transmission charges and losses to be as per the IEGC and CERC (Sharing of ISTC and Losses) Regulations.
− RLDC fee and charges to be paid as per CERC’s relevant Regulations after getting registered with respective RLDCs as a user.
� The draft procedure further defines treatment of RECs:
− Deviations by all RE generators to be first netted off by the concerned RPC for the entire pool on a monthly basis.
− If actual generation is more than scheduled generation, RECs will be credited to the respective regional DSM pool and carried forward for settlement in future.
− After netting off, the remaining shortfall shall be balanced through purchase of equivalent RECs through power exchanges.
− The periodicity of buying of RECs for the shortfall RE generation shall be on financial year basis.
More information: www.cercind.gov.in
CERC determines markup charge for Regulation up service
CERC vide its order dated 29th February, 2016, determined the mark-up for participation in Regulation Up Ancillary Services at 50 paise/kWh. The Commission also clarified that the schedule under Ancillary Services Regulation is not proposed to be considered for PLF-linked incentive for the generating station. Thus, the calculation of incentive shall be based only on schedule from beneficiaries, excluding schedule under the Ancillary Service.
More information: www.cercind.gov.in
MARCH'16 ISSUE 3 | VOLUME 3
IN THIS ISSUE...
PAGE REGULATORY NEWS
BULL
ETIN
LLET
IEX
IEX
LETIN
IEX
IEX
IEXIEX
IEX
IEX
IEXIE
X
BULLETIN
BULLETIN
BULLETIN
IEX
BULL
BULLETIN
LL
BULL
BULL
01 CERC proposes Draft DSM Procedure for Renewable Energy
BULL
ETIN
LLET
IEX
IEX
LETIN
IEX
IEX
IEXIEX
IEX
IEX
IEXIE
X
BULLETIN
BULLETIN
BULLETIN
IEX
BULL
BULLETIN
LL
BULL
BULL
01 CERC determines markup charge for Regulation up service
BULL
ETIN
LLET
IEX
IEX
LETIN
IEX
IEX
IEXIEX
IEX
IEX
IEXIE
X
BULLETIN
BULLETIN
BULLETIN
IEX
BULL
BULLETIN
LL
BULL
BULL
01 NLDC proposes bi-monthly frequency of REC Market
BULL
ETIN
LLET
IEX
IEX
LETIN
IEX
IEX
IEXIEX
IEX
IEX
IEXIE
X
BULLETIN
BULLETIN
BULLETIN
IEX
BULL
BULLETIN
LL
BULL
BULL
02 HPERC determines additional surcharge @ 78 paisa/kwh
BULL
ETIN
LLET
IEX
IEX
LETIN
IEX
IEX
IEXIEX
IEX
IEX
IEXIE
X
BULLETIN
BULLETIN
BULLETIN
IEX
BULL
BULLETIN
LL
BULL
BULL
02 Chhattisgarh issues Draft Intra-state ABT and DSM Regulations, 2016
PAGE INTERNATIONAL NEWS
BULL
ETIN
LLET
IEX
IEX
LETIN
IEX
IEX
IEXIEX
IEX
IEX
IEXIE
X
BULLETIN
BULLETIN
BULLETIN
IEX
BULL
BULLETIN
LL
BULL
BULL
02 Renewable energy rise drives shorter term deals in European wholesale power
PAGE MARKET INSIGHTS
BULL
ETIN
LLET
IEX
IEX
LETIN
IEX
IEX
IEXIEX
IEX
IEX
IEXIE
XBULLETIN
BULLETIN
BULLETIN
IEX
BULL
BULLETIN
LL
BULL
BULL
03 Economic Survey 2016 - Power Sector
PAGE MARKET NEWS
BULL
ETIN
LLET
IEX
IEX
LETIN
IEX
IEX
IEXIEX
IEX
IEX
IEXIE
X
BULLETIN
BULLETIN
BULLETIN
IEX
BULL
BULLETIN
LL
BULL
BULL
04 REC Market Update: February’16
BULL
ETIN
LLET
IEX
IEX
LETIN
IEX
IEX
IEXIEX
IEX
IEX
IEXIE
X
BULLETIN
BULLETIN
BULLETIN
IEX
BULL
BULLETIN
LL
BULL
BULL
05 Power Market Update: February’16
PAGE TRADE INFO
BULL
ETIN
LLET
IEX
IEX
LETIN
IEX
IEX
IEXIEX
IEX
IEX
IEXIE
X
BULLETIN
BULLETIN
BULLETIN
IEX
BULL
BULLETIN
LL
BULL
BULL
06 Trade Data: February’16

02 | www.iexindia.com
NLDC proposes bi-monthly frequency of REC Market
NLDC has proposed that the frequency of REC Trading sessions will be made bi-monthly. Accordingly, NLDC has proposed amendments in ‘Procedure for Redemption of RECs:
� REC Trading will take place on the second and last Wednesday of each month.
� In case of a Bank holiday, trading to be held on the next working day.
More information: www.posoco.in
HPERC determines additional surcharge @ 78 paisa/kwh
HPERC vide its order dated 18th February, 2016, has determined Additional Surcharge (AS) of 78 paise per kWh to be applicable for Short Term Open Access (STOA) consumers. It also specifies that additional surcharge shall not be payable in the following situations:
� Time slots when HPSEBL may impose energy cuts
� If a consumer is not able to draw full quantum of energy scheduled in any time slot due to transmission and/or distribution system constraints.
The above has come into force from 24th February, 2016.
More information: www.hperc.org
Chhattisgarh issues Draft Intra-state ABT and DSM Regulations, 2016
� In February, 2016, Chhattisgarh State Electricity Regulatory Commission (CSERC) issued draft Intra-
state Availability Based Tariff and Deviation Settlement Regulations, 2016. The key highlights of the regulations are as below:
Applicability of Intra-State Availability Based Tariff (ABT)
� All State Generating Stations owned by Chhattisgarh State power Generating Company Ltd (CSPGCL), other Generating Plants including Captive Generating Plant (CGP), Distribution Licensees and Consumers/captive users located within the State.
Components of ABT
� Fixed charges/capacity Charges: Charges linked to ‘Availability’ of the generating stations declared on daily basis in MW.
� Energy charges/variable Charges: Payable on the scheduled energy irrespective of actual drawl.
� Deviation Charges: For variation between scheduled and actual quantum based on the frequency of the time block as per CERC (DSM and related matters) Regulations, 2014.
Charges for Deviation
� Charges to be paid on deviation from schedule.
� Separate charges for deviation by RE generators have been mentioned in the Draft Regulations..
� Volume limits have been specified and an additional charge for Deviation will be applicable for over-drawl as well as under-injection of electricity for each time block in excess of the volume limit specified when average grid frequency of the time block is “49.70 Hz and above”..
More information: www.cserc.gov.in
INTERNATIONAL NEWSRenewable energy rise drives shorter term deals in European wholesale power
As per news reports, Short-term deals are growing in Europe's wholesale power market as a surge in renewables requires traders to ensure that volatile wind and solar energy meets demand at all times. The European Union is pushing towards clean energy sources, whose output is unpredictable. This means more sale and purchase of power occurs nearer to time of consumption, because electricity cannot yet be stored in large volumes and grids must keep a stable voltage to uphold supply security.
Spot power trading on day-ahead markets - which facilitate power delivery on the following day at European exchanges rose 6% in 2015. Moreover, over the last five years, spot volumes have increased by 31%. The wholesale electricity trading on exchanges and over-the-counter in the region was estimated to be at 8,517 terawatt-hours (BUs) last year, with spot volumes constituting around 15% of the total.
More information: www.argusmedia.com

www.iexindia.com | 03
MARKET INSIGHTS
Economic Survey 2016 - Power Sector
The economic survey of 2016 was tabled in the Parliament on 26th February 2016. This year’s survey includes a Chapter dedicated to the Power Sector titled – ‘Powering “One India”. The key findings and recommendations of the chapter are summarized as below:
Key Findings/Observations on Power Sector � Capacity Expansion: Generation and transmission
capacity of the sector has grown considerably. 26.5 GW of generation added in a single year (14-15), lowering peak deficits, congestion reduced due to transmission availability.
� Growing thrust on Renewable Energy: RE targets increased to 175 GW by 2022. Grid parity of solar expected as in the latest bids for National solar mission where bids reached ` 4.34/unit.
� High losses of the Discoms, tariff fixation not adequate:
− The report notes that average tariffs in some cases are set below the average cost of supplying electricity; it further adds that States with the highest losses are those where tariffs fail to cover costs on average. The figure 2 of the report gives a comparison of the per unit Average Tariff (AT) and Average Cost of Supply (ACS) for 2013-14.
− The report states that high industrial tariffs and variable quality of electricity adversely affects ‘Make in India’. It further adds that high tariffs and erratic supply for industry have led to a slow but steady decline in the growth of industrial electricity purchases from utilities and a gradual transition towards captive generation.
� Throttling of Open Access in States: The report states the following with respect to the Open Access (OA) situation in the country:
− “OA provides an aggregation of the country-wide supply and demand on the same platform.
Therefore, this constitutes a first step towards discovering a single market price for power around the country.”
− “Prices recorded on these Power Exchanges provide a daily signal of the demand, supply and congestion in the transmission network across the country.”
− The report applauds the effort of Railways in reducing its cost of power purchase by planning to procure power through the Open Access route. It states that the new arrangement is expected to result in an estimated cumulative saving of ̀ 742 crore in 2015-16 and ̀ 1600 crore in 2016-17.
− Some states have imposed significant barrier to Open Access by adding tariff barriers (Cross subsidy and Additional Surcharge) and other non-tariff barriers. The Figure 7 of the report (as reproduced below) elucidates the CSS imposed by States for procuring electricity from Exchange.
Recommendations of the Survey reportThe survey report concludes its recommendations and focuses them 4 key things on:
� Continuation of reforms so that India can become ‘one market’ in power.
� Relieving the burden on the industry by allowing it open access and making them internationally competitive as envisaged in ‘Make in India’.
� Tariff to be made simple and transparent, avoiding proliferating end-use charges.
� Tariff to be rationalized and progressively fixed for domestic consumer gradating based on the income class.
`/kW
h
3.5
3
2.5
2
1.5
1
0.5
0TN MPAP WB HR GJ TL TL OR KA PB CB BR UT JH UP HP RJ KL JKDL
Figure 2: Cross subsidy surcharge for purchasing electricity from PX, 20015-16
`/kW
h
7
6
5
4
3
2
1
0
Average Tari�ACS ACS (at T&D Losses of 10%)
RJ TN JH UP MP HR AP PB BR KL OR HP JK WB UT KA GJ CH MH DL
Figure 1: Average tari� and average cost of supply (`/kWh)
04 | www.iexindia.com
On an overall basis, a total of 2,842 participants are registered in the REC segment at IEX. Of this, 822 are Eligible Entities (RE Generators), 2,008 are Obligated Entities (DISCOMs, Open Access Consumers & Captive Generators) and 12 are registered as Voluntary Entities.
An overview of participation in the REC Market at IEX as on 29th February, 2016::
A total of 2,74,108 RECs were traded in the REC Market session on 24th February, 2016 held at IEX. Out of this, 2,32,450 were N-Solar and 41,658 were Solar RECs:
� In the non-solar segment, total buy bids were 2,32,450 and total sell bids were 59,81,626. All the buy bids were cleared at floor price of ` 1,500 per REC.
� In the solar segment, total buy bids were 41,658 RECs and sell bids were 19,43,383RECs. All buy bids were cleared at floor price of ` 3,500 per REC.
With compliance year 2015-16 coming to an end, the traded volume this month witnessed an increase of about 34% over the previous month when a total of 2,05,192 RECs were traded.
In fiscal 2015-16 (as on date), a total of 24.29 lac RECs have been traded, almost double of 12.29 lac RECs traded in the same period in fiscal 2014-15.
Participants:
A total of 1,342 participants traded at IEX with 844 participants in non-solar segment and 498 participants in the solar segment.
Total number of registered participants 2,831
Obligated Entity 2,002
DISCOMs 29
Open Access Consumers 1,854
Captive Consumer 91
Voluntary 12
Eligible Entity (Private Generators) 817
Highest participation in a session (March'15) 1,315
10,904 (26%)
16,057 (39%)14,697 (35%)
Solar Buyer Mix
Distribution LicenseeCaptive User Open Access Consumer
Distribution LicenseeCaptive User Open Access Consumer
Non Solar Buyer Mix
41,830 (18%)
74,297 (32%)116,323 (50%)
REC MARKET UPDATE: FEBRUARY’16
Some of these points are elaborated below:
� Tariff fixation for Discoms
− The report states that tariffs reflecting costs are a necessary condition for discoms to sustain themselves over the long-run.
− Simplification of tariffs with, perhaps no more than 2-3 tariff categories, will improve transparency and may well yield consumption and collection efficiency, along with governance benefits.
− It recommends determination of progressive tariff schedules for domestic consumers, with gradation based on income class of the
consumers, i.e. high income consumers pay higher and low income consumers pay less. Thereby, cross-subsidisation occurs within the residential consumers itself– i.e. rich and consumers with high consumption intensity within the residential sectors subsidise prices for consumers with lower consumption.
� Open Access − The report recommends that the time is ripe
to allow industry, which has a high demand for power, to absorb the excess generation capacity through OA, providing a stimulus to industrial production under ‘Make in India’.
MARKET NEWS
www.iexindia.com | 05
Power Market Update: February’16
With average Market Clearing Price (MCP) in Feb’16 at all-time low of ` 2.30 per unit in fiscal 2015-16, the spot power market continued to be the most competitive option for distribution utilities and open access consumers to procure power. Average MCP at ` 2.30 per unit is about 9% lower than ` 2.52 per unit in January. Even average Area Clearing Prices (ACP) across all bid areas reduced by 6-12% in February.
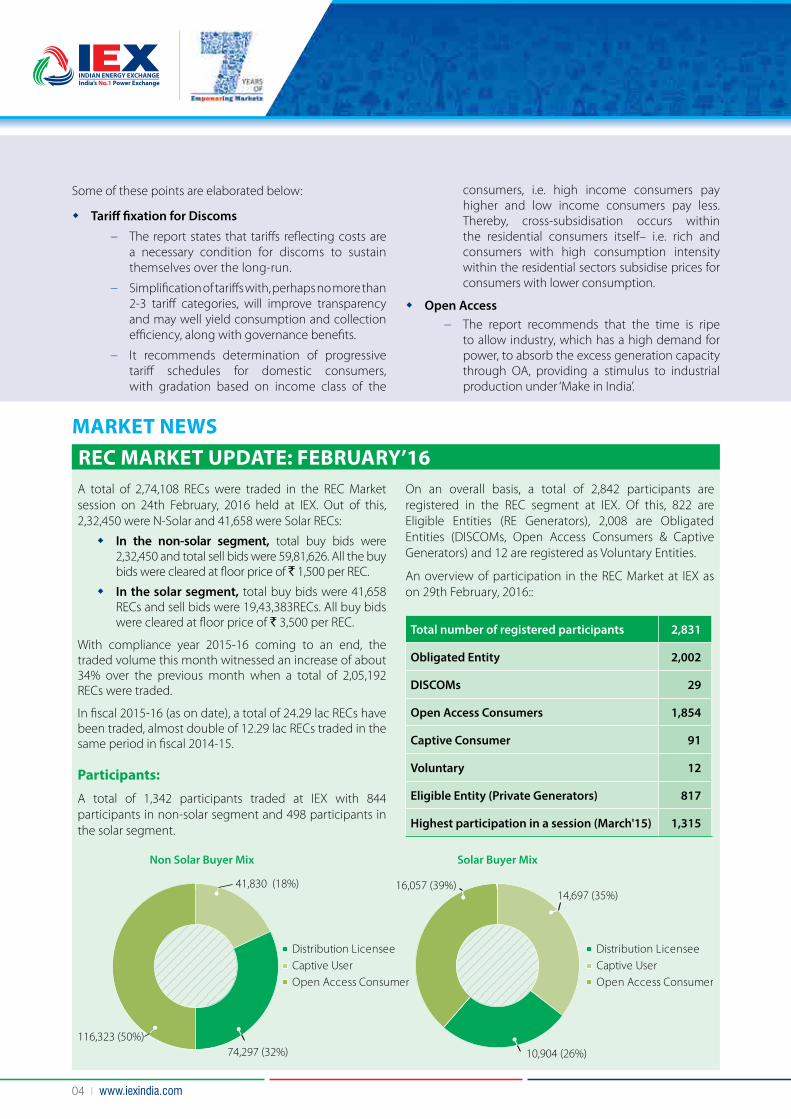
Interestingly, ACP at ` 2.51 per unit in the Southern region was even lower than ACP in the Northern region at ` 2.64 per unit. This has particularly been due to increase in generation capacity within the southern region and reduced reliance on import of power from the rest of India. However, transmission congestion in WR->SR and ER->SR corridors continued.
At 2,818 MUs, volume traded in February was marginally lower than volume traded in January (2,929 MUs). However, the average daily volume in Feb’16 was much higher at 97 MUs in comparison to 94 MUs last month. Aggregated purchase bids for the month were 3,285 MUs (about 4,720 MW on average daily RTC basis) and sell bids were 5,338 MUs (about 7,670 MW on average daily RTC basis).
About 112 MUs were curtailed in Feb’16, about 26% lower than volume curtailed in January (152 MUs). The ER->NR and WR->NR interconnections were congested 44% and 40% of the time respectively and the ER->SR and WR->SR interconnections were congested about 44% of the time during the month.
Volumes
A few key power market highlights are as given below:
� Total Sell bids – 5,338MUs
� Total buy bids – 3,285MUs
� Total Cleared Volume – 2,818 MUs
The Northern and Southern States were Net Buyers while the Eastern, Western and North-Eastern States were Net Sellers.
The table below gives the Average Daily Buy-Sell Picture at regional level for February’16 vis-à-vis January’15:
Prices (ACP)
In February, average Area Clearing Price (ACP) dipped across all the regions.
� In North-East, East and West, ACP was ` 2.11 per unit, about 6% lower than last month.
� In South, ACP was ` 2.51 per unit,12% lower than the previous month.
� In North, ACP was to ` 2.64 per unit, 8% lower over the previous month.
Participation
1,171 participants traded in the spot market on an average daily basis. The highest participation was on 25 February, 2016 when 1,237 participants traded on the Exchange.
Term-Ahead Market
About 25 MUs were scheduled during the month, mainly in the Intra-day and Day Ahead Contingency segments.
REGIONAVERAGE DAILY BUY (MW) AVERAGE DAILY SELL (MW)
NETFebruary'16 January'16 Change (%) February'16 January'16 Change (%)
North East 105.38 107.44 -2% 182.59 180.76 1% SELL
East 522.91 680.51 -23% 723.71 700.35 3% SELL
North 1531.96 1544.14 -1% 659.80 620.89 6% BUY
West 1119.87 1001.70 12% 2088.53 2034.97 3% SELL
South 768.58 603.39 27% 394.08 400.21 -2% BUY
01-0
2-20
1602
-02-
2016
03-0
2-20
1604
-02-
2016
05-0
2-20
1606
-02-
2016
07-0
2-20
1608
-02-
2016
09-0
2-20
1610
-02-
2016
11-0
2-20
1612
-02-
2016
13-0
2-20
1614
-02-
2016
15-0
2-20
1616
-02-
2016
17-0
2-20
1618
-02-
2016
19-0
2-20
1620
-02-
2016
21-0
2-20
1622
-02-
2016
23-0
2-20
1624
-02-
2016
25-0
2-20
1626
-02-
2016
27-0
2-20
1628
-02-
2016
29-0
2-20
16
Pric
e (`
/kW
h)Price During the Month
0.00
0.50
1.00
1.50
2.00
2.50
3.00
3.50 North-Avg price: ` 2.64/kWh
Rest of India-Avg price: ` 2.11/kWh
South-Avg price: ` 2.51/kWh
RoI North South
06 | www.iexindia.com
TRADE INFO: FEBRUARY' 16
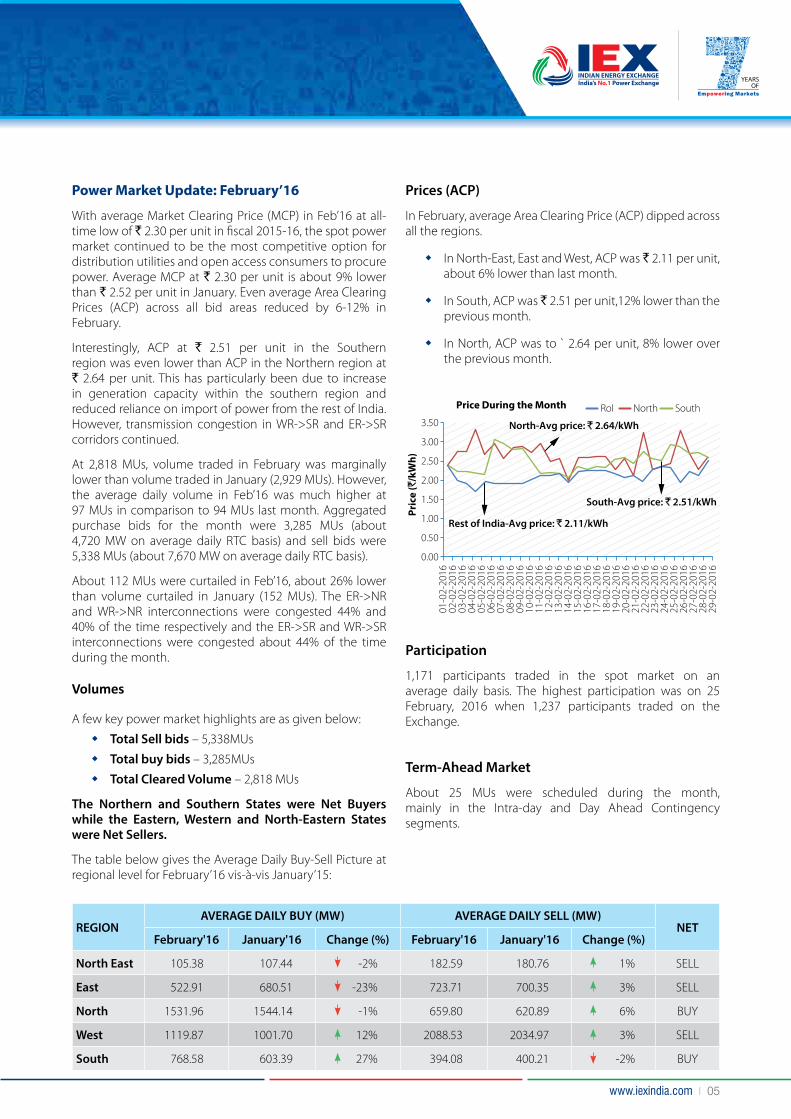
MONTHLY PRICE SNAPSHOT
MONTHLY VOLUME SNAPSHOT 1 MU = 1 Million kWh = 1 GWh
Minimum MCP Maximum MCP Average MCP
` 2.30/kWh` 3.33/kWh` 0.80/kWh
Average Daily
Volume
97MUs
Unconstrained Volume
2,930
4,210
Cleared Volume
2,818
4,049
PurchaseBids
3,285
4,719
Sell Bids
5,338
7,669
Cumulative Cleared
Volume (MU)
30,989For FY'16
VOLUME
Average Daily (MW)
TotalVolume (MUs)
TERM AHEAD MARKET SNAPSHOT (February'16)
Total Volume (MWh)
Max Price (`/kWh)
Min Price (`/kWh)Contracts
8,184 2.85 2.12Day-Ahead Contingency
- - -Weekly
16,857 4.00 2.25Intraday
- - -Daily
AREA PRICES
Prices (`/kWh)
Area Min Max RTC* (0-24 hr)
Peak* (18-23 hr)
Non Peak* (1-17 & 24 hr)
Night* (1-6 & 24 hr)
East, North East & West 0.20 3.33 2.11 2.32 2.04 1.87
North 0.50 5.60 2.64 2.58 2.66 1.96
South 0.50 4.50 2.51 2.60 2.48 1.98
* Simple Average of Area Clearing Prices for specified duration of time.

www.iexindia.com | 07
RP: Registered Projects
REC MARKET SNAPSHOT
RP: 4792 MWRP: 4792 MW
State-wise RE Capacity (MW)
Tamil Nadu
Karnataka
Chhattisgarh
Maharashtra
Rajasthan
Punjab
Uttar Pradesh
Andhra Pradesh
Himachal Pradesh
Gujarat
Madhya Pradesh
Others
Small Hydro
Solar
Others
Wind
Bio-fuel Cogeneration
Biomass
Source wise RE capacity (MW)
2293
882
695
300
6202
Registered Projects Registered Projects
1252
1015738
352
137
370
155
2106573 123
303
PARTICIPATION SNAPSHOT (February'16)
Total Registered Participants
3,800+
Open Access Consumers
3,389
Private Generators
307
Highest Participation
1,410, 22nd June '13
Trade Session on 24 February, 2016
REC PurchaseBids Sell Bids Cleared (REC) Price
(`/REC) Participants
59,81,626 1,5002,32,450 844Non Solar 2,32,450
41,658 3,500Solar 41,658 19,43,383 498
44.1% 44.1%
6.5%
40.0%44%
6% 6%
0.0%5.0%
10.0%15.0%20.0%25.0%30.0%35.0%40.0%45.0%50.0%
N3 Import W3 Export
% of time congestion
E�S W�S S1�S2 W�N E�N

Pric
e D
i�er
entia
l (`/
kWh) E N
01-0
2-20
16
02-0
2-20
16
03-0
2-20
16
04-0
2-20
16
05-0
2-20
16
06-0
2-20
16
07-0
2-20
16
08-0
2-20
16
09-0
2-20
16
10-0
2-20
16
11-0
2-20
16
12-0
2-20
16
13-0
2-20
16
14-0
2-20
16
15-0
2-20
16
16-0
2-20
16
17-0
2-20
16
18-0
2-20
16
19-0
2-20
16
20-0
2-20
16
21-0
2-20
16
22-0
2-20
16
23-0
2-20
16
24-0
2-20
16
25-0
2-20
16
26-0
2-20
16
27-0
2-20
16
28-0
2-20
16
29-0
2-20
16
00.5
11.5
22.5
3
Pric
e (`
/kW
h)
Volu
me
(MW
h)
Hourly MCV (MWh) Hourly MCP (`/kWh)Hours
0.00
0.50
1.00
1.50
2.00
2.50
3.00
0.00
1000.00
2000.00
3000.00
4000.00
5000.00
6000.00Average Hourly Market Clearing Volume and Price (February'16)
1 2 3 4 5 6 7 8 9 10 11 12 13 14 15 16 17 18 19 20 21 22 23 24
Pric
e ̀/k
Wh
Volu
me
MW
h
Cleared Volume (MWh) MCP N1 S1 W3
0
20,000
40,000
60,000
80,000
100,000
120,000
0.00
0.50
1.00
1.50
2.00
2.50
3.00
3.50IEX Price and Volume Trend (February'16)
01-0
2-20
16
02-0
2-20
16
03-0
2-20
16
04-0
2-20
16
05-0
2-20
16
06-0
2-20
16
07-0
2-20
16
08-0
2-20
16
09-0
2-20
16
10-0
2-20
16
11-0
2-20
16
12-0
2-20
16
13-0
2-20
16
14-0
2-20
16
15-0
2-20
16
16-0
2-20
16
17-0
2-20
16
18-0
2-20
16
19-0
2-20
16
20-0
2-20
16
21-0
2-20
16
22-0
2-20
16
23-0
2-20
16
24-0
2-20
16
25-0
2-20
16
26-0
2-20
16
27-0
2-20
16
28-0
2-20
16
29-0
2-20
16
Edited, printed and published by:Rajesh K. Mediratta, Director (B.D.), IEX, on behalf on Indian Energy Exchange from Fourth Floor, Plot No.7 TDI Center, District Centre, Jasola, New Delhi (India) – 110025Tel No.: +91-11-4300 4000 | Fax No.: +91-11-4300 4015 | E-mail: [email protected] | www.iexindia.com | U74999DL2007PLC277039Printed at G.S. Graphic Arts, A-18, Naraina Industrial Area, Phase 1, New Delhi - 110028
Disclaimer: The information featured in this bulletin has been compiled from sources deemed reliable and to the best of our knowledge. Whilst every effort has been made to ensure the accuracy of the information, IEX will not be held responsible for any errors or omissions neither will it be liable for damages nor losses suffered, personal or otherwise, due to the information contained in this bulletin. M
ARC
H 2
016
CONGESTION PROFILE (February 2016)
Pric
e D
i�er
entia
l (`/
kWh)
01-0
2-20
16
02-0
2-20
16
03-0
2-20
16
04-0
2-20
16
05-0
2-20
16
06-0
2-20
16
07-0
2-20
16
08-0
2-20
16
09-0
2-20
16
10-0
2-20
16
11-0
2-20
16
12-0
2-20
16
13-0
2-20
16
14-0
2-20
16
15-0
2-20
16
16-0
2-20
16
17-0
2-20
16
18-0
2-20
16
19-0
2-20
16
20-0
2-20
16
21-0
2-20
16
22-0
2-20
16
23-0
2-20
16
24-0
2-20
16
25-0
2-20
16
26-0
2-20
16
27-0
2-20
16
28-0
2-20
16
29-0
2-20
16
00.20.40.60.8
11.21.41.6
South Import