IES WEBINAR: Q3 ENERGY OUTLOOK, RENEWABLES IN YOUR EMISSIONS REDUCTION STRATEGY
30
WEBINAR SERIES INSIDE ENERGY & SUSTAINABILITY Q3 ENERGY OUTLOOK: RENEWABLES IN YOUR EMISSIONS REDUCTION STRATEGY August 18, 2016
Transcript of IES WEBINAR: Q3 ENERGY OUTLOOK, RENEWABLES IN YOUR EMISSIONS REDUCTION STRATEGY

WEBINAR SERIES INSIDE ENERGY & SUSTAINABILITY
Q3 ENERGY OUTLOOK: RENEWABLES IN YOUR EMISSIONS REDUCTION STRATEGY
August 18, 2016

WELCOMEOUR PRESENTERS
CLAYT TABOR | DISTRIBUTED ENERGY RESOURCE MANAGER
JONATHAN LEE | SENIOR ENERGY MARKET INTELLIGENCE MANAGER

INSIDE ENERGY & SUSTAINABILITY
TODAY’S TOPICS
RENEWABLES Opportunities and risk of leveraging renewables and
attributes within emission reduction strategies
ENERGY MARKET UPDATE: Q3 2016 Natural Gas Production, Storage: Supply rebalancing with demand What a potential La Niña could mean for this upcoming winter
CAPITALIZE ON LOW ENERGY RESOURCES Wholesale natural gas and electricity prices are expected to slowly rise during 2017

INSIDE ENERGY & SUSTAINABILITY
CORPORATE SUSTAINABILITY & EMISSIONS TARGETS
Renewables Landscape Corporate Goals Corporate Sustainability Strategies Procurement Complexities And Risks

INSIDE ENERGY & SUSTAINABILITY
RENEWABLES LANDSCAPE
NV
States and territories with Renewable Portfolio Standards
States and territories with voluntary renewable energy standard or target
States and territories with no standard or target
AS GU MP PR VI
29 states and the District of Columbia, have Renewable Portfolio Standards
Image sources: National Conference of State Legislatures, Energy Sage
2016 2017 2018 2019 2020 2021 2022
30% 30% 30% 30%
26%
22%
10%Permanent 10% for commercial credit
The Extension of the ITC
INSIDE ENERGY & SUSTAINABILITY
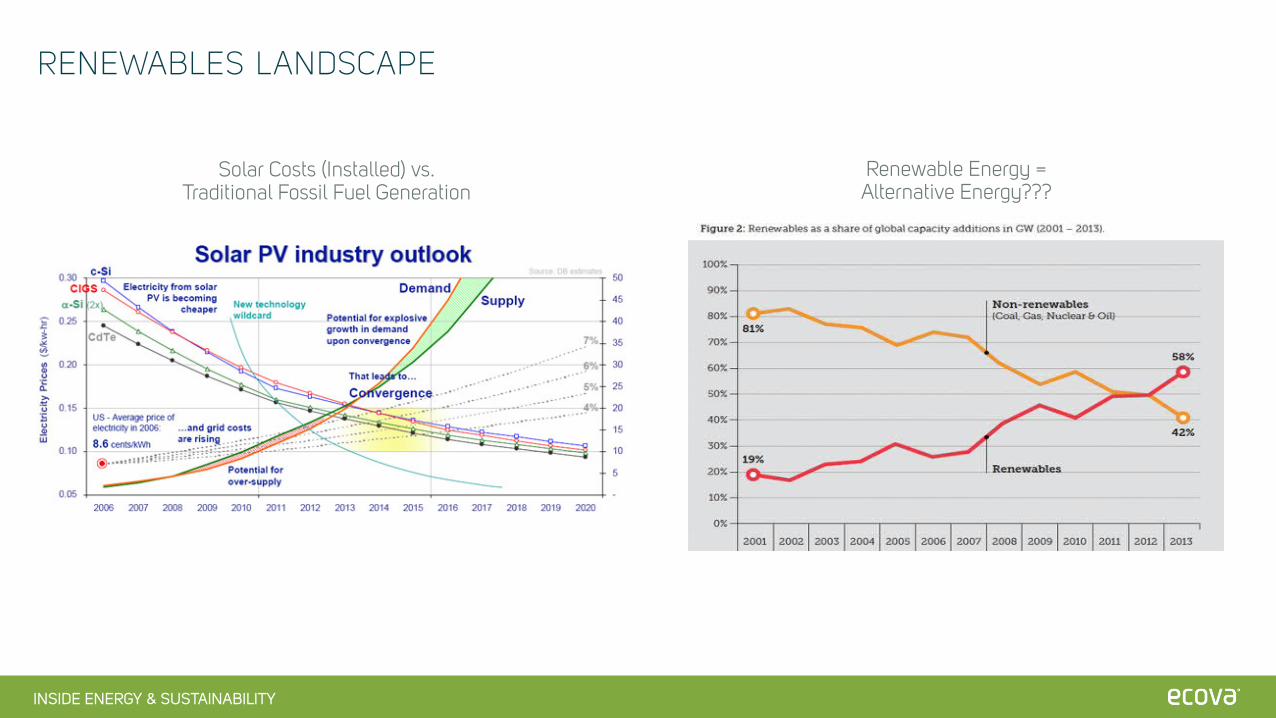
RENEWABLES LANDSCAPE
Solar Costs (Installed) vs. Traditional Fossil Fuel Generation
Renewable Energy = Alternative Energy???
INSIDE ENERGY & SUSTAINABILITY
POLL
INSIDE ENERGY & SUSTAINABILITY
CORPORATE GOALS & PROCUREMENT STRATEGIES
Corporate Goals Renewable Generation: RE100 Emissions Reductions: CDP

INSIDE ENERGY & SUSTAINABILITY
CORPORATE GOALS & PROCUREMENT STRATEGIES
Corporate Goals Renewable Generation: RE100 Emissions Reductions: CDP
Strategies Unbundled Renewable Energy Certifications (RECs) Emission Offsets Utility Green Power Programs / Sleeve Projects (Emerging Option) De-Regulated Renewable Procurement (aka Direct Access) On & Off-Site Generation Community / Shared Solar (Emerging Option) Virtual Power Purchase Agreements (VPPAs)
INSIDE ENERGY & SUSTAINABILITY
PROCUREMENT RISKS
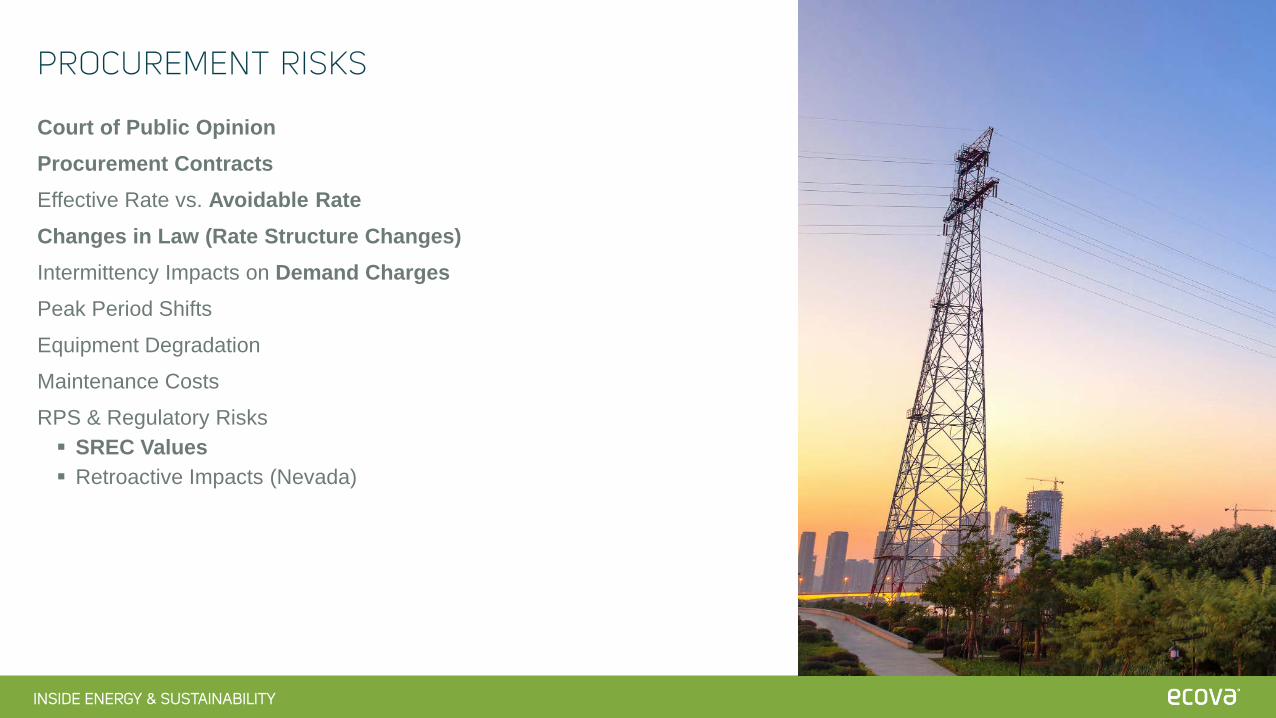
Court of Public OpinionProcurement ContractsEffective Rate vs. Avoidable RateChanges in Law (Rate Structure Changes)Intermittency Impacts on Demand ChargesPeak Period Shifts
Equipment Degradation
Maintenance Costs
RPS & Regulatory Risks SREC Values Retroactive Impacts (Nevada)

INSIDE ENERGY & SUSTAINABILITY
A STRUCTURED APPROACH
Clearly Define Renewable Objectives & Constraints
Analyze Energy Performance, Supply Mix, & Market Dynamics
Develop/Refine Renewable Procurement Strategy
Finalize Opportunity Targets, Procure Assets & Monitor Results

INSIDE ENERGY & SUSTAINABILITY
Q3 2016 ENERGY MARKET UPDATE

INSIDE ENERGY & SUSTAINABILITY
ELECTRIC AND NATURAL GAS MARKET DRIVERS18 August 2016
Bearish – Market Influencers Driving Prices Lower:
Natural Gas Production – Declined from February high, but still in line with last year at this time.
Natural Gas Storage – Storage surplus 12.2% above last year and 15.3% above the 5-year average.
Demand – Industrial and residential/commercial sector demand lower than last year.
Economy – Q2 2016 GDP grew at 1.2% annualized rate.
Coal – Weak coal prices lower baseline electric generation costs.
Bullish – Market Influencers Driving Prices Higher:
Gas-Fired Electric Generation – At record high. Higher natural gas prices would drive electric prices higher.
Weather Forecast – Summer temperaturessupporting wholesale natural gas and electric prices.
LNG – Sabine Pass LNG exporting supplies to global markets.
Mexico Pipeline Exports – Exports up to 3.7 Bcf/day.
ISO Reliability – Retiring coal plants forcing ISO’s to evaluate grid reliability.
Interest Rate Hike – Fed considering another interest rate hike, which would increase the cost of capital and could slow natural gas and oil production.
INSIDE ENERGY & SUSTAINABILITY
$2.00
$4.00
$6.00
$8.00
$10.00
$12.00
$14.00
$/M
MBt
u
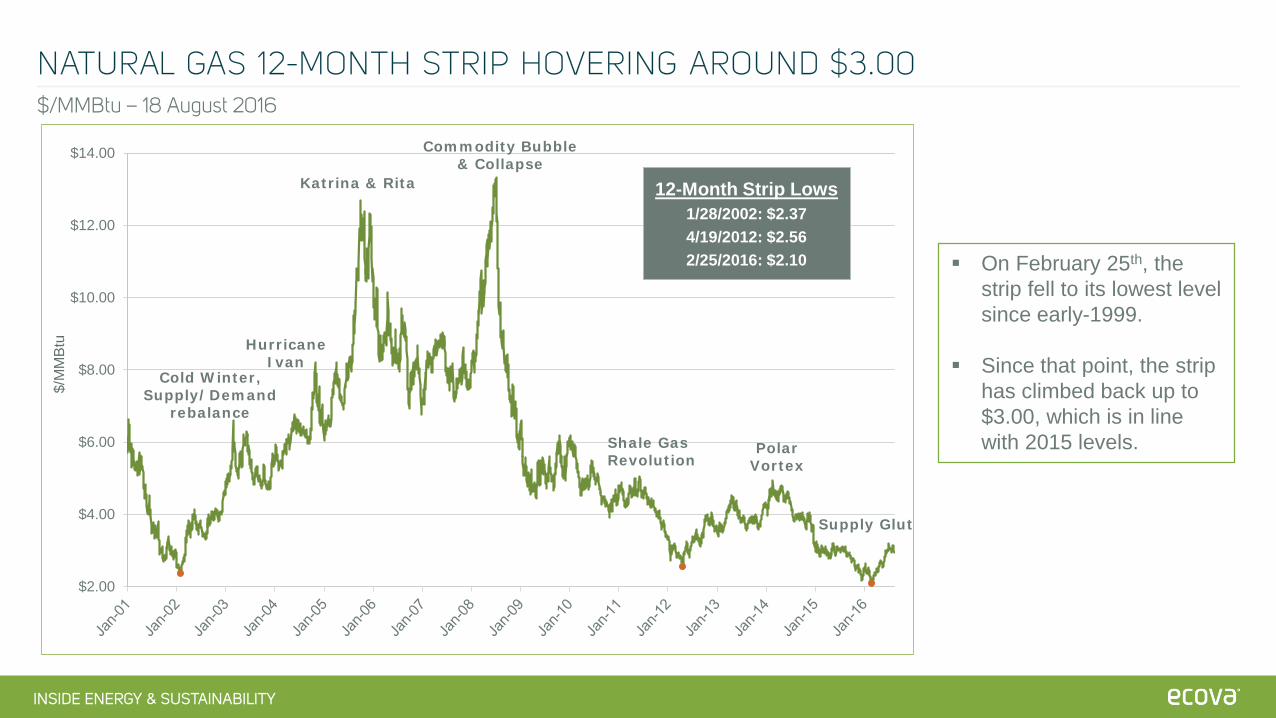
12-Month Strip Lows1/28/2002: $2.374/19/2012: $2.562/25/2016: $2.10 On February 25th, the
strip fell to its lowest level since early-1999.
Since that point, the strip has climbed back up to $3.00, which is in line with 2015 levels.
Katrina & Rita
Polar Vortex
Commodity Bubble & Collapse
Cold Winter, Supply/Demand
rebalance
Shale Gas Revolution
Supply Glut
Hurricane Ivan
NATURAL GAS 12-MONTH STRIP HOVERING AROUND $3.00$/MMBtu – 18 August 2016
INSIDE ENERGY & SUSTAINABILITY
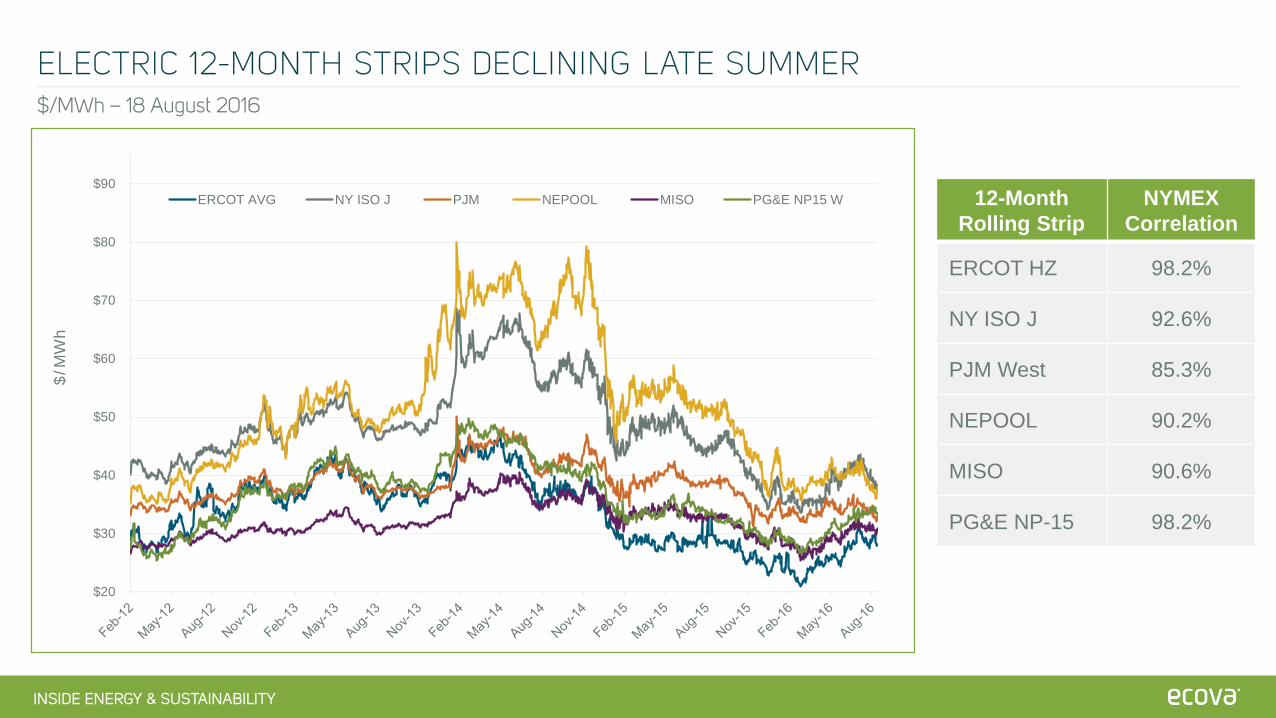
12-MonthRolling Strip
NYMEX Correlation
ERCOT HZ 98.2%
NY ISO J 92.6%
PJM West 85.3%
NEPOOL 90.2%
MISO 90.6%
PG&E NP-15 98.2%
ELECTRIC 12-MONTH STRIPS DECLINING LATE SUMMER$/MWh – 18 August 2016
$20
$30
$40
$50
$60
$70
$80
$90
$/M
Wh
ERCOT AVG NY ISO J PJM NEPOOL MISO PG&E NP15 W
INSIDE ENERGY & SUSTAINABILITY
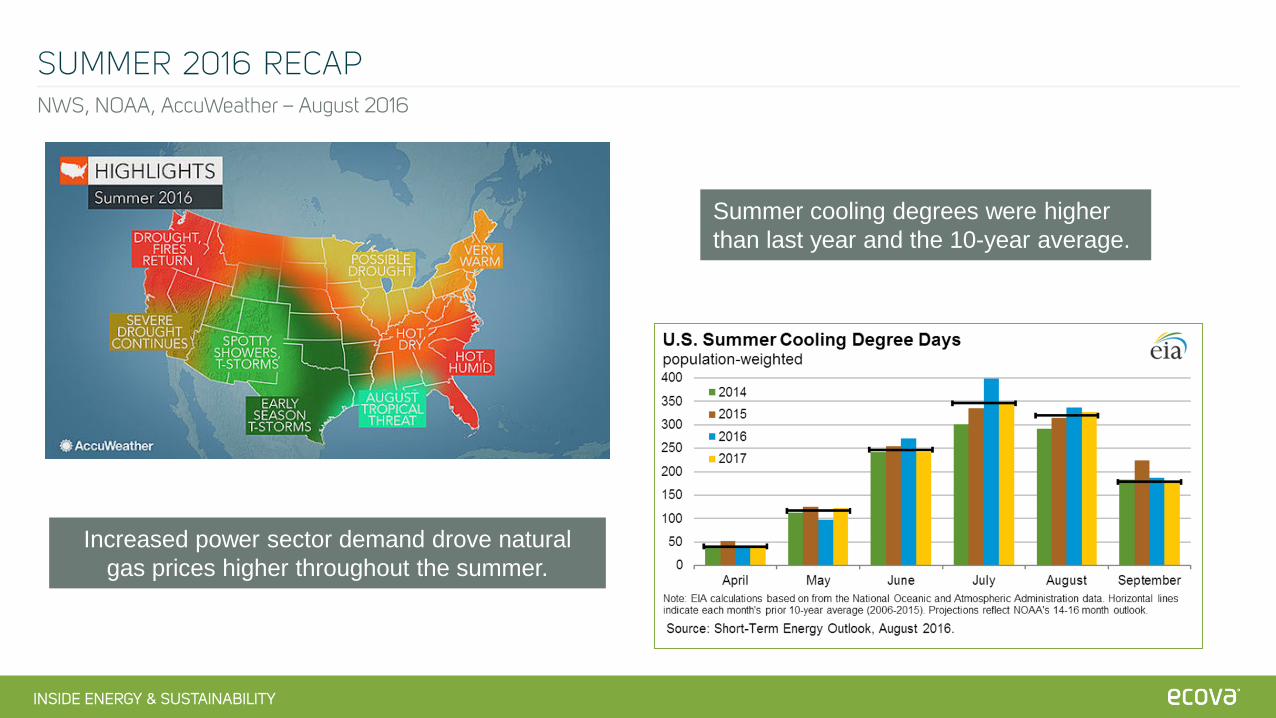
Summer cooling degrees were higher than last year and the 10-year average.
Increased power sector demand drove natural gas prices higher throughout the summer.
SUMMER 2016 RECAPNWS, NOAA, AccuWeather – August 2016
INSIDE ENERGY & SUSTAINABILITY
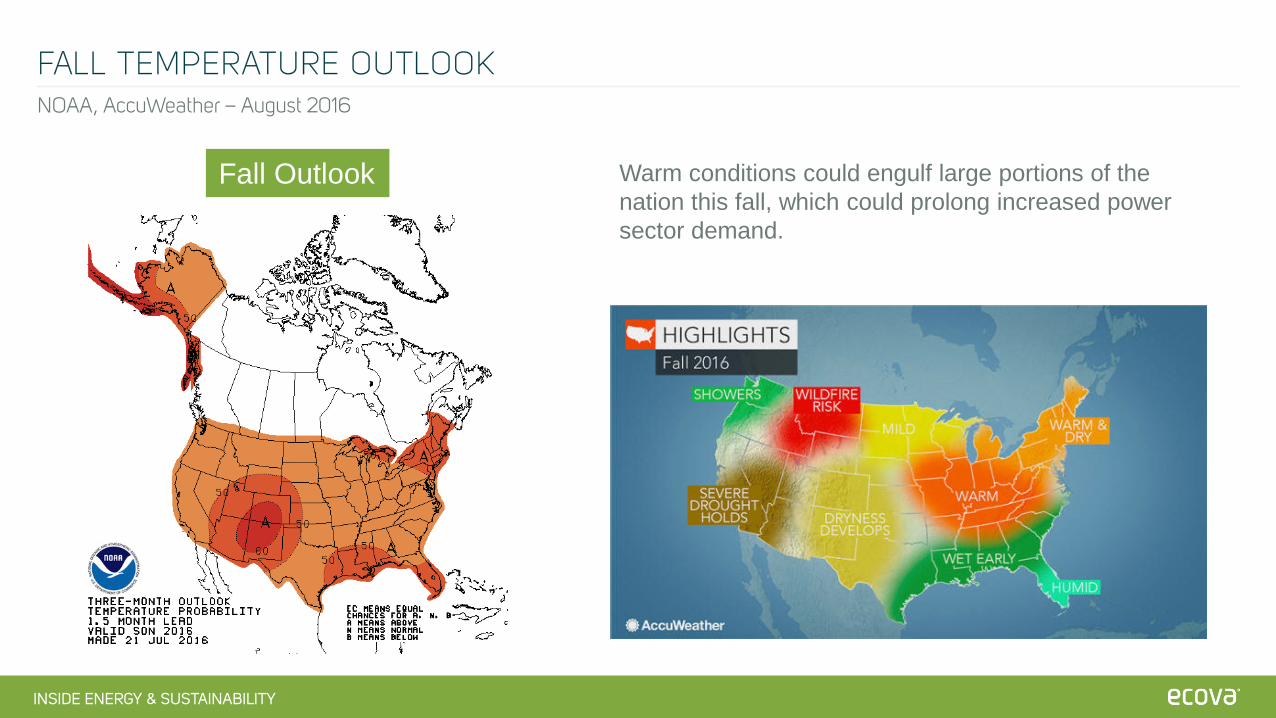
FALL TEMPERATURE OUTLOOKNOAA, AccuWeather – August 2016
Warm conditions could engulf large portions of the nation this fall, which could prolong increased power sector demand.
Fall Outlook
INSIDE ENERGY & SUSTAINABILITY
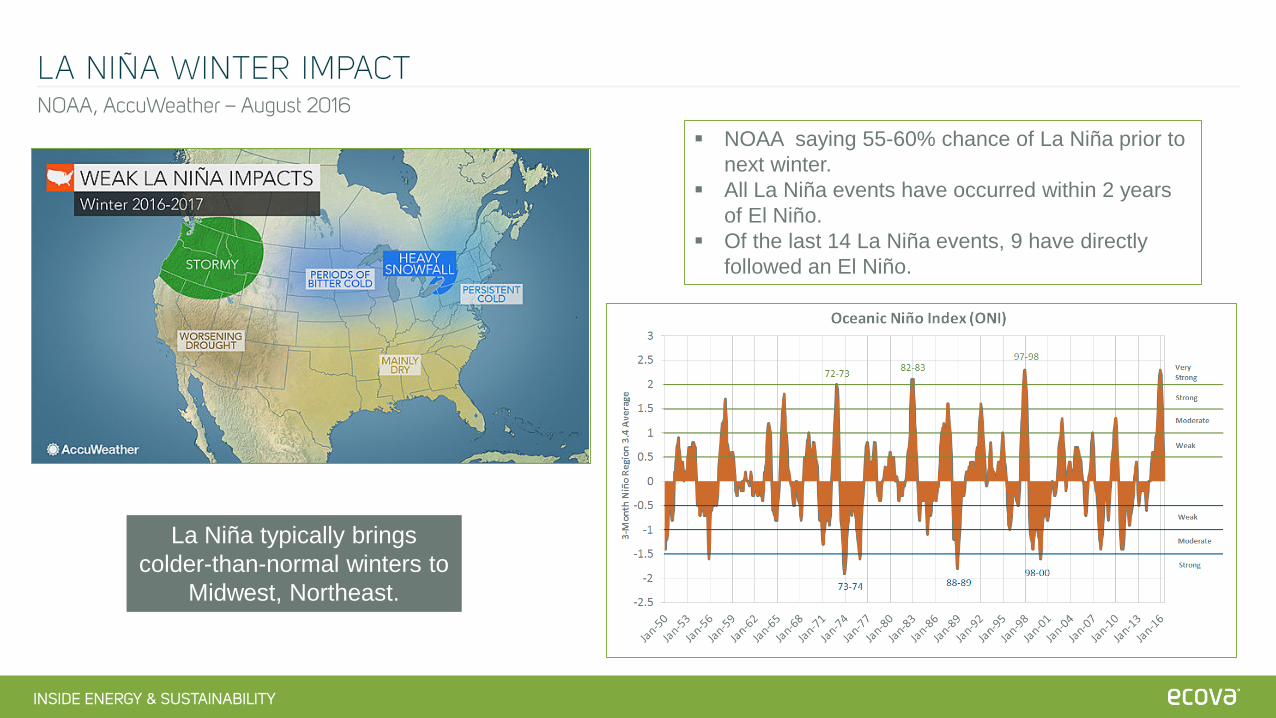
LA NIÑA WINTER IMPACTNOAA, AccuWeather – August 2016
NOAA saying 55-60% chance of La Niña prior to next winter.
All La Niña events have occurred within 2 years of El Niño.
Of the last 14 La Niña events, 9 have directly followed an El Niño.
La Niña typically brings colder-than-normal winters to
Midwest, Northeast.

INSIDE ENERGY & SUSTAINABILITY
Natural gas production peaked in Feb 2016 at 80.1 Bcf/day and bottomed out in May 2016 at 78.1 Bcf/day.
Since May, production has steadily and slowly climbed back to 78.9 Bcf/day.
During 2017, production is expected to climb back above 80 Bcf/day.
NATURAL GAS PRODUCTION STABILIZINGEIA – August 2016
Budget Impact:If demand doesn’t keep pace with rising supply, natural gas prices will weaken.
INSIDE ENERGY & SUSTAINABILITY
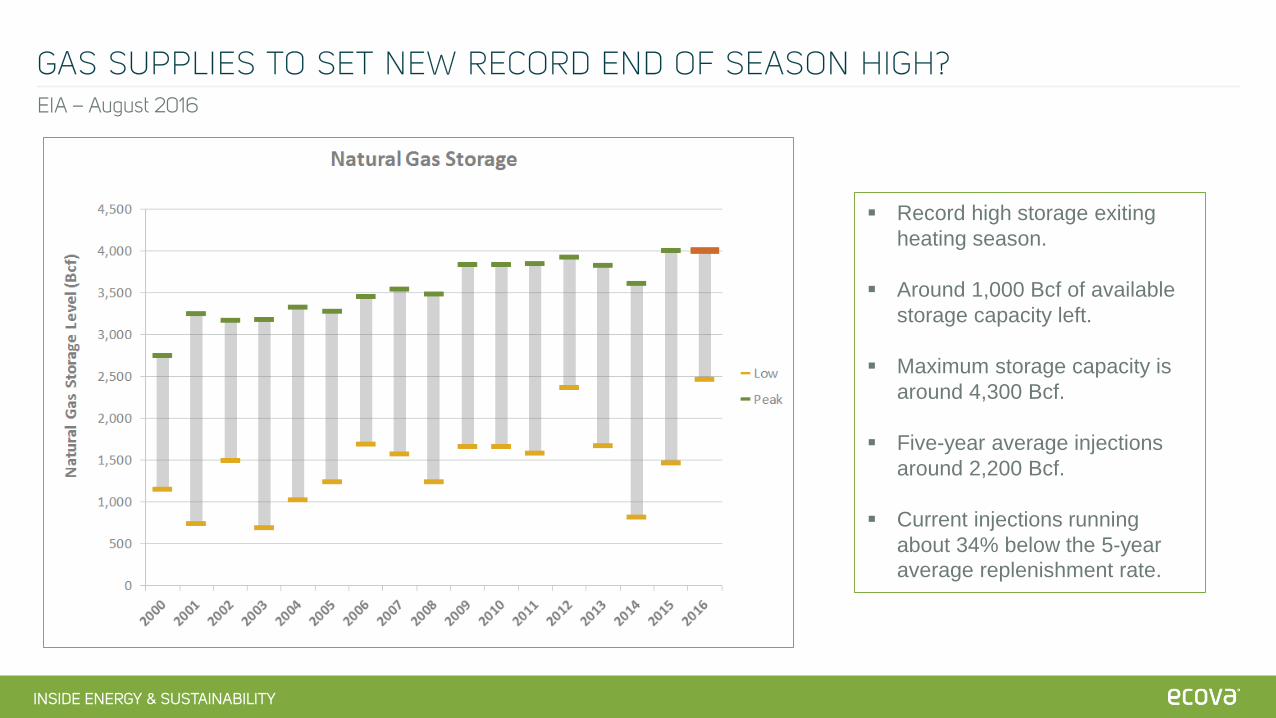
Record high storage exiting heating season.
Around 1,000 Bcf of available storage capacity left.
Maximum storage capacity is around 4,300 Bcf.
Five-year average injections around 2,200 Bcf.
Current injections running about 34% below the 5-year average replenishment rate.
GAS SUPPLIES TO SET NEW RECORD END OF SEASON HIGH?EIA – August 2016
INSIDE ENERGY & SUSTAINABILITY
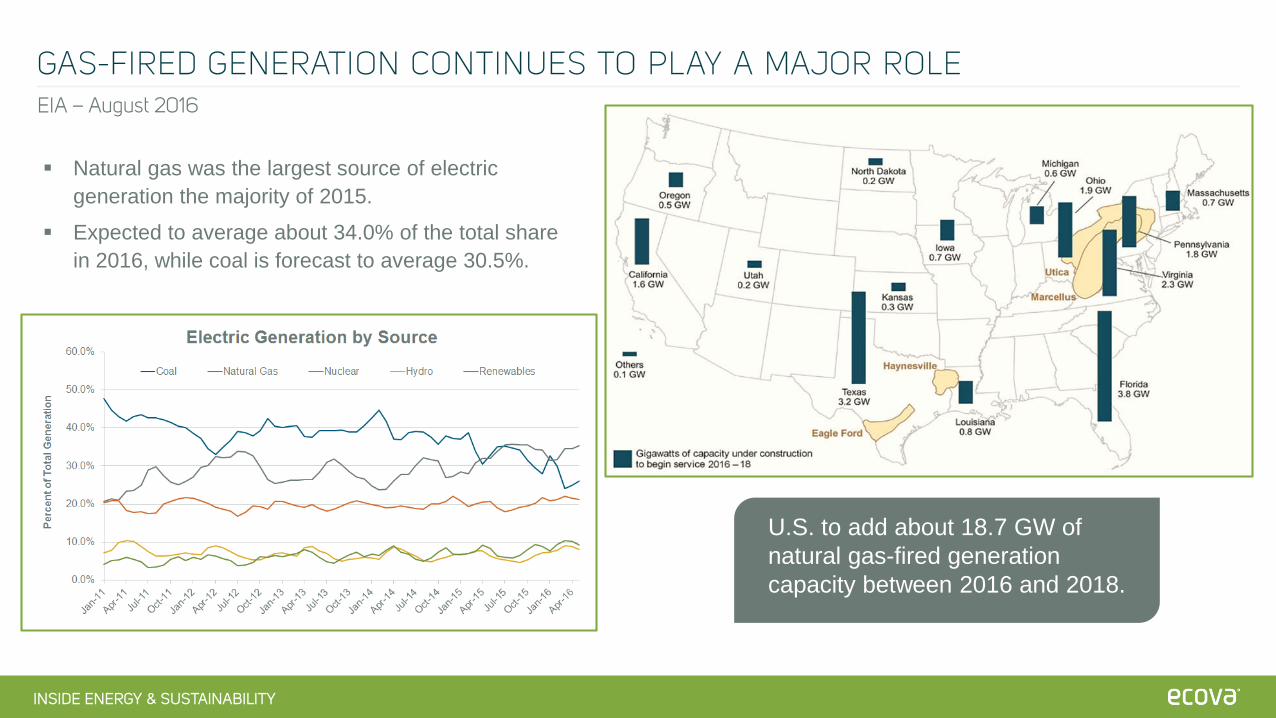
Natural gas was the largest source of electric generation the majority of 2015.
Expected to average about 34.0% of the total share in 2016, while coal is forecast to average 30.5%.
U.S. to add about 18.7 GW of natural gas-fired generation capacity between 2016 and 2018.
GAS-FIRED GENERATION CONTINUES TO PLAY A MAJOR ROLE EIA – August 2016
INSIDE ENERGY & SUSTAINABILITY
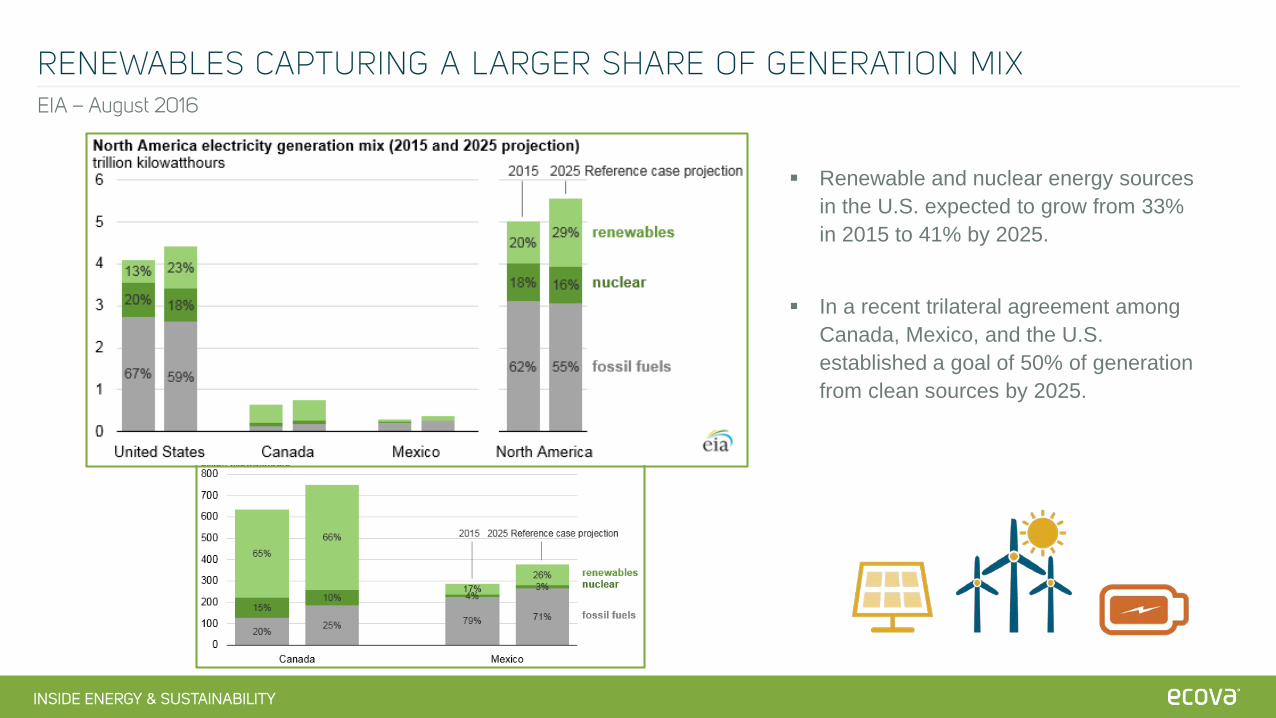
Renewable and nuclear energy sources in the U.S. expected to grow from 33% in 2015 to 41% by 2025.
In a recent trilateral agreement among Canada, Mexico, and the U.S. established a goal of 50% of generation from clean sources by 2025.
RENEWABLES CAPTURING A LARGER SHARE OF GENERATION MIXEIA – August 2016

INSIDE ENERGY & SUSTAINABILITY
NATURAL GAS PIPELINE EXPORTS TO MEXICOEIA, PGJ – August 2016
Midway through 2016, U.S. pipeline exports to Mexico increased substantially.
INSIDE ENERGY & SUSTAINABILITY
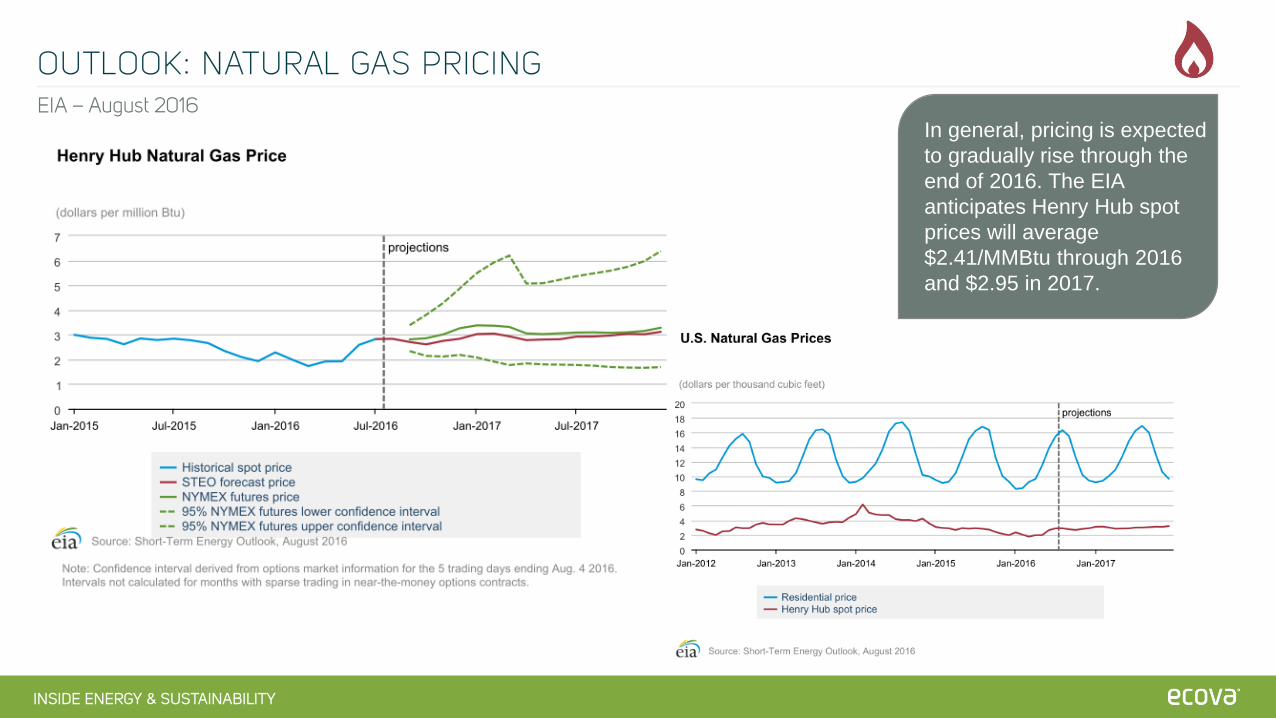
OUTLOOK: NATURAL GAS PRICINGEIA – August 2016
In general, pricing is expected to gradually rise through the end of 2016. The EIA anticipates Henry Hub spot prices will average $2.41/MMBtu through 2016 and $2.95 in 2017.

INSIDE ENERGY & SUSTAINABILITY
OUTLOOK: COMMERCIAL ELECTRIC PRICINGEIA – August 2016
Average 2017 Commercial Rates Compared to 2016:
East North Atlantic: +2.2%Mid-Atlantic: +2.2%New England: +3.9%Pacific: +2.4%South Atlantic: +3.1%South Central: +3.0%
$60
$80
$100
$120
$140
$160
$180
$200
$/M
Wh
East North Central Mid-Atlantic New England Pacific South Atlantic South Central
INSIDE ENERGY & SUSTAINABILITY
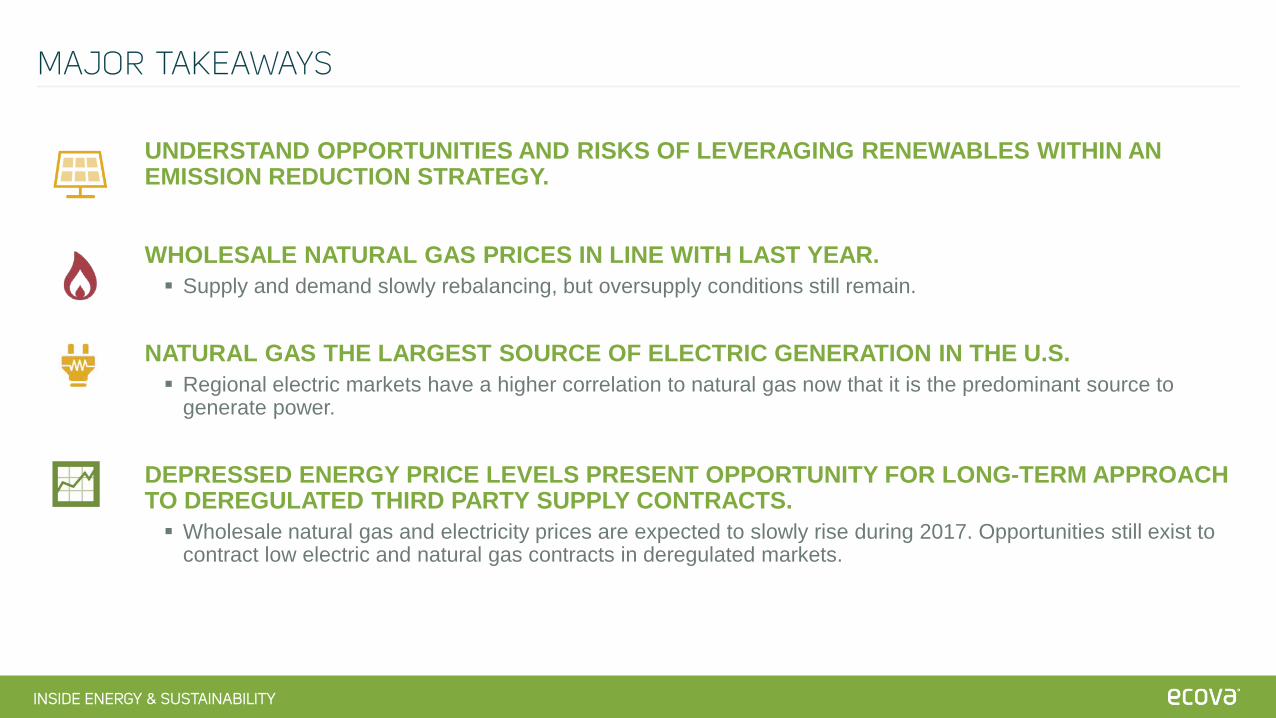
MAJOR TAKEAWAYS
UNDERSTAND OPPORTUNITIES AND RISKS OF LEVERAGING RENEWABLES WITHIN AN EMISSION REDUCTION STRATEGY.
WHOLESALE NATURAL GAS PRICES IN LINE WITH LAST YEAR. Supply and demand slowly rebalancing, but oversupply conditions still remain.
NATURAL GAS THE LARGEST SOURCE OF ELECTRIC GENERATION IN THE U.S. Regional electric markets have a higher correlation to natural gas now that it is the predominant source to
generate power.
DEPRESSED ENERGY PRICE LEVELS PRESENT OPPORTUNITY FOR LONG-TERM APPROACH TO DEREGULATED THIRD PARTY SUPPLY CONTRACTS. Wholesale natural gas and electricity prices are expected to slowly rise during 2017. Opportunities still exist to
contract low electric and natural gas contracts in deregulated markets.
UPCOMING WEBINARS
Questions, comments, suggestions?
INSIDE ENERGY & SUSTAINABILITY Complying with Waste Regulations – Food Waste 301 –
Thursday, September 29th at 11A PST

RELATED RESOURCES
Questions, comments, suggestions?
BLOG POSTS La Nina and Energy Price Increases on the Way? Early Impacts of the Brexit Decision Distributed Energy Resources – A Disruptive Opportunity
NEWSLETTER Energy Market Watch
SOLUTION Distributed Energy Resources
INSIDE ENERGY & SUSTAINABILITY
Q&A

INSIDE ENERGY & SUSTAINABILITY
THANK YOU!