IEPC-93-098 924 PRELIMINARY FAR-FIELD PLUME...
10
IEPC-93-098 924 PRELIMINARY FAR-FIELD PLUME SPUTTERING CHARACTERIZATION OF THE STATIONARY PLASMA THRUSTER (SPT-100) Eric J. Pencil* National Aeronautics and Space Administration Lewis Research Center Cleveland, Ohio 44135 Abstract For electric propulsion devices to be considered for use on communications satellites, integration impacts must be examined in detail Two phenomena of concern associated with highly energetic plumes are contamination via sputtered material from the thruster and sputter erosion of downstream surfaces. In order to characterize the net effect of both phenomena, an array of witness plates were mounted in several types of holders and were exposed to the SPT-100 thruster plume for 50 hours. Surface analysis of the witness plates revealed that in the most energetic regions of the plume, there was a net removal of material from the samples facing the thruster. In the peripheral regions, net deposits were observed and characterized by the changes in opticalproperties of these samples. Changes in surface properties of samples located in collimators were within experimental uncertainty. Nomenclature performance and characterize the plume of the SPT-100 is ongoing at NASA Lewis Research I(.) solar spectral irradiance, W/(cm 2 pm) Center (LeRC). 3 ,4 ,5 R radial distance downstream of thruster, Application of any electric propulsion m device for stationkeeping purposes raises Rs ratio of energy reflected from sample to concerns about the thruster plume impacts on energy incident spacecraft surfaces. Particle impacts by Rs+b measured reflectance or ratio of energy nonpropellant, neutral propellant, and ion beam reflected from sample and plate system effluxes can affect optical, thermal, and surface to energy incident properties. 6 For example, degradation in the Ts ratio of energy transmitted from sample transmittance of translucent solar array cover to energy incident slides would reduce the incident light reaching the a absorptance from 350 to 1200 nm solar cells, thereby lowering the solar array Es infrared emittance of sample performance. Also, increasing absorptance or e angular displacement from thruster decreasing emittance result in higher solar cell centerline, degrees operating temperatures, which degrade solar cell X wavelength, nm performance. p reflectance from 350 to 1200 nm Previous work involving SPT devices Pb infrared reflectance of backing material investigated sputtering characteristics with an Ps infrared reflectance of sample array of samples at a 1.0 meter distance from the p(Q) spectral reflectance thruster exit plane. 7 Many plasma properties, I transmittance from 350 to 1200 nm including mean ion energy were also investigated r(.) spectral transmittance previously at a background pressure of 7 x 10⁻³ Ts infrared transmittance of sample Pa (5 x 10⁻⁵ torr). 7 In that study, the mean ion energy was found to be maximum on the thruster Introduction centerline and to decrease to about 20% of the maximum at 600 off the centerline. Because The Stationary Plasma Thruster (SPT- sputter yield increases with increasing ion energy 100) is manufactured by Fakel Enterprises in for samples at normal incidence, sputtering Kaliningrad, Russia. This device uses an should be highest on centerline and decrease off electrostatic field to accelerate ionized xenon to axis. relatively high exit velocities. Recent interest in Experiments detailed in this report were the application of the SPT-100 to commercial designed to examine degradation of representative communications satellites has resulted from the materials due to SPT-100 plume impingement reported performance levels associated with this and deposition effects at a lower background device. 1. 2 A program to more fully evaluate pressure than was done previously. To quantify * Aerospace Engineer, member AIAA.
Transcript of IEPC-93-098 924 PRELIMINARY FAR-FIELD PLUME...

IEPC-93-098 924
PRELIMINARY FAR-FIELD PLUME SPUTTERING CHARACTERIZATION OF THESTATIONARY PLASMA THRUSTER (SPT-100)
Eric J. Pencil*National Aeronautics and Space Administration
Lewis Research CenterCleveland, Ohio 44135
Abstract
For electric propulsion devices to be considered for use on communications satellites, integrationimpacts must be examined in detail Two phenomena of concern associated with highly energetic plumesare contamination via sputtered material from the thruster and sputter erosion of downstream surfaces. Inorder to characterize the net effect of both phenomena, an array of witness plates were mounted in severaltypes of holders and were exposed to the SPT-100 thruster plume for 50 hours. Surface analysis of thewitness plates revealed that in the most energetic regions of the plume, there was a net removal of materialfrom the samples facing the thruster. In the peripheral regions, net deposits were observed and characterizedby the changes in optical properties of these samples. Changes in surface properties of samples located incollimators were within experimental uncertainty.
Nomenclature performance and characterize the plume of theSPT-100 is ongoing at NASA Lewis Research
I(.) solar spectral irradiance, W/(cm2 pm) Center (LeRC).3 ,4 ,5
R radial distance downstream of thruster, Application of any electric propulsionm device for stationkeeping purposes raises
Rs ratio of energy reflected from sample to concerns about the thruster plume impacts onenergy incident spacecraft surfaces. Particle impacts by
Rs+b measured reflectance or ratio of energy nonpropellant, neutral propellant, and ion beamreflected from sample and plate system effluxes can affect optical, thermal, and surfaceto energy incident properties. 6 For example, degradation in the
Ts ratio of energy transmitted from sample transmittance of translucent solar array coverto energy incident slides would reduce the incident light reaching the
a absorptance from 350 to 1200 nm solar cells, thereby lowering the solar arrayEs infrared emittance of sample performance. Also, increasing absorptance ore angular displacement from thruster decreasing emittance result in higher solar cell
centerline, degrees operating temperatures, which degrade solar cellX wavelength, nm performance.
p reflectance from 350 to 1200 nm Previous work involving SPT devices
Pb infrared reflectance of backing material investigated sputtering characteristics with an
Ps infrared reflectance of sample array of samples at a 1.0 meter distance from the
p(Q) spectral reflectance thruster exit plane.7 Many plasma properties,I transmittance from 350 to 1200 nm including mean ion energy were also investigatedr(.) spectral transmittance previously at a background pressure of 7 x 10⁻³Ts infrared transmittance of sample Pa (5 x 10⁻⁵ torr).7 In that study, the mean ion
energy was found to be maximum on the thrusterIntroduction centerline and to decrease to about 20% of the
maximum at 600 off the centerline. BecauseThe Stationary Plasma Thruster (SPT- sputter yield increases with increasing ion energy
100) is manufactured by Fakel Enterprises in for samples at normal incidence, sputteringKaliningrad, Russia. This device uses an should be highest on centerline and decrease offelectrostatic field to accelerate ionized xenon to axis.relatively high exit velocities. Recent interest in Experiments detailed in this report werethe application of the SPT-100 to commercial designed to examine degradation of representativecommunications satellites has resulted from the materials due to SPT-100 plume impingementreported performance levels associated with this and deposition effects at a lower backgrounddevice. 1. 2 A program to more fully evaluate pressure than was done previously. To quantify
* Aerospace Engineer, member AIAA.
925 IEPC-93-098
sputtering effects, an array of quartz slides were plume electrical characterization reported in detailpositioned 2 m from the thruster exit plane. elsewhere.4 Exposed cover slides and collimatorsBoth exposed witness plates and samples in were located at 150 increments along the arc ofcollimators were used. The surface analyses used the rake. Two exposed cover slides were locatedto characterize sputtering impacts included at each position. The vector normal to eachmeasurement of the change in sample mass. sample pointed directly to the center of theOptical and thermal properties measured were thruster exit, such that the incident flow wastransmittance, absorptance, and emittance. approximately normal to all sample surfaces.
The exposed surface of one sample faced towardsApparatus and Proceduw the thruster, while the other faced away from the
thruster. The two samples will be referred to inVacuum Facility this report as front exposed and back exposed,
All experimental testing was performed respectively.in the 4.6 m diameter by 19.5 m long, stainless The thruster was operated with a powersteel, vacuum facility shown in Figure 1. This processing unit developed at LeRC and describedfacility had both diffusion pump and cryopump elsewhere. 10 For the tests described in thiscapabilities. The cryopumping system included report, the samples were exposed for 50 hours toone gaseous helium panel surrounded by two the thruster operating under conditions listed innitrogen panels. In order to minimize possible Table I.contamination by backstreaming diffusion pumpoil, only the cryopump system was used. This Surface Analyses Instrumentation and Proceduresystem maintained an ambient pressure at the All masses in this report were measuredthruster of 7 x 10⁻⁴ Pa (5 x 10⁻⁶ torr) during with an electronic balance. Mass measurementsthruster operation at a xenon flow rate of 5.4 were taken both before and after the 50 hourmg/s. exposure. Repeatability was found to be ± 0.2
mg. The balance was enclosed in a plastic hoodDiagnostics to prevent air circulation from affecting the
Quartz samples have been used readings.previously in determining sputtering effects on Both transmittance and reflectance weresolar cell cover slides. 8, 9 For this study, 2 cm x measured with a spectrophotometer. This device2 cm x 0.08 cm quartz slides were selected as test contained a 60 mm barium sulfate coatedsamples for the analysis of sputter degradation. integrating sphere used to compare the incidentThe optically polished quartz samples had an light intensity to the intensity of the light eitherRMS surface finish of 50 angstroms. transmitted through or reflected from a sample.
Masks of tantalum foil were used to The transmittance of each sample was measuredcover portions of the exposed quartz slides as directly, while the reported absorptance wasshown in Figure 2. The back of each quartz slide calculated from the measured transmittance andwas also covered with foil to prevent reflectance. The measurement of the reflectancecontamination of the this surface. of a translucent material is sensitive to how the
The collimators used a small aperture to measurement is taken. The total reflectance of alimit the incident influx to the ion beam, as translucent material is dependent on sampleshown in Figure 3. The collimator diameter and transmittance as well as the sample backinglength were 5 cm and 20 cm, respectively. The reflectance. The reflectance measurement ofaperture in the cap facing the thruster was 3 mm translucent materials requires the use of a samplein diameter. The quartz slide was positioned backing which functions as a light trap, so thatalong the collimator centerline by a tantalum foil back reflectance is negligible. Due to the largepocket number of samples, control samples were used as
the baseline for the post-exposure measurements.Test Configuration The spectral response for all samples was
The Russian SPT-100 was mounted on measured from 350 to 1200 nm. Samplea fixed stand and oriented coaxially with the variance was determined to be 0.0013 from the
vacuum facility. The distance from the thruster transmittance measurements of 10 controlexit to a graphite-coated aluminum louver samples.structure, shown in Figure 1, was about 8 m. The emittance of the samples wasAn array of collimators and exposed cover slides measured using an infrared reflectometer. Thiswere mounted on a rake at a radial distance of 2 device measured the total room temperaturem from the thruster exit as shown in Figure 4. emittance in the infrared spectrum using dualThis test was conducted simultaneously with a rotating cavities that sample radiation against a
2

IEPC-93-098 926
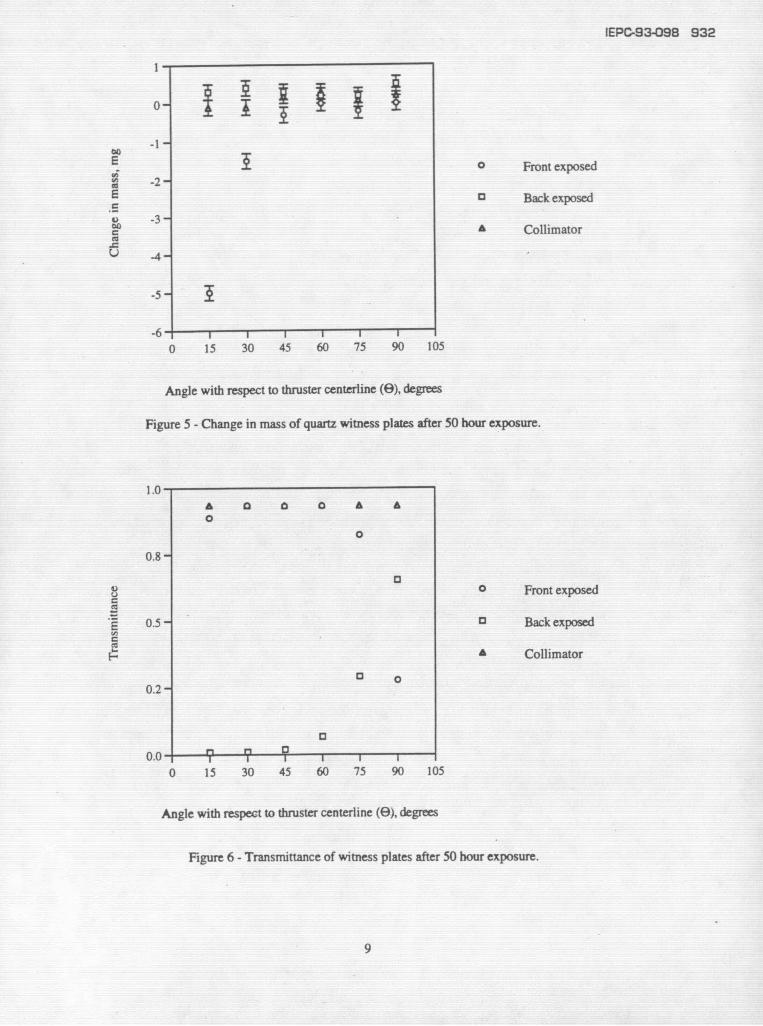
room temperature blackbody. For this did not change significantly from that of theinstrument, two different backings, with known baseline 0.93. In the region of 600° 9 < 900, ainfrared reflectance, were used to take two measurable change in sample transmittancedifferent reflectance measurements. Sample occurred, with the transmittance decreasing forreflectance and transmittance were iteratively increasing 0. As shown in Figure 6, thedetermined by solving the two resulting degradation of transmittance for the back exposedsimultaneous equations. Due to the large samples, due to tank wall material, decreased fornumber of samples, control samples were used as the entire array of samples with the maximumthe baseline for post-exposure measurements, decrease occurring near the centerline. NoSample variance was determined to be 0.003 significant change in transmittance was measuredfrom the emittance measurements of 10 control for any of the collimator cover slides.samples.
AbsorptanceResSl The spectral reflectance was
approximately 0.07 for the unexposed controlSampl Mass samples. Using a trapezoidal integration
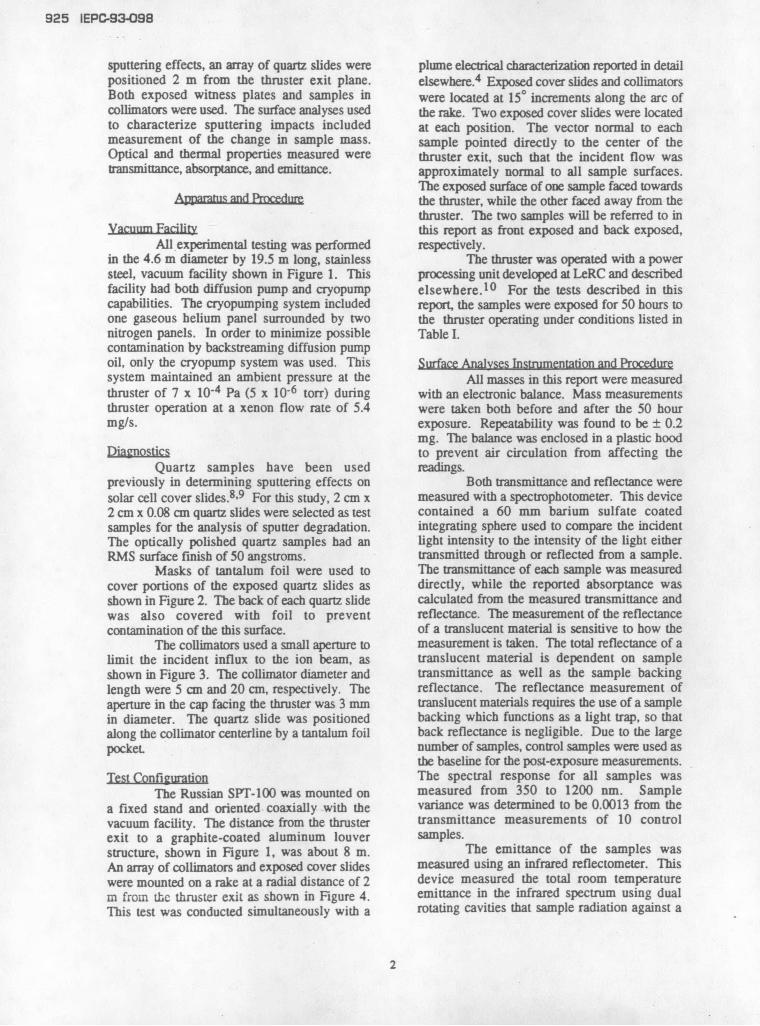
Figure 5 shows the change in mass of technique, the reflectance was calculated as:each sample resulting from the 50 hour exposure.For the front exposed samples there were two o0.p(X)I()dk (2)distinguishable regions of interest. In the region P = Iwhere 150 < 6 ) 450, there was a measurableloss in the mass of the samples. In the region Absorptance for a translucent materialwhere 600 5 9 < 900, the changes in mass were was then calculated from reflectance andwithin the uncertainty of the measurement, transmittance as:Most back exposed cover slides experienced ameasurable net deposition. The exceptions were a = 1- T - p (3)the slides at 8 = 600 and 750, whose weightsremained the same. However, no consistent Figure 7 shows the absorptance of thetrends existed with respect to e for the back samples after the 50 hour exposure to the thrusterexposed samples. No significant changes in plume. Uncertainty bars for this measurementmass were observed with the collimator samples. were again smaller than the plot symbols.
Typical absorptance for unexposed controlTransmittance samples was approximately 0.0. The
Spectral transmittance was measured absorptance of the sample at E = 150 had anover a wavelength range of 350 nm to 1200 nm. artificial increase in absorptance due the poorThe spectral transmittance was approximately transmittance measurement described earlier. No0.93 for the unexposed control samples. The measurable change in absorptance was observedtransmittance of the samples was calculated via in the front exposed samples between 300 < 6 5equation 1 using a trapezoidal integration 600. In the region for 600 5 E < 900, atechnique. measurable change in the absorptance was
Mo observed, with the absorptance increased with1t= ()( (1) increasing 0. A measureable increase in
IonI(X)dk absorptance occurred for all back exposedsamples, with the change in absorptance
Figure 6 shows the total transmittance increasing with increasing e. Changes in theas a function of angular displacement from the absorptance of the samples located in thethruster centerline. It should be noted that the collimators were within experimentaluncertainty bars for transmittance were smaller uncertainty.than the plot symbols used in Figure 6. In the An accuracy limitation of thecase of the front exposed sample at e = 150, spectrophotometer was discovered by thesome tantalum foil had inadvertently pulled away consistent measurement of negative absorptancesfrom the back of the witness plate, thereby for translucent materials. Measurements of theunmasking portions of the back surface. Because control samples, the collimator samples, and thethe transmittance was measured over front exposed samples for 30° 0 O 60°, showedapproximately 1 cm2 area of the sample, an that all had slightly negative absorptances. Thisaccurate measurement was not possible for this systematic error was likely due to anspecimen. The transmittance for the front overestimated reflectance. The reflectance of theexposed samples in the region of 300° 6 5 600 backing material, functioning as a light trap, was
3

927 IEPC-93-098
found to be approximately 0.003 when integrated Discussion of the Resultsfrom 350 to 1200 nm. With this correction theabsorptance of these samples fell within random Front exosed samplesexperimental uncertainty of the baseline of 0.0 In the region between 150° < < 45°,rather than -0.003. net erosion occurred, based on the mass losses in
Figure 5. Sample erosion varied significantlyEmi e with angle. The mass loss of the quartz slide at
The reflectance of a translucent sample 450 was about 7% of the erosion at 150 withwith an opaque backing was related to the sample respect to the thruster centerline. All otherand backin properties by the following set of changes in properties were within experimentalequations: uncertainty. This leads to two conclusions.
p 2 First, the cleaning action of the higher energyR.b = R, + Pb' (4) ions in this region 7 removed any tank wall
1-PbR, material that was deposited. Second, thetransmittance, absorptance, and emittance of the
(1- p,) ,(2 samples did not decrease even though materialR, . 1 + - 2) was being eroded from the surface. This was not
(1-. p.J unexpected as previous work has shown that2 quartz samples, when exposed to a 3 keV
T 1-p) mercury ion flux, had negligible change in( - pl2 2 absorptance or emittance. 14
For the sample at E = 600, all changesin sample properties were within experimental
By measuring the reflectance with two different r o.backings, both the sample transmittance and For the samles the region where 75reflectance were obtained iteratively. It was 5 e e5 90 , change in transmittance andfound that typical transmittance for the absorptance indicated that a net deposit of thrusterunexposed control samples were 7 - 8%, which material and/or tank wall material occurred. Theagreed with a typical quartz transmittance of 0.1 change in both the sample mass and emittance
at 4 pm. 12 The sample reflectance was measured were within experimental uncertainty. The
using a backing material with a low infrared change in transmittance and absorptance increasedreflectance of 0.089. Since the samples were as the angle relative to the thruster centerline
nearly opaque, the infrared emittance was increased. This observed trend can be explained
approximated by the following equation by the combination of two effects. The samplesin the peripheral regions viewed larger sources of
a = 1- p ( sputtered efflux from the downstream regions ofS * the vacuum facility. Also, the lower mean ion
Typical emittances for the unexposed control energy in the peripheral regions of the plumesamples were 0.82, which compared to the total resulted in lower sputter yields. Sputter yields
emittance of quartz of 0.9.13 approach zero for ion energies below 50 eV. 15
Figure 8 shows the angular distribution This lower sputter yield resulted in less material
of the infrared emittance of the samples after the being removed from these samples. It should be
50 hour exposure. Uncertainty bars for this noted that the deposition effects in space should
figure were smaller than the plot symbols. The be very different because there would be no
emittance of all the front exposed samples did not contaminating facility material.
change within the experimental uncertainty. For smthe back exposed samples in the region of 15°5 apse sames9 < 450, there were measurable decreases in For the samples in the region where 15
emittance, with the maximum change occurring d e 45 , all measurements indicated that a netclosest to the centerline. For the back exposed deposit of tank material occurred. There were nosamples in the region of 600° < e 900, the consistent trends for the mass and transmittancechanges in emittance were within experimental measurements as a function of e in this region.uncertainty. None of the collimator samples The largest changes in absorptance and emittanceexperienced a measurable change in emittance occurred closer to the thruster centerline. Thiswithin experimental uncertainty trend indicated that the optical densities of films
within experimental uncertaintysputtered from the facility were significantlyhigher in this region.
4

IEPC-930498 928
For the samples in the region where 600 centerline incurred the largest change in optical< < 900, the change in transmittance and properties, due to sputtered efflux from theabsorptance indicated that a net deposition of tank facility. No measurable changes in surfacewall material occurred. The changes decreased properties occurred for the collimator samples.with increasing e, which was a continuation of In order to obtain measurable results withthe trend from the centerline. The changes in collimator samples, future tests will requiremass and emittance for these samples were increased exposure time and/or aperture diameter,within experimental error. and/or reduced radial distance. These preliminary
experiments will help define detailed requirementsCollimator samples for more extensive tests which will assess plume
No measurable change in any sample impacts on spactraft materials located
property occurred with any collimator sample. downstream of electric thrusters.Collimator samples were exposed to a limitedinflux from the thruster by the small aperture. ReferencesThe ratio of aperture area to exposed cover slidearea was about 1:40. Thus the expected 1. Bober, A.S., et al., "State of Work ondeposition would be a fraction of that measured Electrical Thrusters in USSR," Proceedings ofon the front exposed slides which would be the 22nd International Electric Propulsionwithin the measurement experimental Conference. Viareggio, Italy, October 1991.uncertainty. In order to obtain measurable resultswith collimator samples, it will be necessary to 2. Brophy, J.R., et al., "Performance of theincrease the aperture diameter and/or exposure Stationary Plasma Thruster. SPT-100," AIAAtimes, and/or reduce radial distance from the 92-3155, July 1992.samples to the thruster.
3. Sankovic, J.M., Hamley, J.A., and Haag,Conclusions T.W., "Performance Evaluation of the Russian
SPT-100 Thruster at NASA LeRC," IEPC 93-In order to assess the impacts of the 094, Proceedings of the 23rd International
SPT-100 sputtering on spacecraft subsystems, an Electric Propulsion Conference. September 1993,array of quartz witness plates was positioned at a to be published.radial distance of 2 meters downstream of thethruster exit plane and exposed to the thruster 4. Myers, R.M. and Manzella, D.H.,plume for 50 hours. Several sputtering "Stationary Plasma Thruster Plumephenomena were investigated simultaneously. Characteristics," IEPC 93-096, Proceedings ofThese included sputtering of material from the the 23rd International Electric Propulsionthruster to the witness plates, sputtering of Conference. September 1993, to be published.material from the tank wall to the witness plates,and sputtering of material from the witness 5. Manzella, D.H., "Stationary Plasma Thrusterplates. Both front and back exposed slides and Plume Emissions," IEPC 93-097, Proceeding ofquartz samples mounted in collimators were used the 23rd International Electric Propulsionin this experiment. Collimation was chosen to e3rdnte t Eectr Polsieliminate sample contamination by backsputtered Conference. September 1993, to be published.material from the facility. The net erosion or netdeposition was examined by measuring the 6. Byers, D.C., "Electron Bombardment
change in mass of the samples. Changes in Thruster Field and Particle Interfaces," Jounal ofthermal and optical properties (transmittance, Spacecraft and Rockets. Vol. 16, No. 5, pp 289-absorptance, and emittance) were also measured 301, September-October, 1979.to determine the impact of contamination on theperformance of a solar array. General trends 7. Absalamov, S.K., et al., "Measurement ofcommon to most measurements were the net Plasma Parameters in the Stationary Plasmadeposit of materials in the peripheral regions of Thruster (SPT-100) Plume and Its Effect onthe plume for samples facing towards the Spacecraft Components," AIAA 92-3156, Julythruster, either characterized by increasing mass 1992.or changes in optical properties. The sampleslocated at angles closer to the centerline than 60 8. Reynolds, T.W. and Richley, E.A.,degrees were apparently not contaminated by wall "Contamination of Spacecraft Surfacesmaterial due to cleaning by the ion beam. The Downstream of a Kaufman Thruster," NASA TNback exposed samples nearest the thruster D-7038, January 1971.
5

929 IEPC-93-098
12. Smith, WJ., Modern Optical Engineering.9. Weigand, AJ. and Mirtich, M.J., "Change in The Design of Optical Systems. McGraw-HillTransmittance of Fused Silica as a Means of Book Co., New York, 1966.Detecting Material Sputtered from Componentson a 5-cm Ion Thruster," NASA TMX-68073. 13. Holman, J.P., Heat Transfer. Sixth Edition,May 1972. McGraw-Hill Book Co., New York, 1986.
10. Hamley, J.A., Hill, G., and Sankovic, J.M., 14. Hall, D.F. and Kelley, LR., "Experimental"Power Electronics Development for the SPT- Techniques to Determine Electrostatic Rocket100 Thruster," IEPC-93-044, Proceedins of the Exhaust Effects on Spacecraft Surfaces," AIAA23rd International Electric Propulsion 70-1144, September 1970.Conference. September 1993, to be published.
15. Rosenburg, D. and Wehner, G.K.,11. Siegel, R. and Howell, J.R., Thermal "Sputtering Yields for Low Energy IonRadiation Heat Transfer, Second Edition, Bombardment," Journal of Applied Physics. Vol.
Hemisphere Publishing Corp., New York, 1981. 33, No. 5, pp 1842-1845, May 1962.
Table I - SPT-100 operating conditions.
Discharge voltage 300 VDischarge current 4.5 A
Xenon total mass flow rate 5.4 mg/sRatio of anode to cathode mass flow rates 19
6

I IEPC-93-098 930
Figure 1 - View of 4.6 m diameter vacuum facility with experimental setup.
Quartz witness plate Front witness plateQuarz witness plate B
Back witness plate
Tanutalum foil mask
Tantalum coated stainless steel rod
Figure 2 - Schematic of exposed cover slide holder.
7

1931 IEPC-93-098
Quartz witness plate
Aperature (D= 3 mm) Tantalum foil sleeve
\ Rear endcap
STantalum foil mask Masked witness plateMolybdenum front end cap
Figure 3 - Schematic of collimator and sample holder.
SPT-100R=2m
i N / - - - \-- -
/ / \\
e eProbe rake
Center axis
Collimator locatioaExposed mple locatio 0
Figure 4 - Schematic of far-field plume probe locations, top view of facility.
8
IEPC-93-098 932
-1E . o Front exposedU -2-E a Back exposed
o -3A Collimator
5 U -4
-5 -
-60 15 30 45 60 75 90 105
Angle with respect to thruster centerline (9), degrees
Figure 5 - Change in mass of quartz witness plates after 50 hour exposure.
1.0A a 0 0 A A0
0
0.8
0o Front exposed
E 0.5- Back exposed
SA Collimator
o o0.2
0.00.0- -- ? - 1? -- -- I -- -- I -0 15 30 45 60 75 90 105
Angle with respect to thruster centerline (9), degrees
Figure 6 - Transmittance of witness plates after 50 hour exposure.
9

933 IEPC-93-098
0.8
0 Front exposed
S0.4 a Back exposedI 0
< A Collimator0.2- a
00
0- A 0 0 0 A A
-0.2 - I0 15 30 45 60 75 90 105
Angle with respect to thruster centerline (9), degrees
Figure 7 - Absorptance of witness plates after 50 hour exposure.
1.00
0.90-
0 o a a 0 B o Frontexposed0.80 -
E a Back exposed
0.70 - A Collimator
0.60-
0.50- i i i I I0 15 30 45 60 75 90 105
Angle with respect to thruster centerline (e), degrees
Figure 8 - Infrared emittance, at 25 0C, of witness plates after 50 hour exposure.
10