IEEE TRANSACTIONS ON INDUSTRIAL ELECTRONICS …ieeeprojectsmadurai.com/2015-16 IEEE PAPERS... · ...
12
0278-0046 (c) 2013 IEEE. Personal use is permitted, but republication/redistribution requires IEEE permission. See http://www.ieee.org/publications_standards/publications/rights/index.html for more information. This article has been accepted for publication in a future issue of this journal, but has not been fully edited. Content may change prior to final publication. Citation information: DOI 10.1109/TIE.2014.2379586, IEEE Transactions on Industrial Electronics IEEE TRANSACTIONS ON INDUSTRIAL ELECTRONICS 1 Design and Implementation of Smart Home Control Systems Based on Wireless Sensor Networks and Power Line Communications Mingfu Li, Hung-Ju Lin Abstract—Wireless sensor networks (WSNs) and power line communications (PLCs) are used in this work to implement a smart home control network. The goals are to reduce the impact of wireless interference on a smart home control network and unnecessary energy consumption of a smart home. An isolated WSN with one coordinator, which is integrated into the PLC transceiver, is established in each room. The coordinator is responsible for transferring environmental parameters obtained by WSNs to the management station via PLCs. The control messages for home appliances are directly transferred using PLCs rather than WSNs. According to experimental results, the impact of wireless interference on the proposed smart home control network is substantially mitigated. Additionally, a smart control algorithm for lighting systems and an analysis of illumination of a fluorescent lamp were presented. The energy saving of lighting systems relative to those without smart control was evaluated. Numerical results indicate that the electricity consumption on a sunny or cloudy day can be reduced by at least 40% under the smart control. Moreover, a prototype for the proposed smart home control network with the smart control algorithm was implemented. Experimental tests demonstrate that the proposed system for smart home control networks is practically feasible and performs well. Index Terms—Appliance control, energy saving, power line communications, smart homes, smart lighting control, wireless sensor networks. I. I NTRODUCTION N UMEROUS studies [1]–[3] have shown that smart homes or intelligent buildings can use energy more efficiently than traditional buildings. Thus, several researchers have advo- cated building smart homes for reducing energy consumption. Almost proposed smart home architectures in the literature adopt the WSN (Wireless Sensor Network) as the dominant technology [3]–[9]. The WSN, rather than Wi-Fi, has been popularly employed for remote control and monitoring appli- cations [10]–[13] because it has a low cost and consumes little power. However, several problems in the construction of smart homes with WSNs are yet to be solved. The studies [14], [15] presented a comprehensive review of problems related to the development of smart homes Manuscript received March 13, 2014; revised June 16, 2014, August 9, 2014 and October 7, 2014; accepted November 18, 2014. Copyright c ⃝ 2014 IEEE. Personal use of this material is permitted. However, permission to use this material for any other purposes must be obtained from the IEEE by sending a request to [email protected] M. Li and H.-J. Lin are with the Department of Electrical Engineering, School of Electrical and Computer Engineering, College of Engineering, Chang Gung University, 259 Wen-Hwa 1st Road, Kwei-Shan, Tao-Yuan, 33302 Taiwan (corresponding author: M. Li; e-mail: mfl[email protected]). with WSN technologies. For WSNs, if the network coverage exceeds a certain range or the network environment cannot provide line-of-sight transmission, then high transmission error and data loss rates may occur. Hence, designing a scalable network infrastructure for WSNs is very important. Although several techniques have been proposed to improve WSN connectivity [16], the challenge of improving connectivity in WSNs still exists. Furthermore, WSNs and WLANs both operate in the 2.4 GHz ISM (Industrial, Science and Medical) band. Experimental results [17]–[19] have demonstrated that Wi-Fi networks and WSNs may function together even they operate in the same frequency band. However, inevitable wireless interference and packet losses may occur in WSNs. To solve this problem, some methods have been proposed for interference avoidance [19] or coordinating such a heteroge- neous network environment [20]. However, a more effective interference immunity solution for WSNs remains to be found. To resolve the issue of wireless interference, the WSN is integrated herein with the PLC (Power Line Communication) technology to realize a smart home control network. Well-known PLC technologies include X10 [21], CEBus [22], LonWorks [23], and HomePlug [24]. According to the relevant specifications, PLC can be categorized as B-PLC (Broadband PLC) or N-PLC (Narrowband PLC) [25]. X10, CEBus, and LonWorks are forms of N-PLC, while HomePlug is a form of B-PLC. B-PLC uses a higher frequency band (1.8 to 250 MHz) and has a wider spectrum. Hence, B-PLC can offer a higher data rate and lower network latency than N-PLC. However, N-PLC has a low cost of deployment and the ability to communicate across the transformer. Recently, multicarrier-based N-PLC technologies such as PRIME (Pow- erline Intelligent Metering Evolution), G3-PLC, IEEE 1901.2, and ITU-T G.hnem have been proposed to offer higher data rates [25]. Some recent proposals [26]–[30] for smart homes or control networks have adopted PLC technologies to build the communication systems. One of the most important benefits to use PLCs in this work is a less relevant packet failure rate for WSNs. One of the main purposes of smart homes is to reduce energy consumption. To achieve this goal, smart controls must be implemented in a smart home. Additionally, smart lighting control systems must consider the contribution of natural light (daylight). Therefore, several works [31]–[33] suggested that daylight can substitute for partial electrical lighting in commercial or institutional buildings. Sensors and smart controllers enable daylight to reduce the power used
Transcript of IEEE TRANSACTIONS ON INDUSTRIAL ELECTRONICS …ieeeprojectsmadurai.com/2015-16 IEEE PAPERS... · ...
0278-0046 (c) 2013 IEEE. Personal use is permitted, but republication/redistribution requires IEEE permission. Seehttp://www.ieee.org/publications_standards/publications/rights/index.html for more information.
This article has been accepted for publication in a future issue of this journal, but has not been fully edited. Content may change prior to final publication. Citation information: DOI10.1109/TIE.2014.2379586, IEEE Transactions on Industrial Electronics
IEEE TRANSACTIONS ON INDUSTRIAL ELECTRONICS 1
Design and Implementation of Smart Home ControlSystems Based on Wireless Sensor Networks and
Power Line CommunicationsMingfu Li, Hung-Ju Lin
Abstract—Wireless sensor networks (WSNs) and power linecommunications (PLCs) are used in this work to implement asmart home control network. The goals are to reduce the impactof wireless interference on a smart home control network andunnecessary energy consumption of a smart home. An isolatedWSN with one coordinator, which is integrated into the PLCtransceiver, is established in each room. The coordinator isresponsible for transferring environmental parameters obtainedby WSNs to the management station via PLCs. The controlmessages for home appliances are directly transferred using PLCsrather than WSNs. According to experimental results, the impactof wireless interference on the proposed smart home controlnetwork is substantially mitigated. Additionally, a smart controlalgorithm for lighting systems and an analysis of illumination ofa fluorescent lamp were presented. The energy saving of lightingsystems relative to those without smart control was evaluated.Numerical results indicate that the electricity consumption on asunny or cloudy day can be reduced by at least 40% under thesmart control. Moreover, a prototype for the proposed smarthome control network with the smart control algorithm wasimplemented. Experimental tests demonstrate that the proposedsystem for smart home control networks is practically feasibleand performs well.
Index Terms—Appliance control, energy saving, power linecommunications, smart homes, smart lighting control, wirelesssensor networks.
I. INTRODUCTION
NUMEROUS studies [1]–[3] have shown that smart homesor intelligent buildings can use energy more efficiently
than traditional buildings. Thus, several researchers have advo-cated building smart homes for reducing energy consumption.Almost proposed smart home architectures in the literatureadopt the WSN (Wireless Sensor Network) as the dominanttechnology [3]–[9]. The WSN, rather than Wi-Fi, has beenpopularly employed for remote control and monitoring appli-cations [10]–[13] because it has a low cost and consumes littlepower. However, several problems in the construction of smarthomes with WSNs are yet to be solved.
The studies [14], [15] presented a comprehensive reviewof problems related to the development of smart homes
Manuscript received March 13, 2014; revised June 16, 2014, August 9,2014 and October 7, 2014; accepted November 18, 2014.
Copyright c⃝ 2014 IEEE. Personal use of this material is permitted.However, permission to use this material for any other purposes must beobtained from the IEEE by sending a request to [email protected]
M. Li and H.-J. Lin are with the Department of Electrical Engineering,School of Electrical and Computer Engineering, College of Engineering,Chang Gung University, 259 Wen-Hwa 1st Road, Kwei-Shan, Tao-Yuan,33302 Taiwan (corresponding author: M. Li; e-mail: [email protected]).
with WSN technologies. For WSNs, if the network coverageexceeds a certain range or the network environment cannotprovide line-of-sight transmission, then high transmission errorand data loss rates may occur. Hence, designing a scalablenetwork infrastructure for WSNs is very important. Althoughseveral techniques have been proposed to improve WSNconnectivity [16], the challenge of improving connectivityin WSNs still exists. Furthermore, WSNs and WLANs bothoperate in the 2.4 GHz ISM (Industrial, Science and Medical)band. Experimental results [17]–[19] have demonstrated thatWi-Fi networks and WSNs may function together even theyoperate in the same frequency band. However, inevitablewireless interference and packet losses may occur in WSNs.To solve this problem, some methods have been proposed forinterference avoidance [19] or coordinating such a heteroge-neous network environment [20]. However, a more effectiveinterference immunity solution for WSNs remains to be found.To resolve the issue of wireless interference, the WSN isintegrated herein with the PLC (Power Line Communication)technology to realize a smart home control network.
Well-known PLC technologies include X10 [21], CEBus[22], LonWorks [23], and HomePlug [24]. According to therelevant specifications, PLC can be categorized as B-PLC(Broadband PLC) or N-PLC (Narrowband PLC) [25]. X10,CEBus, and LonWorks are forms of N-PLC, while HomePlugis a form of B-PLC. B-PLC uses a higher frequency band(1.8 to 250 MHz) and has a wider spectrum. Hence, B-PLCcan offer a higher data rate and lower network latency thanN-PLC. However, N-PLC has a low cost of deployment andthe ability to communicate across the transformer. Recently,multicarrier-based N-PLC technologies such as PRIME (Pow-erline Intelligent Metering Evolution), G3-PLC, IEEE 1901.2,and ITU-T G.hnem have been proposed to offer higher datarates [25]. Some recent proposals [26]–[30] for smart homes orcontrol networks have adopted PLC technologies to build thecommunication systems. One of the most important benefitsto use PLCs in this work is a less relevant packet failure ratefor WSNs.
One of the main purposes of smart homes is to reduceenergy consumption. To achieve this goal, smart controlsmust be implemented in a smart home. Additionally, smartlighting control systems must consider the contribution ofnatural light (daylight). Therefore, several works [31]–[33]suggested that daylight can substitute for partial electricallighting in commercial or institutional buildings. Sensors andsmart controllers enable daylight to reduce the power used
0278-0046 (c) 2013 IEEE. Personal use is permitted, but republication/redistribution requires IEEE permission. Seehttp://www.ieee.org/publications_standards/publications/rights/index.html for more information.
This article has been accepted for publication in a future issue of this journal, but has not been fully edited. Content may change prior to final publication. Citation information: DOI10.1109/TIE.2014.2379586, IEEE Transactions on Industrial Electronics
IEEE TRANSACTIONS ON INDUSTRIAL ELECTRONICS 2
to run electrical lighting and to sufficiently illuminate anoffice. Although many ideas about smart lighting controlfor energy saving in smart homes have been proposed, apractical smart lighting control system with high reliability andcontrol accuracy remains to be found. An accurate and reliablelighting control system must have a robust environmentalillumination gathering system. However, only few papers [11]considered the impact of packet failure on the performanceof smart control systems. According to the simulation resultsin [11], packet failure not only deteriorates the final controlachievement but also slows down the speed of approachingthe control goal. Accordingly, constructing the communicationnetwork with a low packet failure rate to support smart controlsystems is extremely required.
The novelty and contributions of this work are summarizedas follows. Firstly, the scalable architecture that combinesWSN and PLC technologies for the smart home controlnetwork is presented. The proposed network infrastructurecan considerably mitigate the impact of radio interferenceand simplify node placement in WSNs. The proposed smarthome control system includes the environmental informationgathering, communication, and appliance control subsystems.It also allows users to remotely monitor and control homeappliances using the Internet and the web-based managementsystem. Secondly, a smart control algorithm for lighting sys-tems in smart homes or intelligent buildings is proposed.Thirdly, a prototype of the smart home control network withthe proposed smart lighting control algorithm is developed,tested and evaluated.
The rest of this work is organized as follows. Section IIdiscusses different architectures of smart home control net-works. Performance comparisons between different networkarchitectures are made. Section III presents a smart lightingcontrol algorithm and evaluates the energy saving ratio ofthe smart home under smart control. Section IV describesissues related to the implementation of the proposed smarthome control network. A prototype of the proposed systemis implemented and tested. Finally, Section V provides theconcluding remarks.
II. DESIGN AND PERFORMANCE EVALUATION OF SMARTHOME CONTROL NETWORKS
A. Architectural Design of Smart Home Control Networks
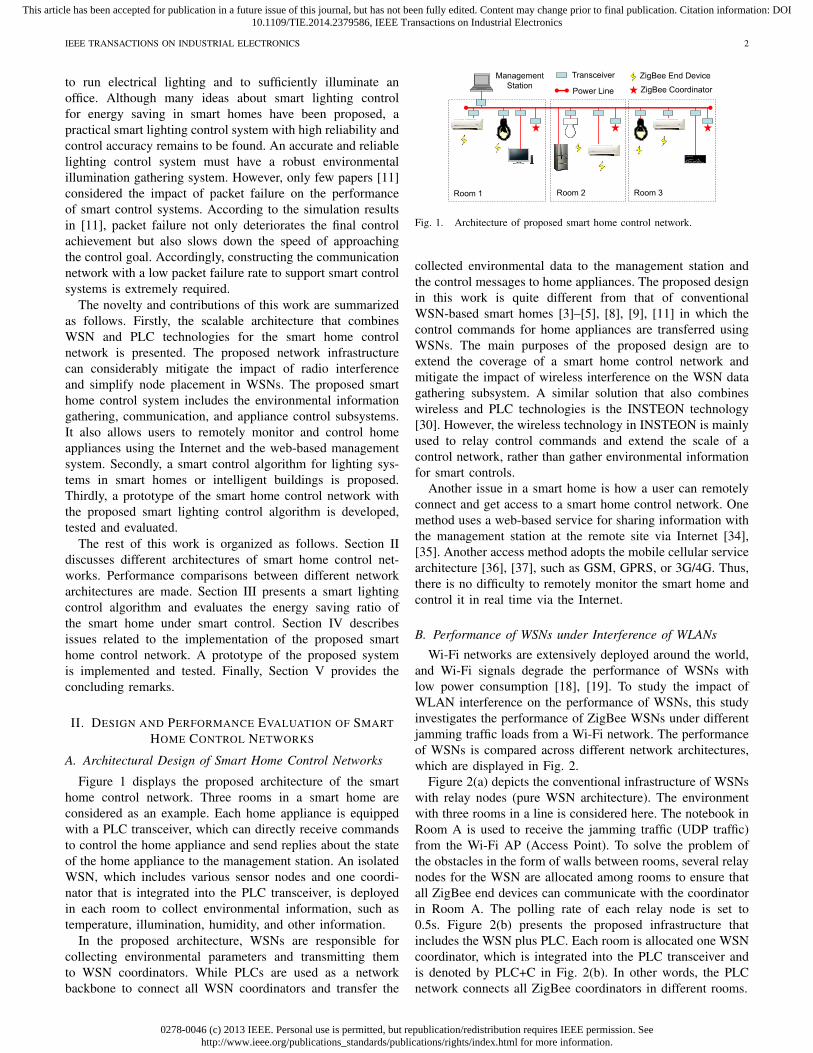
Figure 1 displays the proposed architecture of the smarthome control network. Three rooms in a smart home areconsidered as an example. Each home appliance is equippedwith a PLC transceiver, which can directly receive commandsto control the home appliance and send replies about the stateof the home appliance to the management station. An isolatedWSN, which includes various sensor nodes and one coordi-nator that is integrated into the PLC transceiver, is deployedin each room to collect environmental information, such astemperature, illumination, humidity, and other information.
In the proposed architecture, WSNs are responsible forcollecting environmental parameters and transmitting themto WSN coordinators. While PLCs are used as a networkbackbone to connect all WSN coordinators and transfer the
Fig. 1. Architecture of proposed smart home control network.
collected environmental data to the management station andthe control messages to home appliances. The proposed designin this work is quite different from that of conventionalWSN-based smart homes [3]–[5], [8], [9], [11] in which thecontrol commands for home appliances are transferred usingWSNs. The main purposes of the proposed design are toextend the coverage of a smart home control network andmitigate the impact of wireless interference on the WSN datagathering subsystem. A similar solution that also combineswireless and PLC technologies is the INSTEON technology[30]. However, the wireless technology in INSTEON is mainlyused to relay control commands and extend the scale of acontrol network, rather than gather environmental informationfor smart controls.
Another issue in a smart home is how a user can remotelyconnect and get access to a smart home control network. Onemethod uses a web-based service for sharing information withthe management station at the remote site via Internet [34],[35]. Another access method adopts the mobile cellular servicearchitecture [36], [37], such as GSM, GPRS, or 3G/4G. Thus,there is no difficulty to remotely monitor the smart home andcontrol it in real time via the Internet.
B. Performance of WSNs under Interference of WLANs
Wi-Fi networks are extensively deployed around the world,and Wi-Fi signals degrade the performance of WSNs withlow power consumption [18], [19]. To study the impact ofWLAN interference on the performance of WSNs, this studyinvestigates the performance of ZigBee WSNs under differentjamming traffic loads from a Wi-Fi network. The performanceof WSNs is compared across different network architectures,which are displayed in Fig. 2.
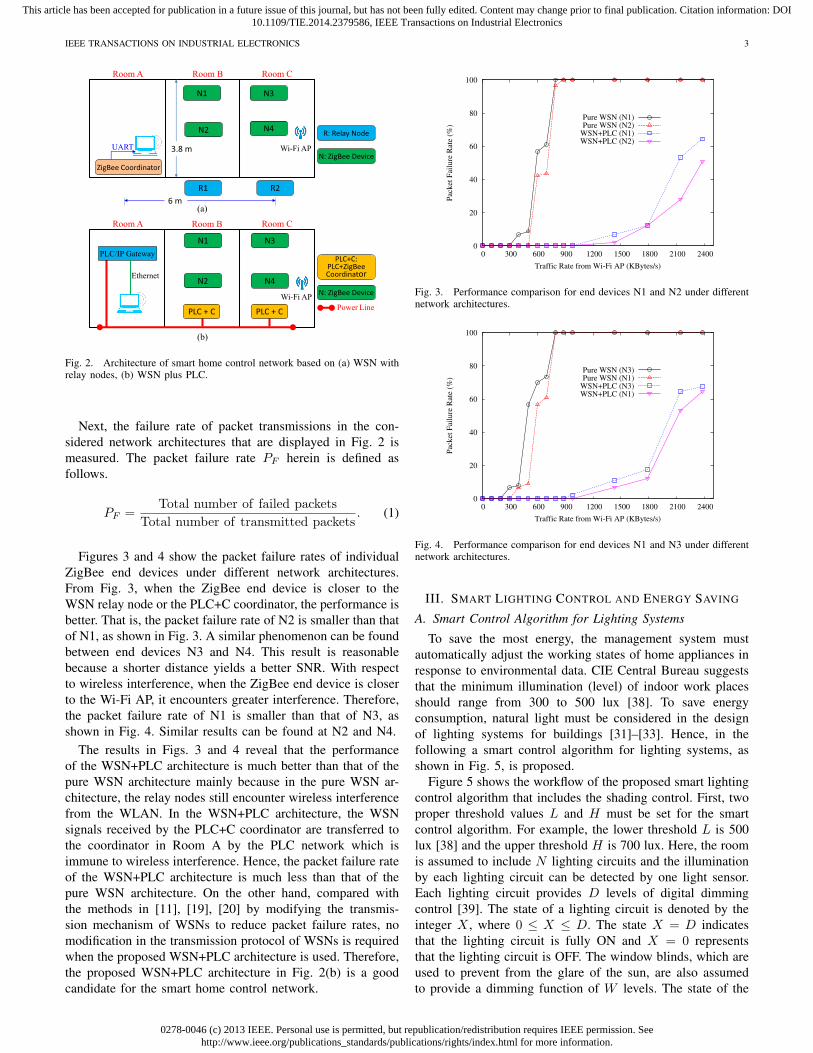
Figure 2(a) depicts the conventional infrastructure of WSNswith relay nodes (pure WSN architecture). The environmentwith three rooms in a line is considered here. The notebook inRoom A is used to receive the jamming traffic (UDP traffic)from the Wi-Fi AP (Access Point). To solve the problem ofthe obstacles in the form of walls between rooms, several relaynodes for the WSN are allocated among rooms to ensure thatall ZigBee end devices can communicate with the coordinatorin Room A. The polling rate of each relay node is set to0.5s. Figure 2(b) presents the proposed infrastructure thatincludes the WSN plus PLC. Each room is allocated one WSNcoordinator, which is integrated into the PLC transceiver andis denoted by PLC+C in Fig. 2(b). In other words, the PLCnetwork connects all ZigBee coordinators in different rooms.
0278-0046 (c) 2013 IEEE. Personal use is permitted, but republication/redistribution requires IEEE permission. Seehttp://www.ieee.org/publications_standards/publications/rights/index.html for more information.
This article has been accepted for publication in a future issue of this journal, but has not been fully edited. Content may change prior to final publication. Citation information: DOI10.1109/TIE.2014.2379586, IEEE Transactions on Industrial Electronics
IEEE TRANSACTIONS ON INDUSTRIAL ELECTRONICS 3
Fig. 2. Architecture of smart home control network based on (a) WSN withrelay nodes, (b) WSN plus PLC.
Next, the failure rate of packet transmissions in the con-sidered network architectures that are displayed in Fig. 2 ismeasured. The packet failure rate PF herein is defined asfollows.
PF =Total number of failed packets
Total number of transmitted packets. (1)
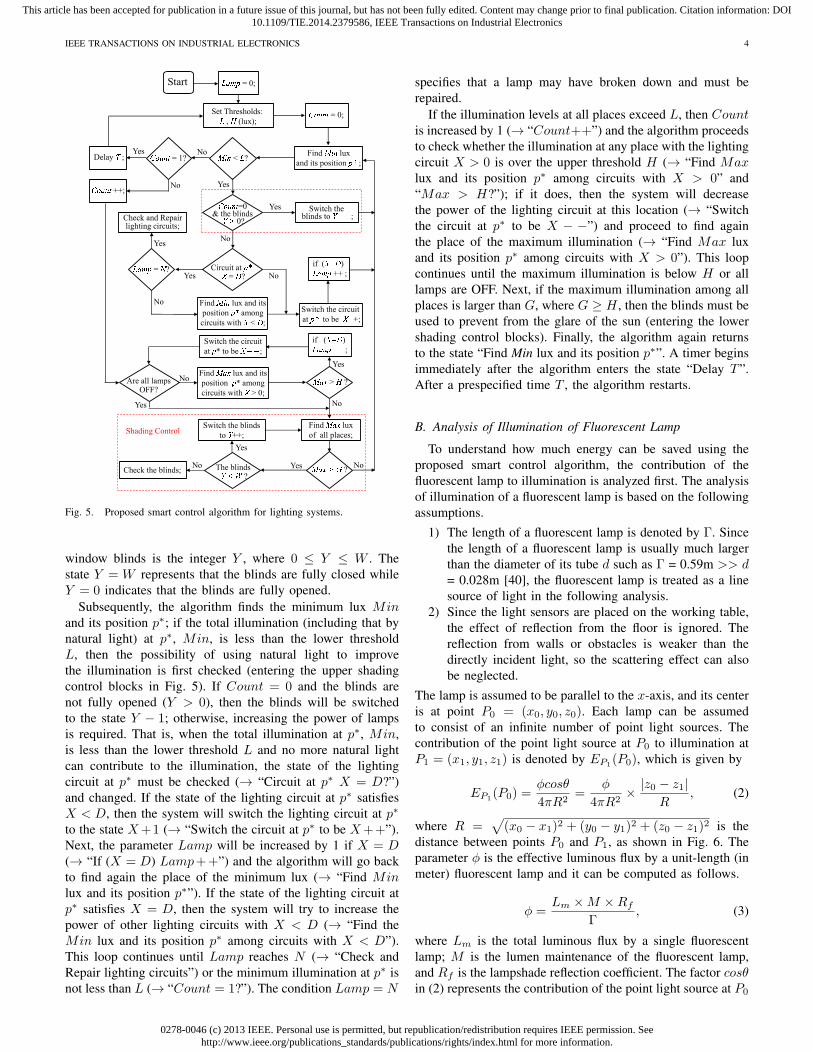
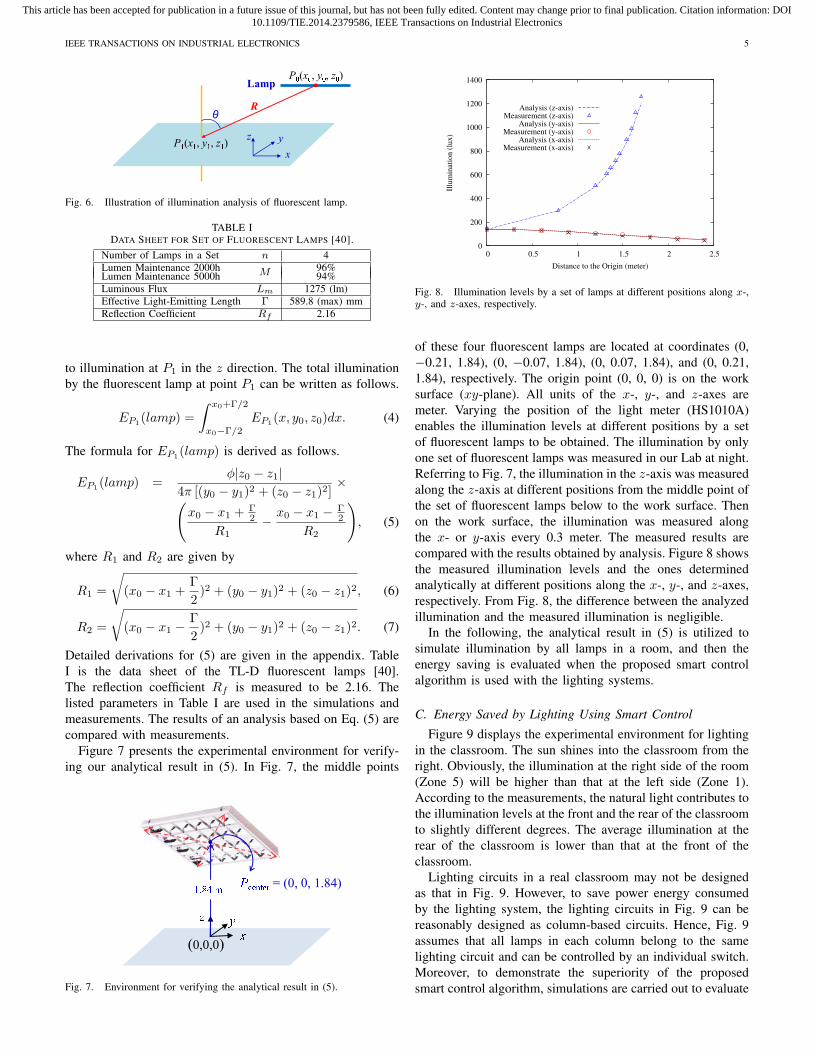
Figures 3 and 4 show the packet failure rates of individualZigBee end devices under different network architectures.From Fig. 3, when the ZigBee end device is closer to theWSN relay node or the PLC+C coordinator, the performance isbetter. That is, the packet failure rate of N2 is smaller than thatof N1, as shown in Fig. 3. A similar phenomenon can be foundbetween end devices N3 and N4. This result is reasonablebecause a shorter distance yields a better SNR. With respectto wireless interference, when the ZigBee end device is closerto the Wi-Fi AP, it encounters greater interference. Therefore,the packet failure rate of N1 is smaller than that of N3, asshown in Fig. 4. Similar results can be found at N2 and N4.
The results in Figs. 3 and 4 reveal that the performanceof the WSN+PLC architecture is much better than that of thepure WSN architecture mainly because in the pure WSN ar-chitecture, the relay nodes still encounter wireless interferencefrom the WLAN. In the WSN+PLC architecture, the WSNsignals received by the PLC+C coordinator are transferred tothe coordinator in Room A by the PLC network which isimmune to wireless interference. Hence, the packet failure rateof the WSN+PLC architecture is much less than that of thepure WSN architecture. On the other hand, compared withthe methods in [11], [19], [20] by modifying the transmis-sion mechanism of WSNs to reduce packet failure rates, nomodification in the transmission protocol of WSNs is requiredwhen the proposed WSN+PLC architecture is used. Therefore,the proposed WSN+PLC architecture in Fig. 2(b) is a goodcandidate for the smart home control network.
0
20
40
60
80
100
0 300 600 900 1200 1500 1800 2100 2400
Pac
ket
Fai
lure
Rat
e (%
)
Traffic Rate from Wi-Fi AP (KBytes/s)
Pure WSN (N1)Pure WSN (N2)
WSN+PLC (N1)WSN+PLC (N2)
Fig. 3. Performance comparison for end devices N1 and N2 under differentnetwork architectures.
0
20
40
60
80
100
0 300 600 900 1200 1500 1800 2100 2400
Pac
ket
Fai
lure
Rat
e (%
)
Traffic Rate from Wi-Fi AP (KBytes/s)
Pure WSN (N3)Pure WSN (N1)
WSN+PLC (N3)WSN+PLC (N1)
Fig. 4. Performance comparison for end devices N1 and N3 under differentnetwork architectures.
III. SMART LIGHTING CONTROL AND ENERGY SAVING
A. Smart Control Algorithm for Lighting Systems
To save the most energy, the management system mustautomatically adjust the working states of home appliances inresponse to environmental data. CIE Central Bureau suggeststhat the minimum illumination (level) of indoor work placesshould range from 300 to 500 lux [38]. To save energyconsumption, natural light must be considered in the designof lighting systems for buildings [31]–[33]. Hence, in thefollowing a smart control algorithm for lighting systems, asshown in Fig. 5, is proposed.
Figure 5 shows the workflow of the proposed smart lightingcontrol algorithm that includes the shading control. First, twoproper threshold values L and H must be set for the smartcontrol algorithm. For example, the lower threshold L is 500lux [38] and the upper threshold H is 700 lux. Here, the roomis assumed to include N lighting circuits and the illuminationby each lighting circuit can be detected by one light sensor.Each lighting circuit provides D levels of digital dimmingcontrol [39]. The state of a lighting circuit is denoted by theinteger X , where 0 ≤ X ≤ D. The state X = D indicatesthat the lighting circuit is fully ON and X = 0 representsthat the lighting circuit is OFF. The window blinds, which areused to prevent from the glare of the sun, are also assumedto provide a dimming function of W levels. The state of the
0278-0046 (c) 2013 IEEE. Personal use is permitted, but republication/redistribution requires IEEE permission. Seehttp://www.ieee.org/publications_standards/publications/rights/index.html for more information.
This article has been accepted for publication in a future issue of this journal, but has not been fully edited. Content may change prior to final publication. Citation information: DOI10.1109/TIE.2014.2379586, IEEE Transactions on Industrial Electronics
IEEE TRANSACTIONS ON INDUSTRIAL ELECTRONICS 4
Fig. 5. Proposed smart control algorithm for lighting systems.
window blinds is the integer Y , where 0 ≤ Y ≤ W . Thestate Y = W represents that the blinds are fully closed whileY = 0 indicates that the blinds are fully opened.
Subsequently, the algorithm finds the minimum lux Minand its position p∗; if the total illumination (including that bynatural light) at p∗, Min, is less than the lower thresholdL, then the possibility of using natural light to improvethe illumination is first checked (entering the upper shadingcontrol blocks in Fig. 5). If Count = 0 and the blinds arenot fully opened (Y > 0), then the blinds will be switchedto the state Y − 1; otherwise, increasing the power of lampsis required. That is, when the total illumination at p∗, Min,is less than the lower threshold L and no more natural lightcan contribute to the illumination, the state of the lightingcircuit at p∗ must be checked (→ “Circuit at p∗ X = D?”)and changed. If the state of the lighting circuit at p∗ satisfiesX < D, then the system will switch the lighting circuit at p∗
to the state X+1 (→ “Switch the circuit at p∗ to be X++”).Next, the parameter Lamp will be increased by 1 if X = D(→ “If (X = D) Lamp++”) and the algorithm will go backto find again the place of the minimum lux (→ “Find Minlux and its position p∗”). If the state of the lighting circuit atp∗ satisfies X = D, then the system will try to increase thepower of other lighting circuits with X < D (→ “Find theMin lux and its position p∗ among circuits with X < D”).This loop continues until Lamp reaches N (→ “Check andRepair lighting circuits”) or the minimum illumination at p∗ isnot less than L (→ “Count = 1?”). The condition Lamp = N
specifies that a lamp may have broken down and must berepaired.
If the illumination levels at all places exceed L, then Countis increased by 1 (→ “Count++”) and the algorithm proceedsto check whether the illumination at any place with the lightingcircuit X > 0 is over the upper threshold H (→ “Find Maxlux and its position p∗ among circuits with X > 0” and“Max > H?”); if it does, then the system will decreasethe power of the lighting circuit at this location (→ “Switchthe circuit at p∗ to be X − −”) and proceed to find againthe place of the maximum illumination (→ “Find Max luxand its position p∗ among circuits with X > 0”). This loopcontinues until the maximum illumination is below H or alllamps are OFF. Next, if the maximum illumination among allplaces is larger than G, where G ≥ H , then the blinds must beused to prevent from the glare of the sun (entering the lowershading control blocks). Finally, the algorithm again returnsto the state “Find Min lux and its position p∗”. A timer beginsimmediately after the algorithm enters the state “Delay T ”.After a prespecified time T , the algorithm restarts.
B. Analysis of Illumination of Fluorescent Lamp
To understand how much energy can be saved using theproposed smart control algorithm, the contribution of thefluorescent lamp to illumination is analyzed first. The analysisof illumination of a fluorescent lamp is based on the followingassumptions.
1) The length of a fluorescent lamp is denoted by Γ. Sincethe length of a fluorescent lamp is usually much largerthan the diameter of its tube d such as Γ = 0.59m >> d= 0.028m [40], the fluorescent lamp is treated as a linesource of light in the following analysis.
2) Since the light sensors are placed on the working table,the effect of reflection from the floor is ignored. Thereflection from walls or obstacles is weaker than thedirectly incident light, so the scattering effect can alsobe neglected.
The lamp is assumed to be parallel to the x-axis, and its centeris at point P0 = (x0, y0, z0). Each lamp can be assumedto consist of an infinite number of point light sources. Thecontribution of the point light source at P0 to illumination atP1 = (x1, y1, z1) is denoted by EP1(P0), which is given by
EP1(P0) =ϕcosθ
4πR2=
ϕ
4πR2× |z0 − z1|
R, (2)
where R =√(x0 − x1)2 + (y0 − y1)2 + (z0 − z1)2 is the
distance between points P0 and P1, as shown in Fig. 6. Theparameter ϕ is the effective luminous flux by a unit-length (inmeter) fluorescent lamp and it can be computed as follows.
ϕ =Lm ×M ×Rf
Γ, (3)
where Lm is the total luminous flux by a single fluorescentlamp; M is the lumen maintenance of the fluorescent lamp,and Rf is the lampshade reflection coefficient. The factor cosθin (2) represents the contribution of the point light source at P0
0278-0046 (c) 2013 IEEE. Personal use is permitted, but republication/redistribution requires IEEE permission. Seehttp://www.ieee.org/publications_standards/publications/rights/index.html for more information.
This article has been accepted for publication in a future issue of this journal, but has not been fully edited. Content may change prior to final publication. Citation information: DOI10.1109/TIE.2014.2379586, IEEE Transactions on Industrial Electronics
IEEE TRANSACTIONS ON INDUSTRIAL ELECTRONICS 5
Fig. 6. Illustration of illumination analysis of fluorescent lamp.
TABLE IDATA SHEET FOR SET OF FLUORESCENT LAMPS [40].
Number of Lamps in a Set n 4Lumen Maintenance 2000h 96%MLumen Maintenance 5000h 94%Luminous Flux Lm 1275 (lm)Effective Light-Emitting Length Γ 589.8 (max) mmReflection Coefficient Rf 2.16
to illumination at P1 in the z direction. The total illuminationby the fluorescent lamp at point P1 can be written as follows.
EP1(lamp) =
∫ x0+Γ/2
x0−Γ/2
EP1(x, y0, z0)dx. (4)
The formula for EP1(lamp) is derived as follows.
EP1(lamp) =ϕ|z0 − z1|
4π [(y0 − y1)2 + (z0 − z1)2]×(
x0 − x1 +Γ2
R1−
x0 − x1 − Γ2
R2
), (5)
where R1 and R2 are given by
R1 =
√(x0 − x1 +
Γ
2)2 + (y0 − y1)2 + (z0 − z1)2, (6)
R2 =
√(x0 − x1 −
Γ
2)2 + (y0 − y1)2 + (z0 − z1)2. (7)
Detailed derivations for (5) are given in the appendix. TableI is the data sheet of the TL-D fluorescent lamps [40].The reflection coefficient Rf is measured to be 2.16. Thelisted parameters in Table I are used in the simulations andmeasurements. The results of an analysis based on Eq. (5) arecompared with measurements.
Figure 7 presents the experimental environment for verify-ing our analytical result in (5). In Fig. 7, the middle points
Fig. 7. Environment for verifying the analytical result in (5).
0
200
400
600
800
1000
1200
1400
0 0.5 1 1.5 2 2.5
Illu
min
atio
n (
lux)
Distance to the Origin (meter)
Analysis (z-axis)Measurement (z-axis)
Analysis (y-axis)Measurement (y-axis)
Analysis (x-axis)Measurement (x-axis)
Fig. 8. Illumination levels by a set of lamps at different positions along x-,y-, and z-axes, respectively.
of these four fluorescent lamps are located at coordinates (0,−0.21, 1.84), (0, −0.07, 1.84), (0, 0.07, 1.84), and (0, 0.21,1.84), respectively. The origin point (0, 0, 0) is on the worksurface (xy-plane). All units of the x-, y-, and z-axes aremeter. Varying the position of the light meter (HS1010A)enables the illumination levels at different positions by a setof fluorescent lamps to be obtained. The illumination by onlyone set of fluorescent lamps was measured in our Lab at night.Referring to Fig. 7, the illumination in the z-axis was measuredalong the z-axis at different positions from the middle point ofthe set of fluorescent lamps below to the work surface. Thenon the work surface, the illumination was measured alongthe x- or y-axis every 0.3 meter. The measured results arecompared with the results obtained by analysis. Figure 8 showsthe measured illumination levels and the ones determinedanalytically at different positions along the x-, y-, and z-axes,respectively. From Fig. 8, the difference between the analyzedillumination and the measured illumination is negligible.
In the following, the analytical result in (5) is utilized tosimulate illumination by all lamps in a room, and then theenergy saving is evaluated when the proposed smart controlalgorithm is used with the lighting systems.
C. Energy Saved by Lighting Using Smart Control
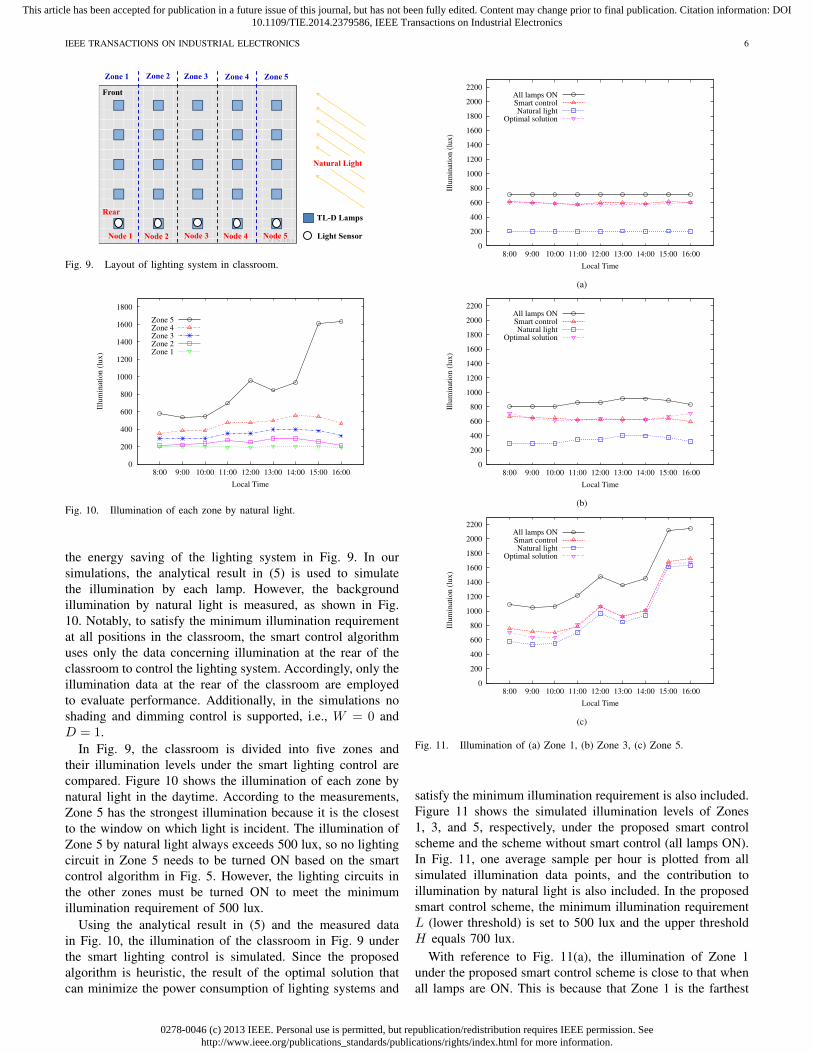
Figure 9 displays the experimental environment for lightingin the classroom. The sun shines into the classroom from theright. Obviously, the illumination at the right side of the room(Zone 5) will be higher than that at the left side (Zone 1).According to the measurements, the natural light contributes tothe illumination levels at the front and the rear of the classroomto slightly different degrees. The average illumination at therear of the classroom is lower than that at the front of theclassroom.
Lighting circuits in a real classroom may not be designedas that in Fig. 9. However, to save power energy consumedby the lighting system, the lighting circuits in Fig. 9 can bereasonably designed as column-based circuits. Hence, Fig. 9assumes that all lamps in each column belong to the samelighting circuit and can be controlled by an individual switch.Moreover, to demonstrate the superiority of the proposedsmart control algorithm, simulations are carried out to evaluate
0278-0046 (c) 2013 IEEE. Personal use is permitted, but republication/redistribution requires IEEE permission. Seehttp://www.ieee.org/publications_standards/publications/rights/index.html for more information.
This article has been accepted for publication in a future issue of this journal, but has not been fully edited. Content may change prior to final publication. Citation information: DOI10.1109/TIE.2014.2379586, IEEE Transactions on Industrial Electronics
IEEE TRANSACTIONS ON INDUSTRIAL ELECTRONICS 6
Fig. 9. Layout of lighting system in classroom.
0
200
400
600
800
1000
1200
1400
1600
1800
8:00 9:00 10:00 11:00 12:00 13:00 14:00 15:00 16:00
Illu
min
ati
on (
lux)
Local Time
Zone 5Zone 4Zone 3Zone 2Zone 1
Fig. 10. Illumination of each zone by natural light.
the energy saving of the lighting system in Fig. 9. In oursimulations, the analytical result in (5) is used to simulatethe illumination by each lamp. However, the backgroundillumination by natural light is measured, as shown in Fig.10. Notably, to satisfy the minimum illumination requirementat all positions in the classroom, the smart control algorithmuses only the data concerning illumination at the rear of theclassroom to control the lighting system. Accordingly, only theillumination data at the rear of the classroom are employedto evaluate performance. Additionally, in the simulations noshading and dimming control is supported, i.e., W = 0 andD = 1.
In Fig. 9, the classroom is divided into five zones andtheir illumination levels under the smart lighting control arecompared. Figure 10 shows the illumination of each zone bynatural light in the daytime. According to the measurements,Zone 5 has the strongest illumination because it is the closestto the window on which light is incident. The illumination ofZone 5 by natural light always exceeds 500 lux, so no lightingcircuit in Zone 5 needs to be turned ON based on the smartcontrol algorithm in Fig. 5. However, the lighting circuits inthe other zones must be turned ON to meet the minimumillumination requirement of 500 lux.
Using the analytical result in (5) and the measured datain Fig. 10, the illumination of the classroom in Fig. 9 underthe smart lighting control is simulated. Since the proposedalgorithm is heuristic, the result of the optimal solution thatcan minimize the power consumption of lighting systems and
0
200
400
600
800
1000
1200
1400
1600
1800
2000
2200
8:00 9:00 10:00 11:00 12:00 13:00 14:00 15:00 16:00
Illu
min
atio
n (
lux)
Local Time
All lamps ONSmart controlNatural light
Optimal solution
(a)
0
200
400
600
800
1000
1200
1400
1600
1800
2000
2200
8:00 9:00 10:00 11:00 12:00 13:00 14:00 15:00 16:00
Illu
min
atio
n (
lux)
Local Time
All lamps ONSmart controlNatural light
Optimal solution
(b)
0
200
400
600
800
1000
1200
1400
1600
1800
2000
2200
8:00 9:00 10:00 11:00 12:00 13:00 14:00 15:00 16:00
Illu
min
atio
n (
lux)
Local Time
All lamps ONSmart controlNatural light
Optimal solution
(c)
Fig. 11. Illumination of (a) Zone 1, (b) Zone 3, (c) Zone 5.
satisfy the minimum illumination requirement is also included.Figure 11 shows the simulated illumination levels of Zones1, 3, and 5, respectively, under the proposed smart controlscheme and the scheme without smart control (all lamps ON).In Fig. 11, one average sample per hour is plotted from allsimulated illumination data points, and the contribution toillumination by natural light is also included. In the proposedsmart control scheme, the minimum illumination requirementL (lower threshold) is set to 500 lux and the upper thresholdH equals 700 lux.
With reference to Fig. 11(a), the illumination of Zone 1under the proposed smart control scheme is close to that whenall lamps are ON. This is because that Zone 1 is the farthest
0278-0046 (c) 2013 IEEE. Personal use is permitted, but republication/redistribution requires IEEE permission. Seehttp://www.ieee.org/publications_standards/publications/rights/index.html for more information.
This article has been accepted for publication in a future issue of this journal, but has not been fully edited. Content may change prior to final publication. Citation information: DOI10.1109/TIE.2014.2379586, IEEE Transactions on Industrial Electronics
IEEE TRANSACTIONS ON INDUSTRIAL ELECTRONICS 7
0
0.3
0.6
0.9
1.2
1.5
1.8
2.1
2.4
8:00 9:00 10:00 11:00 12:00 13:00 14:00 15:00 16:00
Pow
er C
onsu
mp
tion (
kW
)
Local Time
All lamps ONSmart control
Optimal solution
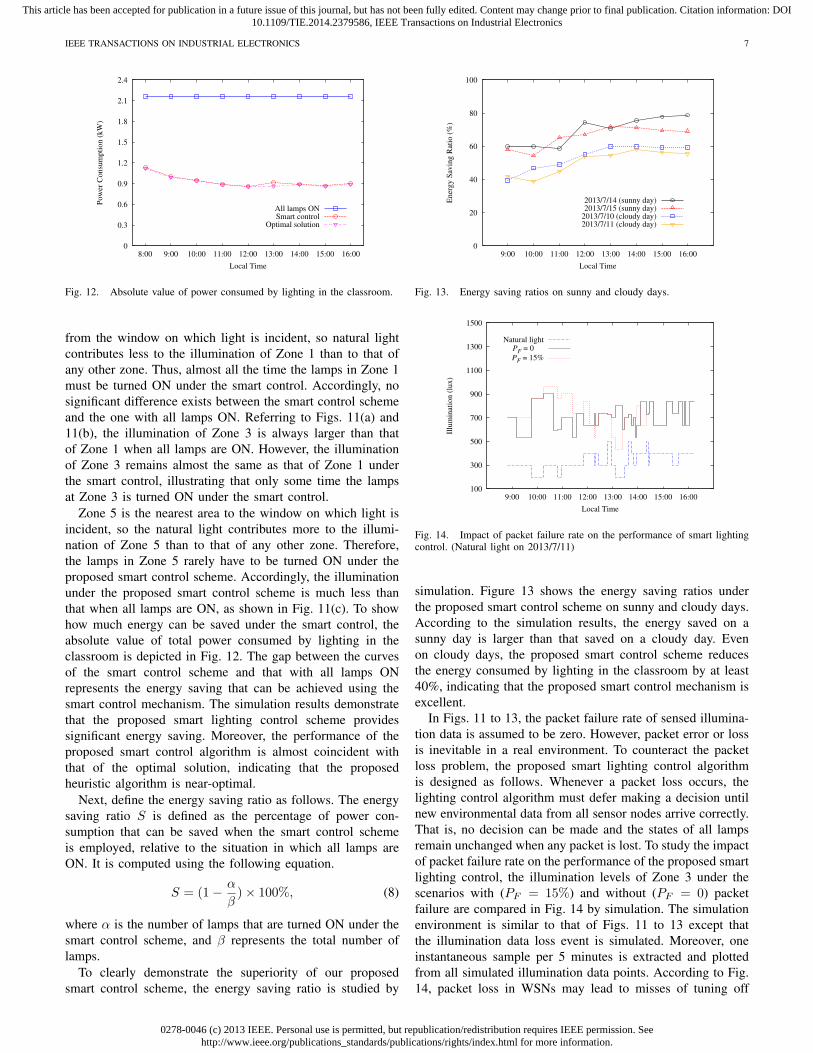
Fig. 12. Absolute value of power consumed by lighting in the classroom.
from the window on which light is incident, so natural lightcontributes less to the illumination of Zone 1 than to that ofany other zone. Thus, almost all the time the lamps in Zone 1must be turned ON under the smart control. Accordingly, nosignificant difference exists between the smart control schemeand the one with all lamps ON. Referring to Figs. 11(a) and11(b), the illumination of Zone 3 is always larger than thatof Zone 1 when all lamps are ON. However, the illuminationof Zone 3 remains almost the same as that of Zone 1 underthe smart control, illustrating that only some time the lampsat Zone 3 is turned ON under the smart control.
Zone 5 is the nearest area to the window on which light isincident, so the natural light contributes more to the illumi-nation of Zone 5 than to that of any other zone. Therefore,the lamps in Zone 5 rarely have to be turned ON under theproposed smart control scheme. Accordingly, the illuminationunder the proposed smart control scheme is much less thanthat when all lamps are ON, as shown in Fig. 11(c). To showhow much energy can be saved under the smart control, theabsolute value of total power consumed by lighting in theclassroom is depicted in Fig. 12. The gap between the curvesof the smart control scheme and that with all lamps ONrepresents the energy saving that can be achieved using thesmart control mechanism. The simulation results demonstratethat the proposed smart lighting control scheme providessignificant energy saving. Moreover, the performance of theproposed smart control algorithm is almost coincident withthat of the optimal solution, indicating that the proposedheuristic algorithm is near-optimal.
Next, define the energy saving ratio as follows. The energysaving ratio S is defined as the percentage of power con-sumption that can be saved when the smart control schemeis employed, relative to the situation in which all lamps areON. It is computed using the following equation.
S = (1− α
β)× 100%, (8)
where α is the number of lamps that are turned ON under thesmart control scheme, and β represents the total number oflamps.
To clearly demonstrate the superiority of our proposedsmart control scheme, the energy saving ratio is studied by
0
20
40
60
80
100
9:00 10:00 11:00 12:00 13:00 14:00 15:00 16:00
Ener
gy S
avin
g R
atio
(%
)
Local Time
2013/7/14 (sunny day)2013/7/15 (sunny day)
2013/7/10 (cloudy day)2013/7/11 (cloudy day)
Fig. 13. Energy saving ratios on sunny and cloudy days.
100
300
500
700
900
1100
1300
1500
9:00 10:00 11:00 12:00 13:00 14:00 15:00 16:00
Illu
min
atio
n (
lux
)
Local Time
Natural lightP
F = 0
PF = 15%
Fig. 14. Impact of packet failure rate on the performance of smart lightingcontrol. (Natural light on 2013/7/11)
simulation. Figure 13 shows the energy saving ratios underthe proposed smart control scheme on sunny and cloudy days.According to the simulation results, the energy saved on asunny day is larger than that saved on a cloudy day. Evenon cloudy days, the proposed smart control scheme reducesthe energy consumed by lighting in the classroom by at least40%, indicating that the proposed smart control mechanism isexcellent.
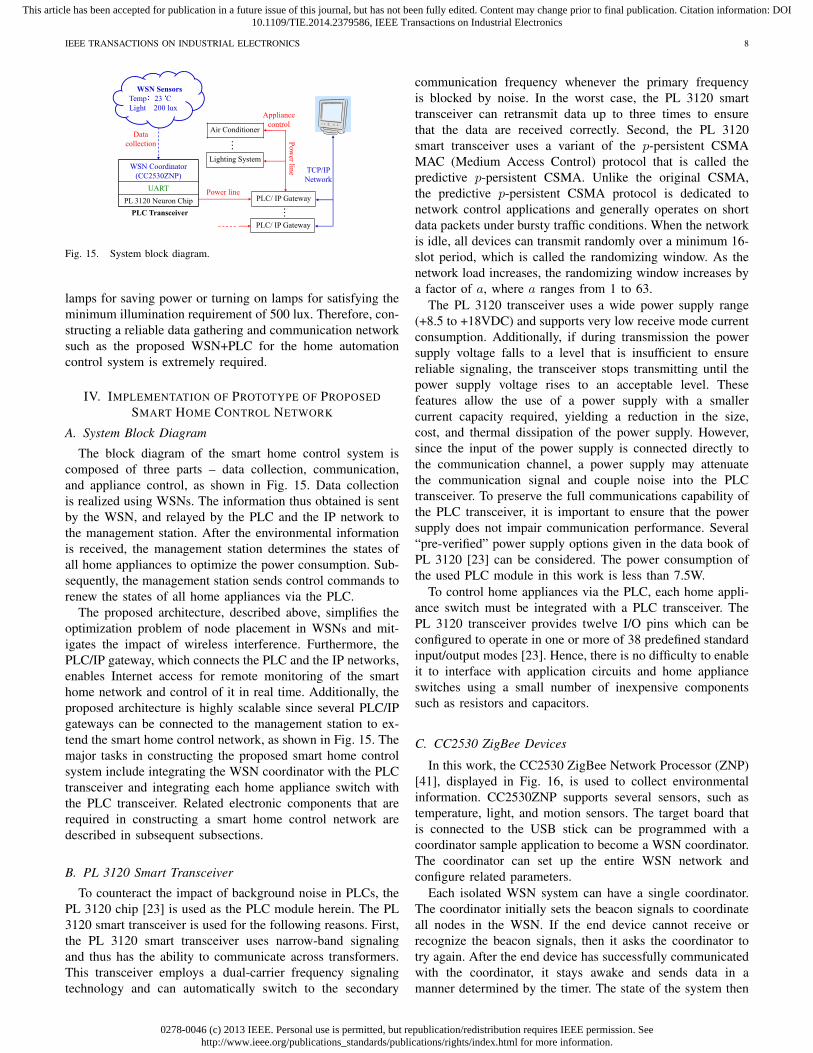
In Figs. 11 to 13, the packet failure rate of sensed illumina-tion data is assumed to be zero. However, packet error or lossis inevitable in a real environment. To counteract the packetloss problem, the proposed smart lighting control algorithmis designed as follows. Whenever a packet loss occurs, thelighting control algorithm must defer making a decision untilnew environmental data from all sensor nodes arrive correctly.That is, no decision can be made and the states of all lampsremain unchanged when any packet is lost. To study the impactof packet failure rate on the performance of the proposed smartlighting control, the illumination levels of Zone 3 under thescenarios with (PF = 15%) and without (PF = 0) packetfailure are compared in Fig. 14 by simulation. The simulationenvironment is similar to that of Figs. 11 to 13 except thatthe illumination data loss event is simulated. Moreover, oneinstantaneous sample per 5 minutes is extracted and plottedfrom all simulated illumination data points. According to Fig.14, packet loss in WSNs may lead to misses of tuning off
0278-0046 (c) 2013 IEEE. Personal use is permitted, but republication/redistribution requires IEEE permission. Seehttp://www.ieee.org/publications_standards/publications/rights/index.html for more information.
This article has been accepted for publication in a future issue of this journal, but has not been fully edited. Content may change prior to final publication. Citation information: DOI10.1109/TIE.2014.2379586, IEEE Transactions on Industrial Electronics
IEEE TRANSACTIONS ON INDUSTRIAL ELECTRONICS 8
Fig. 15. System block diagram.
lamps for saving power or turning on lamps for satisfying theminimum illumination requirement of 500 lux. Therefore, con-structing a reliable data gathering and communication networksuch as the proposed WSN+PLC for the home automationcontrol system is extremely required.
IV. IMPLEMENTATION OF PROTOTYPE OF PROPOSEDSMART HOME CONTROL NETWORK
A. System Block Diagram
The block diagram of the smart home control system iscomposed of three parts – data collection, communication,and appliance control, as shown in Fig. 15. Data collectionis realized using WSNs. The information thus obtained is sentby the WSN, and relayed by the PLC and the IP network tothe management station. After the environmental informationis received, the management station determines the states ofall home appliances to optimize the power consumption. Sub-sequently, the management station sends control commands torenew the states of all home appliances via the PLC.
The proposed architecture, described above, simplifies theoptimization problem of node placement in WSNs and mit-igates the impact of wireless interference. Furthermore, thePLC/IP gateway, which connects the PLC and the IP networks,enables Internet access for remote monitoring of the smarthome network and control of it in real time. Additionally, theproposed architecture is highly scalable since several PLC/IPgateways can be connected to the management station to ex-tend the smart home control network, as shown in Fig. 15. Themajor tasks in constructing the proposed smart home controlsystem include integrating the WSN coordinator with the PLCtransceiver and integrating each home appliance switch withthe PLC transceiver. Related electronic components that arerequired in constructing a smart home control network aredescribed in subsequent subsections.
B. PL 3120 Smart Transceiver
To counteract the impact of background noise in PLCs, thePL 3120 chip [23] is used as the PLC module herein. The PL3120 smart transceiver is used for the following reasons. First,the PL 3120 smart transceiver uses narrow-band signalingand thus has the ability to communicate across transformers.This transceiver employs a dual-carrier frequency signalingtechnology and can automatically switch to the secondary
communication frequency whenever the primary frequencyis blocked by noise. In the worst case, the PL 3120 smarttransceiver can retransmit data up to three times to ensurethat the data are received correctly. Second, the PL 3120smart transceiver uses a variant of the p-persistent CSMAMAC (Medium Access Control) protocol that is called thepredictive p-persistent CSMA. Unlike the original CSMA,the predictive p-persistent CSMA protocol is dedicated tonetwork control applications and generally operates on shortdata packets under bursty traffic conditions. When the networkis idle, all devices can transmit randomly over a minimum 16-slot period, which is called the randomizing window. As thenetwork load increases, the randomizing window increases bya factor of a, where a ranges from 1 to 63.
The PL 3120 transceiver uses a wide power supply range(+8.5 to +18VDC) and supports very low receive mode currentconsumption. Additionally, if during transmission the powersupply voltage falls to a level that is insufficient to ensurereliable signaling, the transceiver stops transmitting until thepower supply voltage rises to an acceptable level. Thesefeatures allow the use of a power supply with a smallercurrent capacity required, yielding a reduction in the size,cost, and thermal dissipation of the power supply. However,since the input of the power supply is connected directly tothe communication channel, a power supply may attenuatethe communication signal and couple noise into the PLCtransceiver. To preserve the full communications capability ofthe PLC transceiver, it is important to ensure that the powersupply does not impair communication performance. Several“pre-verified” power supply options given in the data book ofPL 3120 [23] can be considered. The power consumption ofthe used PLC module in this work is less than 7.5W.
To control home appliances via the PLC, each home appli-ance switch must be integrated with a PLC transceiver. ThePL 3120 transceiver provides twelve I/O pins which can beconfigured to operate in one or more of 38 predefined standardinput/output modes [23]. Hence, there is no difficulty to enableit to interface with application circuits and home applianceswitches using a small number of inexpensive componentssuch as resistors and capacitors.
C. CC2530 ZigBee Devices
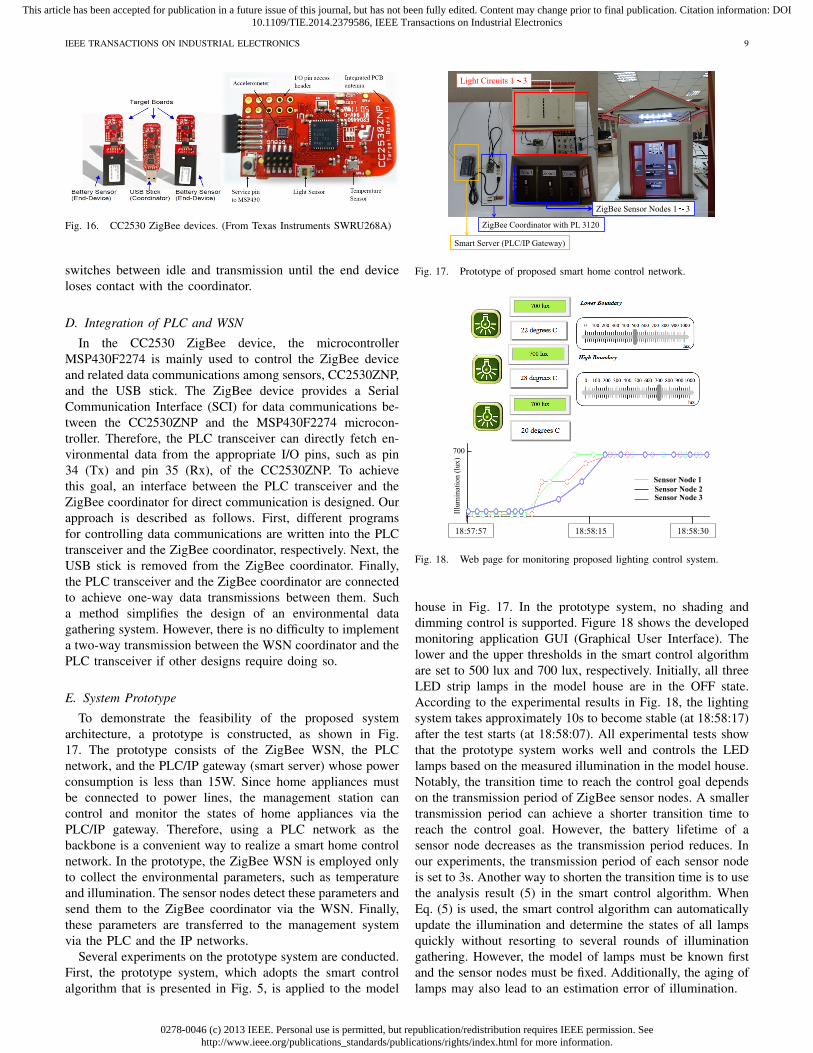
In this work, the CC2530 ZigBee Network Processor (ZNP)[41], displayed in Fig. 16, is used to collect environmentalinformation. CC2530ZNP supports several sensors, such astemperature, light, and motion sensors. The target board thatis connected to the USB stick can be programmed with acoordinator sample application to become a WSN coordinator.The coordinator can set up the entire WSN network andconfigure related parameters.
Each isolated WSN system can have a single coordinator.The coordinator initially sets the beacon signals to coordinateall nodes in the WSN. If the end device cannot receive orrecognize the beacon signals, then it asks the coordinator totry again. After the end device has successfully communicatedwith the coordinator, it stays awake and sends data in amanner determined by the timer. The state of the system then
0278-0046 (c) 2013 IEEE. Personal use is permitted, but republication/redistribution requires IEEE permission. Seehttp://www.ieee.org/publications_standards/publications/rights/index.html for more information.
This article has been accepted for publication in a future issue of this journal, but has not been fully edited. Content may change prior to final publication. Citation information: DOI10.1109/TIE.2014.2379586, IEEE Transactions on Industrial Electronics
IEEE TRANSACTIONS ON INDUSTRIAL ELECTRONICS 9
Fig. 16. CC2530 ZigBee devices. (From Texas Instruments SWRU268A)
switches between idle and transmission until the end deviceloses contact with the coordinator.
D. Integration of PLC and WSN
In the CC2530 ZigBee device, the microcontrollerMSP430F2274 is mainly used to control the ZigBee deviceand related data communications among sensors, CC2530ZNP,and the USB stick. The ZigBee device provides a SerialCommunication Interface (SCI) for data communications be-tween the CC2530ZNP and the MSP430F2274 microcon-troller. Therefore, the PLC transceiver can directly fetch en-vironmental data from the appropriate I/O pins, such as pin34 (Tx) and pin 35 (Rx), of the CC2530ZNP. To achievethis goal, an interface between the PLC transceiver and theZigBee coordinator for direct communication is designed. Ourapproach is described as follows. First, different programsfor controlling data communications are written into the PLCtransceiver and the ZigBee coordinator, respectively. Next, theUSB stick is removed from the ZigBee coordinator. Finally,the PLC transceiver and the ZigBee coordinator are connectedto achieve one-way data transmissions between them. Sucha method simplifies the design of an environmental datagathering system. However, there is no difficulty to implementa two-way transmission between the WSN coordinator and thePLC transceiver if other designs require doing so.
E. System Prototype
To demonstrate the feasibility of the proposed systemarchitecture, a prototype is constructed, as shown in Fig.17. The prototype consists of the ZigBee WSN, the PLCnetwork, and the PLC/IP gateway (smart server) whose powerconsumption is less than 15W. Since home appliances mustbe connected to power lines, the management station cancontrol and monitor the states of home appliances via thePLC/IP gateway. Therefore, using a PLC network as thebackbone is a convenient way to realize a smart home controlnetwork. In the prototype, the ZigBee WSN is employed onlyto collect the environmental parameters, such as temperatureand illumination. The sensor nodes detect these parameters andsend them to the ZigBee coordinator via the WSN. Finally,these parameters are transferred to the management systemvia the PLC and the IP networks.
Several experiments on the prototype system are conducted.First, the prototype system, which adopts the smart controlalgorithm that is presented in Fig. 5, is applied to the model
Fig. 17. Prototype of proposed smart home control network.
Fig. 18. Web page for monitoring proposed lighting control system.
house in Fig. 17. In the prototype system, no shading anddimming control is supported. Figure 18 shows the developedmonitoring application GUI (Graphical User Interface). Thelower and the upper thresholds in the smart control algorithmare set to 500 lux and 700 lux, respectively. Initially, all threeLED strip lamps in the model house are in the OFF state.According to the experimental results in Fig. 18, the lightingsystem takes approximately 10s to become stable (at 18:58:17)after the test starts (at 18:58:07). All experimental tests showthat the prototype system works well and controls the LEDlamps based on the measured illumination in the model house.Notably, the transition time to reach the control goal dependson the transmission period of ZigBee sensor nodes. A smallertransmission period can achieve a shorter transition time toreach the control goal. However, the battery lifetime of asensor node decreases as the transmission period reduces. Inour experiments, the transmission period of each sensor nodeis set to 3s. Another way to shorten the transition time is to usethe analysis result (5) in the smart control algorithm. WhenEq. (5) is used, the smart control algorithm can automaticallyupdate the illumination and determine the states of all lampsquickly without resorting to several rounds of illuminationgathering. However, the model of lamps must be known firstand the sensor nodes must be fixed. Additionally, the aging oflamps may also lead to an estimation error of illumination.

0278-0046 (c) 2013 IEEE. Personal use is permitted, but republication/redistribution requires IEEE permission. Seehttp://www.ieee.org/publications_standards/publications/rights/index.html for more information.
This article has been accepted for publication in a future issue of this journal, but has not been fully edited. Content may change prior to final publication. Citation information: DOI10.1109/TIE.2014.2379586, IEEE Transactions on Industrial Electronics
IEEE TRANSACTIONS ON INDUSTRIAL ELECTRONICS 10
0
250
500
750
1000
0 10 20 30 40 50 60 70 80 90 100 110 120
Illu
min
ati
on (
lux)
t (sec)
Node 3Node 2Node 1
(a)
0
250
500
750
1000
0 10 20 30 40 50 60 70 80 90 100 110 120
Illu
min
ati
on (
lux)
t (sec)
Node 3Node 2Node 1
(b)
Fig. 19. Experimental results concerning proposed smart lighting controlalgorithm on a (a) rainy day, (b) cloudy day.
Subsequently, the experimental environment is changedfrom the model house to the classroom. In the classroom, thelighting system includes three lighting circuits, Circuits 1 to3. Each lighting circuit consists of a column of lamps and iscontrolled by an independent switch. Circuit 1 and Circuit 3are the farthest and the nearest to the windows, respectively.Three sensor nodes are equally spaced in the classroom todetect the illumination levels of locations near the windowsand that far away from them.
Figure 19(a) shows the results of an experiment about theoperation of the proposed smart lighting control algorithm ona rainy day. According to the results, the system may oscillateand need a transition period to become stable. Initially, allcircuits are in the OFF state. Thus, the illumination at eachsensor node is below L (500 lux). Accordingly, the smartcontrol algorithm immediately turns ON Circuit 1. A similarprocess is performed for Circuit 2. Since the illumination ofNode 3 is still less than 500 lux, Circuit 3 is also turned ONat t = 9s after the experiment starts. Thus, the illuminationlevels at all nodes exceed L. However, the illumination atNode 3 now exceeds H (700 lux), so the system turns OFFCircuit 3, causing the illumination at Node 3 to fall to below500 lux. The smart control algorithm in Fig. 5 returns tothe state, “Find Min lux and its position p∗”, to ensurethat the illumination levels at all nodes meet the minimumillumination requirement. Therefore, Circuit 3 is turned ON
and the illumination at Node 3 is larger than H again. Since theparameter Count equals 1 at this moment, the smart controlalgorithm enters the state “Delay T ”. Now, all circuits areON and the lighting system is stable. Since the parameterT is set to 60s in this experiment, the algorithm leaves thestate “Delay T ” and restarts the procedure after about 60s.To effectively eliminate the oscillation phenomenon and savemore energy, the lighting system must support the dimmingfunction. If the lighting system does not support the dimmingfunction, then a longer delay T such as 10 minutes can beconsidered or the hysteresis condition Max > L+∆, where∆ is the illumination contribution by a lighting circuit, can beadded into the proposed smart lighting control algorithm toavoid the oscillation phenomenon.
Another experiment is conducted at the same classroom ona cloudy day. Figure 19(b) displays the experimental results.Initially, all circuits are in the OFF state and the illuminationlevels at Nodes 1 and 2 are below L (500 lux) while that ofNode 3 is over H (700 lux). Hence, according to the smartcontrol algorithm, only Circuits 1 and 2 are turned ON. IfCircuit 3 is turned ON, the illumination of Node 3 reachesabout 1500 lux. Obviously, turning ON Circuit 3 wastes energyand increases the tiredness felt in people’s eyes. Therefore, asmart control system must ensure that the illumination levelsat all positions exceed the minimum requirement while savingenergy. All experiments conducted above demonstrate thatboth the prototype system and the proposed smart controlalgorithm work correctly and perform well, no matter whatthe weather is.
To understand the communication performance of the proto-type system, the packet delay and reliability are also measured.Three sensor nodes are evenly spaced in our Lab and thePLC+C coordinator is located at the center of our Lab.Each sensor node transmits one packet every 3s and thepayload of each packet only includes the sequence numberand illumination information. Packets are originated by sensornodes and then traverse the WSN link, the power line and theIP network to the management station. To measure the end-to-end packet delay, one sensor node is connected to a PC via theUSB port to capture the sending time of a packet. Packets fromthe other two sensor nodes can be viewed as the backgroundtraffic for contention. Packets finally arrive at the managementstation and their arrival times can be recorded. Subsequently,the packet delay and reliability can be evaluated. Before themeasurement, the clocks of the PC and the management stationmust be synchronized using the NTP (Network Time Protocol)program or the IEEE 1588 Precision Time Protocol (PTP).Table II shows the measurement results. According to Table
TABLE IICOMMUNICATION PERFORMANCE.
Total Number of Packets Transmitted 1061
Packet Reliability Number of Success 1052Packet Failure Rate PF 0.8%
End-to-EndPacket Delay
Minimum 46 msMaximum 135 msAverage 75 ms
Standard Deviation 16 ms
0278-0046 (c) 2013 IEEE. Personal use is permitted, but republication/redistribution requires IEEE permission. Seehttp://www.ieee.org/publications_standards/publications/rights/index.html for more information.
This article has been accepted for publication in a future issue of this journal, but has not been fully edited. Content may change prior to final publication. Citation information: DOI10.1109/TIE.2014.2379586, IEEE Transactions on Industrial Electronics
IEEE TRANSACTIONS ON INDUSTRIAL ELECTRONICS 11
II, the packet failure rate is about 0.8% and the averageend-to-end packet delay is about 75ms. Since the packet isshort and the network propagation delay is usually less than amicrosecond in a smart home environment, the packet delayis mainly incurred by the MAC protocols of the WSN and thePLC.
V. CONCLUSIONS
This work has designed a novel network architecture anda smart lighting control algorithm for smart homes. Theproposed smart home control network employs the PLC asthe network backbone and the WSN for data sensing. Theproposed network infrastructure possesses the advantages ofboth WSNs and PLCs. It simplifies the problem of setting uprelay nodes in WSNs and mitigates the impact of wirelessinterference. It is also highly scalable and can be appliedto intelligent buildings. A prototype of the proposed smarthome control network with the smart lighting control wasimplemented. Simulations and practical experiments were con-ducted to demonstrate that the implemented prototype systemworks well and that the proposed smart home control networkprovides an outstanding packet failure rate and considerableenergy saving. Although numerical results have shown thatthe energy saving ratio in lighting is good, control of otherhome appliances, such as HVAC&R, must also be consideredin future work to save more electrical energy.
To fulfill the proposed solution in existing homes or build-ings, some installation costs may be induced. For example,the cost of a digital switch with PLC module is about severaltens of US dollars. As to the cost of a ZigBee device, it maybe down to several US dollars. The most expensive equipmentin the proposed solution is the smart server (PLC/IP gateway)which costs about several hundreds of US dollars. However,since a smart server can manage up to hundreds of devices, itis enough to use only one smart server for controlling lightingsystems and home appliances in a home or a small building.Therefore, compared with the cost saving on electricity inthe long term, the induced installation cost in the proposedsolution is relatively low.
APPENDIX AANALYSIS OF ILLUMINATION OF FLUORESCENT LAMP
According to Eq. (2), the illumination by the fluorescentlamp is rewritten as follows.
EP1(lamp) =
ϕ|z0 − z1|4π
×∫ x0+Γ/2
x0−Γ/2
[(x− x1)
2 + (y0 − y1)2 + (z0 − z1)
2]− 3
2 dx. (9)
Changing variables u = x − x1, A = y0 − y1, B = z0 − z1,and C = ϕ|z0−z1|
4π , yields the illumination by the fluorescentlamp as
EP1(lamp) = C
∫ x0−x1+Γ/2
x0−x1−Γ/2
(u2 +A2 +B2
)− 32 du. (10)
Next, considering the case that x0 − x1 − Γ/2 ≥ 0 and x0 −x1 + Γ/2 ≥ 0, let u =
√A2+B2
v2−1 , v0 =√1 + A2+B2
(x0−x1−Γ/2)2 ,
and v1 =√1 + A2+B2
(x0−x1+Γ/2)2 ; the definite integral in (10) cannow be rearranged as follows.
EP1(lamp) = −C
∫ v1
v0
[(A2 +B2)v2
v2 − 1
]− 32 v
√A2 +B2
3√v2 − 1
dv
=−C
A2 +B2
∫ v1
v0
v−2dv
=C
A2 +B2
(1
v1− 1
v0
). (11)
Because (u2 +A2 +B2)−32 in (10) is an even function of u,
for the case that x0 − x1 − Γ/2 < 0 and x0 − x1 + Γ/2 < 0,one can show that
EP1(lamp) =C
A2 +B2
(1
v0− 1
v1
). (12)
For the case that x0 − x1 − Γ/2 < 0 and x0 − x1 +Γ/2 ≥ 0,one can show that
EP1(lamp) =C
A2 +B2
(1
v0+
1
v1
). (13)
Finally, substituting the parameters A, B, C, v0 and v1 intoEqs. (11)-(13), yields Eq. (5) no matter what the values ofx0 − x1 − Γ/2 and x0 − x1 + Γ/2 are.
ACKNOWLEDGMENT
This work was supported by Ministry of Science and Tech-nology of Taiwan under Grants NSC100-2221-E-182-068 andNSC102-2221-E-182-002-MY2. We would also like to thankour colleagues, Profs. Shin-Yeu Lin and Woei-Luen Chen, andthe anonymous reviewers for their valuable comments andsuggestions that have significantly improved the quality of thispaper.
REFERENCES
[1] R. Missaoui, H. Joumaa, S. Ploix, and S. Bacha, “Managing energysmart homes according to energy prices: Analysis of a building energymanagement system,” Energy Build., vol. 71, pp. 155-167, Mar. 2014.
[2] C. Molitor, A. Benigni, A. Helmedag, K. Chen, D. Cal, P. Jahangiri,D. Mller, and A. Monti, “Multiphysics test bed for renewable energysystems in smart homes,” IEEE Trans. Ind. Electron., vol. 60, no. 3, pp.1235-1248, Mar. 2013.
[3] D. M. Han and J. H. Lim, “Smart home energy management system usingIEEE 802.15.4 and Zigbee,” IEEE Trans. Consum. Electron., vol. 56, no.3, pp.1403-1410, Aug. 2010.
[4] C. Suh and Y.-B. Ko, “Design and implementation of intelligent homecontrol systems based on active sensor networks,” IEEE Trans. Consum.Electron., vol. 54, no. 3, pp. 1177-1184, Aug. 2008.
[5] J. Byun, B. Jeon, J. Noh, Y. Kim, and S. Park, “An intelligent self-adjusting sensor for smart home services based on ZigBee communica-tions,” IEEE Trans. Consum. Electron., vol. 58, no. 3, pp. 794-802, Aug.2012.
[6] H. Wang and J. Wang, “Design and implementation of a smart homebased on WSN and AMR,” Applied Mechanics and Materials, vol. 271,no. PART 1, pp. 1485-1489, 2013.
[7] J. M. Wang and H. B. Wei, “Design of smart home management systembased on GSM and Zigbee,” Advanced Materials Research, vol. 842, pp.703-707, 2014.
[8] K. Gill, S. H. Yang, F. Yao, and X. Lu, “A ZigBee-based home automationsystem,” IEEE Trans. Consum. Electron., vol. 55, no. 2, pp. 422-430, May2009.
[9] W. Liu and Y. Yan, “Application of ZigBee wireless sensor network insmart home system,” Int. J. of Advancements in Computing Technol., vol.3, no. 5, pp. 154-160, Jun. 2011.

0278-0046 (c) 2013 IEEE. Personal use is permitted, but republication/redistribution requires IEEE permission. Seehttp://www.ieee.org/publications_standards/publications/rights/index.html for more information.
This article has been accepted for publication in a future issue of this journal, but has not been fully edited. Content may change prior to final publication. Citation information: DOI10.1109/TIE.2014.2379586, IEEE Transactions on Industrial Electronics
IEEE TRANSACTIONS ON INDUSTRIAL ELECTRONICS 12
[10] V. C. Gungor, B. Lu, and G. P. Hancke, “Opportunities and challengesof wireless sensor networks in smart grid,” IEEE Trans. Ind. Electron.,vol. 57, no. 10, pp. 3557-3564, Oct. 2010.
[11] X. Cao, J. Chen, Y. Xiao, and Y. Sun, “Building-environment controlwith wireless sensor and actuator networks: Centralized versus dis-tributed,” IEEE Trans. Ind. Electron., vol. 57, no. 11, pp. 3596-3605,Nov. 2010.
[12] M. Magno, D. Boyle, D. Brunelli, B. OFlynn, E. Popovici, and L. Benini,“Extended wireless monitoring through intelligent hybrid energy supply,”IEEE Trans. Ind. Electron., vol. 61, no. 4, pp. 1871-1881, Apr. 2014.
[13] S. D. T. Kelly, N. K. Suryadevara, and S. C. Mukhopadhyay, “Towardsthe implementation of IoT for environmental condition monitoring inhomes,” IEEE Sens. J., vol. 13, no. 10, pp. 3846-3853, Oct. 2013.
[14] D. Dietrich, D. Bruckner, G. Zucker, and P. Palensky, “Communicationand computation in buildings: A short introduction and overview,” IEEETrans. Ind. Electron., vol. 57, no. 11, pp. 3577-3584, Nov. 2010.
[15] R. Kavitha, G. M. Nasira, and N. Nachamai, “Smart home systems usingwireless sensor network– A comparative analysis,” Int. J. of ComputerEng. & Technol., vol. 3, no. 3, pp. 94-103, 2012.
[16] J. Li, L. H. Andrew, C. H. Foh, M. Zukerman, and H. H. Chen,“Connectivity, coverage and placement in wireless sensor networks,”Sensors, vol. 9, no. 10, pp. 7664-7693, 2009.
[17] D. Yang, Y. Xu, and M. Gidlund, “Wireless coexistence betweenIEEE 802.11- and IEEE 802.15.4-based networks: A survey,” Int. J. ofDistributed Sensor Netw., vol. 2011, Article ID 912152, 17 pages, 2011.DOI:10.1155/2011/912152
[18] L. Angrisani, M. Bertocco, D. Fortin, and A. Sona, “Experimental studyof coexistence issues between IEEE 802.11b and IEEE 802.15.4 wirelessnetworks,” IEEE Trans. Instrum. Meas., vol. 57, no. 8, pp. 1514-1523,Aug. 2008.
[19] L. Tytgat, O. Yaron, S. Pollin, I. Moerman, and P. Demeester, “Analysisand experimental verification of frequency-based interference avoidancemechanisms in IEEE 802.15.4,” IEEE/ACM Trans. Netw., Article in Press,2014. DOI: 10.1109/TNET.2014.2300114
[20] X. Zhang and K. G. Shin, “Gap Sense: Lightweight coordination ofheterogeneous wireless devices,” in Proc. IEEE INFOCOM’13, Apr.2013, pp. 3093-3101.
[21] Website of X10. Available: http://www.x10.com/[22] EIA Home Automation System (CEBus) Interim Standard IS-60, 1992.[23] Website of Echelon. Available: http://www.echelon.com/[24] Website of HomePlug Alliance, Resources & White Papers/HomePlug
AV White Paper, 2013. Available: http://www.homeplug.org/home/[25] A. A. Amarsingh, H. A. Latchman, and D. Yang, “Narrowband power
line communications: Enabling the smart grid,” IEEE Potentials Mag.,vol. 33, no. 1, pp. 16-21, Jan./Feb. 2014.
[26] Y. J. Lin, H.A. Latchman, M. Lee, and S. Katar, “A power linecommunication network infrastructure for the smart home,” IEEE Trans.Wireless Commun., vol. 9, no. 6, pp. 104 -111, Dec. 2002.
[27] V. Degardin, K. Kilani, L. Kone, M. Lienard, and P. Degauque, “Fea-sibility of a high bit rate power line communication between an inverterand a motor,” IEEE Trans. Ind. Electron., vol. 61, no. 9, pp. 4816-4823,Sep. 2014.
[28] A. Al-Mulla and A. Elsherbini, “Demand management through cen-tralized control system using power line communication for existingbuildings,” Energy Conv. Manag., vol. 79, pp. 477-486, Mar. 2014.
[29] L. J. Qin, Z. Z. Shen, and F. Jiao, “Intelligent streetlight energy-savingsystem based on LonWorks power line communication technology,” inProc. Int. Conf. on Electric Utility Deregulation and Restructuring andPower Technol. (DRPT), Jul. 2011, pp. 663-667.
[30] INSTEON Technology, Whitepaper: The details, v. 2.0, 2005-2013,Available: http://www.insteon.net/pdf/insteondetails.pdf
[31] P. Ihm, A. Nemri, and M. Krarti, “Estimation of lighting energy savingsfrom daylighting,” Build. Environ., vol. 44, no. 3, pp. 509-514, Mar. 2009.
[32] B. Sun, P.B. Luh, Q.-S. Jia, Z. Jiang, F. Wang, and C. Song, “Buildingenergy management: Integrated control of active and passive heating,cooling, lighting, shading, and ventilation systems,” IEEE Trans. Autom.Sci. Eng., vol. 10, no. 3, pp. 588-602, Jul. 2013.
[33] G. Parise and L. Martirano, “Daylight impact on energy performanceof internal lighting,” IEEE Trans. Ind. Appl., vol. 49, no. 1, pp. 242-249,Jan./Feb. 2013.
[34] I. A. Zualkernan , A. R. Al-Ali , M. A. Jabbar , I. Zabalawi, and A.Wasfy, “InfoPods: Zigbee-based remote information monitoring devicesfor smart-homes,” IEEE Trans. Consum. Electron., vol. 55, no. 3, pp.1221-1226, Aug. 2009.
[35] Y. Lin, R. Kong, R. She, and S. Deng, “Design and implementation ofremote/short-range smart home monitoring system based on ZigBee andSTM32,” Research J. of Applied Sciences, Eng. and Technol., vol. 5, no.9, pp. 2792-2798, Jan. 2013.
[36] J. Hu and W. Zhang, “Design of remote intelligent home system basedon ZigBee and GPRS technology,” in Proc. 2nd Int. Conf. on Consum.Electron., Commun. and Netw. (CECNet), Apr. 2012, pp. 264-267.
[37] G. J. Kim, C. S. Jang, C. H. Yoon, S. J. Jang, and J. W. Lee, “Theimplementation of smart home system based on 3G and ZigBee inwireless network systems,” Int. J. of Smart Home, vol. 7, no. 3, pp. 311-320, May 2013.
[38] Lighting of Indoor Work Places, 1st Edition, ISO 8995-1:2002(E), May2002.
[39] C.-A. Cheng, H.-L. Cheng, K.-J. Lin, E.-C. Chang, and C.-H. Yen,“Implementation of a digitally dimming controlled lighting system fortwo-area fluorescent lamps,” in Proc. 5th IEEE Conf. on Ind. Electron.and Appl. (ICIEA 2010), 15-17 Jun., 2010, pp. 2281-2286.
[40] Philips TL-D LIFEMAX Super 80 18w/865 fluorescent lamp.Available: http://www.ecat.lighting.philips.com/
[41] CC2530 Datasheet. A true system-on-chip solution for 2.4-GHz IEEE802.15.4 and ZigBee applications (Rev. B), Texas Instruments, Dallas,TX, Feb. 2011.
Mingfu Li received the B.S. and Ph. D. degrees inelectrical engineering from National Taiwan Univer-sity in 1991 and 1998, respectively.
From 1998 to 2003, he worked as an associateresearcher in the Telecommunication Laboratoriesat Chunghwa Telecom Co., Ltd., Tao-Yuan, Taiwan,where he investigated related techniques on time andfrequency synchronization. From 2004 to 2005, heworked as an associated engineer in the MultimediaDepartment of Northern Taiwan Business Group,Chunghwa Telecom Co., Ltd., and was responsible
for the construction of Multimedia-On-Demand (MOD) system or interactiveIPTV system. Since 2006, he has been a faculty member of ElectricalEngineering at Chang Gung University, Tao-Yuan, Taiwan, R.O.C., where heis currently an Associate Professor. His research interests include multimedianetworks, digital right management (DRM), wireless networks, mobile IPTV,network synchronization and smart home systems.
Hung-Ju Lin received the B.S and M.S. degrees inelectrical engineering from College of Engineering,Chang Gung University, Tao-Yuan, Taiwan, R.O.C.in 2010 and 2014, respectively.
Since 2014, he has been an engineer of TaiwanPower Company. His research interests include theelectronic circuits, wireless sensor networks, powerline communications and smart home control sys-tems.