How to distinguish elastically scattered light from Stokes shifted light ...
Upload
truongkhuongCategory
view
213download
0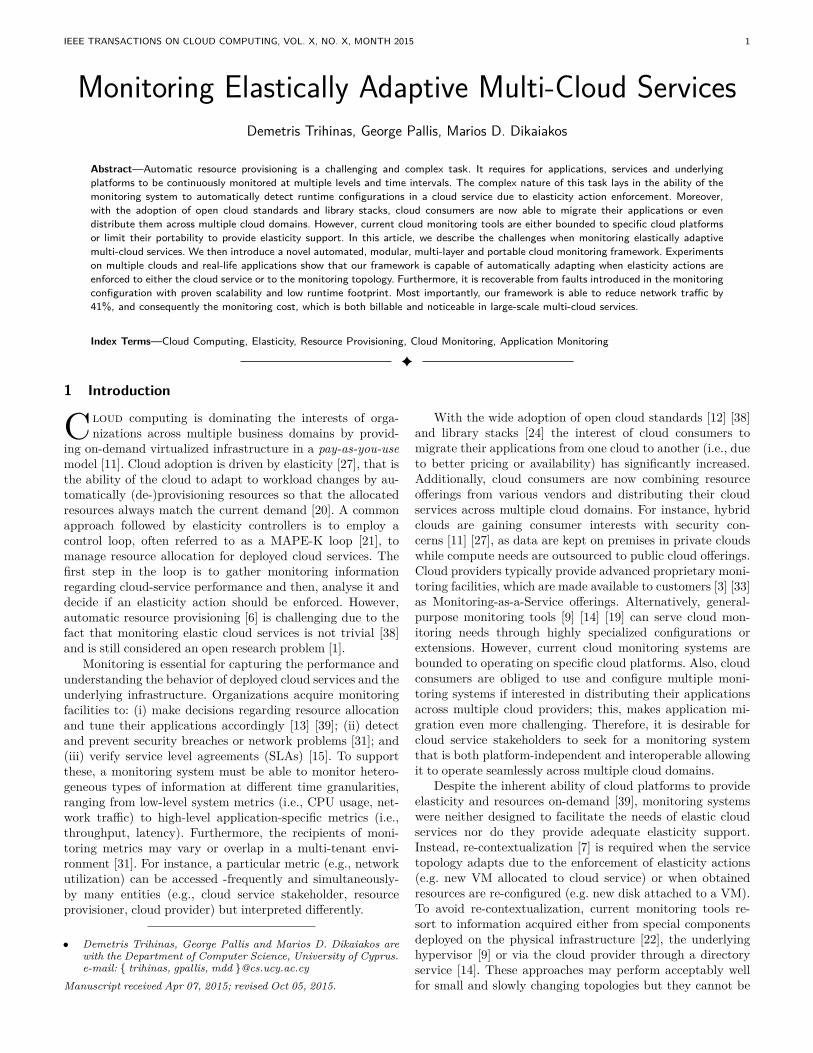
IEEE TRANSACTIONS ON CLOUD COMPUTING, VOL. X, NO. X, MONTH 2015 1
Monitoring Elastically Adaptive Multi-Cloud ServicesDemetris Trihinas, George Pallis, Marios D. Dikaiakos
Abstract—Automatic resource provisioning is a challenging and complex task. It requires for applications, services and underlyingplatforms to be continuously monitored at multiple levels and time intervals. The complex nature of this task lays in the ability of themonitoring system to automatically detect runtime configurations in a cloud service due to elasticity action enforcement. Moreover,with the adoption of open cloud standards and library stacks, cloud consumers are now able to migrate their applications or evendistribute them across multiple cloud domains. However, current cloud monitoring tools are either bounded to specific cloud platformsor limit their portability to provide elasticity support. In this article, we describe the challenges when monitoring elastically adaptivemulti-cloud services. We then introduce a novel automated, modular, multi-layer and portable cloud monitoring framework. Experimentson multiple clouds and real-life applications show that our framework is capable of automatically adapting when elasticity actions areenforced to either the cloud service or to the monitoring topology. Furthermore, it is recoverable from faults introduced in the monitoringconfiguration with proven scalability and low runtime footprint. Most importantly, our framework is able to reduce network traffic by41%, and consequently the monitoring cost, which is both billable and noticeable in large-scale multi-cloud services.
Index Terms—Cloud Computing, Elasticity, Resource Provisioning, Cloud Monitoring, Application Monitoring
F
1 Introduction
Cloud computing is dominating the interests of orga-nizations across multiple business domains by provid-
ing on-demand virtualized infrastructure in a pay-as-you-usemodel [11]. Cloud adoption is driven by elasticity [27], that isthe ability of the cloud to adapt to workload changes by au-tomatically (de-)provisioning resources so that the allocatedresources always match the current demand [20]. A commonapproach followed by elasticity controllers is to employ acontrol loop, often referred to as a MAPE-K loop [21], tomanage resource allocation for deployed cloud services. Thefirst step in the loop is to gather monitoring informationregarding cloud-service performance and then, analyse it anddecide if an elasticity action should be enforced. However,automatic resource provisioning [6] is challenging due to thefact that monitoring elastic cloud services is not trivial [38]and is still considered an open research problem [1].
Monitoring is essential for capturing the performance andunderstanding the behavior of deployed cloud services and theunderlying infrastructure. Organizations acquire monitoringfacilities to: (i) make decisions regarding resource allocationand tune their applications accordingly [13] [39]; (ii) detectand prevent security breaches or network problems [31]; and(iii) verify service level agreements (SLAs) [15]. To supportthese, a monitoring system must be able to monitor hetero-geneous types of information at different time granularities,ranging from low-level system metrics (i.e., CPU usage, net-work traffic) to high-level application-specific metrics (i.e.,throughput, latency). Furthermore, the recipients of moni-toring metrics may vary or overlap in a multi-tenant envi-ronment [31]. For instance, a particular metric (e.g., networkutilization) can be accessed -frequently and simultaneously-by many entities (e.g., cloud service stakeholder, resourceprovisioner, cloud provider) but interpreted differently.
• Demetris Trihinas, George Pallis and Marios D. Dikaiakos arewith the Department of Computer Science, University of Cyprus.e-mail: { trihinas, gpallis, mdd }@cs.ucy.ac.cy
Manuscript received Apr 07, 2015; revised Oct 05, 2015.
With the wide adoption of open cloud standards [12] [38]and library stacks [24] the interest of cloud consumers tomigrate their applications from one cloud to another (i.e., dueto better pricing or availability) has significantly increased.Additionally, cloud consumers are now combining resourceofferings from various vendors and distributing their cloudservices across multiple cloud domains. For instance, hybridclouds are gaining consumer interests with security con-cerns [11] [27], as data are kept on premises in private cloudswhile compute needs are outsourced to public cloud offerings.Cloud providers typically provide advanced proprietary moni-toring facilities, which are made available to customers [3] [33]as Monitoring-as-a-Service offerings. Alternatively, general-purpose monitoring tools [9] [14] [19] can serve cloud mon-itoring needs through highly specialized configurations orextensions. However, current cloud monitoring systems arebounded to operating on specific cloud platforms. Also, cloudconsumers are obliged to use and configure multiple moni-toring systems if interested in distributing their applicationsacross multiple cloud providers; this, makes application mi-gration even more challenging. Therefore, it is desirable forcloud service stakeholders to seek for a monitoring systemthat is both platform-independent and interoperable allowingit to operate seamlessly across multiple cloud domains.
Despite the inherent ability of cloud platforms to provideelasticity and resources on-demand [39], monitoring systemswere neither designed to facilitate the needs of elastic cloudservices nor do they provide adequate elasticity support.Instead, re-contextualization [7] is required when the servicetopology adapts due to the enforcement of elasticity actions(e.g. new VM allocated to cloud service) or when obtainedresources are re-configured (e.g. new disk attached to a VM).To avoid re-contextualization, current monitoring tools re-sort to information acquired either from special componentsdeployed on the physical infrastructure [22], the underlyinghypervisor [9] or via the cloud provider through a directoryservice [14]. These approaches may perform acceptably wellfor small and slowly changing topologies but they cannot be
IEEE TRANSACTIONS ON CLOUD COMPUTING, VOL. X, NO. X, MONTH 2015 2
considered in scenarios with large-scale and highly adaptivemulti-cloud services where rapid elasticity is the case and notthe exception.
In this article, we address the above challenges by fo-cusing on the issues that arise when monitoring elasticallyadaptive multi-cloud services. We introduce JCatascopia,an open-source1, fully-automated, multi-layer and platform-independent cloud monitoring framework. JCatascopia runsin a non-intrusive and transparent manner to any underlyingcloud as neither the metric collection process nor metricdistribution and storage are dependent on the underlyingplatform. JCatascopia uses a novel variation of the publishand subscribe communication protocol to dynamically detect,without any human intervention or dependence to the hyper-visor, when monitoring instances have been (de-)provisioneddue to elasticity actions. This diminishes the need for re-contextualization when providing elasticity support, by re-flecting at all time the current topology and resource con-figuration. In addition, JCatascopia provides metric filteringto reduce the communication overhead for metric distributionand storage, and generates high-level application metrics dy-namically by aggregating and grouping low-level metrics.
This article substantially extends our previous work [37],as follows: (i) We extend the JCatascopia communicationprotocol, to accommodate runtime VM re-configuration forhorizontal and vertical elastic scaling (e.g. attach a new IPto VM) and we add the functionality to overcome networkconnectivity problems; (ii) JCatascopia has been re-designedas a modular system and is now capable of being deployedin different elastic monitoring topologies to better suit userand service provider needs; (iii) JCatascopia, as an elasticand self-managed system itself, is now able to automaticallyscale at runtime by an elasticity controller; (iv) We extendthe JCatascopia communication protocol to consider failures,describing how the monitoring topology can automaticallyrecover from faults; also, we showcase how we monitor themonitoring system; (v) Finally, we present an extensive com-parison of our framework to other monitoring tools basedon complex real-life testbeds, deployed on four public andprivate cloud platforms. Results show that the JCatascopiaframework is capable of supporting automated cloud resourceprovisioning systems with proven interoperability, scalability,fault-tolerance and with a small runtime footprint. Mostimportantly, our framework is able to reduce network traf-fic by 41%, and consequently the monitoring cost, which isnoticeable, billable and increases fast in large-scale elastic anddistributed multi-cloud deployments.
The rest of this article is structured as follows: Section 2presents a study of the related work. Section 3 presents the de-sign, architecture and novelties incorporated to JCatascopia.Section 4 presents an evaluation of our system, while Section5 concludes this article and outlines the future work.2 State-of-the-Art & Related WorkCloud specific monitoring tools such as Amazon Cloud-Watch [3], Paraleap AzureWatch [30] and RackSpace Cloud-Kick [33] provide Monitoring-as-a-Service to cloud consumers.Despite the fact that these tools are easy to use and well-integrated with the underlying platform, their biggest disad-vantage is that they are commercial and proprietary which
1. https://github.com/CELAR/cloud-ms
limits their operation to specific cloud providers. Thus, thesetools lack in terms of portability and interoperability. Toaddress portability, Rak et al. [34] introduce the mOSAICcloud monitoring system which collects metrics in a cloud-independent manner via the mOSAIC API. However, thissystem is limited to specific cloud platforms supported by theEU-funded mOSAIC project and is a centralized monitoringapproach intended only for small-scale deployments.
General purpose monitoring tools such as Gan-glia [19], Nagios [26], Zabbix [43] and GridICE [5] are tra-ditionally used by system administrators to monitor fixedor slowly changing distributed infrastructures, such as com-puting grids and clusters. Cloud providers tend to adoptsuch solutions to monitor their platforms as well. However,cloud platforms have different requirements than comput-ing grids [15] [18], as they consist of multiple layers andservice paradigms (IaaS, PaaS, SaaS) providing users withon-demand resources through an infinite pool of virtualresources. This makes the aforementioned monitoring toolsunsuitable for rapidly elastic and dynamic cloud deployments,where VMs are deployed for several minutes on a numberof physical nodes and after a short interval migrate to othernodes or are terminated.
To address the limitations mentioned above, several ap-proaches have been proposed. For example, sFlow integrateswith Ganglia to monitor VM clusters. Xiang et al. [42]introduce VMDriver, which provides an interface to accessmetrics in an OS-independent manner but requires fromthe hypervisor to install a monitoring driver on each guestVM. Montes et al. [25] propose GMonE, a general-purposemonitoring tool applicable to all cloud layers. GMonE allowsmonitoring instances to be deployed at any level of the cloudand provides a pluggable interface where users can inject theirown custom metrics to monitoring agents. However, GMonEcannot detect at runtime service topology changes due toelasticity action enforcement or resource configurations. Quocet al. [32] propose DoLen, a multi-cloud monitoring toolfor distributed cloud services but as a centralized approachit is suitable only for small-scale deployments. Calero etal. [2] introduce MonPaaS, a distributed and agent-less cloudmonitoring solution, where a dedicated monitoring server isallocated per application. MonPaaS is not platform indepen-dent, as it is tightly coupled to Openstack. In addition, whilescalability is claimed, with the use of only one monitoringserver per application, intra-service monitoring is bounded bythe monitoring intensity and number of running instances.
In regards to elasticity, a handful of academic approachesattempt to propose solutions for elasticity support but requirefor special entities at the physical level or depend on the un-derlying hypervisor to detect topology configurations. Thus,these approaches limit their portability at different levels ofthe cloud in favor of elasticity support. Specifically, Carvalhoet al. [14] propose the use of passive checks by each physicalhost to notify the central monitoring server about the virtualinstances that are currently instantiated. Katsaros et al. [22]extend Nagios through the implementation of NEB2REST, aREST event broker utilized to provide elasticity capabilitiesthrough an abstraction layer between monitoring agents andthe management layer. Clayman et al. [9] introduce Lattice,an interesting cloud monitoring framework, which monitorsnot only physical hosts but also virtual instances. Lattice can
IEEE TRANSACTIONS ON CLOUD COMPUTING, VOL. X, NO. X, MONTH 2015 3
be utilized to monitor elastically adaptive environments. Inparticular, the process of determining the existence of newVMs is performed at the hypervisor level. A controller is theresponsible entity for retrieving a list of running VMs fromthe hypervisor, detecting if new VMs have been added orremoved. Thus, in contrast to our solution, while Lattice offerselasticity support it moves the dependency to the hypervisorlayer as it is tightly coupled to Xen hypervisor. In turn, Latticecannot monitor applications distributed across multiple cloudproviders due to its limited multicast network communicationmodel. Moreover, Lattice features an excessive runtime foot-print in contrast to our solution.
Another approach is Panoptes [40], which utilizes apub/sub communication model between agents and servers toenhance private cloud monitoring performance. In contrast toour solution, Panoptes requires a broker (similar to a directoryservice), which acts as a central contact point for newly instan-tiated monitoring agents to: (i) contact and request a list ofavailable monitoring servers; (ii) notify all monitoring serversof their existence, and (iii) wait for monitoring servers tostart the subscription process, which is a significant overheadfor rapidly elastic environments (see Section 3.3.1). Finally,Varanus [41] is an interesting monitoring tool which leveragesa multi-tier P2P architecture to achieve in situ monitoringof the monitoring infrastructure based solely on resourceutilization. However, as we show later, resource utilization isnot always the monitoring bottleneck.
Based on the above, we believe that none of the exist-ing solutions can be considered as a complete approach toprovide elastic multi-cloud monitoring alongside an elasticitycontroller. In addition, although monitoring autonomicityis initially studied, it is still far from being considered asachieved. Therefore, to address the above limitations we havedesigned the JCatascopia multi-cloud monitoring framework.
3 JCatascopia: Design and FeaturesIn this section, we introduce the design, architecture and keyfeatures of JCatascopia.
3.1 Platform Independence and InteroperabilityJCatascopia is an open-source and elastic monitoring frame-work designed to provide cloud-independence and interoper-ability of the monitoring process. Specifically, JCatascopiacan be utilized to monitor: (i) federated cloud environ-ments where cloud services are distributed across multipleclouds [32]; and (ii) cloud bursting environments where cloudservices deployed on a private cloud, burst to a public cloudwhen resource demand increases [35].
JCatascopia achieves platform-independence by satisfy-ing the following requirements. First, its components (i.e.monitoring agents, servers, etc.) are portable, meaning theyare capable of running on any physical machine or VM in-stances. To this end, JCatascopia components are developedin Java with none of their functionality being dependent onOS or machine libraries, with the only requirement being aJava installation (v1.6+). In Sections 3.2.x all JCatascopiacomponents and their features are described in detail. Eachcomponent presents clear Java interfaces and abstractionsfor their features and endpoints. This allows features to becustomizable and extensible, while the clear endpoints (e.g.Metric Interface) allow integration between JCatascopia and
Fig. 1: JCatascopia Abstract Architecture
other systems (e.g. elasticity controller). For example, theMonitoring Database Interface (see Section 3.2.4) is extensibleto allow developers or systems to utilize the metric storagebackend of their choice via the Database Interface endpoint.
Second, its metric collection process is not dependent oncloud provider APIs or OS libraries. JCatascopia is designedto provide multi-level cloud monitoring and is capable ofcollecting heterogeneous metrics of different granularity acrossmultiple levels of the cloud. Specifically, system-level metriccollection, such for CPU, memory, disk and network utiliza-tion, is handled via the Java runtime management interface2,so that metric collection does not pass directly through OS-dependent endpoints (e.g. /proc/* for UNIX). Nonetheless,users are free to create OS-dependent metric collectors via itsJava API. Moreover, JCatascopia is enhanced with a metricrule mechanism, which allows developers or cloud entities(e.g. elasticity controller) to request for aggregated metricsor to compose high-level metrics from low-level metrics via adirective-based language introduced in Section 3.5.
Third, the communication between monitoring compo-nents, especially in the case of elasticity support, is capableof being handled over a mixture of networks and is notdependent on any cloud provider services or brokers. Incontrast to other self-adaptive general-purpose monitoringtools [9] [14] [22], JCatascopia provides fully-automated elas-ticity support. Neither special entities deployed on physicalnodes nor information from the hypervisor or any other cen-tral repository regarding the current running virtual instancesare required. In Section 3.3, we present a mechanism basedon a variation of the pub/sub protocol to dynamically detectat runtime elasticity action enfocement. In Section 3.4, wedescribe how the monitoring topology is automatically re-configured in the presence of network failures or when mon-itoring servers are (de-)provisioned. We embrace the ZMQmessage framework3 to implement the JCatascopia communi-cation mechanism which is built on top of ZMQ sockets. Thesesockets provide JCatascopia with abstract asynchronous mes-sage queues over public and private network interfaces formultiple messaging patterns. Unlike other message orientedmiddleware, ZMQ sockets run without a dedicated messagebroker. This is important since JCatascopia is designed as abrokerless and completely de-centralized system. Moreover,ZMQ allows JCatascopia to maintain its portability as theZMQ Java bindings are OS-independent.
2. Java runtime management interface: goo.gl/WLIhdT3. ZMQ Java library: https://github.com/zeromq/jeromq

IEEE TRANSACTIONS ON CLOUD COMPUTING, VOL. X, NO. X, MONTH 2015 4
3.2 Architecture and ComponentsFigure 1 depicts an abstract overview of JCatascopia moni-toring framework architecture. JCatascopia follows an agent-based, producer-consumer architectural approach. Specifically,metric collectors, named Monitoring Probes (Section 3.2.1),gather metrics from the cloud element they reside on (e.g.VM or physical node) and performance metrics from deployedcloud services. Monitoring Agents (Section 3.2.2) are responsi-ble for coordinating the metric collection process by managingMonitoring Probes and disseminating collected metrics toMonitoring Servers over the communication pane. MonitoringServers (Section 3.2.3) are in charge of receiving, processingand storing metrics to the database backend of choice viathe respective Database Interface (Section 3.2.4). If enabledby the user, Monitoring Servers can be accessed through aWeb Interface. Communication over the monitoring topol-ogy follows the JCatascopia Communication Protocol (Sec-tion 3.3). This, enables automatic Monitoring Agent discoveryand removal, and automatic resource configuration discovery(e.g. elastic IP attachment to VM) at runtime. MonitoringServers, distributed even across multiple clouds, comprise theMonitoring Topology (Section 3.4). The Monitoring Topologyis configurable with users able to select the topology fit fortheir needs. Moreover, the Topology is elastically scalable with“monitoring the monitoring system” capabilities (Section 4.5& 4.6). Finally, as we show in our evaluation (Section 4.5),JCatascopia is scalable as it can cope with an increasingnumber of monitoring metrics and instances.
In the following, a more elaborative description of thecomponents comprising JCatascopia is provided.3.2.1 Monitoring ProbesMonitoring Probes are metric collectors responsible forcollecting low-level metrics from VMs or physical machinesand performance metrics from deployed cloud services. Probesfeature both a push and pull metric delivery mechanism.Monitoring Agents benefit from the push mechanism by avoid-ing the overhead of constantly checking for metric updates.Thus, metrics can be collected at different time granularitiesas the collection process of each Probe is decoupled fromother Probes. On the other hand, users or other interestedparties (e.g. elasticity controller), may use the MonitoringAgent API to immediately pull Probe metric updates. Probeslogically group multiple metrics together, in order to reducethe monitoring overhead when accessing common resources.For example, consider a Probe monitoring a load balancerwhich exposes values for its active sessions, response time anderror rate, via a single REST call in JSON format. A JCatas-copia Probe is able to share resources (i.e., HTTP connection,JSON parser) and reduce the computation overhead whencollecting these metrics, whereas other monitoring tools (e.g.nagios [26]), which isolate each metric, require three RESTcalls and JSON parsers to accomplish the same task.
A metric filtering mechanism is introduced at Probe level.This allows users to attach filters to metrics (e.g. F=1%) . Atruntime, the filter mechanism checks collected metrics and ifmetric values are in the range [prevV alue−F, prevV alue+F ]they will be discarded in place rather than being distributedthrough the network. Developers can take advantage of theJCatascopia Probe API4, which provides an interface to the
4. Probe API and Repository available at https://goo.gl/kpFhMj
Fig. 2: JCatascopia Monitoring Agentnecessary abstractions that hide the complexity of Probefunctionality when implementing Monitoring Probes. Mon-itoring Probes run independently from each other and canbe deployed dynamically without the need to restart themonitoring process. If a Probe encounters a problem (e.g.unexpected termination) the metric collection of other Probesis not affected. Finally, Monitoring Agents encapsulate intheir core a dynamic java class loader, which allows Probes tobe dynamically plugged-in as lightweight monitoring threads,in two ways: (i) by compiling the Monitoring Agent withthe source code of the Probe in the probe directory; or (ii)externally, by feeding the Monitoring Agent with the location(as a file path or URL) of the Probe bundled as a jar eithervia its config file or at runtime via its API.3.2.2 Monitoring AgentsMonitoring Agents are light-weight monitoring instancesdeployable on cloud elements to be monitored, such as VMsor physical nodes. Monitoring Agents are responsible formanaging the metric collection process on the respective cloudelement, which includes processing and distributing metricsoriginating from Probes to Monitoring Server(s). An Agent isconsidered as the probe manager for the element it is deployedon. A Monitoring Agent is responsible for Monitoring Probe(de-)activation and configuration, according to user-definedparameter requests. Figure 2 depicts the internal architectureof a Monitoring Agent and its (sub-)components.
Initially, when a Monitoring Agent is deployed (see Section3.3.1), the Controller establishes a connection to its respectedMonitoring Server(s), as part of the agent announcementprocess. Once a connection and metric stream is established,monitoring metrics are published and made available forconsumption. JCatascopia is able to control the messageflow between Agents and Servers, adapting, if needed, tonetwork transmission failures by re-connecting, re-schedulingand re-sending messages. New metric values are added to theMonitoring Agent Metric Queue either directly by MonitoringProbes or by the Controller, via the Listener, which listensfor metric requests from other processes. The Controlleralso listens for probe parameter configuration requests (e.g.configure Probe collecting period) originating from either aMonitoring Server or by users via the JCatascopia RESTAPI. Metrics are dequeued by Metric Collectors and processedby Metric Processors. Metric processing refers to preparinga message for distribution with the latest collected metrics.Initially, a metric is converted to a human readable format in asemi-structured manner and then Monitoring Agent metadata
IEEE TRANSACTIONS ON CLOUD COMPUTING, VOL. X, NO. X, MONTH 2015 5
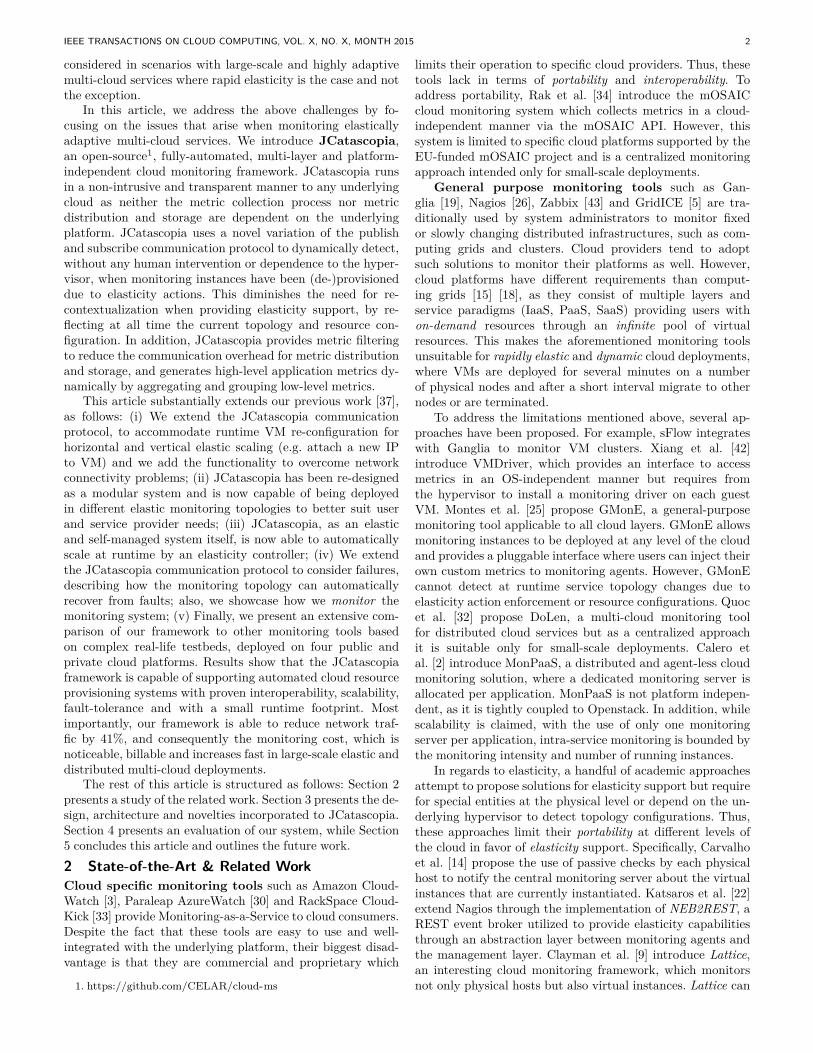
Fig. 3: JCatascopia Monitoring Server
are added to the message. The number of Collectors andProcessors is customizable by simply changing the defaultvalues defined in the Agent configuration file (located in theinstallation directory).
After processing, metrics are passed to the Aggregator. TheAggregator is responsible for grouping metrics into messagesand performing aggregation functions based on user-definedpolicies (i.e. AVG, MEAN). Aggregation is an importantfeature aiming at reducing network traffic from constantlytransmitting metrics over the network. Built into JCatascopiais a time-based (e.g. distribute collected metrics every Xseconds) and a volume-based policy (e.g. distribute metrics ifmessage size exceeds X KB). Multiple aggregation policies canbe utilized together (e.g. both of the above policies), with poli-cies being configured through the Agent config file. Developersare free to create and attach their own custom aggregationpolicies by adhering to the aggregation interface. When anaggregation policy is satisfied, the message is distributed toall interested parties. Of course, aggregation is a trade-offbetween efficiency and accuracy. For this reason, in contrastto other monitoring tools, JCatascopia’s Aggregator is fullyconfigurable with users able to select which policies to enable.3.2.3 Monitoring ServersMonitoring Servers are the entities responsible for receiving,processing and storing monitoring metrics to the MonitoringDatabase. Monitoring Servers handle metric and configura-tion requests, delegating them to the appropriated MonitoringAgents. The communication between Monitoring Agents andMonitoring Servers is accomplished by utilizing a variationof the traditional publish and subscribe (pub/sub) messagingparadigm that reduces the related network communicationoverhead (see Section 3.3.1). A Monitoring Server processesreceived monitoring metrics and forms high-level metricsbased on Metric Rules upon user request (see Section 3.5).Monitoring Servers are deployable on either physical nodes orvirtual instances without having to reside in the same cloudplatform with their Monitoring Agents. In particular, sinceJCatascopia is interoperable, both Monitoring Agents andServers can be distributed across different cloud platforms.Using multiple Monitoring Servers is optional. However, sus-tainability, fault-tolerance and scalability can be improved ifmetric traffic is directed through multiple Monitoring Servers.Figure 3 depicts the internal architecture of a MonitoringServer and its (sub-)components. Listeners are the entitieslistening for (i) incoming Monitoring Agent connections, (ii)newly collected metrics, and (iii) API requests from other in-terested parties (e.g. elasticity controller or users). MonitoringAgent connection and termination requests are handled by
the Controller, which parses requests and stores in suitabledata structures (Agent and Metric Map) metadata describ-ing the Agent and the collected metrics. After establishinga connection, an Agent publishes metric messages to therespected metric stream. Listeners receive incoming metricmessages and enqueue them to the Metric Queue. Messagesare dequeued from the Metric Queue and processed by MetricProcessors. The number of Processors is customizable, bychanging the default value defined in the Server configurationfile. Processing messages refers to the task of parsing themessage, decomposing it to grab the metrics in a message andupdating the metric data structure. The metric data structurestores metric metadata and their latest reported values.
If a Monitoring Database is attached to the MonitoringServer, received metrics are stored via the Database Interfaceto the database. Also, if a Monitoring Server acts as anintermediate in a hierarchical topology (see Section 3.4), met-rics are aggregated (if needed) and distributed to MonitoringServers higher in the hierarchy. The Rule Manager, depictedin Fig. 3, is part of the rule mechanism, which is based onthe JCatascopia Rule Language introduced in Section 3.5.The Rule Manager allows users and cloud entities (i.e. Billingentity) to apply expressions (e.g. cpuTotal = 1− cpuIdle) onlow-level metrics to create new high-level metrics. The RuleManager, retrieves Rule requests from the Control Queue andupdates existing Metric Rule values based on the updatingperiod specified by the user via the JCatascopia REST API.
3.2.4 Monitoring Database InterfaceJCatascopia offers users the ability to use the database solu-tion of their choice to handle metric insertion and extraction.To this end, it provides a Database Interface to a databasebackend. Currently, JCatascopia supports two database back-ends: MySQL and CassandraDB. The MySQL implemen-tation provides users and entities (i.e. elasticity controller)the ability to perform various types of complex queries onmonitoring data, such as table joins. A Cleanup Daemon isavailable to extract and process old monitoring data to reducethe size of database and query response time. The CleanupDeamon is activated either when the size of the databaseexceeds a specified by the user threshold or when a timeinterval expires. The NoSQL CassandraDB interface allowsfor fast writes and reads on recent metrics with also the abilityto add a configurable Time-To-Live expiration parameter toinserted metrics, eliminating the need of a Cleanup Daemon.
3.3 JCatascopia Communication Protocol3.3.1 Monitoring Agent Discovery and RemovalTo support an automated elasticity controller, which adaptselastically cloud service deployments, Monitoring Agentsmust be both re-configurable and dynamically deployableat runtime. Specifically, when a newly provisioned virtualinstance is added to a deployment, a new Monitoring Agentmust be configured and added to this virtual instance. Inturn, the monitoring system must be notified for this addition.Similarly, the monitoring system must also be aware when aMonitoring Agent has been removed due to the removal of apreviously allocated virtual instance.
In the classic publish and subscribe message pattern, en-tities, referred to as subscribers, initially express interest andsubscribe to an event stream of another entity, referred to

IEEE TRANSACTIONS ON CLOUD COMPUTING, VOL. X, NO. X, MONTH 2015 6
Fig. 4: Dynamic Agent Discovery and Removal Process
as the publisher. A subscriber can be interested in receivingevent notifications from multiple publishers. When events aregenerated, the publisher distributes them to its subscribers,eliminating the need of the subscriber to constantly poll thepublisher to check if new events are available. Due to thereduced overhead from eliminating polling, this approach hasbeen adopted by a number of monitoring systems [14] [32] [40].However, this approach introduces the following limitationswhen monitoring rapidly elastic cloud service environments:(i) The addition of a new metric publisher (Monitoring Agent)requires for every potential subscriber (Monitoring Servers)to be notified of the new publisher’s existence by a broker (ordirectory service) storing the network locations of MonitoringAgents and Servers. Then, interested subscribers will initiatethe subscription process. This features a significant overheadin a highly adaptive large-scale environment where rapidlyprovisioned Monitoring Agents must contact all MonitoringServers in the deployment; (ii) In a similar manner, when de-provisioning a Monitoring Agent, each and every subscribermust be notified and the metric stream(s) must be closed.
In our approach (Fig. 4) we differ from the classic pub/subprotocol by allowing Monitoring Agents to (dis-)appear dy-namically and rapidly due to elasticity actions. Specifically,we vary the message pattern as follows: (i) Monitoring Serversbind to a network interface, awaiting for incoming requests;and (ii) Monitoring Agents, which are the metric publishers,initiate the subscription process by immediately contactinginterested Monitoring Servers of their existence with a SUB-SCRIBE message5. Afterwards, Monitoring Agents send aMETADATA message to the interested Monitoring Serversincluding information such as the metrics they are responsibleto collect and their agent id. Finally, after the subscriptionprocess is complete, Monitoring Agents can start publishingmetrics to the established metric stream. With the proposedvariation, the Monitoring Server is agnostic to the networklocation of its Monitoring Agents, allowing them to appearand disappear dynamically in a flexible manner by eliminatingthe need: (i) to restart or reconfigure the Monitoring System;(ii) to depend on the underlying hypervisor; and (iii) torequire a directory service that contains these locations.
A Monitoring Agent is removed from the topology wheneither: (i) a scaling down action is issued to the VM it resideson; or (ii) due to a user shutdown request via the MonitoringAgent API or the OS (process is killed). In any case, upon
5. Determining how a Monitoring Agents knows to which Monitor-ing Servers to connect to is described in Section 3.4
Fig. 5: Agent Automatic Reconnect and Metadata Update
Monitoring Agent termination a java shutdown hook is trig-gered. This shutdown hook initiates the agent terminationprocess which gracefully stops Monitoring Agent functionality.Specifically, it immediately notifies the Monitoring Server(s)associated with it, that it is shutting down via a TERM mes-sage (Fig. 4). In contrast to heartbeat monitoring, this allowsfor Monitoring Agent removals to be rapidly discovered. Mostimportantly, in contrast to other solutions [40] which require1 TERM message to the pub/sub broker and N messagesto notify each Monitoring Server that the Agent is leavingthe topology, our solution only requires M TERM messages,where M is the number of Monitoring Servers the Agent isassigned to (usually M << N).3.3.2 Agent Automatic Reconnect and Metadata UpdateJCatascopia takes into consideration realistic special-case sce-narios which may be considered as exceptions to the smoothfunctioning of the monitoring process.
The first scenario considered is the presence of networkconnectivity issues between a Monitoring Agent and its re-spective Monitoring Server(s). For monitoring systems, if anAgent is unavailable for a specified period of time, then theconnection is dropped. Afterwards, any incoming message ormetric streams from the Monitoring Agent are marked as ma-licious and ignored with the Agent not having any knowledgethat the metric values sent are discarded. The only way to re-establish the connection is to terminate and re-instantiate theMonitoring Agent. However, if a JCatascopia Agent (Fig. 5a)sends metric values or issues a request to a Monitoring Serverafter the connection is dropped, the Monitoring Server willreply with a RECONNECT message. This allows the Monitor-ing Agent to re-establish the connection (and re-authenticate)without the need to restart the monitoring process or theinterference of a system admin.
The second scenario that we take into consideration relatesto the uncertainties imposed due to re-contextualization suchas in the case where the IP address of a VM is changedat runtime (elastic IPs are a form of vertical scaling). Thisscenario is not extreme, since a number of cloud providers offerelastic ip services [4] [28] by (de-)allocating network interfacesto/from virtual instances on the fly without restarting theinstance. To address this, JCatascopia Agents periodicallyupdate their metadata (i.e. IP addresses or available metrics)and then send a METADATA message to the MonitoringServer as depicted in Figure 5b. The limitation of this ap-proach is that a request (e.g. a metric pull request) issued from

IEEE TRANSACTIONS ON CLOUD COMPUTING, VOL. X, NO. X, MONTH 2015 7
Fig. 6: Monitoring Topology Configurations
Fig. 7: Monitoring Agent Placementa Monitoring Server to an Agent of a VM that just changedIP, will fail if the Agent metadata has not yet been updated.The error space can be shortened if the service issuing theconfiguration (e.g. elasticity controller) informs the Monitor-ing Agent of this by triggering either the updateAgentIP() orupdateALLAgentMetadata() API calls. The same approach isfollowed when the IP of a Monitoring Server is changed withthe addition of one more step: after an IP address update,the Monitoring Server notifies its respected Agents with aMETADATA message containing the new IP address.
3.4 Monitoring TopologyJCatascopia as a modular system is comprised of the followingcomponents: Probes, Agents, Servers, Database Interface, WebInterface. JCatascopia grants users, service developers andmonitoring providers (all noted as monitoring stakeholders)flexibility and freedom in the monitoring process. Specifically,monitoring stakeholders are free to configure the overlaynetwork interconnecting Monitoring Agents and Servers tobetter suit their needs, focusing on scalability, locality or logicof separation. It is important to note that the utilized mon-itoring topology is transparent to the underlying MonitoringAgents, and consequently to user VMs. This means that noreconfiguration is required when the topology adapts or whensubstituted, even at runtime, with a different configuration.Figure 6 depicts three different topology configurations thatcan be considered by stakeholders for different purposes.
Figure 6a depicts a hierarchical topology, where theMonitoring Servers, and consequently their respective Moni-toring Agents, are logically grouped together, forming a tree.Metrics processed from Monitoring Servers lower in the hier-archy can either be forwarded to Monitoring Servers higherin the hierarchy as is or aggregated presenting an overviewof their branch. Additionally, a JCatascopia Web Interfaceand a Monitoring Database can be attached to any interme-
diate Monitoring Server collecting insights for the health andperformance of the topology up to that point. Specifically, inFigure 6a, Cloud Service B features a dedicated Web Interfaceand Monitoring Database. As a side note, Monitoring Serversdo not need to utilize the same Database Interface, e.g.Monitoring Servers lower in the hierarchy may use a relationaldatabase while others utilize a NoSQL database.
In contrast to the previous topology, Figure 6b depictsa Peer-2-Peer topology, where Monitoring Servers aredistributed across the network forming a P2P gossip network.For JCatascopia, gossip is a compressed message exchangedbetween peers to periodically discover the state of otherMonitoring Servers participating in the network, as well as thenumber of Monitoring Agents assigned to each peer and theirnetwork location. In this arrangement, all Monitoring Servers(peers) have the same monitoring responsibilities (e.g. receive,process, store metrics) with some peers also acting as seeds.A Seed is responsible for bootstrapping new peers joiningthe network and monitoring the health of the MonitoringServers assigned to it, in par with P2P distributed databasecommunication protocols [23]. Seeds are not a single pointof failure nor do they serve any other special purposes. Thistopology benefits from automatic horizontal scaling based onthe load imposed to the monitoring tier, if combined with anelasticity controller. In Section 4.5 and 4.6 we show how tomonitor and scale an elastic monitoring system.
A hybrid topology featuring a combination of two ormore topologies is another configuration supported by JCatas-copia. Figure 6c depicts a hybrid topology where clusters ofMonitoring Servers follow a hierarchical topology internally,although externally a P2P topology is used. This providesdevelopers of multiple applications a high-level monitoringoverview of their applications via the same web interface.
In addition to allowing developers configure the monitor-ing topology, JCatascopia provides developers with the abilityto implement and integrate their own Monitoring Agentplacement policies. Specifically, when a new MonitoringAgent attempts to establish a connection to the monitoringnetwork, the placement policy is used to determine candidateMonitoring Server(s) for connection. Such placement policiesmay include: (i) assigning Monitoring Agents to Servers basedon fairness, thus following a round-robin distribution; (ii)based on locality, where Monitoring Agents are assigned to theclosest, in terms of latency, Monitoring Server(s) or in a multi-cloud scenario, to Monitoring Servers in the same availabilityzone; and (iii) based on Monitoring Server utilization, whereagents are load-balanced amongst Monitoring Servers. To
IEEE TRANSACTIONS ON CLOUD COMPUTING, VOL. X, NO. X, MONTH 2015 8
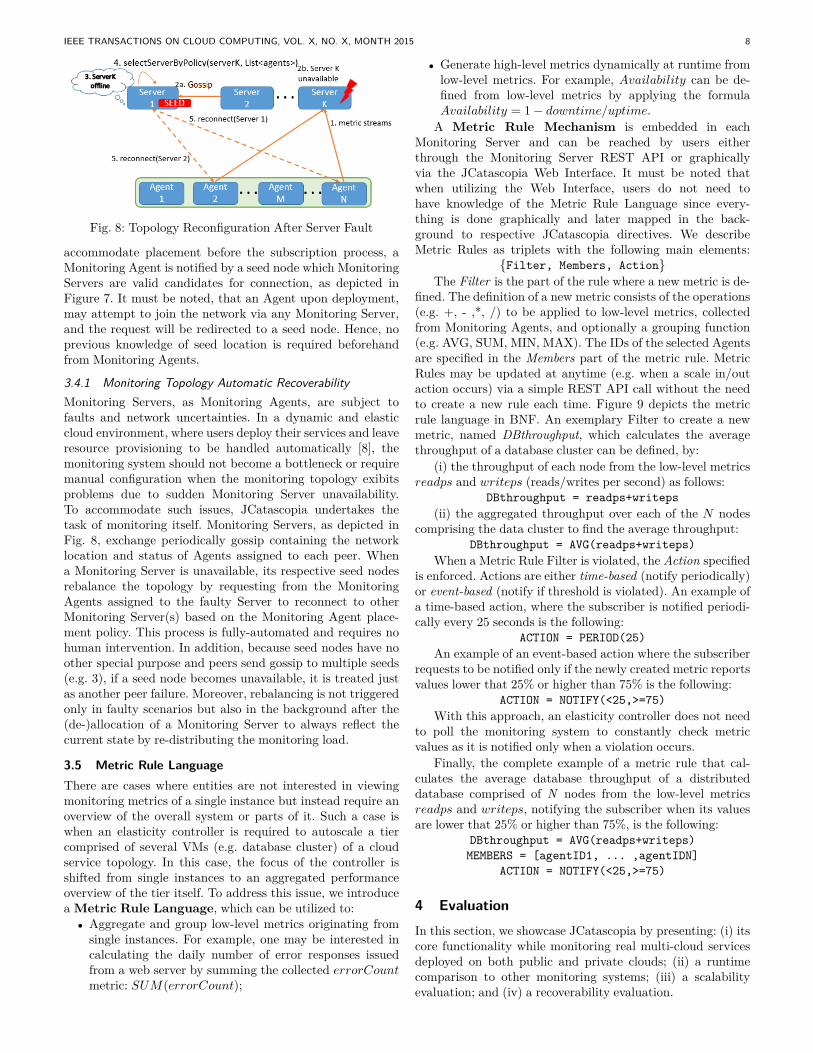
Fig. 8: Topology Reconfiguration After Server Fault
accommodate placement before the subscription process, aMonitoring Agent is notified by a seed node which MonitoringServers are valid candidates for connection, as depicted inFigure 7. It must be noted, that an Agent upon deployment,may attempt to join the network via any Monitoring Server,and the request will be redirected to a seed node. Hence, noprevious knowledge of seed location is required beforehandfrom Monitoring Agents.
3.4.1 Monitoring Topology Automatic RecoverabilityMonitoring Servers, as Monitoring Agents, are subject tofaults and network uncertainties. In a dynamic and elasticcloud environment, where users deploy their services and leaveresource provisioning to be handled automatically [8], themonitoring system should not become a bottleneck or requiremanual configuration when the monitoring topology exibitsproblems due to sudden Monitoring Server unavailability.To accommodate such issues, JCatascopia undertakes thetask of monitoring itself. Monitoring Servers, as depicted inFig. 8, exchange periodically gossip containing the networklocation and status of Agents assigned to each peer. Whena Monitoring Server is unavailable, its respective seed nodesrebalance the topology by requesting from the MonitoringAgents assigned to the faulty Server to reconnect to otherMonitoring Server(s) based on the Monitoring Agent place-ment policy. This process is fully-automated and requires nohuman intervention. In addition, because seed nodes have noother special purpose and peers send gossip to multiple seeds(e.g. 3), if a seed node becomes unavailable, it is treated justas another peer failure. Moreover, rebalancing is not triggeredonly in faulty scenarios but also in the background after the(de-)allocation of a Monitoring Server to always reflect thecurrent state by re-distributing the monitoring load.
3.5 Metric Rule LanguageThere are cases where entities are not interested in viewingmonitoring metrics of a single instance but instead require anoverview of the overall system or parts of it. Such a case iswhen an elasticity controller is required to autoscale a tiercomprised of several VMs (e.g. database cluster) of a cloudservice topology. In this case, the focus of the controller isshifted from single instances to an aggregated performanceoverview of the tier itself. To address this issue, we introducea Metric Rule Language, which can be utilized to:• Aggregate and group low-level metrics originating from
single instances. For example, one may be interested incalculating the daily number of error responses issuedfrom a web server by summing the collected errorCountmetric: SUM(errorCount);
• Generate high-level metrics dynamically at runtime fromlow-level metrics. For example, Availability can be de-fined from low-level metrics by applying the formulaAvailability = 1− downtime/uptime.
A Metric Rule Mechanism is embedded in eachMonitoring Server and can be reached by users eitherthrough the Monitoring Server REST API or graphicallyvia the JCatascopia Web Interface. It must be noted thatwhen utilizing the Web Interface, users do not need tohave knowledge of the Metric Rule Language since every-thing is done graphically and later mapped in the back-ground to respective JCatascopia directives. We describeMetric Rules as triplets with the following main elements:
{Filter, Members, Action}The Filter is the part of the rule where a new metric is de-
fined. The definition of a new metric consists of the operations(e.g. +, - ,*, /) to be applied to low-level metrics, collectedfrom Monitoring Agents, and optionally a grouping function(e.g. AVG, SUM, MIN, MAX). The IDs of the selected Agentsare specified in the Members part of the metric rule. MetricRules may be updated at anytime (e.g. when a scale in/outaction occurs) via a simple REST API call without the needto create a new rule each time. Figure 9 depicts the metricrule language in BNF. An exemplary Filter to create a newmetric, named DBthroughput, which calculates the averagethroughput of a database cluster can be defined, by:
(i) the throughput of each node from the low-level metricsreadps and writeps (reads/writes per second) as follows:
DBthroughput = readps+writeps(ii) the aggregated throughput over each of the N nodes
comprising the data cluster to find the average throughput:DBthroughput = AVG(readps+writeps)
When a Metric Rule Filter is violated, the Action specifiedis enforced. Actions are either time-based (notify periodically)or event-based (notify if threshold is violated). An example ofa time-based action, where the subscriber is notified periodi-cally every 25 seconds is the following:
ACTION = PERIOD(25)An example of an event-based action where the subscriber
requests to be notified only if the newly created metric reportsvalues lower that 25% or higher than 75% is the following:
ACTION = NOTIFY(<25,>=75)With this approach, an elasticity controller does not need
to poll the monitoring system to constantly check metricvalues as it is notified only when a violation occurs.
Finally, the complete example of a metric rule that cal-culates the average database throughput of a distributeddatabase comprised of N nodes from the low-level metricsreadps and writeps, notifying the subscriber when its valuesare lower that 25% or higher than 75%, is the following:
DBthroughput = AVG(readps+writeps)MEMBERS = [agentID1, ... ,agentIDN]
ACTION = NOTIFY(<25,>=75)
4 EvaluationIn this section, we showcase JCatascopia by presenting: (i) itscore functionality while monitoring real multi-cloud servicesdeployed on both public and private clouds; (ii) a runtimecomparison to other monitoring systems; (iii) a scalabilityevaluation; and (iv) a recoverability evaluation.
IEEE TRANSACTIONS ON CLOUD COMPUTING, VOL. X, NO. X, MONTH 2015 9
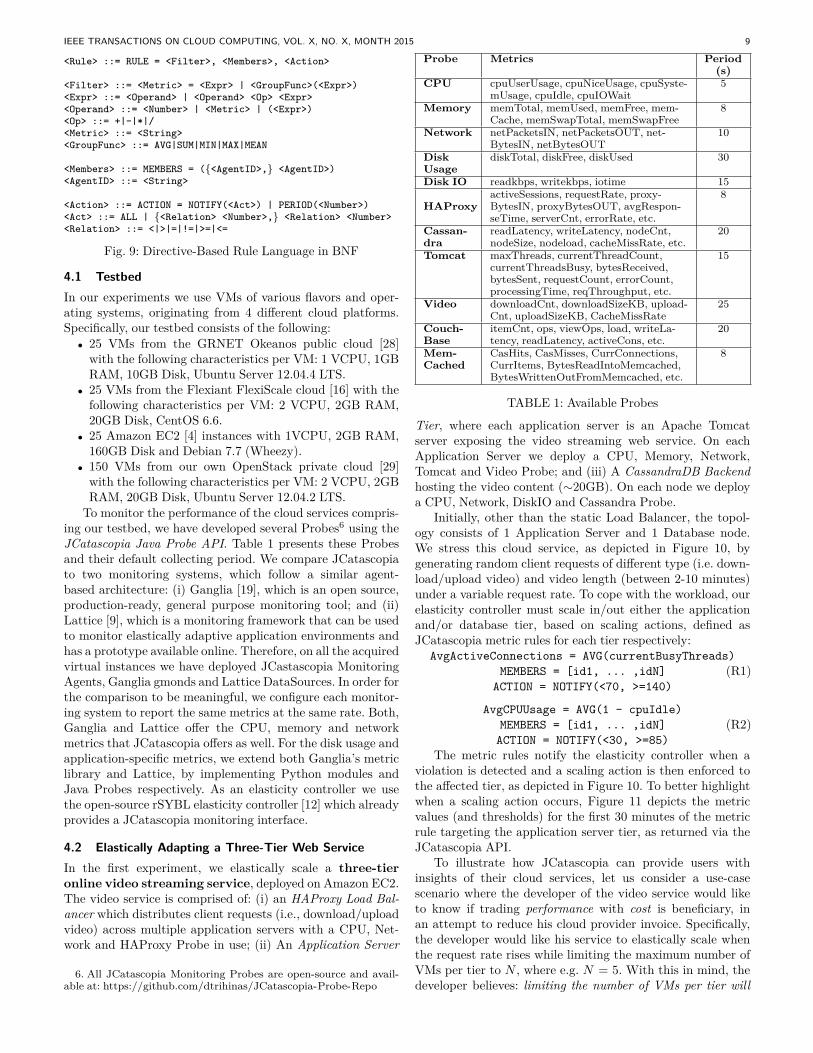
<Rule> ::= RULE = <Filter>, <Members>, <Action>
<Filter> ::= <Metric> = <Expr> | <GroupFunc>(<Expr>)<Expr> ::= <Operand> | <Operand> <Op> <Expr><Operand> ::= <Number> | <Metric> | (<Expr>)<Op> ::= +|-|*|/<Metric> ::= <String><GroupFunc> ::= AVG|SUM|MIN|MAX|MEAN
<Members> ::= MEMBERS = ({<AgentID>,} <AgentID>)<AgentID> ::= <String>
<Action> ::= ACTION = NOTIFY(<Act>) | PERIOD(<Number>)<Act> ::= ALL | {<Relation> <Number>,} <Relation> <Number><Relation> ::= <|>|=|!=|>=|<=
Fig. 9: Directive-Based Rule Language in BNF
4.1 TestbedIn our experiments we use VMs of various flavors and oper-ating systems, originating from 4 different cloud platforms.Specifically, our testbed consists of the following:• 25 VMs from the GRNET Okeanos public cloud [28]
with the following characteristics per VM: 1 VCPU, 1GBRAM, 10GB Disk, Ubuntu Server 12.04.4 LTS.
• 25 VMs from the Flexiant FlexiScale cloud [16] with thefollowing characteristics per VM: 2 VCPU, 2GB RAM,20GB Disk, CentOS 6.6.
• 25 Amazon EC2 [4] instances with 1VCPU, 2GB RAM,160GB Disk and Debian 7.7 (Wheezy).
• 150 VMs from our own OpenStack private cloud [29]with the following characteristics per VM: 2 VCPU, 2GBRAM, 20GB Disk, Ubuntu Server 12.04.2 LTS.
To monitor the performance of the cloud services compris-ing our testbed, we have developed several Probes6 using theJCatascopia Java Probe API. Table 1 presents these Probesand their default collecting period. We compare JCatascopiato two monitoring systems, which follow a similar agent-based architecture: (i) Ganglia [19], which is an open source,production-ready, general purpose monitoring tool; and (ii)Lattice [9], which is a monitoring framework that can be usedto monitor elastically adaptive application environments andhas a prototype available online. Therefore, on all the acquiredvirtual instances we have deployed JCastascopia MonitoringAgents, Ganglia gmonds and Lattice DataSources. In order forthe comparison to be meaningful, we configure each monitor-ing system to report the same metrics at the same rate. Both,Ganglia and Lattice offer the CPU, memory and networkmetrics that JCatascopia offers as well. For the disk usage andapplication-specific metrics, we extend both Ganglia’s metriclibrary and Lattice, by implementing Python modules andJava Probes respectively. As an elasticity controller we usethe open-source rSYBL elasticity controller [12] which alreadyprovides a JCatascopia monitoring interface.
4.2 Elastically Adapting a Three-Tier Web ServiceIn the first experiment, we elastically scale a three-tieronline video streaming service, deployed on Amazon EC2.The video service is comprised of: (i) an HAProxy Load Bal-ancer which distributes client requests (i.e., download/uploadvideo) across multiple application servers with a CPU, Net-work and HAProxy Probe in use; (ii) An Application Server
6. All JCatascopia Monitoring Probes are open-source and avail-able at: https://github.com/dtrihinas/JCatascopia-Probe-Repo
Probe Metrics Period(s)
CPU cpuUserUsage, cpuNiceUsage, cpuSyste-mUsage, cpuIdle, cpuIOWait
5
Memory memTotal, memUsed, memFree, mem-Cache, memSwapTotal, memSwapFree
8
Network netPacketsIN, netPacketsOUT, net-BytesIN, netBytesOUT
10
DiskUsage
diskTotal, diskFree, diskUsed 30
Disk IO readkbps, writekbps, iotime 15
HAProxyactiveSessions, requestRate, proxy-BytesIN, proxyBytesOUT, avgRespon-seTime, serverCnt, errorRate, etc.
8
Cassan-dra
readLatency, writeLatency, nodeCnt,nodeSize, nodeload, cacheMissRate, etc.
20
Tomcat maxThreads, currentThreadCount,currentThreadsBusy, bytesReceived,bytesSent, requestCount, errorCount,processingTime, reqThroughput, etc.
15
Video downloadCnt, downloadSizeKB, upload-Cnt, uploadSizeKB, CacheMissRate
25
Couch-Base
itemCnt, ops, viewOps, load, writeLa-tency, readLatency, activeCons, etc.
20
Mem-Cached
CasHits, CasMisses, CurrConnections,CurrItems, BytesReadIntoMemcached,BytesWrittenOutFromMemcached, etc.
8
TABLE 1: Available Probes
Tier, where each application server is an Apache Tomcatserver exposing the video streaming web service. On eachApplication Server we deploy a CPU, Memory, Network,Tomcat and Video Probe; and (iii) A CassandraDB Backendhosting the video content (∼20GB). On each node we deploya CPU, Network, DiskIO and Cassandra Probe.
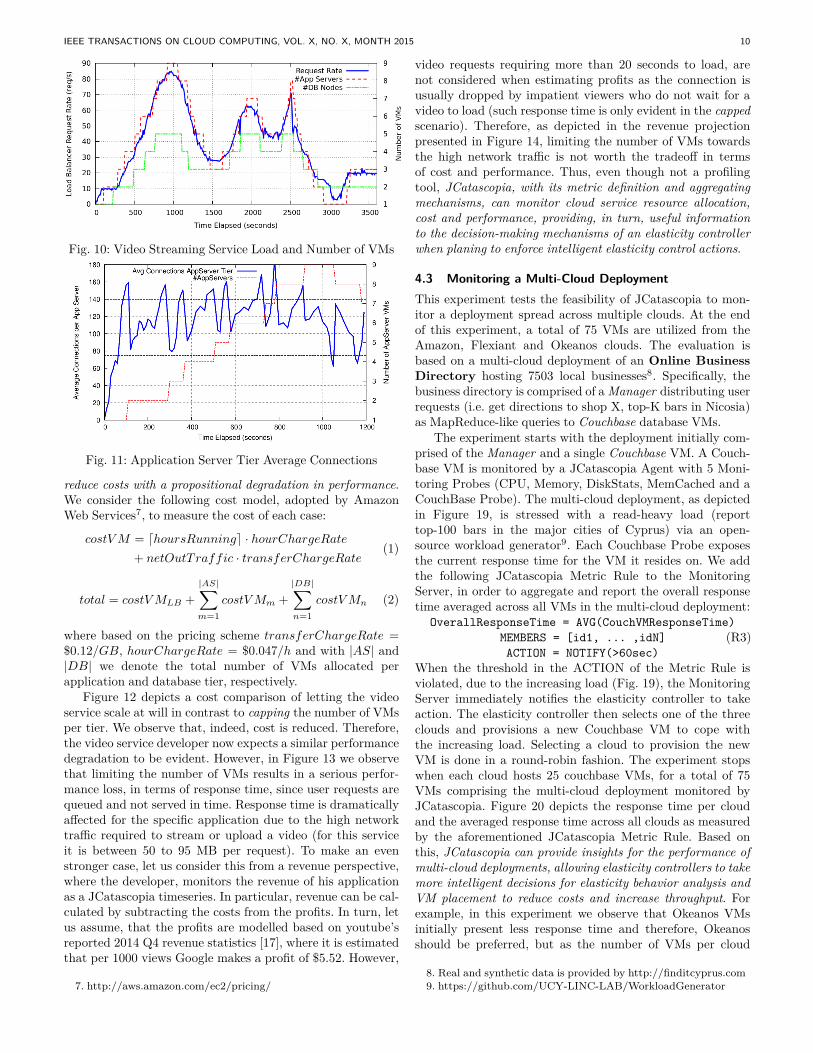
Initially, other than the static Load Balancer, the topol-ogy consists of 1 Application Server and 1 Database node.We stress this cloud service, as depicted in Figure 10, bygenerating random client requests of different type (i.e. down-load/upload video) and video length (between 2-10 minutes)under a variable request rate. To cope with the workload, ourelasticity controller must scale in/out either the applicationand/or database tier, based on scaling actions, defined asJCatascopia metric rules for each tier respectively:
AvgActiveConnections = AVG(currentBusyThreads)MEMBERS = [id1, ... ,idN] (R1)
ACTION = NOTIFY(<70, >=140)
AvgCPUUsage = AVG(1 - cpuIdle)MEMBERS = [id1, ... ,idN] (R2)
ACTION = NOTIFY(<30, >=85)The metric rules notify the elasticity controller when a
violation is detected and a scaling action is then enforced tothe affected tier, as depicted in Figure 10. To better highlightwhen a scaling action occurs, Figure 11 depicts the metricvalues (and thresholds) for the first 30 minutes of the metricrule targeting the application server tier, as returned via theJCatascopia API.
To illustrate how JCatascopia can provide users withinsights of their cloud services, let us consider a use-casescenario where the developer of the video service would liketo know if trading performance with cost is beneficiary, inan attempt to reduce his cloud provider invoice. Specifically,the developer would like his service to elastically scale whenthe request rate rises while limiting the maximum number ofVMs per tier to N , where e.g. N = 5. With this in mind, thedeveloper believes: limiting the number of VMs per tier will
IEEE TRANSACTIONS ON CLOUD COMPUTING, VOL. X, NO. X, MONTH 2015 10
Fig. 10: Video Streaming Service Load and Number of VMs
Fig. 11: Application Server Tier Average Connections
reduce costs with a propositional degradation in performance.We consider the following cost model, adopted by AmazonWeb Services7, to measure the cost of each case:
costV M = dhoursRunninge · hourChargeRate+ netOutTraffic · transferChargeRate
(1)
total = costV MLB +|AS|∑m=1
costV Mm +|DB|∑n=1
costV Mn (2)
where based on the pricing scheme transferChargeRate =$0.12/GB, hourChargeRate = $0.047/h and with |AS| and|DB| we denote the total number of VMs allocated perapplication and database tier, respectively.
Figure 12 depicts a cost comparison of letting the videoservice scale at will in contrast to capping the number of VMsper tier. We observe that, indeed, cost is reduced. Therefore,the video service developer now expects a similar performancedegradation to be evident. However, in Figure 13 we observethat limiting the number of VMs results in a serious perfor-mance loss, in terms of response time, since user requests arequeued and not served in time. Response time is dramaticallyaffected for the specific application due to the high networktraffic required to stream or upload a video (for this serviceit is between 50 to 95 MB per request). To make an evenstronger case, let us consider this from a revenue perspective,where the developer, monitors the revenue of his applicationas a JCatascopia timeseries. In particular, revenue can be cal-culated by subtracting the costs from the profits. In turn, letus assume, that the profits are modelled based on youtube’sreported 2014 Q4 revenue statistics [17], where it is estimatedthat per 1000 views Google makes a profit of $5.52. However,
7. http://aws.amazon.com/ec2/pricing/
video requests requiring more than 20 seconds to load, arenot considered when estimating profits as the connection isusually dropped by impatient viewers who do not wait for avideo to load (such response time is only evident in the cappedscenario). Therefore, as depicted in the revenue projectionpresented in Figure 14, limiting the number of VMs towardsthe high network traffic is not worth the tradeoff in termsof cost and performance. Thus, even though not a profilingtool, JCatascopia, with its metric definition and aggregatingmechanisms, can monitor cloud service resource allocation,cost and performance, providing, in turn, useful informationto the decision-making mechanisms of an elasticity controllerwhen planing to enforce intelligent elasticity control actions.
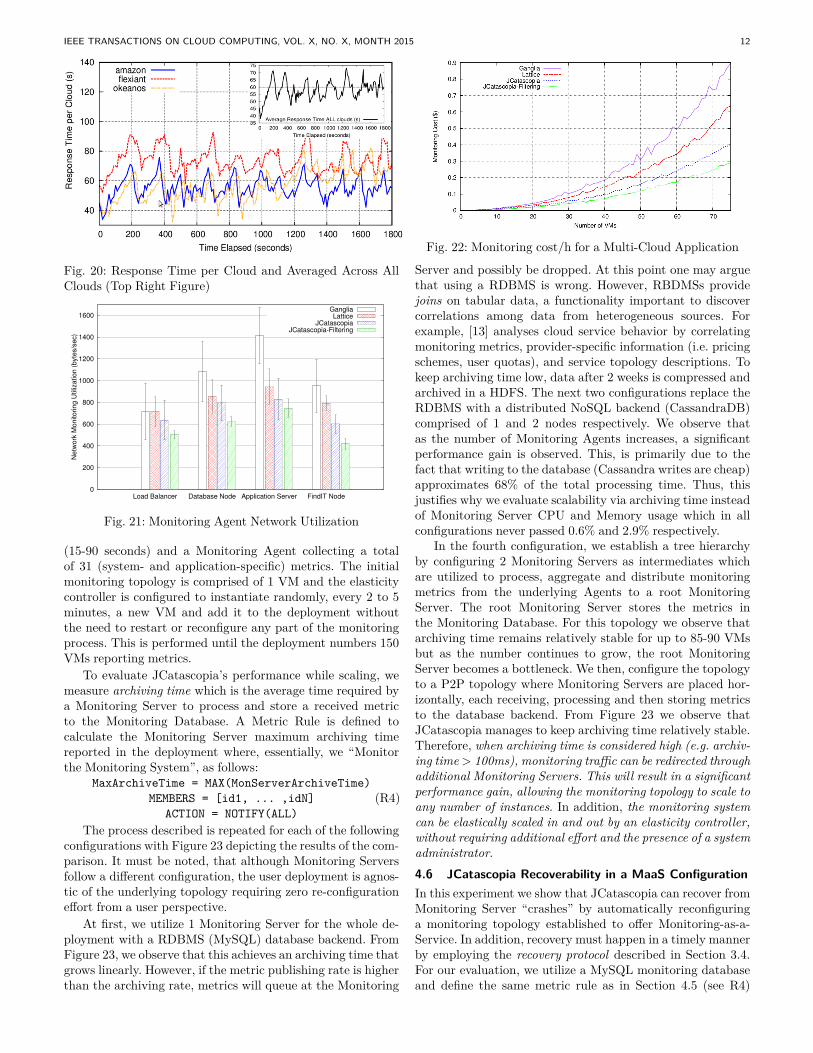
4.3 Monitoring a Multi-Cloud DeploymentThis experiment tests the feasibility of JCatascopia to mon-itor a deployment spread across multiple clouds. At the endof this experiment, a total of 75 VMs are utilized from theAmazon, Flexiant and Okeanos clouds. The evaluation isbased on a multi-cloud deployment of an Online BusinessDirectory hosting 7503 local businesses8. Specifically, thebusiness directory is comprised of a Manager distributing userrequests (i.e. get directions to shop X, top-K bars in Nicosia)as MapReduce-like queries to Couchbase database VMs.
The experiment starts with the deployment initially com-prised of the Manager and a single Couchbase VM. A Couch-base VM is monitored by a JCatascopia Agent with 5 Moni-toring Probes (CPU, Memory, DiskStats, MemCached and aCouchBase Probe). The multi-cloud deployment, as depictedin Figure 19, is stressed with a read-heavy load (reporttop-100 bars in the major cities of Cyprus) via an open-source workload generator9. Each Couchbase Probe exposesthe current response time for the VM it resides on. We addthe following JCatascopia Metric Rule to the MonitoringServer, in order to aggregate and report the overall responsetime averaged across all VMs in the multi-cloud deployment:
OverallResponseTime = AVG(CouchVMResponseTime)MEMBERS = [id1, ... ,idN] (R3)ACTION = NOTIFY(>60sec)
When the threshold in the ACTION of the Metric Rule isviolated, due to the increasing load (Fig. 19), the MonitoringServer immediately notifies the elasticity controller to takeaction. The elasticity controller then selects one of the threeclouds and provisions a new Couchbase VM to cope withthe increasing load. Selecting a cloud to provision the newVM is done in a round-robin fashion. The experiment stopswhen each cloud hosts 25 couchbase VMs, for a total of 75VMs comprising the multi-cloud deployment monitored byJCatascopia. Figure 20 depicts the response time per cloudand the averaged response time across all clouds as measuredby the aforementioned JCatascopia Metric Rule. Based onthis, JCatascopia can provide insights for the performance ofmulti-cloud deployments, allowing elasticity controllers to takemore intelligent decisions for elasticity behavior analysis andVM placement to reduce costs and increase throughput. Forexample, in this experiment we observe that Okeanos VMsinitially present less response time and therefore, Okeanosshould be preferred, but as the number of VMs per cloud
8. Real and synthetic data is provided by http://finditcyprus.com9. https://github.com/UCY-LINC-LAB/WorkloadGenerator
IEEE TRANSACTIONS ON CLOUD COMPUTING, VOL. X, NO. X, MONTH 2015 11
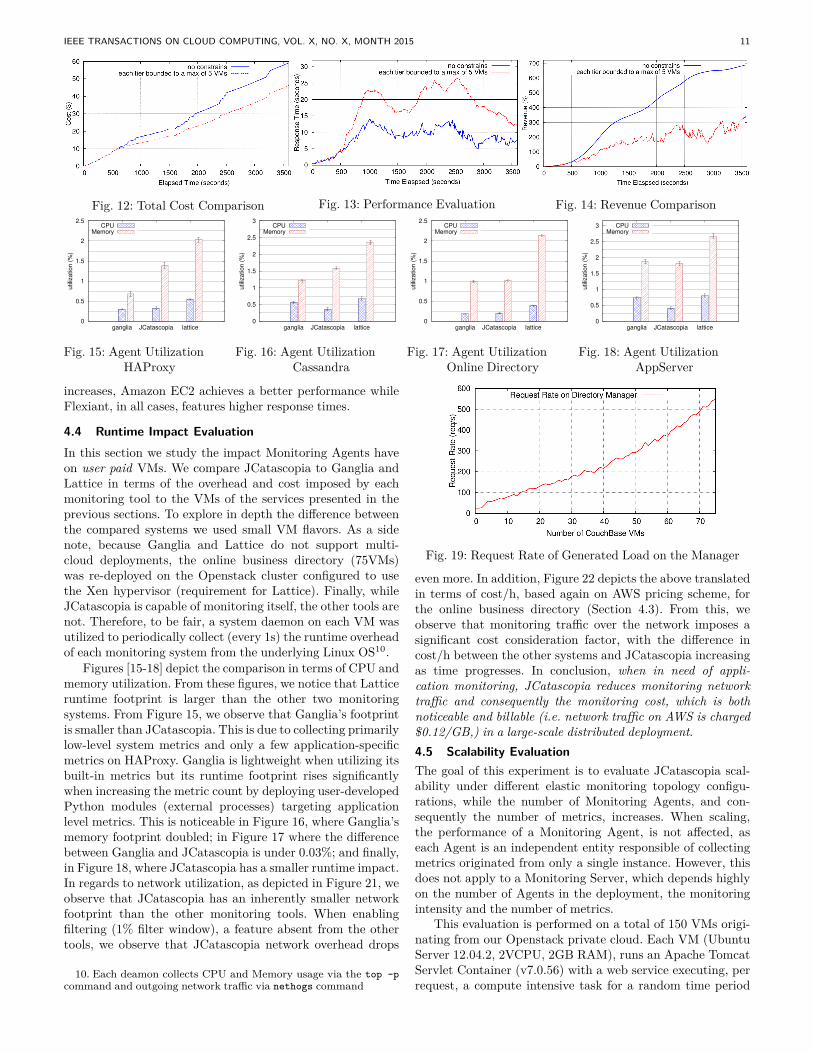
Fig. 12: Total Cost Comparison Fig. 13: Performance Evaluation Fig. 14: Revenue Comparison
0
0.5
1
1.5
2
2.5
ganglia JCatascopia lattice
utiliz
atio
n (
%)
CPUMemory
Fig. 15: Agent UtilizationHAProxy
0
0.5
1
1.5
2
2.5
3
ganglia JCatascopia lattice
utiliz
atio
n (
%)
CPUMemory
Fig. 16: Agent UtilizationCassandra
0
0.5
1
1.5
2
2.5
ganglia JCatascopia lattice
utiliz
atio
n (
%)
CPUMemory
Fig. 17: Agent UtilizationOnline Directory
0
0.5
1
1.5
2
2.5
3
ganglia JCatascopia lattice
utiliz
atio
n (
%)
CPUMemory
Fig. 18: Agent UtilizationAppServer
increases, Amazon EC2 achieves a better performance whileFlexiant, in all cases, features higher response times.
4.4 Runtime Impact EvaluationIn this section we study the impact Monitoring Agents haveon user paid VMs. We compare JCatascopia to Ganglia andLattice in terms of the overhead and cost imposed by eachmonitoring tool to the VMs of the services presented in theprevious sections. To explore in depth the difference betweenthe compared systems we used small VM flavors. As a sidenote, because Ganglia and Lattice do not support multi-cloud deployments, the online business directory (75VMs)was re-deployed on the Openstack cluster configured to usethe Xen hypervisor (requirement for Lattice). Finally, whileJCatascopia is capable of monitoring itself, the other tools arenot. Therefore, to be fair, a system daemon on each VM wasutilized to periodically collect (every 1s) the runtime overheadof each monitoring system from the underlying Linux OS10.
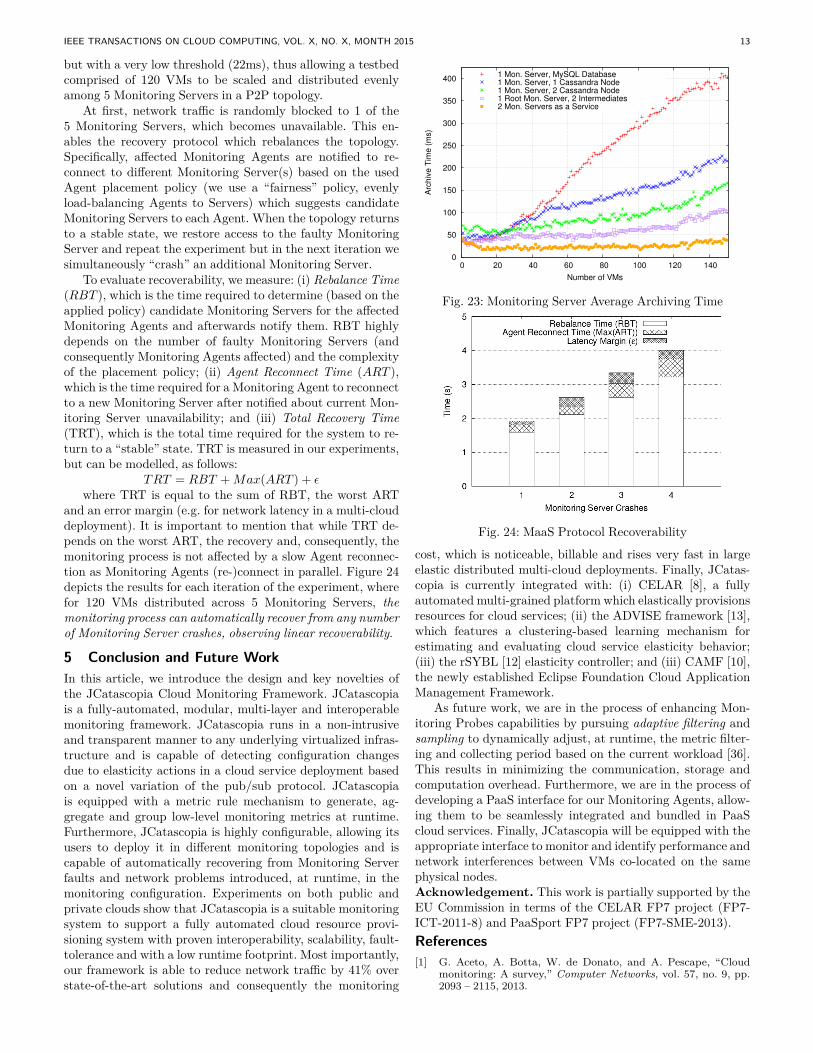
Figures [15-18] depict the comparison in terms of CPU andmemory utilization. From these figures, we notice that Latticeruntime footprint is larger than the other two monitoringsystems. From Figure 15, we observe that Ganglia’s footprintis smaller than JCatascopia. This is due to collecting primarilylow-level system metrics and only a few application-specificmetrics on HAProxy. Ganglia is lightweight when utilizing itsbuilt-in metrics but its runtime footprint rises significantlywhen increasing the metric count by deploying user-developedPython modules (external processes) targeting applicationlevel metrics. This is noticeable in Figure 16, where Ganglia’smemory footprint doubled; in Figure 17 where the differencebetween Ganglia and JCatascopia is under 0.03%; and finally,in Figure 18, where JCatascopia has a smaller runtime impact.In regards to network utilization, as depicted in Figure 21, weobserve that JCatascopia has an inherently smaller networkfootprint than the other monitoring tools. When enablingfiltering (1% filter window), a feature absent from the othertools, we observe that JCatascopia network overhead drops
10. Each deamon collects CPU and Memory usage via the top -pcommand and outgoing network traffic via nethogs command
Fig. 19: Request Rate of Generated Load on the Manager
even more. In addition, Figure 22 depicts the above translatedin terms of cost/h, based again on AWS pricing scheme, forthe online business directory (Section 4.3). From this, weobserve that monitoring traffic over the network imposes asignificant cost consideration factor, with the difference incost/h between the other systems and JCatascopia increasingas time progresses. In conclusion, when in need of appli-cation monitoring, JCatascopia reduces monitoring networktraffic and consequently the monitoring cost, which is bothnoticeable and billable (i.e. network traffic on AWS is charged$0.12/GB,) in a large-scale distributed deployment.4.5 Scalability EvaluationThe goal of this experiment is to evaluate JCatascopia scal-ability under different elastic monitoring topology configu-rations, while the number of Monitoring Agents, and con-sequently the number of metrics, increases. When scaling,the performance of a Monitoring Agent, is not affected, aseach Agent is an independent entity responsible of collectingmetrics originated from only a single instance. However, thisdoes not apply to a Monitoring Server, which depends highlyon the number of Agents in the deployment, the monitoringintensity and the number of metrics.
This evaluation is performed on a total of 150 VMs origi-nating from our Openstack private cloud. Each VM (UbuntuServer 12.04.2, 2VCPU, 2GB RAM), runs an Apache TomcatServlet Container (v7.0.56) with a web service executing, perrequest, a compute intensive task for a random time period
IEEE TRANSACTIONS ON CLOUD COMPUTING, VOL. X, NO. X, MONTH 2015 12
Fig. 20: Response Time per Cloud and Averaged Across AllClouds (Top Right Figure)
0
200
400
600
800
1000
1200
1400
1600
Load Balancer Database Node Application Server FindIT Node
Netw
ork
Monitoring U
tiliz
ation (
byte
s/s
ec)
GangliaLattice
JCatascopiaJCatascopia-Filtering
Fig. 21: Monitoring Agent Network Utilization
(15-90 seconds) and a Monitoring Agent collecting a totalof 31 (system- and application-specific) metrics. The initialmonitoring topology is comprised of 1 VM and the elasticitycontroller is configured to instantiate randomly, every 2 to 5minutes, a new VM and add it to the deployment withoutthe need to restart or reconfigure any part of the monitoringprocess. This is performed until the deployment numbers 150VMs reporting metrics.
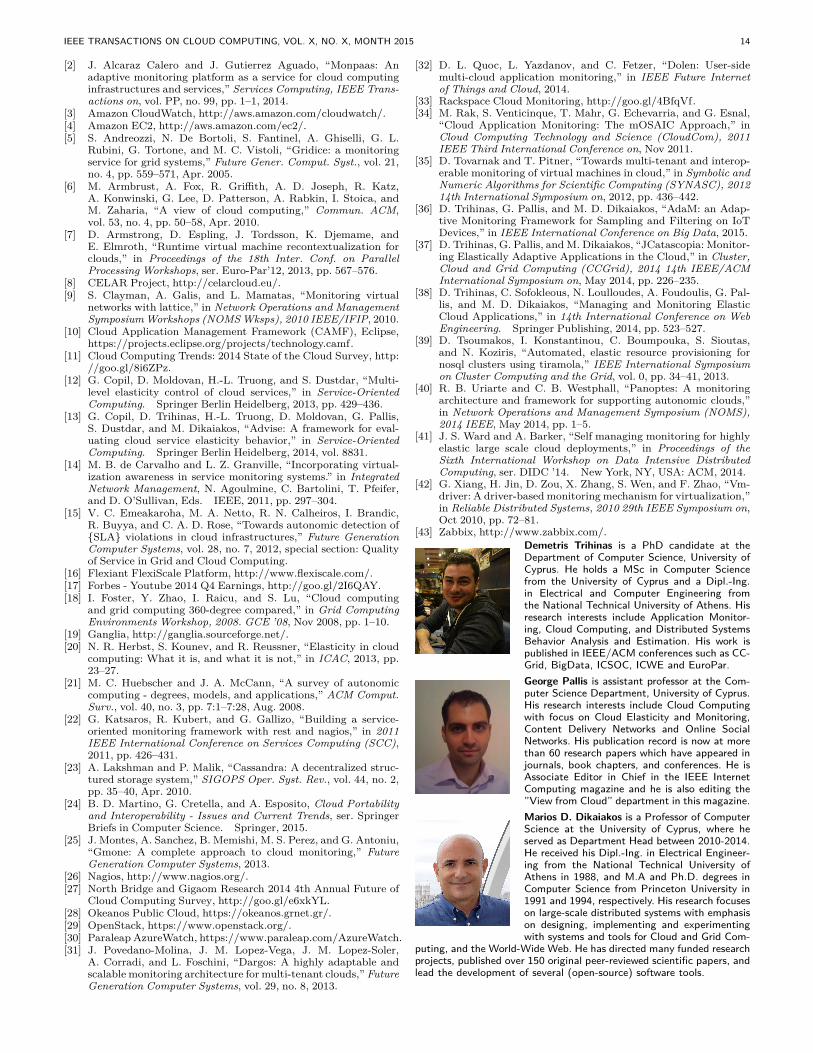
To evaluate JCatascopia’s performance while scaling, wemeasure archiving time which is the average time required bya Monitoring Server to process and store a received metricto the Monitoring Database. A Metric Rule is defined tocalculate the Monitoring Server maximum archiving timereported in the deployment where, essentially, we “Monitorthe Monitoring System”, as follows:
MaxArchiveTime = MAX(MonServerArchiveTime)MEMBERS = [id1, ... ,idN] (R4)
ACTION = NOTIFY(ALL)The process described is repeated for each of the following
configurations with Figure 23 depicting the results of the com-parison. It must be noted, that although Monitoring Serversfollow a different configuration, the user deployment is agnos-tic of the underlying topology requiring zero re-configurationeffort from a user perspective.
At first, we utilize 1 Monitoring Server for the whole de-ployment with a RDBMS (MySQL) database backend. FromFigure 23, we observe that this achieves an archiving time thatgrows linearly. However, if the metric publishing rate is higherthan the archiving rate, metrics will queue at the Monitoring
Fig. 22: Monitoring cost/h for a Multi-Cloud Application
Server and possibly be dropped. At this point one may arguethat using a RDBMS is wrong. However, RBDMSs providejoins on tabular data, a functionality important to discovercorrelations among data from heterogeneous sources. Forexample, [13] analyses cloud service behavior by correlatingmonitoring metrics, provider-specific information (i.e. pricingschemes, user quotas), and service topology descriptions. Tokeep archiving time low, data after 2 weeks is compressed andarchived in a HDFS. The next two configurations replace theRDBMS with a distributed NoSQL backend (CassandraDB)comprised of 1 and 2 nodes respectively. We observe thatas the number of Monitoring Agents increases, a significantperformance gain is observed. This, is primarily due to thefact that writing to the database (Cassandra writes are cheap)approximates 68% of the total processing time. Thus, thisjustifies why we evaluate scalability via archiving time insteadof Monitoring Server CPU and Memory usage which in allconfigurations never passed 0.6% and 2.9% respectively.
In the fourth configuration, we establish a tree hierarchyby configuring 2 Monitoring Servers as intermediates whichare utilized to process, aggregate and distribute monitoringmetrics from the underlying Agents to a root MonitoringServer. The root Monitoring Server stores the metrics inthe Monitoring Database. For this topology we observe thatarchiving time remains relatively stable for up to 85-90 VMsbut as the number continues to grow, the root MonitoringServer becomes a bottleneck. We then, configure the topologyto a P2P topology where Monitoring Servers are placed hor-izontally, each receiving, processing and then storing metricsto the database backend. From Figure 23 we observe thatJCatascopia manages to keep archiving time relatively stable.Therefore, when archiving time is considered high (e.g. archiv-ing time> 100ms), monitoring traffic can be redirected throughadditional Monitoring Servers. This will result in a significantperformance gain, allowing the monitoring topology to scale toany number of instances. In addition, the monitoring systemcan be elastically scaled in and out by an elasticity controller,without requiring additional effort and the presence of a systemadministrator.4.6 JCatascopia Recoverability in a MaaS ConfigurationIn this experiment we show that JCatascopia can recover fromMonitoring Server “crashes” by automatically reconfiguringa monitoring topology established to offer Monitoring-as-a-Service. In addition, recovery must happen in a timely mannerby employing the recovery protocol described in Section 3.4.For our evaluation, we utilize a MySQL monitoring databaseand define the same metric rule as in Section 4.5 (see R4)
IEEE TRANSACTIONS ON CLOUD COMPUTING, VOL. X, NO. X, MONTH 2015 13
but with a very low threshold (22ms), thus allowing a testbedcomprised of 120 VMs to be scaled and distributed evenlyamong 5 Monitoring Servers in a P2P topology.
At first, network traffic is randomly blocked to 1 of the5 Monitoring Servers, which becomes unavailable. This en-ables the recovery protocol which rebalances the topology.Specifically, affected Monitoring Agents are notified to re-connect to different Monitoring Server(s) based on the usedAgent placement policy (we use a “fairness” policy, evenlyload-balancing Agents to Servers) which suggests candidateMonitoring Servers to each Agent. When the topology returnsto a stable state, we restore access to the faulty MonitoringServer and repeat the experiment but in the next iteration wesimultaneously “crash” an additional Monitoring Server.
To evaluate recoverability, we measure: (i) Rebalance Time(RBT ), which is the time required to determine (based on theapplied policy) candidate Monitoring Servers for the affectedMonitoring Agents and afterwards notify them. RBT highlydepends on the number of faulty Monitoring Servers (andconsequently Monitoring Agents affected) and the complexityof the placement policy; (ii) Agent Reconnect Time (ART ),which is the time required for a Monitoring Agent to reconnectto a new Monitoring Server after notified about current Mon-itoring Server unavailability; and (iii) Total Recovery Time(TRT), which is the total time required for the system to re-turn to a “stable” state. TRT is measured in our experiments,but can be modelled, as follows:
TRT = RBT +Max(ART ) + εwhere TRT is equal to the sum of RBT, the worst ART
and an error margin (e.g. for network latency in a multi-clouddeployment). It is important to mention that while TRT de-pends on the worst ART, the recovery and, consequently, themonitoring process is not affected by a slow Agent reconnec-tion as Monitoring Agents (re-)connect in parallel. Figure 24depicts the results for each iteration of the experiment, wherefor 120 VMs distributed across 5 Monitoring Servers, themonitoring process can automatically recover from any numberof Monitoring Server crashes, observing linear recoverability.
5 Conclusion and Future WorkIn this article, we introduce the design and key novelties ofthe JCatascopia Cloud Monitoring Framework. JCatascopiais a fully-automated, modular, multi-layer and interoperablemonitoring framework. JCatascopia runs in a non-intrusiveand transparent manner to any underlying virtualized infras-tructure and is capable of detecting configuration changesdue to elasticity actions in a cloud service deployment basedon a novel variation of the pub/sub protocol. JCatascopiais equipped with a metric rule mechanism to generate, ag-gregate and group low-level monitoring metrics at runtime.Furthermore, JCatascopia is highly configurable, allowing itsusers to deploy it in different monitoring topologies and iscapable of automatically recovering from Monitoring Serverfaults and network problems introduced, at runtime, in themonitoring configuration. Experiments on both public andprivate clouds show that JCatascopia is a suitable monitoringsystem to support a fully automated cloud resource provi-sioning system with proven interoperability, scalability, fault-tolerance and with a low runtime footprint. Most importantly,our framework is able to reduce network traffic by 41% overstate-of-the-art solutions and consequently the monitoring
0
50
100
150
200
250
300
350
400
0 20 40 60 80 100 120 140
Arc
hiv
e T
ime (
ms)
Number of VMs
1 Mon. Server, MySQL Database1 Mon. Server, 1 Cassandra Node1 Mon. Server, 2 Cassandra Node1 Root Mon. Server, 2 Intermediates2 Mon. Servers as a Service
Fig. 23: Monitoring Server Average Archiving Time
Fig. 24: MaaS Protocol Recoverability
cost, which is noticeable, billable and rises very fast in largeelastic distributed multi-cloud deployments. Finally, JCatas-copia is currently integrated with: (i) CELAR [8], a fullyautomated multi-grained platform which elastically provisionsresources for cloud services; (ii) the ADVISE framework [13],which features a clustering-based learning mechanism forestimating and evaluating cloud service elasticity behavior;(iii) the rSYBL [12] elasticity controller; and (iii) CAMF [10],the newly established Eclipse Foundation Cloud ApplicationManagement Framework.
As future work, we are in the process of enhancing Mon-itoring Probes capabilities by pursuing adaptive filtering andsampling to dynamically adjust, at runtime, the metric filter-ing and collecting period based on the current workload [36].This results in minimizing the communication, storage andcomputation overhead. Furthermore, we are in the process ofdeveloping a PaaS interface for our Monitoring Agents, allow-ing them to be seamlessly integrated and bundled in PaaScloud services. Finally, JCatascopia will be equipped with theappropriate interface to monitor and identify performance andnetwork interferences between VMs co-located on the samephysical nodes.Acknowledgement. This work is partially supported by theEU Commission in terms of the CELAR FP7 project (FP7-ICT-2011-8) and PaaSport FP7 project (FP7-SME-2013).References[1] G. Aceto, A. Botta, W. de Donato, and A. Pescape, “Cloud
monitoring: A survey,” Computer Networks, vol. 57, no. 9, pp.2093 – 2115, 2013.
IEEE TRANSACTIONS ON CLOUD COMPUTING, VOL. X, NO. X, MONTH 2015 14
[2] J. Alcaraz Calero and J. Gutierrez Aguado, “Monpaas: Anadaptive monitoring platform as a service for cloud computinginfrastructures and services,” Services Computing, IEEE Trans-actions on, vol. PP, no. 99, pp. 1–1, 2014.
[3] Amazon CloudWatch, http://aws.amazon.com/cloudwatch/.[4] Amazon EC2, http://aws.amazon.com/ec2/.[5] S. Andreozzi, N. De Bortoli, S. Fantinel, A. Ghiselli, G. L.
Rubini, G. Tortone, and M. C. Vistoli, “Gridice: a monitoringservice for grid systems,” Future Gener. Comput. Syst., vol. 21,no. 4, pp. 559–571, Apr. 2005.
[6] M. Armbrust, A. Fox, R. Griffith, A. D. Joseph, R. Katz,A. Konwinski, G. Lee, D. Patterson, A. Rabkin, I. Stoica, andM. Zaharia, “A view of cloud computing,” Commun. ACM,vol. 53, no. 4, pp. 50–58, Apr. 2010.
[7] D. Armstrong, D. Espling, J. Tordsson, K. Djemame, andE. Elmroth, “Runtime virtual machine recontextualization forclouds,” in Proceedings of the 18th Inter. Conf. on ParallelProcessing Workshops, ser. Euro-Par’12, 2013, pp. 567–576.
[8] CELAR Project, http://celarcloud.eu/.[9] S. Clayman, A. Galis, and L. Mamatas, “Monitoring virtual
networks with lattice,” in Network Operations and ManagementSymposium Workshops (NOMS Wksps), 2010 IEEE/IFIP, 2010.
[10] Cloud Application Management Framework (CAMF), Eclipse,https://projects.eclipse.org/projects/technology.camf.
[11] Cloud Computing Trends: 2014 State of the Cloud Survey, http://goo.gl/8i6ZPz.
[12] G. Copil, D. Moldovan, H.-L. Truong, and S. Dustdar, “Multi-level elasticity control of cloud services,” in Service-OrientedComputing. Springer Berlin Heidelberg, 2013, pp. 429–436.
[13] G. Copil, D. Trihinas, H.-L. Truong, D. Moldovan, G. Pallis,S. Dustdar, and M. Dikaiakos, “Advise: A framework for eval-uating cloud service elasticity behavior,” in Service-OrientedComputing. Springer Berlin Heidelberg, 2014, vol. 8831.
[14] M. B. de Carvalho and L. Z. Granville, “Incorporating virtual-ization awareness in service monitoring systems.” in IntegratedNetwork Management, N. Agoulmine, C. Bartolini, T. Pfeifer,and D. O’Sullivan, Eds. IEEE, 2011, pp. 297–304.
[15] V. C. Emeakaroha, M. A. Netto, R. N. Calheiros, I. Brandic,R. Buyya, and C. A. D. Rose, “Towards autonomic detection of{SLA} violations in cloud infrastructures,” Future GenerationComputer Systems, vol. 28, no. 7, 2012, special section: Qualityof Service in Grid and Cloud Computing.
[16] Flexiant FlexiScale Platform, http://www.flexiscale.com/.[17] Forbes - Youtube 2014 Q4 Earnings, http://goo.gl/2I6QAY.[18] I. Foster, Y. Zhao, I. Raicu, and S. Lu, “Cloud computing
and grid computing 360-degree compared,” in Grid ComputingEnvironments Workshop, 2008. GCE ’08, Nov 2008, pp. 1–10.
[19] Ganglia, http://ganglia.sourceforge.net/.[20] N. R. Herbst, S. Kounev, and R. Reussner, “Elasticity in cloud
computing: What it is, and what it is not,” in ICAC, 2013, pp.23–27.
[21] M. C. Huebscher and J. A. McCann, “A survey of autonomiccomputing - degrees, models, and applications,” ACM Comput.Surv., vol. 40, no. 3, pp. 7:1–7:28, Aug. 2008.
[22] G. Katsaros, R. Kubert, and G. Gallizo, “Building a service-oriented monitoring framework with rest and nagios,” in 2011IEEE International Conference on Services Computing (SCC),2011, pp. 426–431.
[23] A. Lakshman and P. Malik, “Cassandra: A decentralized struc-tured storage system,” SIGOPS Oper. Syst. Rev., vol. 44, no. 2,pp. 35–40, Apr. 2010.
[24] B. D. Martino, G. Cretella, and A. Esposito, Cloud Portabilityand Interoperability - Issues and Current Trends, ser. SpringerBriefs in Computer Science. Springer, 2015.
[25] J. Montes, A. Sanchez, B. Memishi, M. S. Perez, and G. Antoniu,“Gmone: A complete approach to cloud monitoring,” FutureGeneration Computer Systems, 2013.
[26] Nagios, http://www.nagios.org/.[27] North Bridge and Gigaom Research 2014 4th Annual Future of
Cloud Computing Survey, http://goo.gl/e6xkYL.[28] Okeanos Public Cloud, https://okeanos.grnet.gr/.[29] OpenStack, https://www.openstack.org/.[30] Paraleap AzureWatch, https://www.paraleap.com/AzureWatch.[31] J. Povedano-Molina, J. M. Lopez-Vega, J. M. Lopez-Soler,
A. Corradi, and L. Foschini, “Dargos: A highly adaptable andscalable monitoring architecture for multi-tenant clouds,” FutureGeneration Computer Systems, vol. 29, no. 8, 2013.
[32] D. L. Quoc, L. Yazdanov, and C. Fetzer, “Dolen: User-sidemulti-cloud application monitoring,” in IEEE Future Internetof Things and Cloud, 2014.
[33] Rackspace Cloud Monitoring, http://goo.gl/4BfqVf.[34] M. Rak, S. Venticinque, T. Mahr, G. Echevarria, and G. Esnal,
“Cloud Application Monitoring: The mOSAIC Approach,” inCloud Computing Technology and Science (CloudCom), 2011IEEE Third International Conference on, Nov 2011.
[35] D. Tovarnak and T. Pitner, “Towards multi-tenant and interop-erable monitoring of virtual machines in cloud,” in Symbolic andNumeric Algorithms for Scientific Computing (SYNASC), 201214th International Symposium on, 2012, pp. 436–442.
[36] D. Trihinas, G. Pallis, and M. D. Dikaiakos, “AdaM: an Adap-tive Monitoring Framework for Sampling and Filtering on IoTDevices,” in IEEE International Conference on Big Data, 2015.
[37] D. Trihinas, G. Pallis, and M. Dikaiakos, “JCatascopia: Monitor-ing Elastically Adaptive Applications in the Cloud,” in Cluster,Cloud and Grid Computing (CCGrid), 2014 14th IEEE/ACMInternational Symposium on, May 2014, pp. 226–235.
[38] D. Trihinas, C. Sofokleous, N. Loulloudes, A. Foudoulis, G. Pal-lis, and M. D. Dikaiakos, “Managing and Monitoring ElasticCloud Applications,” in 14th International Conference on WebEngineering. Springer Publishing, 2014, pp. 523–527.
[39] D. Tsoumakos, I. Konstantinou, C. Boumpouka, S. Sioutas,and N. Koziris, “Automated, elastic resource provisioning fornosql clusters using tiramola,” IEEE International Symposiumon Cluster Computing and the Grid, vol. 0, pp. 34–41, 2013.
[40] R. B. Uriarte and C. B. Westphall, “Panoptes: A monitoringarchitecture and framework for supporting autonomic clouds,”in Network Operations and Management Symposium (NOMS),2014 IEEE, May 2014, pp. 1–5.
[41] J. S. Ward and A. Barker, “Self managing monitoring for highlyelastic large scale cloud deployments,” in Proceedings of theSixth International Workshop on Data Intensive DistributedComputing, ser. DIDC ’14. New York, NY, USA: ACM, 2014.
[42] G. Xiang, H. Jin, D. Zou, X. Zhang, S. Wen, and F. Zhao, “Vm-driver: A driver-based monitoring mechanism for virtualization,”in Reliable Distributed Systems, 2010 29th IEEE Symposium on,Oct 2010, pp. 72–81.
[43] Zabbix, http://www.zabbix.com/.Demetris Trihinas is a PhD candidate at theDepartment of Computer Science, University ofCyprus. He holds a MSc in Computer Sciencefrom the University of Cyprus and a Dipl.-Ing.in Electrical and Computer Engineering fromthe National Technical University of Athens. Hisresearch interests include Application Monitor-ing, Cloud Computing, and Distributed SystemsBehavior Analysis and Estimation. His work ispublished in IEEE/ACM conferences such as CC-Grid, BigData, ICSOC, ICWE and EuroPar.George Pallis is assistant professor at the Com-puter Science Department, University of Cyprus.His research interests include Cloud Computingwith focus on Cloud Elasticity and Monitoring,Content Delivery Networks and Online SocialNetworks. His publication record is now at morethan 60 research papers which have appeared injournals, book chapters, and conferences. He isAssociate Editor in Chief in the IEEE InternetComputing magazine and he is also editing the”View from Cloud” department in this magazine.Marios D. Dikaiakos is a Professor of ComputerScience at the University of Cyprus, where heserved as Department Head between 2010-2014.He received his Dipl.-Ing. in Electrical Engineer-ing from the National Technical University ofAthens in 1988, and M.A and Ph.D. degrees inComputer Science from Princeton University in1991 and 1994, respectively. His research focuseson large-scale distributed systems with emphasison designing, implementing and experimentingwith systems and tools for Cloud and Grid Com-
puting, and the World-Wide Web. He has directed many funded researchprojects, published over 150 original peer-reviewed scientific papers, andlead the development of several (open-source) software tools.