IEA-GIA ANNEX III TASK Biea-gia.org/wp-content/uploads/2015/04/IEA-Annex-III-report-V3... · 1...
31
1 IEA-GIA ANNEX III TASK B Technology crossover between Engineering Geothermal System (EGS) and hydrothermal technology By Roy Baria 1 , Joerg Baumgaertner 2 , Dimitra Teza 2 & Ezra Zemach 3 ( 1 MIL-TECH UK Ltd, 2 BESTEC GmbH, 3 Ormat Nevada Inc.)
Transcript of IEA-GIA ANNEX III TASK Biea-gia.org/wp-content/uploads/2015/04/IEA-Annex-III-report-V3... · 1...

1
IEA-GIA ANNEX III TASK B
Technology crossover between
Engineering Geothermal System (EGS) and hydrothermal technology
By
Roy Baria1, Joerg Baumgaertner2, Dimitra Teza2 & Ezra Zemach3
(1MIL-TECH UK Ltd, 2BESTEC GmbH, 3Ormat Nevada Inc.)

2
Content List: Pages
1. Introduction: Purpose of this report 1 -2
2. Natural conditions and critical parameters
2A. Shearing Mechanism for enhancing in-situ permeability
2B. Joint orientation and distribution
2C. Stress regime
2D. In-situ fluid
2E. Stimulation flow rate
2F. Geological faults at depth
3. Methodology and technology to improve reservoir performance
3A. Infrastructure items which may need evaluation and rectification before
stimulation is carried out.
3Aa. Casing
3Ab. Casing cement
3Ac. Well-head tree
3Ad. Measuring instrumentation
3Ae. Mud pool or water storage reservoir
3Af. Allocation of safety zone during stimulation
3Ag. Health & safety aspect during the stimulation
3B. Diagnostic tools to help characterise hydraulic stimulation & the reservoir
3Ba. Access to hydraulic data
3Bb. Down-hole measurement during stimulation
3Bc. Tracer tests
3Bd. Pressure response in adjacent wells
3Be. Microseismic monitoring in real time
3Bf. Public relations and strong motion seismic sensors
3Bg. Daily reports on stimulation and activities associated with it
3C. Hydraulic stimulation of reservoirs
3Ca In-situ characterisation of background permeability/leak off
3Caa. Slug Test
3Cab. Production Test
3Cac Low flow rate injection test
3Cb Main hydraulic stimulation to create an EGS reservoir
3Cba A pre-stimulation test (MINI FRAC)
3Cbb Main stimulation of a well
3Cc Reinjection test to evaluate the main stimulation
4. Evaluation of how stimulation affected performance
4A . Stages increase in the circulation flow rate for circulation
4B. Increasing the energy output from the stimulated system
4C. Likely problems with reservoir characteristics and possible solutions

3
4Ca. Reduction of near wellbore impedance
4Cb. Reduction of the reservoir impedance
5. Lessons learned to facilitate successful cross-over of technology between
hydrothermal & EGS.
5A. Crossover of technology from EGS to hydrothermal
5Aa. Desert Peak site (ORMAT)
5Aaa. Initial proposal to the US DoE (DP 23-1)
5Aab. Revised proposal to the US DoE (DP 27-15)
5Ab. Hydraulic stimulation of DP 27-15
5Ac. Brady Hot Spring site (ORMAT)
5B. Crossover of technology from hydrothermal to EGS
5Ba Geochemistry
5Bb. Downhole submersible pumps
5Bc. High temperature well head & pressure control equipment
5Bd. Steam & binary power plants
5Be. Tracer testing
5Bf. Production logging
6. Observations & conclusions
7. Acknowledgement
8. References

4
1. Introduction : Purpose of this report
Geothermal resources are associated with regions of earth where the temperature is high at
shallower depth, and thus the most desirable, but these resources are concentrated in regions
of active or geologically young volcanoes. Large quantities of heat that are economically
extract-able tend to be concentrated in places where hot or even molten rock (magma) exists
at relatively shallow depths in the Earth’s outermost layer (the crust). Such “hot” zones
generally are near the boundaries of the continental plates that form the Earth’s lithosphere,
which is composed of the Earth’s crust and the uppermost, solid part of the underlying
denser, hotter layer (the mantle).
In a hydrothermal system, fluid migrates from the surface via faults and other permeable
conduits to a specific depth determined by the local geology and are stored as hot fluid
reservoir. Traditionally, these stored hot fluid zones are identified by surface expressions,
geological settings, geophysical surveys, drilling wells or a combination of these methods.
Boreholes are drilled in to the permeable zones of the hydrothermal systems to extract the hot
fluid. Cold fluid is re-injected into known local faults some distance away in expectation that
the cold fluid will be reheated and finds its way back to the known reservoir and thus form a
part of the recharge of the hydrothermal system.
During the exploration of a hydrothermal system, a number of wells are drilled to identify the
best permeable and hot zones. Not all of these wells are productive and therefore the random
selection of the position of the wells can be a great financial burden on the project. Some of
these dry wells (non-commercial wells) are used for reinjection but not always successful.
The purpose of this report is to see if the knowhow gained from the development of
Engineered Geothermal System (EGS) could be applied to hydrothermal system to improve
the overall production of fluid from other wells and thus the economics of a hydrothermal
system.
The concept of EGS was developed with the understanding that there is a significant
proportion of the upper crust which is hot but is not permeability enough to drain fluid from
the surface and store it as hot fluid reservoir at depth, similar to that of hydrothermal
reservoir. A concept was developed whereby an artificial permeability was created at great
depth to allow the fluid to circulate through this system and extract the stored geothermal
energy. The original concept was developed at Los Alamos (Smith M C, 1975) and consisted
of drilling in to a flank of a caldera to access high temperature and then enhance permeability
by injecting fluid under high pressure.
The concept was replicated at the Rosemanowes site in Cornwall, UK (Garnish J D, 1976;
Parker R. J, 1989) and many other sites in the world. The project at the Rosemanowes site
was at a shallower depth (2000m depth) and was specifically designed to understand the
physics of the process of creating enhanced permeability in igneous rock. It became soon
clear that the shearing of natural fractures was the main mechanism for enhancing
permeability and that understanding geo-mechanic of the site was a key to the success of this
technology.

5
Similarly, after some years of the development of EGS technology, it became apparent that
some of the geological and other aspects that play a key role in the development of a
hydrothermal system can also be transposed on the development of EGS system to enhance
its performance and thus the economics. For example, large faults at great depth in igneous
rocks were found to be highly permeable and capable to delivering high flow rate for a
sustained period.
This report discussed basic principles involved and technology crossover between
hydrothermal and EGS systems.
2. Natural conditions and critical parameters
Engineered Geothermal System (EGS) is a relatively new technology with tremendous
potential for providing heat and power, as well as helping to address the issue of reduction of
CO2 in the environment. The technology is complex and it has taken some time for a series of
research projects globally to understand the physical processes involved, develop supporting
technologies such as high temperature instrumentation, numerical models etc and to validate
the concept. The most advanced and near commercial scale EGS project until recently was
the European EGS project at Soultz-sous-Forêts, north of Strasbourg in France. Knowledge
gained from over 30 years of research carried out at other EGS projects formed the basis
upon which the European project was built (Abe et al., 1999; Baria et al., 1992, 1995;
Baumgaertner et al., 1996, 1998). This research has been superseded by two commercially
funded projects at Landau and Insheim in Germany (Dimi & Joerg References) which uses
the knowhow form both EGS and hydrothermal projects to create sustainable geothermal
project.
Anyone with experience of natural materials like rocks knows that there are always
imponderables that have not been really understood and indeed cannot at present be dealt
with in a fully satisfactory manner. Furthermore, geology always has a habit of presenting us
with new problems. One of the major overriding factors is the in-situ stress, both magnitude
and direction. Geo-mechanics plays an important part and even the configuration of the
injection and production well is strongly influenced by it. Some of the natural conditions
which need to be understood and play an important part are as follows:
2A. Shearing Mechanism for enhancing in-situ permeability
Enhancement of permeability is one of the key factors in this technology and the mechanism
used for this is important to understand. Up until 1980, the key mechanism put forward for
enhancing the in-situ permeability was hydrofracking and the use of propant to keep the
newly created fractures open. By early 1980’s research at various sites (Pine R.J. and
Batchelor A.S., 1984) confirmed that the creation of new hydraulic fractures in igneous rocks
was not the dominant process but that the shearing of natural joints, favourably aligned with
the principal stresses of the local stress field was a more important mechanism. These joints
fail in shear because the fluid injection reduces the normal stress across them, but at the same
time only marginally affects the magnitude of the shear stress. The residual increase in the
joint aperture (permeability) is caused by displacement of the joint which is resting on the
roughness of the asperities. This is a permanent residual increase in the permeability. The
shearing mechanism allows frictional slippage to occur before jacking and therefore there
will be a component of shearing ahead of any “jacked” zone (Baria R. et al., 1985; Baria R. &
Green A.S.P., 1990).

6
One of the most significant outcomes of the various international research projects to date has
been this realisation that shearing on existing joints constitutes the main mechanism of
reservoir growth. This has led to a basic change in our vision of an EGS reservoir. It has led
to a departure from the conventional oil field reservoir development concepts and techniques
towards a new technology related to the uniqueness of any jointed rock mass subjected to a
particular anisotropic stress regime.
Additionally, the progress in the shearing process during an enhancement of permeability
(stimulation) can be tracked using a microcosmic system and then the process can be
evaluated using the microseismic/tracer data.
2B. Joint orientation and distribution
The distribution of joints with depth and their azimuth is very critical. The orientation of the
joints in relationship to the stress field will determine to a large extent the pressure required
to stimulate the rock mass. It has been found that in a Graben setting, not only the natural
joints but also hydrothermalised faults or swarms of joints play a dominant part, as these form
zones for flows of in-situ brine in natural convection. At the Soultz site it was observed that
the hydrothermalised joints/fault played an important part and was the main hydraulic
connections between the wells and the reservoir.
2C. Stress regime
The stress regime (Haimson B., 1978; Rummel F., 1986; Batchelor et al., 1983) is another
factor that is critical for the creation of an EGS reservoir. The direction in which the reservoir
will grow is dependent predominantly on the orientation of the joints and their relationship
with the maximum principle stress direction.
Therefore, it is essential to have a critical evaluation of the stress regime at the site of
operation. This includes orientation and gradient of the magnitudes with depth. Stress
evaluation can be carried out using various methods or a combination of them. Some of these
methods are a) hydro fracture stress measurement using hydraulic straddle packers at various
depths in the well to get gradient and orientation, b) evaluation of drilling breakouts c) taking
core samples and evaluating it in a laboratory, d) using background natural earthquakes to
construct fault planes and thus stress values. One method which is most reliable for
determining the stress field with depth is the hydro fracture stress measurement but it is the
most expensive.
Both observations and numerical modelling have shown that the joints which are aligned
favourably (~22 degrees) with the maximum stress direction will shear first. As the pressure
builds up, joints in other directions will start to fail as well until the pressure reaches the
minimum earth’s stress when a classical tensile failure will occur. If the maximum in-situ
stress is in the horizontal direction than the injected fluid will migrate ~22.5° from the
maximum stress direction because this is the least resistance to flow using shear mechanism.
In-situ stress has a strong influence on the direction of the growth of the artificially created
EGS reservoir. Examples, in shallower EGS systems where the minimum principle stress was
the overburden stress (Batchelor A.S. and Pearson C.M., 1979), it was observed that the
reservoir grew in a near horizontal direction. A number of other EGS reservoirs created in a
stress regime where the vertical stress was the intermediate stress, the reservoir grew
downwards. Similarly it was observed that in an isotropic geological environment (in welded

7
Tuff) where there were relatively very few joints, the reservoir followed the line of least
resistance - i.e. opening occurred against minimum in-situ stress (GHEE project in Japan,
Takahashi et al 1987). The stress field is one of the key factors controlling not just the
creation of the reservoir but also subsequent operations and heat extraction. For example,
during a circulation period, if a reservoir has to be operated using injection pressure near or
above the minimum in-situ stress to additionally dilate the fracture apertures to increase the
fluid flow across the wells, there is a good probability that runaway growth of the stimulated
rock volume will occur, leading to an undesirable increase in water losses and additional
seismicity.
Observation on the influence of reservoir growth direction related to the in-situ stress:
i. Normal faulting regime (vertical stress is the minimum): reservoir development in the
horizontal to upwards direction (300 system at Rosemanowes; Batchelor A S 1977,
Cornwall; Swedish project ??, François Cornet ??; Geodynamics ??, Cooper Basin,
Australia).
ii. Strike-slip regime (vertical stress is the intermediate stress): reservoir development in
the horizontal to downwards direction (Rosemanowes, Baria R et al 1985)
iii. Operating reservoir close or above the minimum stress regime: high fluid losses,
continuous reservoir growth and increases induced seismicity (Parker R H 1989)
2D. In-situ fluid
The in-situ fluid also plays a role in the creation of a reservoir (Gerard et al., 1997). The
fluid’s density and pressure are critical when the minimum stress is closer to the hydrostatic
pressure at reservoir creation depth, as the resulting change in the density can influence
formation and of the direction of growth of the reservoir. For example, if fresh water is used
during the stimulation and the in-situ fluid is brine, then there is likely to be an upwards
migration of the injected fresh water due to the critical stress state, almost certainly
influencing the direction of growth of the reservoir.
2E. Stimulation flow rate
Water injection flow rates for classical EGS systems in tightly confined, low permeability
rocks (< 10 microdarcy, 10-17 m2) are designed to produce a network of flowing connections.
Any fracture with a residual aperture greater than molecular size will transmit pressure and
permit flow, even at very low rates, provided it is part of an open and connected flowpath.
Increased pressure causes the joint to widen by the elastic compression of the adjacent block,
the rigid body motion of the blocks surrounding the zone and by any dilation caused by shear
movements. Witherspoon and Wang, 1980 have shown that the permeability of a rock joint is
a function of the cube of aperture width. This is derived from the Couette flow relationship
for laminar flow between parallel plates (see for example: Hopkirk et al., 1981).
In a rock with a low intrinsic permeability of the matrix (10-21 m2, 10-3 micro Darcy), joints
form the only detectable flow paths. Field measurements by Black J.H., 1979 show that field
permeability lies mostly within the range 10-17 - 10-16 m2 (10-100 microdarcy), implying
naturally occurring effective joint apertures of 5 - 35 microns at around 1 m spacing. The 1 m
spacing value has been based on surface observations and borehole logging. Doubling the
joint width results in an eight-fold reduction in a pressure gradient along the joint. The
stimulation process has to widen the existing joints and thus permit pressures to be applied to
regions remote from the well.

8
It is essential to have a minimum of three stepped flow rates during hydraulic stimulation
(creation of an EGS reservoir and preferable four if possible). The first flow rate is
determined for a pressure which is just above that required for shearing to take place at the
reservoir depth followed by a number of increased flow rates. Highest injection flow rate is
determined by the expected circulation flow. A rule of thumb is that the highest stimulation
flow should be around twice the expected flow rate for circulation.
If, right at the beginning, a rapid high flow rate injection (> 100 kg/s) is carried out, this will
open preferentially oriented joints approximately normally to the minimum principal stress
and widens joints to balance the head loss. Permeation at right angles will occur into
connected members of other families of natural joints, but the penetration of these will be
small compared with the axial extent of the reservoir. The converse situation occurs when a
low flow of water, at less than joint opening pressures, permeates in all directions along open
joints in random directions.
2F. Geology & geological faults at depth
Geology is a key parameter in the development of a hydrothermal system and in particular
the geology associated with the permeable faults and structures associated with either
underground fluid storage or transport. Identifying the required geology and delineating its
characteristic at depth are important for the development of hydrothermal ssystem.
Predominantly hydrothermal fields are in sedimentary/volcanic environment.
For a conventional EGS development, the geology is predominantly in an igneous rock
environment where joint characteristics play an important part for the development of
permeability. During the early days of the development of the EGS technology (1980’s),
there was a belief that as one gets deeper in the igneous rock massif, the joint spacing
increases, in-situ permeability decreases, rock matrix porosity decreases and therefore the
presence of faults at greater depth was most unlikely. This has not been the case and the data
from various deep wells show the presence of permeable faults with inexhaustible flow of in-
situ fluid (References ??).
Presently, the term ‘EGS’ now also encompasses the exploitation of fluid filled faults at
depth with favourable orientation within the prevailing stress field (e.g. Barton et al. 1995;
Finkbeiner et al. 1997). Experience and knowledge to date indicate that some large faults that
are approximately aligned in the maximum horizontal stress direction at depth, are likely to
be open and are able to deliver large flow rates of hot fluid for power generation (e.g. Barton
et al. 1997). A production well is drilled orthogonally to intersect a large fault at depth that is
striking in the direction of maximum horizontal stress. Significant flow rates might be
immediately achievable. If not, then stimulations may be necessary to enhance the flow rate
by decreasing the flow impedance. A similar method is used to drill a second well (injection
well) some distance away and offset from the first fault. In planning such a strategy, it is
important to recognise that stimulation of either or both wells may be necessary to reduce the
natural hydraulic impedance. EGS projects based on this model have already been
commercialised at Landau and Insheim in Germany (www.geox-gmbh.de/en). The EGS
reservoir has been producing for around five years with no indication of reduction in the flow
rate, or thermal drawdown. The data from the project is not widely circulated due to the
commercial nature of the project.

9
To a large extent, the radiogenic nature of the granite determines the temperature at depth and
thus the exploitation depth. Granite with high radiogenic material is hotter than one with
lower radiogenic material.
3. Methodology and technology to improve reservoir performance
Observations and experience show that the depth drilled in hydrothermal systems is
significantly shallower than that for EGS systems. The completion of the well and basic
geological and geo-mechanic information obtained in hydrothermal systems is relatively
limited. Basically this is due to the site being sold on to new owners a number of times and
therefore the details and specifications are lost. Additionally, hydrothermal exploitation is a
commercial operation and to make it commercially viable, sometimes, materials and other
operations are carried out with very limited budget and long term reliability may not be a
primary goal. Therefore, the basic infrastructure associated with dry or unproductive wells
proposed for stimulations needs to be assessed and brought up to an acceptable standard, if
necessary. A rough upper limit of operating parameters used as a reference for carrying out a
stimulation in shallow hydrothermal fields would be around 1,500 psi (~10 MPa), a
maximum flow rate of around 2,500 gpm ( ~150 l/s ) and a volume of around 190,000 US
barrels (30,000 m3) (check these figures).
3A. Infrastructure items which may need evaluation and rectification before stimulation
is carried out are as follows:
3Aa. Casing.
It is imperative to assess that the casing is in a good condition for it to be able to be
pressurised for stimulation. If the well has been abandoned for a long period, the casing may
have corrosion, hole in the casing, collapsed section in the casing and may even be partially
filled up with debris.
I. It is imperative to examine existing records for this information on its integrity
and specification
II. Run a sinker bar to assess how deep is the well is open to
III. Run a calliper log to check the diameter of the casing.
IV. Run a low flow rate injection test in the well with flow logs to identify any
leaks/holes in the casing. Use high sensitive flow impeller that can measure flows
of around 0.1 l/s.
3Ab. Casing cement.
It is imperative to assess that the cementing of the casing is in a good condition to be able to
be pressurised for stimulation. If the well has been abandoned for a long period, the
cementing may have deteriorated.
I. It is imperative to examine existing records for this information
II. Run a cement bond log.
III. Run a low flow rate injection and examine the annulus near the well head for
leaks and identify any flow leaving just below the casing with flow logs. Use
high sensitive flow impeller that can measure flows of around 0.1 l/s
3Ac. Well-head tree
High pressure well heads are relative expensive and therefore in a hydrothermal system the
cost is kept down by using ones with relatively low operating pressure. Typically this is
around 900 psi (~6 MPa). It will be necessary to change the well head to bring it to a high

10
pressure rating but this also depends on the pressure rating of the casing. During stimulation
it is preferred to have two well heads, one mounted above the other. The upper wellhead is
used for connection of injection pipe work. Lower well head is for emergency in case the
upper wellhead does not function or something is trapped within the well head. The well head
assembly has to be anchored soundly to the platform using tie bars so it does not vibrate or
move up if there is a failure of the cement.
3Ad. Measuring instrumentation
The following instrumentation needs to be mounted and tested before the injection test and
maintained during the injection period.
I. Pressure gauge needs to be mounted on the well head to measure the injection
pressure. Preferably two, in case of a failure. The pressure rating of the pressure
gauge should be higher than that of the well head, preferably by around 2,000 psi.
Wireless sensors are preferable as this reduces accidental damage to the cable or cold
tubing which relays the data from the sensor to a data acquisition room.
II. Appropriate flow meter needs to be installed in the injection pipe line, taking in to
consideration that it may be necessary to flow back the hot in-situ fluid to the surface
to either relive the reservoir pressure or carry out a production flow test after the
stimulation.
3Ae. Mud pool or water storage reservoir
Adequate storage of water resource is necessary (10,000 m3) if high flow rate injection is
necessary. Alternatively, a small mud pool (~600 m3) is constructed and the pool is
replenished to cope with the injection flow by a water supply pipe.
3Af. Allocation of safety zone during stimulation
It is a good practice to cordon off area of potential high risk with wooden stakes and bright
coloured ribbons. This is normally deployed around the high pressure pumps and well heads.
Only nominated people are allowed in the cordon off area such as pump operators and
geophysical logging. All staff operating in this zone has to be kitted out with appropriate
safety gear and to make sure that appropriate communication radios are provided to report
any dangerous situation that may arise.
3Ag. Health & safety aspect during the stimulation
A staff meeting has to be organised before any hydraulic tests are carried out to make sure
that they are aware of the danger and the cordoned off zone. Chain of responsibility is
defined and appropriate measures are put in place in case there is an accident. A trained staff
who can administer first aid must be on site. All accidents, however small must be recorded
in the accident book. All staff entering the stimulation area must sign in and sign out when
they leave the site. A dedicated phone is put in place to contact emergency service in case of
any accident.
3B. Diagnostic tools to help characterise hydraulic stimulation & the reservoir
During stimulation, various diagnostic techniques are used to help to understand and
characterise the stimulated reservoir. Some of these techniques are listed below and reasons
for using them. It is important to stress that the majority of the data (hydraulic & seismic)
should be made available immediately in order to help in the decision making during the
stimulation, such as whether to continue stimulation with the same flow rate, change the flow
rate or stop the stimulation.

11
3Ba. Access to hydraulic data
Hydraulic data from the injection wellhead may consist of the well head pressure, injection
flow rate, the annulus pressure and downhole pressure (a pressure tool parked just inside the
casing). All the above digitised data should be available for evaluation and plotting without
stopping or crashing the system. There should a display of these data on a large screen in real
time so that the injection history can be viewed at a glance to help make faster decision.
Additionally, well head pressure data from other adjacent wells should also be available in
order to assess if the injected flow is interacting with reservoir pressure near these wells and
get some idea of the interaction of the injected flow with the reservoir.
3Bb. Down-hole measurement during stimulation
In it very important to know what is the exact pressure in the main exit flow, the flow
distribution as a function of the flow injected and the temperature variations in the open-hole
during stimulation, particularly if the well is deep. Depending on the in-situ stress regime and
the far field connectivity of the flow exits from the well, the flow proportion from specific
exit zone may change from being dominant to being a minor flow zone. It is important to
know the change in the distribution of the flow exits as this may help to find out define the
operating pressure during the circulation.
In a conventional hydrothermal system, it is normal to just take the well head pressure as the
main pressure measuring point. The actual pressure at the zone being stimulated in the well is
estimated from the well head pressure. Additionally, it also common practise to use tubing
mounted inside the casing to carry out stimulation. This tubing can be significantly smaller in
diameter than the casing and thus increases the friction losses during injection and thus gives
a poor measure of the pressure exerted on the formation at depth.
During stimulation in an EGS system, a production logging tool consisting of a sensitive
pressure, flow and temperature transducers, is parked just inside the casing shoe. A recording
of the changes in the these parameters with depth is logged at each injected flow rate by
running the tool to the bottom and then bringing it back inside the casing shoe. This gives
measure of the changes that might occur in the formation during stimulation at the specific
flow rate.
The use of a production logging tool during stimulation needs a winch with appropriate
logging cable, a riser assembly with associated gear, a data acquisition system and an
experienced logging engineer.
3Bc. Tracer tests
The use of tracers is extensively used in hydrothermal and EGS systems to characterise the
flow paths and flow distribution. The use of the tracers depends on specific stage of the
development of a reservoir.
After the drilling of the first well, stimulation is carried out to develop the reservoir
and also to assess where the second well should drilled. It is useful to put a long
resident tracer at the beginning of the stimulation. The tracer is pushed forward in to
the formation and to a large extent defines how far the flow has migrated to from the
injection well. During the drilling of the second well, drilling fluid samples are taken
regularly and analysed for the injected tracer in the first well. This is a good indicator
of how far the injected fluid has migrated to and at what depth are these flow
connections associated with the stimulation of the first well.

12
During the initial circulation test between the two wells, a short resident tracer is
injected in the injection well and samples at regular intervals are taken form the
production well. The time taken between when the tracer was injected and recovered
from the production well is called a breakthrough time and is an indicator of the
quality of the direct flow paths in the reservoir. A very quick return means an
existence of preferential flow path (short circuit) which can lead to the cooling of the
system. Too long a breakthrough may indicated that the hydraulic connection between
the injection and the production well is poor may suffer from higher impedance and
thus high parasitic losses. In this case additional hydraulic stimulation of the system
may be necessary.
During a circulating system it is useful to carry out tracer tests periodically using short
resident tracers to forecast a possible development of a preferential flow path.
Breakthrough period is plotted against operating months. If the breakthrough period
shortens rapidly as a function of time than there is a good probability of the
development of a preferential flow path. Remedial measure can be taken to seal this
path or divert the flow though other paths.
Another characteristic of the tracer is called “modal volume”, which is an envelope of
the recovery of the bulk of the injected tracer. The concentration of the tracer per unit
volume recovered is measured and plotted as a function of time. A larger the modal
volume indicates that a larger reservoir/rock volume has been accessed and
conversely, a smaller modal volume indicates that not enough rock volume has been
accessed and therefore there is a potential of the system cooling down earlier than
anticipated.
3Bd. Pressure response in adjacent wells
The way the pressure migrates during stimulation is very important to get some idea on the
growth of the reservoir and also if the design of the stimulation using the selected injections
flow/pressure is appropriate. In a relatively open hydrothermal system, occasionally it may be
difficult to reach shearing pressure and therefore there is less chance of seismicity occurring
during stimulation. This makes it difficult to assess the pressure migration, in particularly the
direction it takes and how far it has reached. Monitoring the well head pressure in adjacent
well is another method of getting some idea of the pressure migration. It is relatively cheap
and very helpful to support the data observed from seismicity.
3Be. Microseismic monitoring in real time
Microseismic monitoring during reservoir creating and subsequent circulation has become
one of the most important diagnostic methods for understanding and characterising a
reservoir. It is relies on the fact that in an anisotropic stress regime, it is easier to shear a
critically aligned joint at a pressure significantly below that of tensile failure. The seismic
energy radiated from shear is significantly more efficient and well defined. This makes it
easier to detect and locate the source of the dislocation of joints caused by the increase of
pressure in the joint at that specific place. Automatic detection and location of these events in
real time gives the reservoir engineer an insight in to what happening during stimulation and
helps him to control the flow and length of the stimulation. Additionally, seismic data is also
used for targeting the second well in an EGS system and therefore precise locations are
essential to help locate the 2nd well in the correct position.
In a hydrothermal system, the generation and migration of seismicity during stimulation
indicate that the reservoir is being stimulated and the direction of migration will indicate the

13
direction the injected flow/pressure is taking. This is one of the methods for determining the
stimulated reservoir size and the direction of the growth.
Some of the basic rules for establishing an adequate microseismic system are defined below
for guidance:
I. Number of seismic sensors
Six seismic stations are regarded as minimum configuration which gives a possibility of one
station breaking down and still able to maintain the seismic monitoring with some degree of
confidence. The layout of geometry used for seismic stations is important in terms of the
systematic errors caused by poor geometry and also being able to relay the data back to the
main observation/processing room.
II. Type of sensors
It important to select seismic sensor which have as low a noise figure as possible, large
inherent output, broad bandwidth (2-500 Hz), low output impedance and very reliable. It is
preferable to have the sensors deployed in shallow boreholes to improve the signal to noise
ratio on order to detect very small events.
III. Velocity model.
It is very important to obtain a good in-situ velocity model of the in-situ rock mass in order to
locate the seismic events with good precision. This can be carried out using an explosive at
the bottom of a well and record the arrival time or using explosive on the surface at each
seismic station and a sensor deployed at the bottom of the stimulation well.
IV. Automatic Location Algorithm.
A number of commercial software or academically based software is available to carry out
this task. It is important that a basic research on the provider and the user to see if it what one
wants.
V. Additional Information from seismic data.
Automatic location of the induced seismic event is the first priority of a seismic system but
additional properties of the failed fault can also be determined. These are source parameters
(length of fault failed, stress drop across the fault, seismic every released etc) and fault plane
solution (strike of the failed joint).
3Bf. Public relations and strong motion seismic sensors
It is imperative to establish a good relation with the regional authority and the local residents.
It is essential to explain to them what is being proposed and how it will affect them. This
needs to be done prior to the proposed stimulation and not afterwards. It is very important to
install few strong motion seismic sensors in appropriate places to register ground acceleration
and the dominant frequency. This is to address any structural damage issues to local
properties in case a very large induced event occurs. A guide line is available for IEA/GIA
website & publications (http://iea-gia.org/wp-content/uploads/2014/01/Protocol-for-Induced-
Seismicity-EGS_GIA-Doc-25Feb09-ed9Mar10.pdf)

14
3Bg. Daily reports on stimulation and activities associated with it.
It is a good practice to prepare a daily report which documents the actual activity of the
previous day and the planned activity for the current day. This included belief injection
history, seismicity generated, operational activity log, any specific difficulties and future
requirements so that they can be in place when needed. These reports can be distributed to
interested parties to inform them of activates being carried out. It is also a good way keeping
daily operational log which can be accesses in the future for reference.
3C Hydraulic stimulation of EGS reservoirs.
In a virgin environment, once a deep well is completed, geophysical logs will be carried out
to quantify the temperature profile, joint network data, in-situ stress profile, sonic log etc. In
a high temperature environment the well may need to be circulated and cooled before these
logs can be carried out, except for a temperature log. The only useful temperature
information obtained during drilling or just after drilling, is the bottom hole temperature, as a
temperature profile will be affected by the cooling caused by the drilling of the well. The
temperature to reach the natural equilibrium may take anything up to 3 months after the
drilling is completed. Before a stimulation can take place, a number of hydraulic tests will
need to carry out to characterise the in-situ permeability, flow exits from the well and
pressures at depth.
3Ca In-situ characterisation of background permeability/leak off
Following the assessment of the in-situ conditions from geophysical logs, small scale
injection tests will be required to assess undisturbed hydraulic properties of the open section
of the well. The quantity of water and the pressure required will depend on the state of
existing flowing joints and tightness of the formation. Estimation will be made on the
requirement of the water for these tests.
3Caa. Slug Test
A slug test is normally conducted to obtain initial information about the hydraulic properties
of the undisturbed rock mass at depth, after the completion of the well. By definition, a slug
test is the response of a well-aquifer system to an instantaneous change of the water level, i.e.
a response to an impulse in flow. This impulse excitation can be achieved eg by the sudden
withdrawal of a weighted float or by the rapid injection of a small volume of water.
It is normally easier to inject fresh water from a water line. The water level in the well has to
be around 30m or deeper to allow the filling of the well. A sensitive down-hole pressure
transducer is deployed below the water level. The well is filled at around 10 l/s until the
height of the water level has increased by around 15 to 20m. After the injection, the pressure
decay in the well is monitored until it reaches a steady state. Additional tests can be carried
out with increasing heights to 25m and 35m to confirm or check if the initial pressure has
influence on the response. To meet the criteria for an impulse excitation it is necessary that
the time required to raise the water level is negligible. These tests are important to assess the
initial hydraulic condition of the open-hole section.
Additionally, the slug test will also give information required to design the subsequent low
rate injection test. The total amount of water used is negligible i.e. in the range of 2-5m3.

15
3Cab. Production Test
An explanation to carry out a production test falls outside the brief of this report but it was
felt that a mention should be made and its importance pointed out.
A production of formation fluid will yield important information about the p-t conditions in
the environment at depth for the future heat exchanger. Furthermore, the fluid chemistry and
the gas content are important parameters to design the pilot plant in such a way that scaling
and corrosion can be minimized. However, it is unlikely that a sufficient amount of fluid
could be produced by the natural permeability at 5-6km depth.
A well can be put on production by using a buoyancy effect or a down-hole pump. It is
preferable to use a down-hole submersible pump where possible. A submersible pump can
be deployed at a depth of around 100-150m. Depending on the outcome of the slug test, it is
probable that the well could produce something like 1m3/hr. Additionally, a down-hole
pressure gauge, gas sampling (or gas trap) at the wellhead and a surface flowmeter would add
further information on the draw-down characteristic of the well.
If it is planned to carry out a production test, then it will be necessary to have some water
storage facility to store the in-situ water which may vary from fresh water to brine, depending
on the geological setting. A storage facility of around 450m3 will be required at the surface if
one produces three wellbore full of in-situ fluid from a 4000m deep well with 8.5” nominal
diameter.
3Cac. Low flow rate injection test
The main objective of the low rate injection test is to determine the hydraulic properties of
the un-stimulated open-hole section of the well. The derived values will be used as inputs for
numeric models, planning of the stimulation (pressure required for a stimulation),
subsequently for the assessment of the stimulation and identification of predominant flowing
zones, using a temperature or flow log.
Three or four injection tests with flow rates from around 0.2 l/s to 0.6 l/s are carried out. The
injections are carried in sequence for around 8-10 hrs and shut-in for 12-14 hrs after each
step. Wellhead or (preferably) down-hole pressure (close to the casing shoe) is monitored to
get the actual pressure near the open-hole. Something like 45-50 m3 will be required to carry
these tests (for 3 tests).
3Cb. Main hydraulic stimulation to create an EGS reservoir
The objective of the stimulation test is to initiate shearing of joints in order to create the
enhancement of permeability and thus develop a HDR reservoir (sometimes called a heat
exchanger) at the required depth. Normally a pre-stimulation test is carried out to test that all
wellhead sensors, seismic system, down-hole PTF tool, injection pump etc are working
satisfactorily prior to the main stimulation test. A pre-stimulation test will also show if
evaluations (injection pressure) derived from previous tests were correct. After the
stimulation, a post-fracturing injection test is carried out to quantify the efficiency of the
stimulation.
3Cba Numerical modelling of an EGS reservoir
Once the in-situ properties are obtained it is possible to make forward modelling (Wills-
Richards, J. et al 1996; Bruel 1997; Deb, R. & Jenny, P. 2015) of the creation of an EGS
reservoir and evaluate its properties. There are a number of numerical geo-mechanic models

16
available to scope and design stimulations (Fracsim 3D, Tough 2,(www.altcom.co.uk) ;
AltaStim, (www.altarockenergy.com); 3DEC, (www.itascacg.com/).
It is important to take in to consideration that the models assume ideal conditions and anyone
with experience of natural materials like rocks knows that there are always imponderables
that have not been really understood and indeed cannot at present be dealt with in a fully
satisfactory manner. Furthermore, geology always has a habit of presenting us with new
problems. One of the major overriding factors is the in-situ stress, both magnitude and
direction. Geomechanics plays an important part and even the configuration of the injection
and production well is strongly influenced by this.
3Cbb. A pre-stimulation test (MINI FRAC)
This test consists of injecting something like 400-600m3 of fluid at a constant flow rate of
around 5-7 l/s. One can use either fresh water or saturated brine. Saturated brine can be very
useful in helping stimulation near the bottom of the well but this will depends on the state of
the in-situ stress. After the pre-stimulation test the wellhead is shut in to see how the pressure
declines. This will give some indication of the leak off or far field connectivity.
3Cbc Main stimulation of the a well
During the main stimulation, fresh water is injected in steps with increasing flow rates. Three
to four flow rate steps are normally used. The flow rate steps may vary depending on the
leak off or whether it is a closed system or an open system. Flow rate steps of around 30, 40,
50 and maybe 70 l/s are not unreasonable. Normally, the selected step of injected flow rate is
continued until the wellhead or down-hole pressure reaches an asymptote showing that the far
field leak off is balanced by the injected flow. This is feasible in a relatively open system but
most observed HDR system have poor far field connectivity and therefore the wellhead
pressure is likely to continue increasing. In this case, injection may be carried out at 30 l/s
for 24-30 hrs, 40 l/s for 24-30 hrs, 50 l/s for 24-30 hrs and 70 l/s for 3 days. The injected
volume may vary between 28,000m3 to 31,000m3 depending on the flow and the injection
period.
3Cc Reinjection test to evaluate the main stimulation
A post-stimulation test is conducted to evaluate the enhancement in the permeability obtained
during the main stimulation of the reservoir. Possible injection flow rates would be around 7,
30, 40 and 50 l/s for about 12, 12, 24, 12 hrs. The apparent reduction in the injection pressure
compared to the initial injection pressure required for the same flow rate will give
quantitative indication of the improvement in the permeability of the stimulated rock mass.
The total volume of water used for this test could be around 7,200m3.
4. Evaluation how stimulation affects reservoir performance
To assess the quality of the stimulation will depend on it’s application to some degree. In a
traditional EGS system in an igneous rock environment, the stimulation is carried out to
enhance the permeability of the selected rock mass and also to find the target for the second
well to complete the circulation loop.
In a hydrothermal system, this type of stimulation could be used for enhancing the
permeability of dry well so that it can be connected to the main reservoir and thus turning a
non-commercial well to a commercial well. It is very important to make sure that the

17
proposed dry well is oriented in the right direction to the main reservoir using the geo-
mechanical data.
4A. Staged increase in the circulation flow rate for circulation
Once a hydraulic link between either the two wells has been established, a small-scale
circulation loop between the wells will need to be established. In a traditional EGS system,
separation of wells are in the range of 600m and a good hydraulic link between the wells
would show a breakthrough time for a tracer of around 4 to 6 days. The storage of injected
fluid in the reservoir may increase to accommodate 20 l/s flow through the system. An
assumption is made for the storage or charging of the reservoir. This is associated with the
lag in the production flow because of the breakthrough time (~5days) and an estimated 20%
of the injected volume before the breakthrough occurs could be stored in the reservoir, either
in dilated apertures of the joints or in the rock matrix.
An initial starting step of 20 l/s is considered reasonable which would suggest that around
2600m3 will be required to initiate a circulation test. Taking a worst scenario of losing 10%
in the formation via leak off, this will bring the figure up to 3,600m3 for a three-week
circulation test.
Note: A separator, a heat exchanger, a heat load and water storage facility will be
required to implement this test.
This is a critical stage and in principle there should not be any need for further treatment
provided everything works to the plan and the natural conditions in the underground are
favourable. But if the above low flow rate circulation test shows that the total impedance for
circulation was above 0.3 MPa/l/s (or another estimated from an economic model) then
further treatments might be needed to improve this. Data from previous hydraulic tests will
need to be examined to see if the higher impedance (restriction to flow) is near the wellbore
or further out in the reservoir. This is discussed in chapter 4c.
4B. Increasing the energy output from the stimulated system
The above circulation using around 20 l/s needs to be maintained for a few weeks. Cold water
(~30-40°C) is injected in the injection well and the recovered hot fluid (150°C or higher)
passes through a separator and then a heat exchanger to dump the heat. By maintaining the
circulation, the injected cold water helps to increase the near well bore permeability by
cooling joints and thus increasing the aperture between the joints. Additionally, this process
also takes place in the formation between the injection and the production well and helps to
increase the flow rate between the wells.
If necessary, the flow rate through the system can be increased in small steps to recover more
energy output but care has to be taken not to increase to fast to otherwise there is a possibility
of a development of a preferential path sometimes referred to as short circuit?
Normally, it is preferable to increase the flow rate in smaller flow steps and to allow the
thermal contraction of the joints to increase the joint aperture and allow larger flow to take
place without causing a short circuit. Microseismic monitoring is important at this stage to
make sure that overpressure does not create another flow path which may divert the injected
flow away from the main reservoir.

18
Regular tracer tests using short resident tracers (fluorescein) need to be carried out to
determine both the breakthrough time and the modal volume. If the breakthrough time and
the modal volume decrease rapidly between tests then this is an indication of the development
of the sort circuit. Ideally, the breakthrough time should remain similar but the modal volume
should increase indicating that the injected water is accessing much larger volume of the rock
mass.
4C. Likely problems with reservoir characteristics and possible solutions
If the initial circulation or hydraulic tests show that the overall hydraulic impedance is higher
than desired. This is most probably due to either flow exit restriction near the wellbore or in
the main reservoir.
If hydraulic tests show that there is a restriction near the wellbore then proposal in chapter
4Ca ought to be implemented. If the restriction is deeper in the reservoir then proposal in
chapter 4Cb will need to be implemented. The problem of high impedance near the wellbore
and in the reservoir can also be treated by other methods such as an injection of proppant or
using viscous gel etc.
4Ca. Reduction of near wellbore impedance
If the hydraulic test data indicates that there is a need to improve the near wellbore
impedance to reduce the friction associated with a turbulent flow in the flowing joints then a
very high flow rate injection will need to be carried out to mobilise as many joints as possible
from critically aligned to the sigma max direction. This will mean reaching injection
pressure above that of the sigma mean value at depth. Experience has shown that injection
flows in the range of 75-100 l/s may help in solving this problem but care must be taken not
to damage the cement at the casing shoe. The flow volume in the range of 2000m3 should
suffice but this may need to be re-evaluated depending on the available data. Additionally,
care should also be taken not to damage the formation and block the well from breakouts,
pieces falling off the borehole walls etc.
It is very helpful to run flow logs before, during and after the hydraulic stimulation to
quantify the changes in the flow paths, identify new flow paths and the distribution of the
flows with reference to the depth of the open hole.
4Cb. Reduction of the reservoir impedance
If the hydraulic data indicates that there is a need to improve the impedance to flow within
the reservoir due to a possible lack of connectivity between the wells then a proposed method
to improve this could be to inject in both wells simultaneously (focussed injection). Flow
rates injected in each well will depend on where the restriction is envisaged. Assuming that
the over pressure to shear joints is the range of 2-3 MPa and the restriction is the middle of
the reservoir, then an injected flow of between 30 to 50 l/s for up to 24 hrs may be sufficient
to improve the connectivity between the wells. This is relatively a new and very efficient
technique but needs to be implemented in conjunction with a real time microseismic
monitoring to guide it through. Total volume of water used is estimated to be around
9000m3.
Alternative methods are to inject in one well at a time with much higher flow rate (>50 l/s) or
the use of viscous fluid (~700 - 1000 cp) and mobilise propant into the formation to improve
the flow impedance. This technique is widely used by hydrocarbon industry but is relative

19
expensive and the higher temperature in a geothermal environment may make the viscous
fluid to breakdown earlier than planned thus causing the screen out at the bottom of the well.
5. Lessons learned to facilitate successful cross-over of technology between
hydrothermal & EGS
A hydrothermal method is the most efficient way of extracting energy from the earth’s crust
but unfortunately it is not always accessible in the major part of the earth’s land mass.
Additionally, areas with a potential for hydrothermal system may also have possibility of
generating larger natural earthquakes and this could become a problem if these systems are
located closer to highly density populated areas. On the other hand EGS type of systems can
be engineered in significantly larger part of the land mass and thus make it more widely
available. Unfortunately this technology is still in its infancy and therefor relative expensive
and significantly more experience needs to be built up. It is essential that a technological
crossover takes place between hydrothermal and EGS systems which in a long term will
benefit both.
An example is give below (5A) using the successful implementation of EGS knows to a
hydrothermal system at Desert Peak plant (ORMAT Technologies) near Reno in Nevada. In
particularly, the geo-mechanics/microseismic aspects to reservoir development and
underground fluid transportation are of extreme benefit to the future development of
hydrothermal systems.
One of the objectives of this report is to show that there are some unsuccessful procedures
and practice used in the past, both in hydrothermal & EGS, which are not reported because of
the embarrassment or poor decisions but it is felt these needs to made public because one
learns by mistakes and if these are not reported than there is good probability of it to be
repeated again.
Similarly, there are well established working practices in hydrothermal technology which are
of great benefit to the development of EGS technology (Chapter 5B)
5A Crossover of technology from EGS to hydrothermal
Geo-mechanics plays an important part in the fluid flow in a jointed matrix geological
formation. This was explained in the chapter 2C. A project was funded by the US DoE in
conjunction with ORMAT technologies to test this hypothesis and to see if this observed
behaviour in the development of EGS can be implemented in a known hydrothermal field.
5Aa. Desert Peak site, Reno in Nevada, USA (ORMAT)
The site selected to carry out the experiment was the Desert Peak Geothermal Field (DPGF)
of western Nevada and operated by Ormat Nevada Inc (Faulds et al 2003; Figure 1) and the
enlarged view of the site is shown in Figure 2.
An initial industry-DOE cost-shared project was started to evaluate the technical feasibility of
developing an EGS power generation project on the eastern side of the Desert Peak
geothermal field (Ann Robertson-Tait et al 2004 & 2006). An existing well (DP 23-1) was
the focus of much of the Phase I investigation, including re-interpretation of lithology,
acquisition and analysis of a well bore imaging log, and conducting and analysing a step-rate
injection test. In addition, numerical modelling has been undertaken to estimate heat recovery
and make generation forecasts for various stimulated volumes and well configurations.

20
Figure 1. Map of Desert Peak Geothermal Field, Nevada, USA; faults from Faulds et al (2003).
Figure 2. Enlarged Map of Desert Peak Geothermal Field showing the well layout & SHmax direction
SHmax = N27°E (ORMAT & GeothermEx, 2006)

21
The target formations for hydraulic stimulation in well DP23-1 lay below an unstable phyllite
which bottoms at about 1,740 m (5,700 feet). The formations beneath this unit include a
section of Jurassic/Triassic metamorphic rocks (of which the phyllite is a part) and an
underlying, younger (Cretaceous?), massive granodiorite that intrudes the older rocks above
(lutz et al, 2009: Figure 3). This granodiorite unit extends from 2,140 m (7,020 feet) to TD
(2,939 m or 9,641 feet) in DP23-1 and is likely to have considerable lateral extent. A well
bore image log obtained over a significant portion of the open hole has been analysed in
terms of the distribution and orientation of natural fractures and borehole failure phenomena
(tensile fractures and breakouts). The features analysed from the image log have been used to
evaluate the orientation of the stress field and constrain the magnitudes of the principal
stresses. These analyses permit an evaluation of the effects of pore pressure increase on pre-
existing fractures, and, in conjunction with lithology, mineralogy, drilling rate and
geophysical log data, have been used to identify the most prospective interval for stimulation.
Future plans for Phase II include undertaking a "minifrac," re-completing the well in
preparation for hydraulic stimulation, and planning, conducting, monitoring and evaluating a
massive hydraulic stimulation.
5Aaa. Initial proposal to US DoE (DP 23-1)
The initial well selected to test the concept of EGS technology at Desert Peak was DP 23-1
but there was a concern regarding it’s suitability. At the request of ORMAT, a review of the
proposed plan was carried out by the EGS consulting company (MIL-TECH/BESTEC) in
2007 and it became apparent that the well selected for stimulation (DP23-1) was not in the
right place in relationship with other commercial wells (injection & production wells) and it
was unlikely to play any significant part in the recovery of additional energy. Evaluation
showed that all the production and injection wells are aligned approximately in the direction
of the maximum horizontal (Fig 2) while the proposed well (DP23-1) was orthogonal to the
direction of maximum horizontal stress which implied that if a stimulation was carried out in
this well, the reservoir will be created in parallel to the direction to the existing hydrothermal
reservoir and it is unlikely that the new stimulation will pay any part in the production of
additional energy for the existing reservoir (Need Reference???).
Figure 3. South-North geologic cross-section through Desert Peak Geothermal Field; from Lutz et al (2009).

22
5Aab. Revised proposal to US DoE (DP 27-15)
Geology pays a very important part in deciding where a well needs to be drilled in a
hydrothermal field. Following the drilling of the well and subsequent testing indicated that
27-15 was a non-productive well. The geological evaluation showed that there was clay at the
depth of the existing hydrothermal reservoir. Clay is impermeable material and therefore the
well 27-15 was discarded as a useful well.
Following the conclusion of the review on the effectiveness of using DP 23-1 for enhancing
recovery from the existing hydrothermal field, a second review was carried out on the Desert
Peak in 2007 by Ormat staff & their consultants (MIL-TECH/BESTEC) to select an
appropriate well for applying the EGS technology to a hydrothermal field (Zemach et al
2009) . A number of meetings were held at the ORMAT’s site in Reno to interact with the
scientist/engineers involved and to convey the EGS technology and explain reasons for the
selection of the well 27-15 for testing the crossover of technology (Baria & Teza, 2008). The
well 27-15 is aligned correctly in relation to the maximum horizontal stress and this was
regarded as the most suitable candidate.
During the subsequent review meeting between Ormat/DP scientific team and MIL-
TECH/BESTEC (M & B), the view of the Ormat/DP scientific team was that 27-15 was not
suitable for stimulation because of the clay deposits found near the depth of the reservoir.
Consultants from MB emphasised the importance of carrying out a low flow rate injection
test in DP 27-15 and to characterising the flow exits in the well to assess the quality of the
well regardless of the geology and not to rely on traditional decision making process which is
based entirely on the geology. Following the recommendation, a low flow rate test was
carried out. The results of the test showed that there were dominant flow exits within the clay
band and at the depth of the existing hydrothermal reservoir. Therefore one of the lessons
learnt was that it is important to carry out hydraulic testing of the well to characterise the well
rather than rely entirely on the geology. It was felt that the clay band might have just been a
veneer near well bore surface.
The recommendation of the review panel was to use DP 27-15 as a test well to do stimulation
instead of DP 23-1.
5Ab. Hydraulic stimulation of DP 27-15
The well DP 27-15 well is located on the margins of the operating geothermal field at Desert
Peak around 500m NNE of the two injection wells 21-2 & 22-22. A low flow injection test
had identified the likely zones that will respond to stimulations. The plan was to hydraulically
stimulate 27-15 at zones which lie at a depth from 915 to 1,066 m (3,000 to 3,500 feet) where
temperatures range from 180°C to 196°C (355 to 385°F), (Ethan Chabora et al 2012).
An integrated study of fluid flow, fracturing, stress and rock mechanics, silicified rhyolite
tuffs and metamorphosed mudstones were hydraulically and chemically stimulated in Desert
Peak well 27-15 as part of an Enhanced Geothermal System (EGS) project.
An initial period (~10 days) of shear stimulation was carried out at low fluid pressures (less
than the least horizontal principal stress, SHmin
) to assess if this was an effective technique for
creating high injectivity in a system (Davatzes et al 2009; Hickman et al 2010). The
experiment showed that the injectivity increased only marginally and this was not a good
method of improving the injectivity of a well. A possible explanation for not attaining higher
23
injectivity could be that the impedance near wellbore caused an appreciable pressure drop
and therefore made it difficult to transmit the required pressure in to the formation to cause
shear and thus improve the injectivity. This assessment is also supported by the lack of
induced seismicity over this long injection test.
The operation was halted on the advice of ORMAT’s consultants (MIL-TECH & BESTEC)
and the stimulation strategy and equipment was restructured to increase pressure/flow rate to
create the required injectivity. After a wellbore clean-out, a large-volume hydraulic fracturing
operation was carried out at high pressures (exceeding SHmin
) and high injection rates over 23
days to promote fluid pressure transfer to greater distances from the borehole, resulting in an
additional 4-fold increase in injectivity.
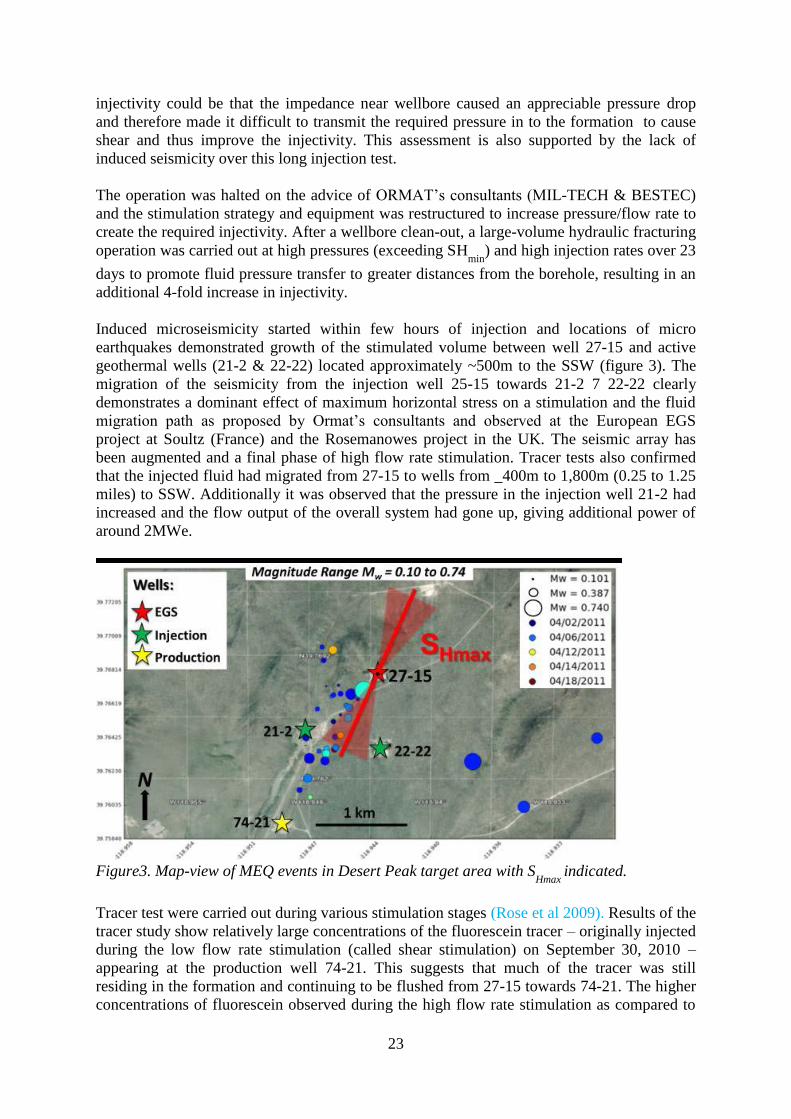
Induced microseismicity started within few hours of injection and locations of micro
earthquakes demonstrated growth of the stimulated volume between well 27-15 and active
geothermal wells (21-2 & 22-22) located approximately ~500m to the SSW (figure 3). The
migration of the seismicity from the injection well 25-15 towards 21-2 7 22-22 clearly
demonstrates a dominant effect of maximum horizontal stress on a stimulation and the fluid
migration path as proposed by Ormat’s consultants and observed at the European EGS
project at Soultz (France) and the Rosemanowes project in the UK. The seismic array has
been augmented and a final phase of high flow rate stimulation. Tracer tests also confirmed
that the injected fluid had migrated from 27-15 to wells from _400m to 1,800m (0.25 to 1.25
miles) to SSW. Additionally it was observed that the pressure in the injection well 21-2 had
increased and the flow output of the overall system had gone up, giving additional power of
around 2MWe.
Figure3. Map-view of MEQ events in Desert Peak target area with S
Hmax indicated.
Tracer test were carried out during various stimulation stages (Rose et al 2009). Results of the
tracer study show relatively large concentrations of the fluorescein tracer – originally injected
during the low flow rate stimulation (called shear stimulation) on September 30, 2010 –
appearing at the production well 74-21. This suggests that much of the tracer was still
residing in the formation and continuing to be flushed from 27-15 towards 74-21. The higher
concentrations of fluorescein observed during the high flow rate stimulation as compared to

24
those observed during the low flow stimulation phase; indicate that the hydraulic connectivity
between the two wells was significantly enhanced by high flow rate stimulation and that the
low flow rate stimulation (called shear stimulation) was ineffective. Moreover, the rapid
breakthrough of the conservative tracer 1,6-nds approximately 4 days after injection also
supports this conclusion.
Results of testing at the Desert Peak (Ethan et al 2012; figure 4) project to advance the
commercial viability of EGS in Ormat’s existing geothermal fields and have demonstrated:
• 175-fold increase in injectivity in the target formation
• Cost-effective techniques and technologies that are transferrable
• Adaptive, real-time approach to operations management
Subsequent circulation test showed that the injectivity was improving slightly and then
stabilised (0.63 gpm/psi) at an injection pressure of 52 Bar (750 psi) as the rock near the
injection well 27-15 was being cooled.
Figure 4: Summary of the stimulations at Desert Peak
5Ac. Brady Hot Spring site (ORMAT) ????
Brady Hot spring is adjacent to the Desert Peak site and therefore the assumptions are that the
stress regime will be very similar.

25
5B. Crossover of technology from hydrothermal to EGS
Hydrothermal systems for producing heat & power have existed for over a hundred years
(Larderello, Italy~1904) and a considerable experience have been gained which is filtered in
to the development of EGS. Some of the cross over is described below:
5Ba Geochemistry:
Fluids in hydrothermal systems can be very aggressive and extensive work has been done to
deal with these problems.
One of the techniques used is to stop the minerals from precipitating by keeping the
circulating fluid under pressure, stabilising the pH and reinjection at an appropriate
temperature to keep the minerals in solution. This has been adapted to EGS systems where
there are aggressive in-situ fluids and needed to be kept in solution.
Another technique is to inject inhibitors using dousing pumps and thus stop the minerals form
precipitating. This has also been adopted in EGS systems.
On specific occasions, separators and condensers are incorporated close to power conversion
stage to extract the mineral out of the fluid before re-injecting it into the formation. This is
found not be necessary in the current EGS systems because the mineralogy of the fluid is not
similar to some of the aggressive fluids found in hydrothermal systems.
Significant proportion of hydrothermal plants has a high concentration of chlorides and this
would damage the casing/pumps etc over a long period. One of the solutions to overcome this
is by injecting corrosion inhibitors. EGS systems have adopted this method to help reduce
corrosion in the casing.
5Bb. Downhole submersible pumps
Many of the hydrothermal fields use downhole submersible pumps to enhance recovery from
the production well. This has been adopted in EGS systems to enhance the recovery from the
formation but the pumps (impellors) may be deployed at depth in excess of 400m.
5Bc. High temperature well head & pressure control equipment
Temperature of the production fluid in hydrothermal fields can reach fairly high (200º C plus)
and equipment has been developed to cope with both the aggressivity of the fluid and high
temperatures. This equipment has also been adapted for the application for EGS as well.
5Bd. Steam & binary power plants.
Both steam and binary power plants were developed for converting hot fluids into power and
this has been adopted by hydrothermal industry. The binary plant is more suitable for EGS
systems and this has been adopted for generating power.
5Be. Tracer testing
Various forms of tracers have been used to understand and characterise hydrothermal
reservoirs. These tracers have also been adapted for the application in EGS systems. The two
common uses are to find the breakthrough time and the modal volume.

26
Breakthrough time is normally used to assess how quickly the injected fluid travels the
reservoir and reached the production well. This is an indicator of the development of
preferential flow paths and the life of the system.
Model volume gives an indication of the size of the reservoir from which the heat is
extracted. In EGS systems, it can also be used to assess if a system is expanding due to the
contraction of the rock mass from which the heat has been extracted.
5Bf. Production logging
Production logging consists of charactering specific properties of the well as a function of
depth using a wireline cable and truck. These properties are obtained during an injection in to
a well, while producing fluid from a well or in a static situation. These properties can be flow
(inlet and exit from the well), temperature and pressure. One suspects that the production
logging originated in the hydrocarbon industry and it was adopted by hydrothermal industry
but the system had to have significantly higher temperature specification (up to 250ºC). EGS
have also adopted the technology but have increase the specifications in terms of accuracy,
resolution and the depth of operation to ~5000m depth.
6. Observations & conclusions:
1. Technology from hydrothermal & EGS technology are interchangeable on many
aspects and should be encouraged.
2. In hydrothermal systems, the operating pressure is relatively low and therefore
everything is selected for lower pressure operation to minimise the cost of the well. It
very important that all the equipment, casing etc is evaluated for high pressure
operation and rectified before stimulation takes place in a hydrothermal well.
3. Understanding of geo-mechanics and its application is beneficial to the development
of hydrothermal fields & EGS plants.
4. Determining the stress field (both magnitude gradient & direction) is essential.
5. Drilling new wells or developing a hydrothermal system has to take the geo-
mechanics in to consideration as the direction of fluid flow is very strongly influenced
by the in-situ stresses.
6. Characterisation of joints in terms of spacing & orientation is important
7. Obtaining the basic undisturbed characteristic of the well in terms of temperature,
flow profile and geology after the well is completed is essential.
8. Initial basic hydraulic characterisation of a new well is essential. This entails injection
at flow rate at ~ 5 l/s and carrying out temperature, flow and pressure log in the well.
9. It is important to assess that the wellhead, casing, cement and the well is suitable for
stimulation. Anticipated well head pressure & flow rate can be up to 10 MPa (~1500
psi) and 100l/s (~1600 gpm)
10. A microseismic monitoring system with good area coverage, broad band sensitive
sensors and well defined velocity model is necessary. The system should be able to
acquire online data and produce the locations in real time.
11. Hydraulic and microseismic data should be available in real time to reservoir engineer
to make a decision to continue or stop the stimulation
12. It is also useful to carry out tracer study to see a breakthrough in adjacent wells and
monitor surface pressure response at wellhead.

27
7 Acknowledgement:
This report was supported by IEA/GIA committee and Ormat technologies, Nevada USA.
The Desert Peak EGS project is supported by the U.S. Department of Energy, Assistant
Secretary for Energy Efficiency and Renewable Energy, under a cooperative agreement with
Golden Field Offices, DE-FC36-02ID14406 for EGS field projects.
8. References:
Abe H., Niitsuma H and Baria R., 1999. Hot Dry Rock/Hot Wet Rock Academic Review:
Special Issue, Geothermics, Vol. 28 Nos. 4/5, ISSN 0375-6505.Pergamon Press.
Ann Robertson-Tait, A., Lutz, S. J., Sheridan, J., & Morris, C. L. (2004). Selection of an
interval for massive hydraulic stimulation in well DP 23-1, Desert Peak East EGS Project,
Nevada. Proceedings, Twenty-Ninth Workshop on Geothermal Reservoir Engineering.
Stanford University, Stanford, California, January 26-28, 2004, SGP-TR-175.
Ann Robertson-Tait and Stuart D. Johnson; 2006. ENGINE - ENhanced Geothermal
Innovative Network for EuropeWorkshop 3, "Stimulation of reservoir and microseismicity"
Kartause Ittingen, Zurich, June 29 - July 1, 2006, Switzerland.
Baria R., Hearn K.C and Batchelor A.S. (1985) - “Induced seismicity during the hydraulic
stimulation of the potential Hot Dry Rock geothermal reservoir” - submitted to the
Fourth Conference on Acoustic Emission/Microseismic Activity in Geology Structures
and Materials, Pennsylvania State University, 22-24 Oct., 1985, 26 pp.
Baria R. and Green A.S.P. (1989) – “ Microseismic: A Key to Understanding Reservoir
Growth”, in “Hot Dry Rock Geothermal Energy”, Proc. Camborne School of Mines
International Hot Dry Rock Conference, Camborne School of Mines Redruth, UK, 27-
30 June, 1989, Ed. Roy Baria, Robertson Scientific Publications, London, 1990, ISBN
1-85365-217-2. pp 363-377.
Baria R., Baumgaertner J., Gérard A., Kappelmeyer O., (1992). HDR project at Soultz-sous-
Forêts. Geothermal Resources Council Transactions, vol 18, 387-394.
Baria R., Garnish J., Baumgärtner J., Gérard A and Jung R. (1995) – “Recent development in
the European HDR research programme at Soultz-sous-Forêts (France). Proceeding of
the World Geothermal Congress, Florence, Italy, International Geothermal Association,
Vol. 4, pp 2631-2637, ISBN 0-473-03123-X.
Baria, R & Teza, D. (2008). MIL-TECH UK Ltd, Report to ORMAT on Desert Peak
Stimulation proposal for DP 27-15, March 2008.
Barton, C.A., Zoback, M.D. and Moos, D., 1995, Fluid flow along potentially active faults in
crystalline rock: Geology, 23, 683-683.
Barton, C.A., Hickman S., Morin R., Zoback M.D., Finkbeiner T., Sass J. And Benoit D.
1997. Fracture permeability and its relationship to in-situ stress in the Dixie Valley, Nevada,
geothermal reservoir. Proceedings 22nd Workshop on Geothermal Reservoir Engineering
Stanford University, Stanford, California, January 27-29, 1997.

28
Batchelor, A.S., 1977. A brief survey of geothermal related studies in the United Kingdom
1977. In: Proceedings of the 2nd NATO/CCMS Geothermal Conference, Los Alamos, 22±24
June, pp. 27±29 Section 1.21.
Batchelor, A.S., Pearson, C.M., 1979. Preliminary studies of hot dry rock geothermal
exploitation in south west England. Trans. Inst. Min. Metall., Sec B: Appl. Earth Sci. 88,
B51±B56.
Batchelor, A.S., 1983. Hot Dry Rock reservoir stimulation in the UK: an extended summary.
In: Proceedings of the Third International Seminar on the Results of the EC Geothermal
Energy Research, Munich, 29 November±1 December, pp. 681±711.
Baumgärtner, J., Jung R., Gérard A., Baria R. and Garnish J. (1996) - “The European HDR
Project at Soultz-sous-Forêts: Stimulation of the second Deep Well and First Circulation
Experiments”, Proc. 21st Workshop of Geothermal Reservoir Engineering, Stanford
University, Stanford, California, SGP-TR-151, pp 267-274.
Baumgärtner, J., Gérard A., Baria R., Jung R., Tran-Viet, T., Gandy, T., Aquilina, L., Garnish
J. (1998) - Circulating the HDR reservoir at Soultz: maintaining production and injection
flow in complete balance. Proc. 23rd Workshop of Geothermal Reservoir Engineering,
Stanford University, Stanford, California, USA.
Black, J.H., 1979. Results of multiple borehole pumping test in low permeability granite. In
NEA/ IAEA, Workshop on Low Permeability Measurements in Largely Impermeable Rock,
Paris, pp. 183±198.
Davatzes, N. C., & Hickman, S. H. (2009). Fractures, stress, and fluid flow prior to
stimulation of Well 27-15, Desert Peak, Nevada, EGS Project. Proceedings, Thirth-Fourth
Workshop on Geothermal Reservoir Engineering. Stanford University, Stanford, California,
February 9-11, 2009 SGP-TR-187.
Ethan Chabora, Ezra Zemach, Paul Spielman, Peter Drakos, Stephen Hickman, Susan Lutz,
Katie Boyle, Amber Falconer, Ann Robertson-Tait, Nicholas C. Davatzes, Peter Rose, Ernie
Faulds, J. E., Garside, L., & Opplinger, G. L. (2003). Structural analysis of the Desert Peak-
Brady Geothermal Fields, northwestern Nevada: Implications for understanding linkages
between northeast-trending structures and geothermal reservoirs in the Humboldt structural
zone. GRC Transactions. 27, pp. 859-864. Geothermal Resources Council.
Finkbeiner, T., Barton, C.A. and Zoback, M.D., 1997, Relationships among in-situ stress,
fractures and faults, and fluid flow: Monterey Formation, Santa Maria Basin, California:
AAPG Bulletin, 81 (12), 1975-1999.
Garnish J.D. (1976) - “Geothermal Energy: The case for Research in the United Kingdom” -
Energy Paper No. 9, London, HMSO, 1976, 66 pp.
GeÂrard, A., BaumgaÈ rtner, J., Baria, R., 1997. An attempt towards a conceptual model
derived from 1993±1996 hydraulic operations at Soultz. In: Proceedings of NEDO
International Geothermal Synposium, Sendai, 2, pp. 329±341.

29
Haimson, B., 1978. The hydrofracturing stress measuring method and recent ®eld results. Int.
J. Rock Min. Sci. and Geomech. Abstr. 15, 167±178.
Hickman, S. H., & Davatzes, N. C. (2010). In-situ Stress and Fracture Characterization for
Planning of an EGS Stimulation in the Desert Peak Geothermal Field, Nevada. Proceedings,
Thirty-Fifth Workshop on Geothermal Reservoir Engineering. Stanford University, Stanford,
California, February 1-3, 2010, SGP-TR-188.
Hopkirk, R.J., Sharma, D., Pralong, P.J., 1981. Coupled convective and conductive heat
transfer in the analysis of Hot Dry Rock geothermal systems. In: Lewis, R.W., Morgan, K.,
Zienkiewicz, O.C. (Eds.), Numerical Methods in Heat Transfer. Wiley, Chichester, UK.
Kappelmeyer, O., Jung, R., 1987. HDR Experiments at Falkenberg/Bavaria. In: Garnish, J.
(Ed.), Proceedings of the ®rst EEC/US Workshop on Geothermal Hot Dry Rock Technology,
Brussels, pp. 375±392 Geothermics Special Issue, Vol. 16, No 4.
Lutz, S. J., Hickman, S., Davatzes, N., Zemach, E., Drakos, P., & Robertson-Tait, A. (2010).
Rock Mechanical Testing and Petrologic Analysis in Support of Well Stimulation Activities
at the Desert Peak Geothermal Field, Nevada. Proceedings, Thirty-Fifth Workshop on
Geothermal Reservoir Engineering. Stanford University, Stanford, California, February 1-3,
2010, SGP-TR-188.
Majer, Steve Jarpe; 2012. PROCEEDINGS, Thirty-Seventh Workshop on Geothermal
Reservoir Engineering Stanford University, Stanford, California, January 30 - February 1,
2012, SGP-TR-194.
Parker R. H. (1989) – “Hot Dry Rock geothermal energy. Phase 2B final report of the
Camborne School of Mines project”, Vol. 1 & 2, Pergamon Press, Oxford, UK, 1989.
ISBN 0-08-037929-X.
Pine R.J. and Batchelor A.S. (1984) - “Downward migration of shearing in jointed rock
during hydraulic injections” - Int. J. Rock Mech. Min. Sci., 21 (5), 1984, pp 249-263.
Rose, P., Leecaster, K., Drakos, P., & Robertson-Tait, A. (2009). Tracer Testing at the Desert
Peak EGS Project. GRC Transactions, Vol. 33, 2009.
Rummel, F., 1986. Stress and tectonics in the upper continental crust. In: Proceedings of the
International Symposium on Rock Stress and Rock Stress Measurements, Stockholm, 1±3
September, pp. 177±186.
Smith M.C. (1975) - “The Potential for the Production of Power from Geothermal
Resources” - Los Alamos Scientific Laboratory Report, LA-UR-73-926, 1975.
Takahashi, H., Shoji, T., Abe , E., 1987. Recent progress and future of GEEE project at
Tohoku University, Japan. In: Garnish, J. (Ed.), Proceedings of the First EEC/US Workshop
on Geothermal Hot Dry Rock Technology, Brussels, pp. 375±392 Geothermics Special Issue,
Vol 16, No 4.

30
Zemach, E., Drakos, P., & Robertson-Tait, A. (2009). Feasibility Evaluation of an "In-field"
EGS Project at Desert Peak, Nevada. GRC Transactions. 33, pp. 285-295. Geothermal
Resources Council

31
Appendix A: Details of well DP23-1
Basic Data from Well DP23-1Well DP23-1 was completed in May 1979 with a 13-3/8-inch production casing from the surface to 90S m (2,9S0 feet). Below this is a 12-1!4-inch open hole to 1,613 m (5,292 feet), an S-1!2-inch open hole to 2,445 m (S,022 feet) and a 7-7/S-inch open hole to TO (2,931 m or 9,641 feet), Circulation losses occurred while drilling between 2,533 and 2,5S6 m (8,310 and S,485 feet) and losses continued to 2,809 m (9,215 feet). Below this depth, the drilling fluid was changed from mud to aerated water, and it is not possible to discern if or where any fluid losses occurred in this lower interval. During drilling and after completion, various attempts were made to flow test the well, sometimes with air or nitrogen assist. During testing in November 1979, the well bridged off below the 13-3!S-inch casing shoe, In December 19S4, a 9-5!S-inch liner was hung and cemented from S10 to 1,309 m (2,65S to 4,293 feet) to cover the bridging zone, The depth for the bottom of this liner was chosen on the basis of temperature (the well reaches 400'F [204'C] at 4,300 feet [1,311 mj; see Figure 2), There were no returns of drilling fluids while cleaning out bridges down to 4,60S feet (1,406 m), After setting and cementing the 9-5!S-inch liner, the bottom of the hole was cleaned out with full returns to 2,755 m (9,040 feet), and with about 95% returns below that depth, A step-out from the known productive area at Desert Peak, well DP23-1 was unable to sustain flow at commercial rates and pressures, Several flow tests were made before installing the 9-5/S-inch liner; during the November 1979 test, the well flowed unassisted, After the work over was completed, a brief injection test was conducted, While injecting at 5 barrels per minute (bpm), the wellhead pressure varied between 100 and 150 psig, The following day, the injection rate was increased to 20 bpm and the corresponding wellhead pressure was about 600 psig, A temperature survey was collected during the first injection period and is included in Figure 2 (the blue survey),
???????
Should the stimulation result in the creation of a large enough reservoir, a second and perhaps
a third well would be drilled and stimulated, and the system would be tested for several
months to determine its capacity. In Phase III, a .2-5 MW stand-alone binary power plant
would be designed and constructed at Desert Peak East, and in Phase IV, the power would be
either sold to a utility customer or used to supply the parasitic power needs of the existing
Desert Peak hydrothermal power plant.
In an open system like that experienced so far at Soultz, an HDR reservoir module will probably consist of three
wells, one injector bounded by two producers (see Gerard et al., 1997, Fig. 1C). The two production wells will
contain downhole pumps to assist production. The three wells are likely to be aligned approximately parallel to
the direction of the maximum horizontal stress