IEA (2008) Empowering Variable Renewables – Options For Flexible Electricity Systems
36
In Support of the G8 Plan of Action Empowering Empowering Variable Renewables Renewables Options for Flexible Electricity Systems INTERNATIONAL ENERGY AGENCY
-
Upload
victor1939 -
Category
Documents
-
view
15 -
download
1
Transcript of IEA (2008) Empowering Variable Renewables – Options For Flexible Electricity Systems

In Support of the G8 Plan of Action
Em poweringEm poweringVariable
Ren ewablesRen ewablesOptions for Flexible Electricity Systems
INTERNATIONAL ENERGY AGENCY

INTERNATIONAL ENERGY AGENCY
The International Energy Agency (IEA) is an autonomous body which was established in November 1974 within the framework of the Organisation for Economic Co-operation and Development (OECD) to implement an inter national energy programme.
It carries out a comprehensive programme of energy co-operation among twenty-seven of the OECD thirty member countries. The basic aims of the IEA are:
To maintain and improve systems for coping with oil supply disruptions. To promote rational energy policies in a global context through co-operative relations
with non-member countries, industry and inter national organisations. To operate a permanent information system on the international oil market. To improve the world’s energy supply and demand structure by developing alternative
energy sources and increasing the effi ciency of energy use. To promote international collaboration on energy technology. To assist in the integration of environmental and energy policies.
The IEA member countries are: Australia, Austria, Belgium, Canada, Czech Republic, Denmark, Finland, France, Germany, Greece, Hungary, Ireland, Italy, Japan, Republic of Korea, Luxembourg, Netherlands, New Zealand, Norway, Portugal, Slovak Republic, Spain, Sweden, Switzerland, Turkey, United Kingdom and United States. Poland is expected to become a member in 2008. The European Commission also participates in the work of the IEA.
ORGANISATION FOR ECONOMIC CO-OPERATION AND DEVELOPMENT
The OECD is a unique forum where the governments of thirty democracies work together to address the economic, social and environmental challenges of globalisation. The OECD is also at the forefront of efforts to understand and to help governments respond to new developments and concerns, such as corporate governance, the information economy and the challenges of an ageing population. The Organisation provides a setting where governments can compare policy experiences, seek answers to common problems, identify good practice and work to co-ordinate domestic and international policies.
The OECD member countries are: Australia, Austria, Belgium, Canada, Czech Republic, Denmark, Finland, France, Germany, Greece, Hungary, Iceland, Ireland, Italy, Japan, Republic of Korea, Luxembourg, Mexico, Netherlands, New Zealand, Norway, Poland, Portugal, Slovak Republic, Spain, Sweden, Switzerland, Turkey, United Kingdom and United States.The European Commission takes part in the work of the OECD.
© OECD/IEA, 2008
International Energy Agency (IEA),Head of Communication and Information Offi ce,
9 rue de la Fédération, 75739 Paris Cedex 15, France.
Please note that this publication is subjectto specifi c restrictions that limit its use and distribution.
The terms and conditions are available online athttp://www.iea.org/Textbase/about/copyright.asp
1
Acknowledgements
This paper was prepared by Hugo Chandler of the Renewable Energy Unit of the International Energy Agency (IEA) Secretariat. The IEA gratefully acknowledges the contribution of the German Ministry for the Environment, Nature Conservation and Nuclear Safety in its report “Market Introduction Perspectives of Innovative Technologies Supporting Integration of RES-E”, prepared by Cornel Ensslin and others of Ecofys. Hannele Holttinen and others of VTT Technical Research Centre of Finland provided crucial support to the project and valuable input was provided by members of the Renewable Energy and International Law Project (REIL), IPA Energy and Water Economics, and the IEA Renewable Energy Technology Deployment Implementing Agreement. Guidance in the publication was provided by Neil Hirst, Antonio Pflüger, and Paolo Frankl of the IEA Secretariat.
Many thanks also for the inputs received from workshop speakers and participants, and reviewers, in particular: Chad Abbey, Hans Abildgaard, Daniel Argyropoulos, John Baker, Phil Baker, Jens Bömer, Gouri Bouyan, Helfried Brunner, Stan Bull, George Caralis, Lewis Dale, Jacques Deuse, Guy Deutscher, Martin Devine, Ana Estanqueiro, Natascia Falcucci, Lars Audun Fodstad, Paul Gardner, Stig Goethe, Sylvain Hercberg, Robert Howse, Debra Justus, Brendan Kirby, Xavier Lemaire, Bettina Lemström, Hans Henrik Lindboe, Kieran McNamara, Gilles Mercier, Gerardo Montanino, Satoshi Morozumi, Poul Erik Morthorst, Toshiya Nanahara, Stefan Nowak, Carlo Obersteiner, Junichi Ogasawara, Hugh Outhred, Leslie Parker, Stine Leth Rasmussen, Massimo Rebolini, Kai Schlegelmilch, Jürgen Schmid, John Scott, Charlie Smith, Paul Smith, Lennart Söder, Goran Strbac, Ulrik Stridbaek, Gareth Swales, John Olav Tande, Richard Taylor, Albrecht Tiedeman, Osami Tsukamoto, Bart Ummels, Frans Van Hulle, and Wilhelm Winter.
Many thanks also to IEA colleagues in the Communication and Information Office and Information Systems Division, for their professional and flexible attitude, and in particular Muriel Custodio, Rebecca Gaghen, Bertrand Sadin, Sophie Schlondorff, Sylvie Stephan, and Jim Murphy.
Questions and comments should be sent to:Hugo ChandlerInternational Energy Agency9, rue de la Fédération75739 Paris Cedex 15
Email: [email protected]
This report is available as a free download from www.iea.org/Textbase/publications

3
Table of contents
Acknowledgements . . . . . . . . . . . . . . . . . . . . . . . . . . . . . . . . . . . . . . . . . . . . . . . . . . . . .1
Executive summary . . . . . . . . . . . . . . . . . . . . . . . . . . . . . . . . . . . . . . . . . . . . . . . . . . . . .5
1 ● Introduction . . . . . . . . . . . . . . . . . . . . . . . . . . . . . . . . . . . . . . . . . . . . . . . . . . . . . . .7
2 ● Variable renewable electricity technologies. . . . . . . . . . . . . . . . . . . . . . . . . . . . . .9 Factors with a smoothing effect on variability . . . . . . . . . . . . . . . . . . . . . . . . . . . .10 Forecasting . . . . . . . . . . . . . . . . . . . . . . . . . . . . . . . . . . . . . . . . . . . . . . . . . . . . . . .12
3 ● Power system flexibility. . . . . . . . . . . . . . . . . . . . . . . . . . . . . . . . . . . . . . . . . . . . .13
Assessing flexibility . . . . . . . . . . . . . . . . . . . . . . . . . . . . . . . . . . . . . . . . . . . . . . . . .13
4 ● Operational measures to increase flexibility . . . . . . . . . . . . . . . . . . . . . . . . . . . .17 Aggregating power systems . . . . . . . . . . . . . . . . . . . . . . . . . . . . . . . . . . . . . . . . . . .18 Trading closer to real time . . . . . . . . . . . . . . . . . . . . . . . . . . . . . . . . . . . . . . . . . . .19 Demand side management and response . . . . . . . . . . . . . . . . . . . . . . . . . . . . . . . . .19
5 ● Transmission and distribution . . . . . . . . . . . . . . . . . . . . . . . . . . . . . . . . . . . . . . . .21 Optimal use of transmission capacity . . . . . . . . . . . . . . . . . . . . . . . . . . . . . . . . . . .23 Intelligent network operation . . . . . . . . . . . . . . . . . . . . . . . . . . . . . . . . . . . . . . . . .24 New transmission technologies . . . . . . . . . . . . . . . . . . . . . . . . . . . . . . . . . . . . . . . .25
6 ● Conclusions. . . . . . . . . . . . . . . . . . . . . . . . . . . . . . . . . . . . . . . . . . . . . . . . . . . . . . .27
Bibliography . . . . . . . . . . . . . . . . . . . . . . . . . . . . . . . . . . . . . . . . . . . . . . . . . . . . . . . . .29
List of figuresFigure 1. Smoothing effect of geo-spread on wind
power output in Germany (2–12 February, 2005) . . . . . . . . . . . . . . . . . . . . . .11
Figure 2. Monthly capacity factors for wind and PV, Germany, 2005 . . . . . . . . . . . . . .11
Figure 3. Identifying a comparable flexibility value. . . . . . . . . . . . . . . . . . . . . . . . . . .15
Figure 4. Operational measures can increase power system flexibility . . . . . . . . . . . .17
Figure 5. Trading electricity between Denmark West and Norway/Sweden:wind power for hydropower (December 2003) . . . . . . . . . . . . . . . . . . . . . . .18

5
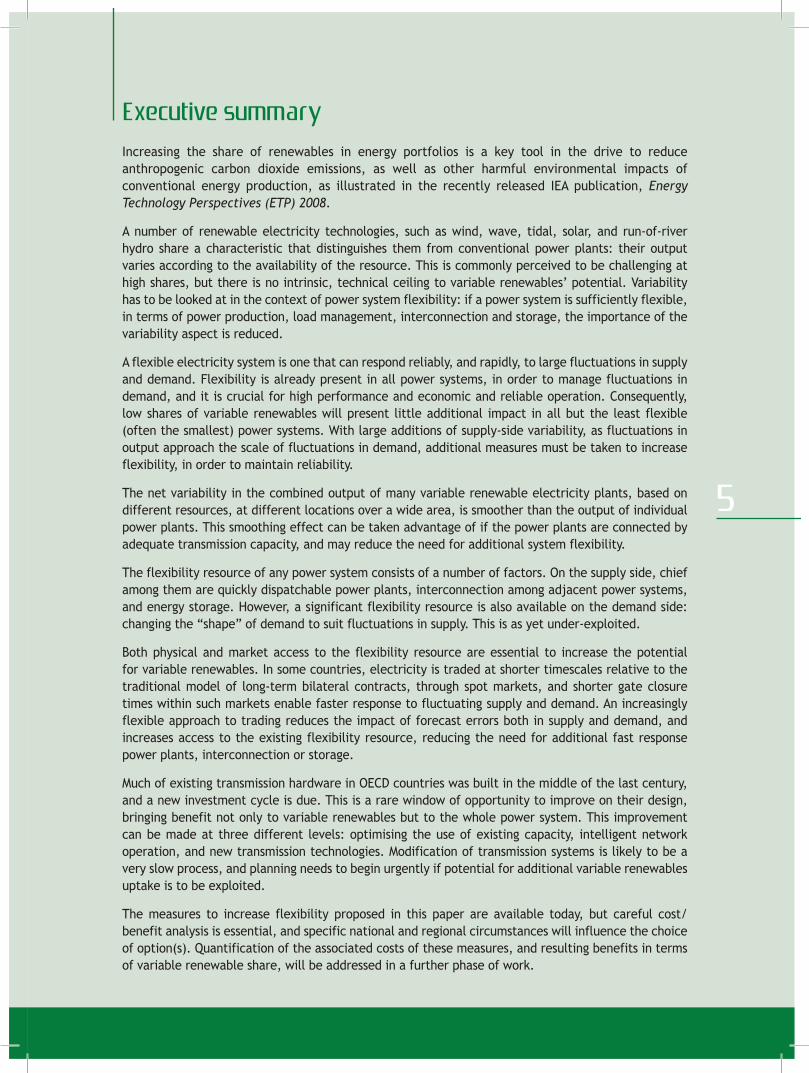
Executive summary
Increasing the share of renewables in energy portfolios is a key tool in the drive to reduce anthropogenic carbon dioxide emissions, as well as other harmful environmental impacts of conventional energy production, as illustrated in the recently released IEA publication, Energy Technology Perspectives (ETP) 2008.
A number of renewable electricity technologies, such as wind, wave, tidal, solar, and run-of-river hydro share a characteristic that distinguishes them from conventional power plants: their output varies according to the availability of the resource. This is commonly perceived to be challenging at high shares, but there is no intrinsic, technical ceiling to variable renewables’ potential. Variability has to be looked at in the context of power system flexibility: if a power system is sufficiently flexible, in terms of power production, load management, interconnection and storage, the importance of the variability aspect is reduced.
A flexible electricity system is one that can respond reliably, and rapidly, to large fluctuations in supply and demand. Flexibility is already present in all power systems, in order to manage fluctuations in demand, and it is crucial for high performance and economic and reliable operation. Consequently, low shares of variable renewables will present little additional impact in all but the least flexible (often the smallest) power systems. With large additions of supply-side variability, as fluctuations in output approach the scale of fluctuations in demand, additional measures must be taken to increase flexibility, in order to maintain reliability.
The net variability in the combined output of many variable renewable electricity plants, based on different resources, at different locations over a wide area, is smoother than the output of individual power plants. This smoothing effect can be taken advantage of if the power plants are connected by adequate transmission capacity, and may reduce the need for additional system flexibility.
The flexibility resource of any power system consists of a number of factors. On the supply side, chief among them are quickly dispatchable power plants, interconnection among adjacent power systems, and energy storage. However, a significant flexibility resource is also available on the demand side: changing the “shape” of demand to suit fluctuations in supply. This is as yet under-exploited.
Both physical and market access to the flexibility resource are essential to increase the potential for variable renewables. In some countries, electricity is traded at shorter timescales relative to the traditional model of long-term bilateral contracts, through spot markets, and shorter gate closure times within such markets enable faster response to fluctuating supply and demand. An increasingly flexible approach to trading reduces the impact of forecast errors both in supply and demand, and increases access to the existing flexibility resource, reducing the need for additional fast response power plants, interconnection or storage.
Much of existing transmission hardware in OECD countries was built in the middle of the last century, and a new investment cycle is due. This is a rare window of opportunity to improve on their design, bringing benefit not only to variable renewables but to the whole power system. This improvement can be made at three different levels: optimising the use of existing capacity, intelligent network operation, and new transmission technologies. Modification of transmission systems is likely to be a very slow process, and planning needs to begin urgently if potential for additional variable renewables uptake is to be exploited.
The measures to increase flexibility proposed in this paper are available today, but careful cost/benefit analysis is essential, and specific national and regional circumstances will influence the choice of option(s). Quantification of the associated costs of these measures, and resulting benefits in terms of variable renewable share, will be addressed in a further phase of work.

7
1 ● Introduction
Renewable energy is a key tool to reduce CO2 emissions. The IEA study Energy Technology Perspectives (ETP) 2008, which looks towards 2050, suggests that renewable energy alone has the potential to contribute 21% of the reductions in energy-related CO2 emissions necessary to maintain levels in the atmosphere of no higher than 450 parts per million, as targeted by the Intergovernmental Panel on Climate Change (IPCC).
A little under half of all CO2 emissions are generated by the power sector. Global demand for electricity is rising. The IEA World Energy Outlook (WEO) suggests that, in the absence of curtailment through energy efficiency measures, demand will double by 2030 compared with 2005. Renewables, mainly hydropower, already play an important role in global electricity provision – around 18% in 2005. But if the way we generate, trade and transmit electricity does not evolve, WEO modelling suggests that this share may stagnate, perhaps rising only to 20% in 2030 (IEA, 2006).
Renewable energy value. Environmental protection, security of supply based on indigenous resources, reduced exposure to fuel price volatility, technological innovation, and economic growth: these are acknowledged benefits of renewable energy, and should be borne in mind when assessing the cost of measures to facilitate its integration. Indeed the cost of inaction may be greater:
“If we don’t act, the overall cost and risks of climate change will be equivalent to losing at least 5% of global GDP each year, now and forever. If a wider range of risk and impact is taken into account, the estimate of damage could rise to 20% of GDP or more. In contrast, the cost of action (reducing CO2 emissions in the next 10-20 years) can be limited to around 1% of global GDP each year” (Stern, 2006).
Moving away from the traditional power system model. Power systems evolved around large, conventional, centralised power plants. Conventional trading arrangements take the form of bilateral contracts for the delivery of a fixed amount of electricity at a fixed time, perhaps months or even years ahead. Increasing the share of dispersed power plants, which may be on a very small scale, implies a significant departure from the traditional model. But the integration of renewable electricity is just part of a wider range of challenges facing power systems today. The price to the consumer, sustainable production, reliability and the technical performance of power systems are all critical. For example, well designed markets, and trade among adjacent power systems, are not only conducive to greater renewables uptake: they can deliver significant benefits through improved competition, driving towards greater economic efficiency, and lower prices for the consumer.
Open markets are increasingly common. Spot markets for electricity, operating closer to the time of delivery, may be better able to accommodate short-term and / or unexpected variations in supply (and demand) than the traditional model (REIL, 2007). Nonetheless, the commonly used terms “deregulation” and “liberalisation” should not be taken to mean that markets should function free of any rules. Without carefully crafted regulation, power markets will not bring about strategic, social objectives such as climate change mitigation, or long-term security of supply.
Non-discriminatory access for all power plants. Interacting with markets may be difficult for small power plants, and options exist whereby their output can be traded on a collective basis. Physical access to transmission must be available for all producers. Somewhat like rail or road systems, transmission and distribution networks can be regarded as natural monopolies: there is little advantage in maintaining parallel networks. If transmission is owned by entities that also own and operate power plants, access to this common good may risk restriction. In the EU, legislation requires the separation of generation and transmission in order to reduce this risk.1
1. For in-depth discussion of this issue, refer to IEA, 2005b.

8
About this paper. The IEA was tasked by the 2005 Gleneagles G8 Summit to draw together findings in the field of grid integration of renewable electricity, and to prepare recommendations for the G8 Hokkaido Toyako Summit, in July 2008. This paper focuses specifically on measures to increase the flexibility of power systems – their ability to operate reliably with significant shares of variable renewable electricity (var-RE). The term “power system” is here used to denote the whole chain of electricity production, transmission, trading, distribution and consumption.
Measures involving capital investments to increase the flexibility resource of a power system, including additional flexible generation capacity, energy storage, and inter-area interconnection capacity, are looked at in some detail in a previous publication of the IEA (2005a). This paper focuses on a portfolio of measures available with today’s technology to optimise access to and the use of this resource, through modification of the operation and design of electricity markets and transmission, thus enabling higher var-RE share.
Chapter Two discusses variability, and how a system-wide approach to the integration of var-RE power plants can have a smoothing effect on their output, before touching on the issues of forecasting and predictability. Chapter Three outlines a methodology to assess power system flexibility. Chapter Four highlights measures to increase flexibility, which relate to the operation of physical power markets, while Chapter Five covers the optimisation of transmission and distribution networks – the grid. Finally, Chapter Six provides conclusions.
9
2 ● Variable renewable electricity technologies
Electricity generation technologies include both firm and variable types. Firm technologies are ones that – notwithstanding supply chain or technical failure – can be relied upon to provide electricity on demand. On the whole, reservoir hydropower, biomass, geothermal, and to a lesser degree some concentrating solar thermal technologies,2 can be said to be firm technologies, so posing little additional challenge in variability terms.3
Variable types. Var-RE power plants rely on resources that fluctuate on the timescale of seconds to days, and do not include some form of integrated storage. Such technologies include wind power, wave and tidal power, run-of-river hydropower, and solar photovoltaics (PV). Output from such plants fluctuates upwards and downwards according to the resource: the wind, cloud cover, rain, waves, tide, etc. Such technologies are often referred to as intermittent, but this term is misleading. Output, aggregated at the system-wide level, does not drop from full power to zero or vice versa, but rather increases and decreases on a gradient as weather systems shift. It is measured in terms of ramp rate – the increase / decrease in output as well as the period over which this occurs. Ramp rates may on occasion be steep: wind plants for example are designed to cut out in storm conditions when a certain wind speed is reached, but meteorological forecasting can provide notice of such events.
Box 1 ● Is there an intrinsic ceiling to var-RE penetration?Concerns relating to the system impacts of variability have led to the idea that some sort of generic ‘ceiling’ exists on the var-RE share possible in any given system, and that above this level there will be unacceptable risks to power quality and system reliability. For example, from April 2006 to September 2007, in Alberta, Canada, such concerns lead to the imposition of a 900MW cap on wind power development, representing around 10% of total generating capacity. This cap was subsequently lifted as market and network related concerns were allayed (AESO, 2007).
The share of var-RE that can be accommodated depends on the specific characteristics of the power system. Experience demonstrates that large shares of variable renewables are possible, if sufficient measures are taken to increase flexibility. In 2007, about 20% of Danish electricity demand was met by wind energy (IEA Wind, 2007). With existing domestic flexibility alone this would not be possible as the system is very small, but with the opportunity provided by the Nordic Power Market – Nordpool – surplus wind electricity production can be exported while dispatchable Norwegian hydroelectricity can be imported during periods of low wind resource.4 It should be noted that if the variability profile and share of var-RE plants is similar in neighbouring power systems, less additional benefit is to be had in this regard.
The reality of large-scale var-RE integration is neatly encapsulated in the following comment of the chairman of the Western Danish system operator ELTRA in 2003:5
“… we said that the electricity system could not function if wind power increased above 500 MW. Now we are handling almost 5 times as much. And I would like to tell the government that we are ready to handle even more, but it requires that we are allowed to use the right tools to manage the system.”
2. Integrated thermal storage can reduce the impact of periods of no direct sunlight to some extent.
3. A notable exception is the low output from hydropower in Tasmania in recent years, supplemented by interconnection with mainland Australia. A parallel might be drawn with constrained gas supplies caused by market power.
4. While East Denmark is part of the Nordic System, West Denmark is synchronous with the UCTE system, via Germany. At present, there is no interconnection between East and West Denmark.
5. At the presentation of the Company’s annual report on April 23rd 2003. ELTRA was the West Denmark TSO and is now part of nation-wide system operator, Energinet.dk
10
Variability, and intermittent interruptions to supply, are power system realities. The latter may be due to the break down of individual power plants or transmission lines; droughts can occur, affecting hydro particularly and, on occasion, even nuclear. Demand for electricity, being based on regularly repeating patterns of social behaviour, may be relatively easy to predict, but unexpected peaks can still occur: as temperatures rise or fall unexpectedly, or system wide consumer behaviour coincides for other reasons.
Predictability is the key. Meteorological forecasting, while steadily improving, is still subject to uncertainty, and this has lead to concerns relating to the continuing ability of power systems to balance supply and demand at high var-RE penetrations, and to maintain secure and stable operation. In this sense, the challenge with var-RE is not so much its variability, but rather its predictability. In other words, if output could be forecast with 100 % certainty the only challenge would be to meet the ramp rates.
Correlation between demand and var-RE supply. It is often taken for granted that increased var-RE necessarily leads to an additional burden in terms of balancing demand and supply. This is not always the case: if var-RE output increases at the same time as demand, as is the case with PV and air-conditioning demand in hot countries, the PV output will add little imbalance burden, but will instead serve to reduce the level of demand, operating as “peaking” plant. This can be particularly important at the distribution level where PV output may be located at the demand site – as is the case with plant integrated into office buildings.
Factors with a smoothing effect on variabilityBefore discussing the measures that can be taken to increase power system flexibility, and so enable the inclusion of a higher share of variable renewables, it is important to consider how variability itself can be smoothed to a certain extent – the peaks and troughs reduced. One method is to combine a number of technologies and / or storage in such a way that the aggregated output at the point of connection to the grid is relatively smooth. This may be useful in smaller systems which are less able to absorb large fluctuations.
System-wide aggregation smoothes apparent variability. If the combined outputs of many var-RE power plants, based on different resources and, importantly, located over a wide are, are considered jointly, their net variability – as seen by the power system as a whole – is smoother than that of individual plants. Although weather fronts can be continental in scale, in statistical terms the greater the distance between two generators, the less their outputs will correlate. This effect is particularly important within the hour (Ernst, 1999). Of course, this approach assumes a large enough supply-and-demand balancing area (or the opportunity to trade electricity), which is served by adequate, available transmission capacity.
The smoothing effect is less pronounced offshore: large ocean fronts regularly stretch for hundreds of kilometres, so a wider geospread is necessary before output correlation reduces. In contrast, unrelated to weather patterns, tidal phases may vary significantly among neighbouring tidal sites, such as on the Coast of British Columbia in Canada (Powertech Labs, 2008).
Figure 1 illustrates the smoothing effect of geographic scale on the output of wind power plants in Germany. It shows a time series of normalised power output from A) a single turbine, B) a group of power plants and C) all wind power plants in Germany, over a ten day period.
Aggregating the output of different technologies. Similarly, the output of different variable technologies can be aggregated system-wide. Figure 2 shows the inverse correlation of seasonal capacity factors (actual power output divided by maximum potential output) of wind and PV for 2005 in Germany – high wind in winter, and more sun in the summer. In order for such techno-spread to have a smoothing effect, the outputs of such technology types must be of the same order of magnitude.

11
The effect of techno-spread is not only observed on the seasonal timescale: in the United Kingdom, for example, wave and wind power time series have been found to have a low correlation on a daily basis. This is significant as variability in the short term, around one to four hours before delivery, is a principal challenge.
Figure 1 ● Smoothing effect of geo-spread on wind poweroutput in Germany (2-12 February, 2005)
0
0.2
0.4
0.6
0.8
1
1.2
2/2/05 3/2/05 4/2/05 5/2/05 6/2/05 7/2/05 8/2/05 9/2/05 10/2/05 11/2/05 12/2/05
Individual wind turbine (225 kW) Group of wind farms (72.7 MW)
All German wind farms (16.5–18.3 GW)
Norm
alise
dpow
er
Source: Wind Energy Report Germany 2006, ISET, Kassel, 2006.
Figure 2 ● Monthly capacity factors for wind and PV, Germany, 2005
0
5
10
15
20
25
30
35
40
45
Jan Feb Mar Apr May Jun Jul Aug Sep Oct Nov Dec
PV Wind Average
Capacit
yfa
cto
r%
Source: Institut für Solare Energieversorgungstechnik (ISET).

12
ForecastingIncreased accuracy of meteorological forecast alleviates much of the concern related to the impacts of variability, as it enables other, firm power plants in the portfolio to be scheduled more effectively. A range of methods of forecasting the resource and resulting plant output exists, and forecasts can then be ‘superimposed’ on the demand profile, and necessary additional generation dispatched accordingly. Forecasting technologies are particularly important for wave, wind and solar technologies, the output of which varies irregularly. The tidal resource also varies, but is completely predictable.
Increasing the accuracy of forecasts is important. Although meteorological forecasting is increasingly accurate, and the overall shape of production can be predicted most of the time, nevertheless significant deviations do still occur in both speed and timing. Predicting the arrival of a large weather front a few hours early or late can create short but significant imbalances in supply and demand. Forecasting of wave variability is subject to somewhat less uncertainty due to its slower frequency of variation, and less direct dependence on wind conditions (Powertech Labs, 2008). Accuracy can be raised through increasing the size of balancing areas, yielding a reduced net resource forecast error, and by trading closer to real time, as forecast accuracy increases considerably at shorter notice.
However, resource forecasting is not always used in system operation. It is more commonly used in the European Union than in the United States, for example. On 26 February 2008, in Texas, wind output dropped sharply by 1400 MW. The system operator was at the time conducting trials of a new forecasting system, which predicted the event with good fidelity. Had this forecast been taken into account, the impact on the system of the drop in wind speed would probably have been greatly diminished. The new system is scheduled to be put into operation later in 2008.

13
3 ● Power system flexibility
What is meant by flexibility? A power system is flexible if it can – within economic boundaries – respond rapidly to large fluctuations in demand and supply, both scheduled and unforeseen variations and events, ramping down production when demand decreases, and upwards when it increases. System flexibility benefits the power system as a whole, as well as having special importance for variable renewables. In var-RE terms, a flexible system is one that can both “absorb” large quantities of variable electricity, and dispose of surplus cost-effectively. It can also ensure adequacy of supply in times of low variable electricity output, whether scheduled or unforeseen.
The flexibility resource fluctuates. The available flexibility resource of a power system varies over time, and with the extent of demand. If demand is high, less flexibility will be available to supplement periods of low var-RE output. Nonetheless, at low penetrations, the introduction of var-RE brings very little additional effort in terms of increasing the flexibility of the system. The obvious exception to this general rule of thumb is small systems. This is because the size and diversity of the generation portfolio, and the geographical reach of the network, are important sources of flexibility.
Flexibility is already a feature of power systems. Flexibility is easiest to identify in the portfolio of power plants. A certain level of power output is required round-the-clock, day and night: the base-load. This is usually provided by plants which have limited dispatchability, i.e. start-up and shut-down times are long, so they are at their most efficient (and cost-effective) when run at full output without interruption. These are the inflexible plants, and to a great extent include existing nuclear and older coal-fired plants. At the other end of the flexibility spectrum are plants that can be used to meet peak demand, ramping up and down quickly and efficiently, such as reservoir hydro or open-cycle gas plants. However, even if a plant is technically flexible, there may still be economic considerations relating to the length of time it is in operation.
Flexibility at different timescales. Flexible capacity which can respond the fastest also tends to carry a high premium, so it is desirable to restrict its use to covering last-minute imbalances in supply and demand. In response to longer-range forecasts of var-RE output, slower, cheaper, flexible capacity can be scheduled. Var-RE resources can be predicted with greater accuracy as the time ahead of delivery reduces, reducing the need for the fast-response, high-premium variety. An open market for production and transmission, enabling intra-day and intra-hour trading can have a significant impact on the accessibility of existing flexibility resources.
Flexibility is an intrinsic feature of transmission networks. Electricity grids have an inherent tolerance as actual operating conditions may depart from the assumptions made by planning engineers: higher than expected demand on the day in question, for example, or the unexpected unavailability of a power plant or network hardware, resulting in unanticipated loading patterns. But as grids become highly loaded their inherent tolerance to such variations reduces; they move from being elastic to brittle. Seeking maximum asset utilisation is in principle efficient, but grids operating close to their voltage and stability limits require close attention when planning for increased var-RE integration.
Assessing flexibilityAssessing flexibility is not yet common practice. Some countries and regions are pushing ahead with the integration of var-RE with a “learning as we go” approach. Further understanding of just how far a country/region can go with var-RE integration – and how much additional effort it will require – can be gleaned from an assessment of the existing flexibility of the system. Although indirectly involved in the planning of most power systems, such assessments do not yet follow a comprehensive, transferable methodology that might facilitate common practice among system operators. It is a highly complex process taking into account many operation and design aspects. Here a very simplified approach is suggested, to provide a broad picture of the salient factors.
14
Step one: identify the flexibility resource. The scale of the existing, available flexibility resource of a power system depends on how it has evolved over time. This can enable a certain var-RE share with only nominal additional effort. However, if the targeted share of var-RE is greater than that accommodated by the existing resource, after having taken into account the extent of correlation with demand, geo-spread and techno-spread, then additional effort will be required.
Sources of flexibility. The flexibility resource of the power system is based on four key criteria: ● The quantity of fast-response capacity in the generation portfolio.● Storage availability:6 capacity and duration.● Transmission interconnection capacity to adjacent power systems – to export surplus, or import
supplementary power.● Demand side management (DSM) and response: the potential of consumers to alter their electricity
use in response to supply abundance / shortage.
While these criteria represent the flexibility resource itself, access to such resources is another matter, considerably improved through optimising market operation, as well as by ensuring the availability of adequate intra- and international transmission and distribution capacity.
Step two: take into account the existing requirement for flexibility. The existing flexibility resource is not only for use in the enabling of var-RE integration. Part of it is necessary for the reliable operation of the system as it stands. This flexibility requirement is maintained against existing balancing needs, errors in demand forecast, and contingencies.
Step three: the Net Flexibility Resource. Once the existing flexibility requirement has been accounted for, the remaining net flexibility resource can be considered to be available for use in balancing the additional fluctuations introduced by additional var-RE output. If the targeted amount of var-RE generation exceeds what is accommodated by the net flexibility resource, additional measures must be taken. Box 2 summarises this approach, and outlines how the net flexibility resource (NFR) might be used to contrast the flexibility of different power systems.
6. This might include storage of water in reservoirs (including pumped hydro), compressed air energy storage (CAES), battery storage in static units or hybrid / electrical cars, flywheels, and others. At present, only hydro storage is in large scale commercial use, although batteries in the megawatt range with several hours of output, and CAES, have been demonstrated.

15
Box 2 ● Using NFR to compare power system flexibilitiesThe four types of flexibility resource listed in Figure 3 can be equated to some extent as they all facilitate the same service. They can be assigned equivalent values and combined to express the existing flexibility resource. The existing flexibility requirement can then be taken into account, and the net resource identified.
Figure 3 illustrates that, if NFR is then weighted according to the size of the power system in question, direct comparisons can be made between different power systems in terms of their flexibility. In other words, whether a given power system is highly flexible because it is very large, or highly interconnected, or contains a very large hydro capacity, it can be compared in flexibility terms with other systems featuring different combinations of flexibility characteristics.
Figure 3 ● Identifying a comparable flexibility value
(Existing) Flexibility Requirement
Balancing variability andforecast errors in demand
Contingencies**Requirements of existing var-RE
Flexible generationInterconnection capacity*
Demand responseStorage capacity (power)
Flexibility Resource
Net FlexibilityResource(NFR)
Size of the power system***
Notes:* Only the available share of interconnection capacity should be taken into account. Some interconnection capacity may be set aside against contingencies. When assessing available capacity, installed var-RE capacity on “both ends” of the line must be taken into account, to avoid double counting.** It may be possible to use contingency reserves also for balancing variability, provided their contribution to protecting the security of the system remains undiminished.*** The size of the power system, depending on its generation portfolio and other structural characteristics, may be represented by peak load, minimum load or even installed power capacity. Here it is used to weight NFR, to allow comparison among distinct power systems.

17
4 ● Operational measures to increase flexibility
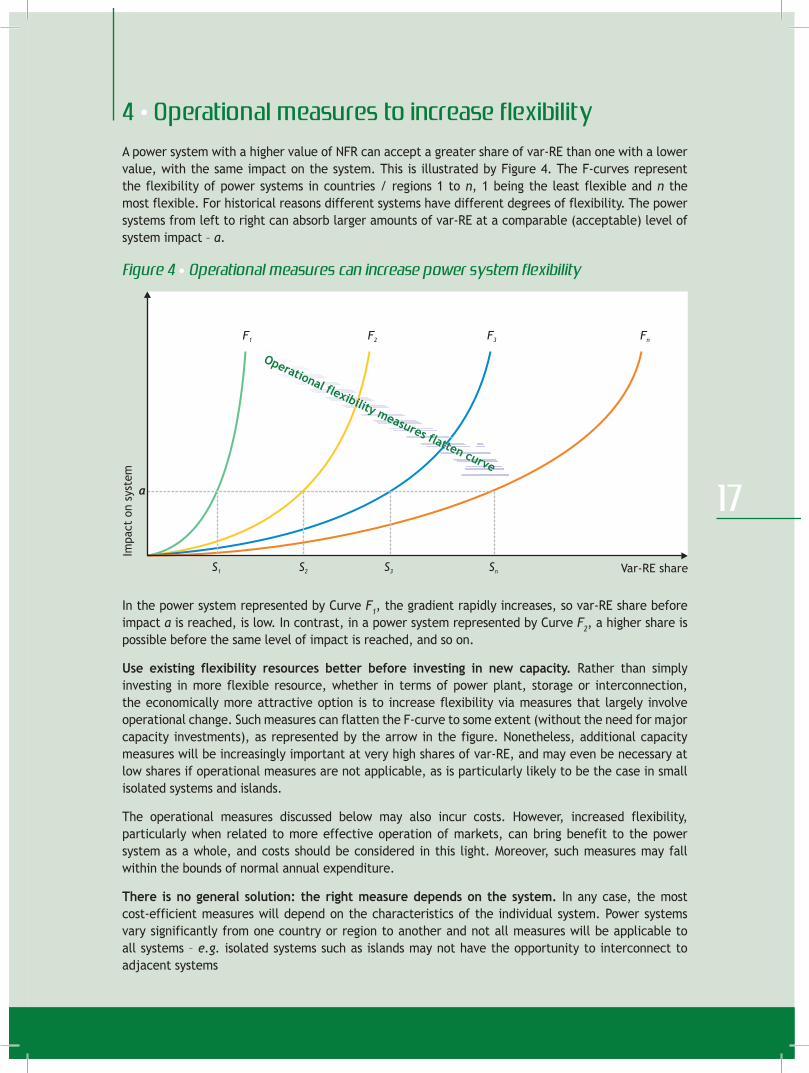
A power system with a higher value of NFR can accept a greater share of var-RE than one with a lower value, with the same impact on the system. This is illustrated by Figure 4. The F-curves represent the flexibility of power systems in countries / regions 1 to n, 1 being the least flexible and n the most flexible. For historical reasons different systems have different degrees of flexibility. The power systems from left to right can absorb larger amounts of var-RE at a comparable (acceptable) level of system impact – a.
Figure 4 ● Operational measures can increase power system flexibility
Var-RE share
a
Operational flexibility measures flatten curve
Impact
on
syst
em
F1
F2
F3
Fn
S1
S2
S3
Sn
In the power system represented by Curve F1, the gradient rapidly increases, so var-RE share before impact a is reached, is low. In contrast, in a power system represented by Curve F2, a higher share is possible before the same level of impact is reached, and so on.
Use existing flexibility resources better before investing in new capacity. Rather than simply investing in more flexible resource, whether in terms of power plant, storage or interconnection, the economically more attractive option is to increase flexibility via measures that largely involve operational change. Such measures can flatten the F-curve to some extent (without the need for major capacity investments), as represented by the arrow in the figure. Nonetheless, additional capacity measures will be increasingly important at very high shares of var-RE, and may even be necessary at low shares if operational measures are not applicable, as is particularly likely to be the case in small isolated systems and islands.
The operational measures discussed below may also incur costs. However, increased flexibility, particularly when related to more effective operation of markets, can bring benefit to the power system as a whole, and costs should be considered in this light. Moreover, such measures may fall within the bounds of normal annual expenditure.
There is no general solution: the right measure depends on the system. In any case, the most cost-efficient measures will depend on the characteristics of the individual system. Power systems vary significantly from one country or region to another and not all measures will be applicable to all systems – e.g. isolated systems such as islands may not have the opportunity to interconnect to adjacent systems
18
Aggregating power systemsLarger markets are more flexible. Small supply and demand balancing areas are vulnerable to interruptions in supply and unexpected changes in demand. Reserves to cover these events will constitute a larger proportion of the total generation portfolio than in larger systems. Consolidating balancing areas can enable a geographically larger area to rely on a smaller proportion of reserves to maintain system reliability, and enables imbalances to “flow” to where they cost least to cover, as well as presenting variability-smoothing effects.
Sharing reserves over a wider area. A 2007 study on wind power integration in Minnesota (Enernex, 2006) assessed the regulating reserve (seconds to minutes timescale) required if all four of its balancing areas were merged into one, to be about half the amount required if the balancing areas continued to operate individually (UWIG, 2007). With the addition of wind power in Minnesota to cover 25% of total electricity consumption, the study found that the required regulating reserve rose to 157 MW – still only about 60% of the amount required, with no wind power, for the four areas managed separately. However, reserve is required on a number of timescales, and operating reserve (on the days scale) in the consolidated balancing area increased from 0.7% to 2.6% of total capacity with 25% wind.
The Nordic Power Market. Whether consolidation is regional, national or international, the effect is similar. The first example in the world of an international wholesale and balancing market for electricity is the Nordic Power Market, which includes Denmark, Sweden, Norway, and Finland. In this market, day-ahead, intra-day and intra-hour trade is coordinated among the countries to optimise the use of physical resources. This means that if the cheapest way to balance a wind change in Denmark (via the intra-hour regulating market) is to change power production in Finland (at a distance of around 1400 km), then this bid is accepted, assuming that there is sufficient transmission capacity available.
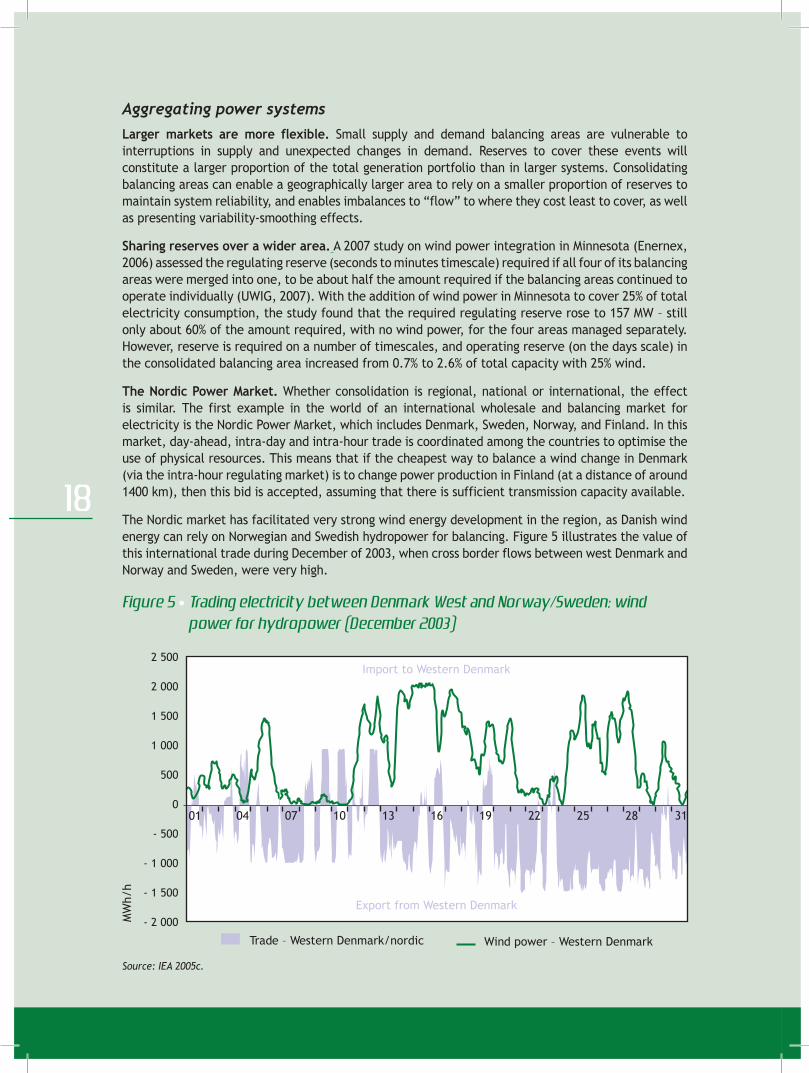
The Nordic market has facilitated very strong wind energy development in the region, as Danish wind energy can rely on Norwegian and Swedish hydropower for balancing. Figure 5 illustrates the value of this international trade during December of 2003, when cross border flows between west Denmark and Norway and Sweden, were very high.
Figure 5 ● Trading electricity between Denmark West and Norway/Sweden: wind power for hydropower (December 2003)
MW
h/h
2 000
2 500
- 2 000
- 1 500
- 1 000
- 500
01 04 07 10 13 16 19 22 25 28 31
Import to Western Denmark
Export from Western Denmark
1 000
1 500
500
0
Trade – Western Denmark/nordic Wind power – Western Denmark
Source: IEA 2005c.
19
Power markets in the United Sates. In the United States seven large Independent System Operators run competitive markets (PJM, MISO, NYISO, ISONE, ERCOT, CAISO, SPP) that cover 53% of electricity demand (Oakridge National Laboratory, 2007). It is interesting to note that these markets include 80% of installed wind even though they only represent less than 40% of wind potential. The more liquid such spot markets are, the more effectively the market can respond to short-term needs for balancing power to cope with high var-RE shares.
Communication and control are vital. Consolidation will likely require considerable effort in recalibrating the limits of the system, very strong collaboration among system operators, and may imply additional transmission reinforcements in order to avoid congestion. Larger balancing areas also can enhance the risk of faults or transmission congestion in one power system affecting interconnected neighbours, which reinforces the need for control and communication strategies.
Increased need for effective oversight. The increased use of international interconnections among power systems for everyday system balancing increases the need for collaboration among adjacent system operators. Regulatory compatibility among national / provincial interconnected systems may be assisted by a formal regulatory body with powers extending over the whole area concerned, such as the Federal Energy Regulatory Commission (FERC) in the USA. However, in the Nordic countries, collaboration among the system operators works without the existence of a formal international regulatory body. In Europe, the European Regulators’ Group for Electricity and Gas provides a forum for collaboration on a similar scale to the FERC.
Trading closer to real timeDay-ahead and intra-day trading. Wholesale power markets are increasingly common. Electricity producers commit themselves to deliver a certain amount of electricity to the market at a given time. Depending on the market, scheduling of delivery can be day-ahead – which in practice usually means 12 hours to 36 hours ahead, although it can stretch as far as 82 hours ahead if the power exchange is not open over the weekend, as has been the case in Germany. Markets may also be intra-day, operating anything from six hours to minutes before real time, depending on the system in question.
Shorter gate closure times. The moment of gate closure is the point in time at which the market commits the delivery of electricity. Delaying gate closure means that producers can delay the moment when they must commit themselves to deliver a certain volume of electricity to the market. This is particularly important for var-RE power plants such as wind, wave and solar, whose output forecasts are more accurate in the near term. This means that the difference between what is scheduled to be delivered and what is actually delivered is reduced. Additionally, trading close to time of delivery can enable more efficient use of fast-response, flexible power plants, as well as demand side response measures.
Day-ahead remains important. At higher penetrations of var-RE, scheduling on the day-/days-ahead timescale remains important (UWIG, 2007) for the scheduling of reserves by the system operator. When considering the scheduling of reserves, it is important to take into account the physical limitations of available power plants. For example, if the start-up time for available thermal power plants is four hours, then it should be possible to make a bid four hours in advance of gate closure.
Demand side management and responsePeak-time electricity is expensive. Electricity demand peaks daily in any power system, and is also subject to sudden spikes, which may or may not be forecast. These relatively short periods, which may only amount to a few hours in the course of a year, are catered for by accessing reserves in the form of stored energy or flexible, “peaking” generators, which may only be operated at such times. The use of such resources is expensive, and at such times there is marked upwards pressure on electricity prices. Measures on the demand side – the electricity consumer – offer important opportunities to reduce system costs.

20
The alternative is to shave down the peaks. The scale of demand peaks can be reduced – meaning less peaking plant is needed – by introducing incentives to consumers to reduce their consumption at such times. Demand response means a change in the time of consumption (“time of use”) relative to normal patterns of behaviour, in response to an incentive. This may come in response to a rising electricity price seen by the consumer or, more simply, in response to a signal from the system operator to reduce consumption when the reliability of the network is jeopardised, in return for an agreed fee. Contracted “interruptible” load is already used regularly in case of contingencies, when load (demand) needs to be shed from the system.
Active demand side participation in markets. Contracting interruptible load is a relatively simple form of demand side response. A more advanced form involves the establishment of demand bidding structures that allow the direct participation of consumers offering to reduce their demand. In terms of benefit relative to effort, this kind of interaction may be more practical for large consumers with very high demand and a correspondingly high benefit to be had from reducing it when prices are high. This may not be so simple: time of use can often be linked to manufacturing processes that can not easily be rescheduled.
Domestic participants. Conversely, individual domestic users may be highly flexible in their time of use, but may have limited incentive to participate, as the resulting reduction in their total household expenditure may be too little to be deemed worthwhile. For this reason, structures may be needed to allow for the grouping of many smaller demand-side resources (e.g., less than 1MW) for market participation. Appropriate market rules would also be necessary to incentivise such participation, as well as updating of operating procedures, possibly including automatic meter reading, and effective, two-way communication. International interest in “smart metering” and its associated communication channels and transaction support systems is a helpful development in this respect.
Where does var-RE come in? Variable renewable electricity production, to some extent like consumer demand, also fluctuates. Experience in Denmark shows that at times of high wind energy output the electricity price is reduced considerably. If low price periods can be capitalised on by consumers – by shifting their demand to such times – then when var-RE supply is low, the need for peaking plant can be reduced; and when it is high, the need for storage or export can be reduced. Increasing the role of consumers in demand “shaping” also increases the potential for distributed var-RE production such as PV integrated into building designs; and domestic level storage, such as in electric cars.
Experiences with demand side response. Today’s wholesale markets, in the main, do not stimulate demand side response (Ecofys, 2007). Nonetheless simple measures have been in use for many years. In the UK, day and night tariffs have been offered to shift demand into the night, when demand is lower. In the Republic of Korea, where the objective is to increase end-use efficiency for reductions in greenhouse gas emissions, recent schemes include the domestic, industrial, commercial and residential building sectors (IEA DSM, 2006). PJM Interconnection, a large regional transmission operator in the northeast of the United States, currently includes in its voluntary demand response programme some 6,000 commercial and industrial facilities (greater than 100 kW), and about 45,000 smaller assets. Assets reduce their consumption in response to price and receive a payment. Reduction can also be signalled the previous day in return for a similar payment. In 2006, in the PJM area, participating demand response in energy terms (a capacity option exists also) amounted to around 240 GWh (PJM, 2008).
An important, recent example has been the establishment of the commercial company Energy Response as an open access aggregator of demand response for all participants in the Australian electricity market. Energy Response provides its demand-side management services to retailers, transmission network service providers, distribution network service providers and the system operator (Schwaegerl et al., 2007).

21
5 ● Transmission and distribution
Transmission networks are old and aging fast. Electricity networks are the physical matrix through which the delivery of electricity takes place, and without which a generator can only serve demand in the immediate vicinity. In many OECD countries, these vital networks of lines (overhead) and cables (underground), together with the control hardware and software used to operate them, were designed and built in the middle of the last century to serve the traditional centralised generation paradigm. A new investment cycle is imminent. End-of-life asset renewal is in practical terms a rare opportunity. If like-for-like replacement of equipment takes place, rather than taking an innovative approach that recognises the opportunities for renewable energy sources, distributed generation and demand side participation, it is likely that the opportunity will not arise again for another forty years or so (the typical life of grid assets). Enhanced distribution, transmission, and international interconnection can bring benefit to power systems as a whole.
Transmission upgrades will require heavy investment – unrelated to var-RE. The World Energy Outlook 2006 suggests that over USD 6 trillion of investment will be needed in transmission and distribution networks up to 2030. If system development is planned in a coherent, integrated manner, the variability characteristic can be taken into account and provided for in advance. Either way, integrating new generation and new transmission elements into an old infrastructure must be done with care.
Flexible market operation depends on networks. The previous chapter focused on market measures to increase access to the flexibility resource of a power system. These measures depend on the presence of adequate transmission and distribution networks. Here, the priority should be on making the best use of existing transmission corridors, before building on new capacity, if and when needed. There will be cases where new transmission corridors are required, to reduce congestion, for example, or to connect new power plants. An obvious case in point is the issue of consolidated balancing areas. In some cases it may be possible to simply merge the operation of balancing areas, which are already interconnected but nonetheless operated as discrete balancing areas, exchanging electricity only on occasion, or in case of contingency. In other cases, a merge may require the establishment of a physical link in the form of new transmission.
Cross-border trade. In the EU, the European Commission’s programme of Trans-European Networks for Energy has identified a number of key additional connectors to improve cross-border trade.7 Such links, combined with liberalised market operation, increase the scale of networks far beyond national borders, potentially increasing their reach beyond the scale of individual weather systems, and thus providing additional opportunity to smooth the output of var-RE production. In the United States, there is growing support for a transmission superhighway network that would not only benefit the overall operation of the existing power systems and increase their limited transport capability, but also unlock the vast wind energy resources in the central part of that country (Browne, 2008).
Embedded var-RE can postpone the need for new infrastructure. Because of opportunities for integration in buildings, PV development often occurs in the same location as demand. In such cases, if production output is concurrent with demand – such as demand for air-conditioning in hot regions – network reinforcement may be unnecessary while generation remains in the same order of magnitude as demand. Moreover, normal development (i.e. not due to var-RE integration) in response to growing demand may also be postponed or even avoided as embedded generation has the net effect of decreasing demand in that area. This reduces the amount of power that must be transmitted from centralised plant, and avoids resulting transmission losses.
7. See http://ec.europa.eu/ten/energy/index_en.htm
22
Box 4 ● Connecting new var-RE plantHigh penetrations of var-RE imply significant effort in the reinforcement and extension of existing networks. This may take several forms: strengthening (increasing the capacity of) weak lines to cope with more throughput; building new lines to interconnect distinct areas; and extending the network into new areas to take advantage of high quality resources on land and offshore. Integrating offshore resources can require significant investment. In the Pacific Northwest region of the United States and Canada, for example, much of the wind and wave resource is located far from existing transmission infrastructure (Powertech Labs, 2008). But this is not necessarily the rule. In general, the development of tidal stream plants is likely to take place in areas with network availability because high energy tidal channels are often located near population areas, while significant offshore wind energy resources may be located off coastal cities.
A vicious circle of new plant and new transmission can persist. New var-RE projects may have difficulty attracting finance without first having secured access to transmission. On the other hand, without the promise of installed plant, transmission owners have no incentive to build new transmission corridors. A vicious circle develops, delaying the development of new generation, as both generation and transmission developers fear a stranded asset, should the other fail to materialise as planned. In Scotland in the United Kingdom, around 13 GW of early-stage wind energy projects are waiting for connection approval at the time of writing, but perhaps as many as half may never actually be translated into actual plant (DBERR, 2007). The governments of several states in the United States, including Texas and California, have recently taken steps to end a similar impasse by ordering new extensions towards resource-rich areas, on the assumption that generation will follow. The cost of transmission extension can then be recouped through transmission-use-of-system charges.
Active management of distribution networks. Embedded generation can impact the direction and quantity of electricity flows in the distribution (medium to low voltage transmission) network. The scale of production will govern the magnitude of such effects, which will be greater, for example during periods of high generation but low demand, at which times flow reverses and travels upstream towards the high voltage network. This incurs operational difficulties and energy losses, (which will eventually reach the same degree as the losses avoided through long distance transmission from centralised plant). Increasing levels of distributed generation implies a need to actively manage distribution networks, which are usually left passive. On the hardware level, distribution control hardware is commonly designed for one-way flow of electricity, in which case it will need to be upgraded.
Grid rules should be carefully designed. Rules governing the connection of var-RE plant to the grid are sometimes set, perhaps temporarily, on a precautionary basis if inadequate empirical information exists as to the impacts of var-RE integration. A key objective in the setting of grid codes should be to ensure compatibility between var-RE generation and the grid, so as to maximise the accommodation of var-RE. If such codes are excessive, or imposed even when var-RE shares are very low, they can place an unnecessarily heavy burden on such technologies, which must provide for the measures or forego access to the network (EWEA, 2005). Grid codes should be developed in cooperation between operators of the network and of var-RE plant. Requirements for “fault-ride-through” capability of wind farms – their continuing operation during a system voltage drop – are a case in point. The recalibration of grid codes in the light of var-RE generation entering the system may be assisted by the development of mathematical models that can adequately predict system behaviour at high var-RE penetrations (REIL, 2007).

23
Box 5 ● Planning issues affecting transmission flexibilityLong-term planning. Effective long-term planning of power systems should follow an holistic approach and should integrate the growing needs of var-RE and conventional power plant in design, as these are likely to overlap (such as shared requirement for transmission capacity). Individual elements of generation, storage and transmission should not be approached in isolation, but looked at coherently. A portfolio approach is essential. Conversely, a “bolt-on approach”, looking at such elements one after the other, will only increase cost.
Market signals. A network may contain areas wherein capacity is underused, and others where insufficient capacity can lead to blackouts. Price signals can play an important part in the efficient development of power systems to avoid such occurrences. The marginal cost of electricity varies over time and location because of, among other things, constrictions on transmission capacity. Occurrences of transmission congestion can be signalled by an upwards price pressure, implying a weak link in the network, and indicating a need for increased capacity.
Not In My Back Yard (NIMBY). New transmission corridors may face major delays in the planning phase, as permits are withheld because of public antipathy. This has stretched the planning periods for some European developments to as long as 10 to 15 years. Underground transmission cables may have potential to counteract public resistance. The state of Lower Saxony in Germany, for example, has recently adopted legislation requiring that more (underground) cable be used while, in Denmark, transmission cable policy is currently under revision. Existing regulations may also constitute a barrier. In Italy, increasing the transmission capacity of existing corridors may be blocked by regulations related to exposure to magnetic fields, developed with public health in mind, and which may not take into account the state of the art (Terna, 2007).
Optimal use of transmission capacityUnder-used transmission capacity. Var-RE power plants operate according to the available resource, which fluctuates. The capacity factor of a power plant is the power actually produced as a proportion of its maximum possible output if it were operating 100% of the time.8 Typical capacity factors for onshore wind power plants, for example, range from 20 to 30%, while offshore it can range up to 40%, depending on the resource. Resource availability is not the only factor constraining capacity factor. Maintenance, faults, and a range of other elements mean that no power plant has a capacity factor of 100%. Conventional (coal, gas and nuclear) plants tend to have capacity factors in the range of 50 to 90%. As a consequence, the transmission capacity allocated to a specific power plant may not be in use all of the time.
Sharing transmission capacity. Transmission capacity in some systems is allocated on a firm basis, which means that even if the plant in question is not using it, it is not available for use by other plants. In such a system, new power plants wishing to connect to the network will require additional transmission capacity, and will often carry the cost burden this entails. In a simplified example, two neighbouring power plants, one conventional and one based on var-RE, with individual transmission connections, may only be using their maximum combined capacity for transmission for only half of the time. Sharing transmission capacity between var-RE plant and flexible conventional plant such as gas or hydropower can reduce this duplication of effort. The UK Transmission Access Review, being held at the time of writing by UK electricity regulator OFGEM, considers an approach to sharing transmission capacity, wherein the cost of additional connections is shared among the connecting generator, existing generators and demand customers with fixed liabilities based on use of system charges (DBERR, 2007).
8. This is often confused with ‘availability’, which is the amount of time during the year that a plant is producing power.

24
Interconnection allocation and use. Interconnection capacity between adjacent balancing areas is an important factor when considering how to widen electricity markets and so take advantage of the benefits this entails in terms of system flexibility and smoothing of variability. Capacity may exist already, but its use may be restricted to the provision of reserves in case of contingency, or allocated through long-term contracts, the result being that such capacity may not be available, or in only small measure, for the everyday trading of electricity. In such cases, allocation should be optimised. Transparent, short-term auctioning of available transmission capacity, with the proviso that sufficient capacity must be available to provide for contingencies, and so maintain network reliability, would enable greater use of such capacity at short notice, and yield improved flexibility.
Intelligent network operationInterest is strongly increasing worldwide in the concept of intelligent power systems – known colloquially as Smart Grids – a range of technologies and operation practices that can bring benefit to power systems as a whole. Opportunities for demand side management and response will be greatly enhanced by more responsive operation of networks. Many strategies for future power system evolution, published by the European SmartGrids Technology Platform, and the US GridWise Alliance, among others, highlight the need for increased end-user involvement.9 In the United States, the need for smart grids was included in December 2007 federal legislation.
“A smart grid generates and distributes electricity more effectively, economically, securely and sustainably. It integrates innovative tools and technologies, products and service, from generation, transmission and distribution all the way to consumer appliances and equipment using advanced sensing, communication, and control technologies. It provides customers with greater information and choice, including power export to the network, demand participation and energy efficiency.”10
More than just new technology. The intelligent network concept represents a paradigm shift in the generation and use of electricity, and this is in itself likely to be something of a barrier as it must evolve from the existing system, which can not be simply turned off while the necessary upgrades are installed. The cost of such measures is not yet clear, and should be balanced against the benefits that may be brought to overall system operation. A new approach to managing power systems will need to develop over time, one which views elements of the system more interchangeably: electricity customers who could also be micro-generators and system-balancers; or distribution network operation that more and more resembles that of the high voltage, transmission network.
Deployment of such technologies remains slow. Concurrently, newly developed technologies need to be deployed, bringing down costs and bridging the “valley of death” that can swallow up new technologies between development and deployment. The power industry offers a variety of innovative devices and operation strategies to assist in the evolution of the power system towards increased flexibility. Some of these technologies have been widely researched, are ready for deployment, and yet are still not commonly applied in power system planning and operation. The remainder of this chapter looks at some prominent examples.
Line temperature monitoring. The temperature of an overhead line – and thus its carrying capacity – is affected by ambient weather conditions, such as wind speed and air temperature. General practice is to set worst case ambient values so that a minimum capacity can be relied upon, and this is then fixed as the maximum carrying capacity (rating) of the line. Output from wind and wave power generators increases with wind speed, which also cools transmission lines in the same locale, thus increasing their carrying capacity. This correlation can be used as the basis for a number of different methods of enhancing carrying capacity, based on measurement of changing line temperature, fluctuating weather conditions or increasing / decreasing line tension (sag). Such “dynamic rating” can enable up to 50%
9. See http://www.smartgrids.eu/ and http://www.gridwise.org/
10. Adapted by KEMA from a definition compiled by the Energy Policy Initiatives Center, a member of the GridWise initiative.

25
more transmission capacity when it is needed most – when the wind is blowing (Ecofys, 2007). A simpler approach is to establish a number of different ratings depending on average seasonal temperatures, which is common practice in a number of countries.
A first Transmission Line Monitoring System was installed by Virginia Power in the United States in 1991. Since then, over 300 Transmission Line Monitoring Systems have been installed at 95 utilities in over a dozen countries on five continents including the United States, Canada, the United Kingdom, Finland, Sweden, Denmark, Belgium, Germany, Spain, Argentina, Norway, Poland, the Netherlands, Brazil, Australia, New Zealand, and the Middle East.
Wide-area monitoring and protection systems. On-line dynamic security assessment provided by wide-area monitoring and protection systems may substantially improve on conservative assumptions about operational conditions, and enable the full utilisation of the transfer capability of a power system. This technology can enable network operators to react in close to real-time for trading, fault prevention and asset management. Challenges to widespread introduction of such methods are found at organisational and regulatory levels, due to the need for standardised monitoring technologies, synchronised data acquisition and online data exchange.
New transmission technologiesHigh temperature lines can help overcome bottlenecks. Increasing transmission capacity without the building of new transmission corridors is an important measure. The carrying capacity of a transmission line (overhead) depends on the degree of sag, which is increased as ambient temperatures rise and the conducting core of the line stretches – the deeper the sag, the lower the carrying capacity. Rewiring existing lines with high-temperature wires can increase overhead line capacity by up to 50% (Ecofys, 2007). The use of high temperature conductors may not be suitable for all circumstances as the use of higher currents can bring about new challenges relating to reactive power and voltage stability, but they can be particularly useful to deal with bottlenecks in transmission.
Rewiring with high temperature lines may, depending on local regulations, be possible without additional permitting requirements. However, electromagnetic fields emanating from upgraded lines may need assessment in the light of legally defined acceptable levels. A number of other issues may also need to be taken into account. Depending on the conductor type, increased resistance of high-temperature conductors can lead to an increase of line losses. Heavier lines may affect the mechanical design of the masts, and other power system components (switches, transformers) may need to be upgraded. At present, investment costs for high-temperature conductors are generally about 50% higher than for standard conductors (Ecofys, 2007).
Alternating Current Cables. The use of underground (alternating current) transmission – cabling – can speed up permitting processes relating to new transmission corridors. The construction of new transmission corridors using overhead lines is commonly delayed by local opposition, on environmental, visual or health grounds (see Box 5). Underground transmission to a large degree avoids such objections. Cabling insulated with extruded polyethylene (XLPE) is already used extensively worldwide, but only few very high voltage projects have been implemented in Europe (ICF, 2003). Although investment costs for underground cables are higher than for overhead lines, at present the cable/line cost ratio differs significantly with voltage, and has reduced in recent years (Ecofys, 2007).
A number of challenges remain. In meshed systems (where the network is interconnected in many places) the use of cables, which have different transmission properties than overhead lines, can affect electricity flows in neighbouring parts of the system to a greater extent than additional overhead lines.11 Cables can not be as long as overhead lines, due to a range of electrical effects. Overhead lines are more sensitive to weather phenomena than cables, and more subject to related faults. However, faults are typically easy to locate, while cable faults, although less frequent, can be harder to find, and Danish experiences suggest that repairs can take days to weeks.
11. In this case, lower impedance, ‘pulling’ electricity on to the cable from elsewhere on the system.
26
High Voltage Direct Current Transmission. When transferring large amounts of power over long distances, high voltage direct current (HVDC) transmission has advantages over more traditionally used alternating current: losses over distance are lower. A second advantage relates to the control of electricity flows around the network. In an AC network, electricity, simply speaking, follows the “path of least resistance”. In effect, this means that injection or use of electricity in one part of the network can cause flows to change in neighbouring areas (loop flows), even in neighbouring countries, bringing unanticipated side-effects. In contrast, HVDC transmission carries a specific volume of electricity to a specific location. HVDC has particular value in the transport of var-RE output from marine environments onto shore, as well as for long-distance transmission to demand centres over several hundred kilometres, with low losses.
Extensive experience of HVDC has been garnered with interconnectors between neighbouring power systems, and long distance transmission. Transmission ratings of 3 GW over large distances are common today, and the world’s first 800 kV HVDC project in China has a transmission rating of 5 GW, while further projects of 6 GW and higher are at the planning stage. Submarine power transmission of up to 600 - 800 MW over distances of about 300 km has already been achieved, and cable transmission lengths of up to about 1 000 km are at the planning stage (Siemens, 2007).
FACTS. Flexible Alternating Current Transmission Systems (FACTS) are power electronic systems that enhance the controllability of AC transmission systems. FACTS can play a major role when there is a need to respond to dynamic, fast-changing network conditions, and can increase the amount of electricity that can be transferred to another part of the system when necessary (bulk power transfer capability). It should be noted that FACTS devices should be added for the improved operation of the power system, and not just to enable var-RE integration. FACTS devices have been under development for nearly twenty years, and provide a range of services for management of power flows, transmission losses, and system reliability (Ecofys, 2007). Major challenges for the more widespread introduction of FACTS devices are unfamiliarity of operators with such devices, and more competitive conventional approaches.
Superconducting Fault Current Limiters. As discussed above, a group of interconnected power systems operating as one are likely to be more flexible than if operating independently. Temporarily high “fault currents” – due to system faults – can exceed the capacity of standard circuit breakers when systems are interconnected widely. The use of Superconducting Fault Current Limiters (SFCL), which can cope with much higher current, can reduce barriers to the wider interconnection of networks.
SFCL technology has advanced quickly in recent years. Nexans Superconductors plans to install the first commercial SFCL in Germany in 2008, while prototype testing has been ongoing in 2007 at PowerTech Labs in Canada, prior to installation in California, later in 2008. Additional prototype testing is being carried out in the Republic of Korea, Japan and the United States.12
12. Ref. Communication with members of the IEA Implementing Agreement, High-Temperature Superconductivity in the Electric Power Sector.
27
6 ● Conclusions
Renewable electricity technologies include both firm and variable generation types. Variability – as with wind, ocean and solar power – brings additional challenges to power systems at high penetrations. If dispersed var-RE plants with uncorrelated output are considered on a system-wide basis, their aggregate variability is smoothed considerably.
There is no intrinsic ceiling to variable renewables’ share from a system integration point of view. The integration potential of a region/country depends on the flexibility of its power system. Variability has been a feature of power system design and operation from the start: demand is also variable, if more regular in shape. As fluctuations in var-RE generation output approach the scale of demand fluctuations, measures will be needed to increase the flexibility of the power system.
A power system is flexible if it can, within economic boundaries, respond rapidly and effectively to fluctuations in demand and supply, both scheduled and unforeseen variations and events, ramping down production when demand decreases, and upwards when it increases. System flexibility results from the design and operation of networks, the presence of quickly dispatchable generation such as hydro and open cycle gas turbines in the generation portfolio, energy storage, and on the transparency, operation, and scale of electricity markets, including the demand side. Careful cost/benefit analysis of such measures will be essential, taking into account positive and negative impacts on the system as a whole.
Understanding how much additional effort will be required to integrate a certain share of var-RE begins with an assessment of the existing flexibility of the system. The net flexibility resource (NFR) is the amount of flexibility provided by generation, storage, interconnection and demand side management, less the flexibility needs of the existing system to ensure reliable operation to cover demand. The existing NFR will enable a certain share of var-RE at nominal additional effort. Once this resource is accounted for, additional flexibility measures can be taken to enable further var-RE share.
Rather than simply increasing system flexibility by investing in new capacity – be it transmission, storage or generation – power system designers should seek to improve access to, and efficient use of, the existing NFR. This can be achieved via measures that relate to the operation of electricity markets, such as shorter gate closure times, and to the optimal use of transmission networks and technologies. Larger markets benefit from a net smoothing of variability, and increased forecasting accuracy, and can absorb larger fluctuations in electricity output than small systems, having access to a wider and deeper flexibility resource.
When considering the potential for variable renewable electricity, importance should be attached to developments in adjacent, interconnected power systems, as these will have impact on the availability of shared flexibility resources. Accurate forecasting – both of var-RE generation and demand – is essential. Predictability is the key to resolving concerns with variability. Forecasting techniques should be used by system operators and market parties to maximise their ability to schedule the generation portfolio effectively.
Networks may be inadequate for the large-scale incorporation of var-RE, and for large inter-area power trade. Already, many networks need reinforcement and development. State-of-the-art technologies are not being adopted quickly enough. An example is real-time monitoring of weather-related changes in the temperature of existing lines, to measure the effect on transmission capacity at any given moment. This alone can increase capacity by up to 50% in temperate climates, compared to when line ratings are assigned and fixed in advance.
The potential exists to share the use of existing transmission capacity among neighbouring var-RE and flexible conventional generation, to reduce the need for additional transmission capacity. Early, system-wide planning of transmission and distribution network development is crucial to identify synergies and avoid administrative/licensing delays. New transmission infrastructure can be delayed by as much as 10 years by public opposition. Many countries are facing a new investment cycle, and the opportunity to optimise network design and operation should not be missed.

28
The development of power systems can be made more efficient if market-derived price signals are used. This approach applies to a range of aspects from signalling congestion in the transmission network, and triggering investment to remove it, to enabling the consumer to change his patterns of use in response to scarcity and surplus in the market.
At present, many countries and regions are liberalising their electricity markets, and spot markets are increasingly common. International trade of electricity enhances the capacity of power systems to manage fluctuating output efficiently, while bringing additional benefits to the market. However, choice of strategy to increase network and market flexibility, and so foster greater use of variable renewables, will depend on national and regional circumstances.

29
Bibliography
● AESO (Alberta Electric System Operator) (2007), Alberta Government Unleashes Province’s Wind Power, AESO, Alberta, www.aeso.ca/downloads/News_Release_Wind_Announcement_-_September_26.pdf.
● Browne, J. (2008), Keynote Speech, New Energy Finance Summit, February 29th, London.
● DBERR (Department for Business, Enterprise and Regulatory Reform ) (2007), Transmission Access in GB, presentation at the IEA Workshop Trading and Transmission of Renewable Electricity: a Roundtable, October 10th, Berlin, www.iea.org/Textbase/work/2007/renewable_electricity/Baker.pdf.
● Ecofys (2007), Market Introduction Perspectives of Innovative Technologies Supporting Integration of RES-E. C. Ensslin, K. Burges, J. Bömer. Report by order of the German Federal Ministry for the environment, Nature Conservation and Nuclear Safety (BMU), January, Berlin, www.erneuerbare-energien.de/inhalt/41043.
● Enernex (2006), Final Report - 2006 Minnesota Wind Integration Study. Prepared for the Minnesota Public Utilities Commission by Enernex Corporation in collaboration with the Midwest Independent System Operator, November 30th, www.uwig.org/opimpactsdocs.html.
● Ernst, B. (1999), Analysis of wind power ancillary services characteristics with German 250 MW wind data. NREL Report No. TP-500-26969, www.nrel.gov/publications/.
● EWEA (European Wind Energy Association) (2005), Large Scale Integration of Wind Energy in the European Power Supply: analysis, issues and recommendations, December, Brussels.
● Holttinen, H. (2008), Estimating the impacts of wind power on power systems: Summary of IEA Wind collaboration. Environmental Research Letters, Vol. 3., www.stacks.iop.org/ERL/3/025001.
● IEA (International Energy Agency) (2005a), Variability of wind power and other renewables: Management options and strategies, IEA / OECD, Paris.
● IEA (2005b), Lessons from Liberalised Electricity Markets, IEA / OECD, Paris.
● IEA (2005c), Projected Costs of Generating Electricity, 2005 Update, IEA / OECD, Paris.
● IEA (2006), World Energy Outlook 2006, IEA / OECD, Paris.
● IEA DSM (International Energy Agency Demand Side Management Programme) (2006), DSM Spotlight, The Newsletter of the International Energy Agency Demand-Side Management Programme, Morse Associates, Inc. December, Washington, DC.
● IEA Wind (International Energy Agency Wind Implementing Agreement) (2007), State of the Art of design and operation of power systems with large amounts of wind power, Holttinen, H. et al, VTT Working Papers 82, www.ieawind.org.
● ISET (Institut für Solare Energieversorgungstechnik) (2007), Final report of the project Rolle der Solarstromerzeugung in zukünftigen Energieversorgungsstrukturen - Welche Wertigkeit hat Solarstrom? - Einfluss des PV-Stroms auf den Kraftwerkspark, financed by the German Federal Ministry for the environment, Nature Conservation and Nuclear Safety (BMU), project reference number 03MAP0075, Berlin.
● Oakridge National Laboratory (2007), US Electricity Markets: Design and Operation, presentation at the IEA Workshop Trading and Transmission of Renewable Electricity: a Roundtable, October 10th, Berlin, www.iea.org/Textbase/work/2007/renewable_electricity/Kirby.pdf.
● PJM (PJM Interconnection) (2008), PJM Energy Market website, accessed March 18th. www.pjm.com/markets/demand-response/energy-market.html.
● Powertech Labs (2008), An assessment of variable characteristics of the Pacific Northwest Region’s wave and tidal current power resources, and their interaction with electricity demand and implications for large scale development scenarios for the region – Phase 1. Report No. 17458-21, J. Khan, G. Bhuyan, A. Moshref, and K. Morison., January.

30
● REIL (Renewable Energy and International Law) (2007), Meeting the Challenges of Integrating Renewable Energy into Competitive Electricity Industries. H. Outhred, S. Bull, R. Howse, May.
● Schwaegerl, C. et al., (2007), International perspectives on demand side integration, Paper presented at the CIRED 19th International Conference on Electricity Distribution, May, Vienna.
● Siemens (2007), Prospects of Smart Grid Technologies for a Sustainable and Secure Power Supply, paper presented at the 20th World Energy Congress by W. Breuer et al., November. 11-15, Rome.
● Stern, N. (2006), Speech following publication of the Stern Review, 30th October, www.hm-treasury.gov.uk/independent_reviews/stern_review_economics_climate_change/stern_review_report.cfm .
● Terna (2007), Bridging the Mediterranean. International Interconnections: Tunisia, Italy, Croatia, presentation at the IEA Workshop Trading and Transmission of Renewable Electricity: a Roundtable, October 10th, Berlin, www.iea.org/Textbase/work/2007/renewable_electricity/Rebolini.pdf .
● UWIG (Utility Wind Integration Group) (2007), J. C. Smith, M. R. Milligan, E.A. DeMeo, B. Parsons, “Utility Wind Integration and Operating Impact State of the Art”, IEEE Transactions on Power Systems, Vol. 22, No. 3,pp. 900 – 908, August.

International Energy Agency
www. i ea .o rg /books
International Energy Agency9, rue de la Fédération75739 Paris Cedex 15, France
CUSTOMERS INNORTH AMERICA
Turpin DistributionThe Bleachery143 West Street, New MilfordConnecticut 06776, USAToll free: +1 (800) 456 6323Fax: +1 (860) 350 [email protected]
You may also send
your order
to your nearest
OECD sales point
or use
the OECD online
services:
www.oecdbookshop.org
CUSTOMERS INTHE REST OF THE WORLD
Turpin Distribution Services ltdStratton Business Park,
Pegasus Drive, Biggleswade,Bedfordshire SG18 8QB, UK
Tel.: +44 (0) 1767 604960Fax: +44 (0) 1767 604640
IEA BOOKSTel: +33 (0)1 40 57 66 90Fax: +33 (0)1 40 57 67 75
E-mail: [email protected]
All IEA publications may be boughtonline on the IEA website:
You may also obtain PDFs of all IEA books at 20% discount.
Books published before January 2007- with the exception of the statistics publications -
can be downloaded in PDF, free of chargefrom the IEA website.
The Online Bookshop

IEA Publications9, rue de la Fédération75739 Paris Cedex 15
Printed in France by the IEAJuly 2008
Cover design: IEA - Photo credit: © ImageState / GraphicObsession

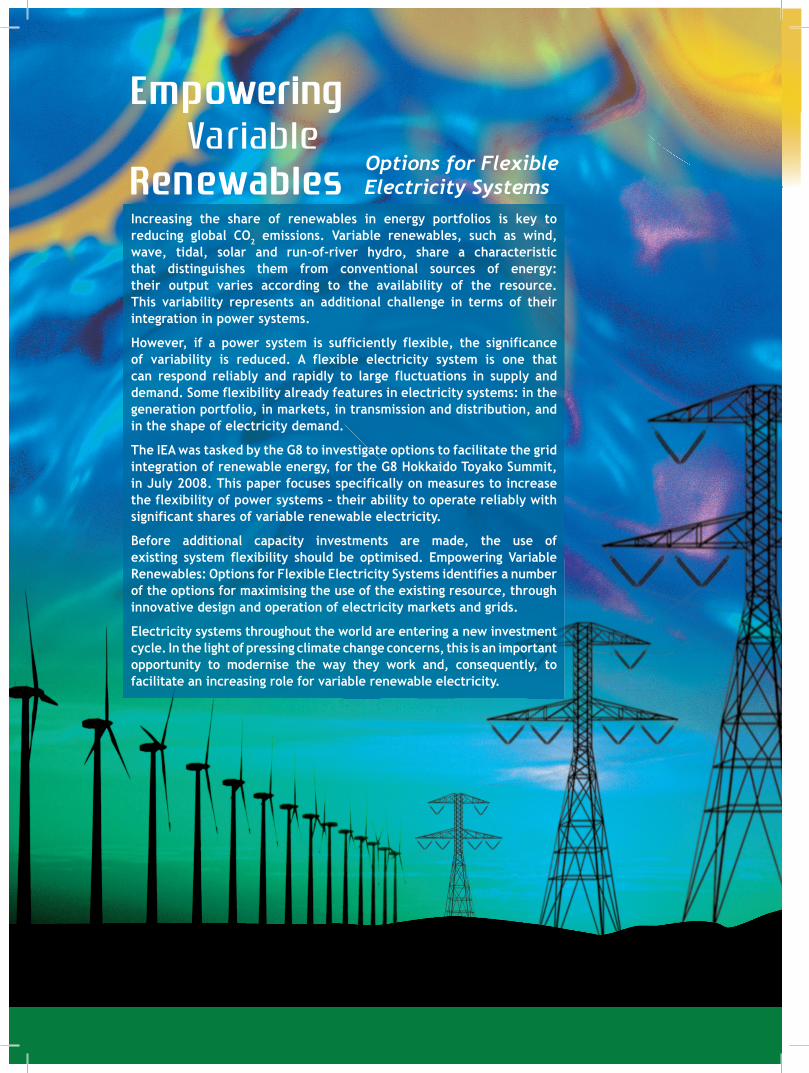
Increasing the share of renewables in energy portfolios is key to reducing global CO2 emissions. Variable renewables, such as wind, wave, tidal, solar and run-of-river hydro, share a characteristic that distinguishes them from conventional sources of energy: their output varies according to the availability of the resource.This variability represents an additional challenge in terms of their integration in power systems.
However, if a power system is sufficiently flexible, the significance of variability is reduced. A flexible electricity system is one that can respond reliably and rapidly to large fluctuations in supply and demand. Some flexibility already features in electricity systems: in the generation portfolio, in markets, in transmission and distribution, and in the shape of electricity demand.
The IEA was tasked by the G8 to investigate options to facilitate the grid integration of renewable energy, for the G8 Hokkaido Toyako Summit, in July 2008. This paper focuses specifically on measures to increase the flexibility of power systems – their ability to operate reliably with significant shares of variable renewable electricity.
Before additional capacity investments are made, the use of existing system flexibility should be optimised. Empowering Variable Renewables: Options for Flexible Electricity Systems identifies a number of the options for maximising the use of the existing resource, through innovative design and operation of electricity markets and grids.
Electricity systems throughout the world are entering a new investment cycle. In the light of pressing climate change concerns, this is an important opportunity to modernise the way they work and, consequently, to facilitate an increasing role for variable renewable electricity.
Options for Flexible Electricity Systems
Em p oweringEm p oweringVariable
Ren ewablesRen ewables