IE 618: Engineering Cost and Production Economics …caudill/IE 618_Spring 2014_Homework 3 and...
8
IE 618: Engineering Cost and Production Economics Spring 2014 Homework 3&4 Solutions Chapter 13: 1. MCE = Process time/(Process time + Move time + Wait time) = 30 minutes/60 minutes = 0.50 2. Cycle time = 1/Velocity = 1/60 hr., or 1 minute 3. The time now required to produce 60 units is 45 minutes (30 minutes process time + move and wait time of 15 minutes). Thus, velocity = 60/(3/4 hr.) = 80 units per hour; cycle time = 1/80 hr., or 0.75 minute. Finally, MCE = 30/(30 + 15)= 0.67. Chapter 14: 1. Prevention costs: Quality training Appraisal costs: Product inspection and materials inspection Internal failure costs: Scrap and rework External failure costs: Warranty 2. Preceding year—Total quality costs: $2,000,000; percentage of sales: 20 percent ($2,000,000/$10,000,000). Current year—Total quality costs: $1,545,000; percentage of sales: 15.45 percent ($1,545,000/$10,000,000). Profit has increased by $455,000. If quality costs drop to 2.5 percent of sales, another $1,295,000 of profit improvement is possible ($1,545,000 – $250,000). Chapter 15: 1. Partial measures: 2009 2010 Materials 10,000/8,000 = 1.25 12,000/8,400 = 1.43 Labor 10,000/5,000 = 2.00 12,000/4,800 = 2.50 Power 10,000/2,000 = 5.00 12,000/3,000 = 4.00 Profile analysis indicates that productive efficiency has increased for materials and labor and decreased for power. The outcome is mixed, and no statement about overall productivity improvement can be made without valuing the trade-off. 2. Income statements: 2009 2010 Sales $200,000 $240,000 Cost of inputs 102,000 124,200 Gross profit $ 98,000 $115,800 Total change in profits: $115,800 – $98,000 = $17,800 increase
Transcript of IE 618: Engineering Cost and Production Economics …caudill/IE 618_Spring 2014_Homework 3 and...

IE 618: Engineering Cost and Production Economics Spring 2014 Homework 3&4 Solutions
Chapter 13:
1. MCE = Process time/(Process time + Move time + Wait time) = 30 minutes/60 minutes = 0.50
2. Cycle time = 1/Velocity = 1/60 hr., or 1 minute 3. The time now required to produce 60 units is 45 minutes (30 minutes process time + move and wait time of 15 minutes). Thus, velocity = 60/(3/4 hr.) = 80 units per hour; cycle time = 1/80 hr., or 0.75 minute. Finally, MCE = 30/(30 + 15)= 0.67. Chapter 14:
1. Prevention costs: Quality training Appraisal costs: Product inspection and materials inspection Internal failure costs: Scrap and rework External failure costs: Warranty
2. Preceding year—Total quality costs: $2,000,000; percentage of sales: 20 percent ($2,000,000/$10,000,000). Current year—Total quality costs: $1,545,000; percentage of sales: 15.45 percent ($1,545,000/$10,000,000). Profit has increased by $455,000. If quality costs drop to 2.5 percent of sales, another $1,295,000 of profit improvement is possible ($1,545,000 – $250,000).
Chapter 15:
1. Partial measures: 2009 2010
Materials 10,000/8,000 = 1.25 12,000/8,400 = 1.43 Labor 10,000/5,000 = 2.00 12,000/4,800 = 2.50 Power 10,000/2,000 = 5.00 12,000/3,000 = 4.00
Profile analysis indicates that productive efficiency has increased for materials and labor and decreased for power. The outcome is mixed, and no statement about overall productivity improvement can be made without valuing the trade-off.
2. Income statements: 2009 2010
Sales $200,000 $240,000 Cost of inputs 102,000 124,200 Gross profit $ 98,000 $115,800
Total change in profits: $115,800 – $98,000 = $17,800 increase

3. Profit-linked measurement: (1) (2) (3) (4) (2) – (4)
Input PQ* PQ×P AQ AQ×P (PQ×P) – (AQ×P) Materials 9,600 $ 76,800 8,400 $ 67,200 $ 9,600 Labor 6,000 60,000 4,800 48,000 12,000 Power 2,400 7,200 3,000 9,000 (1,800) Totals $ 144,000 $ 124,200 $ 19,800
*Materials: 12,000/1.25; Labor: 12,000/2; Power: 12,000/5. The value of the increases in efficiency for materials and labor more than offsets the increased usage of power. Thus, the productivity improvement program should be labeled successful. 4. Price recovery:
Price-recovery component = Total profit change – Profit-linked productivity change Price-recovery component = $17,800 – $19,800
= ($2,000)
This says that without the productivity improvement, profits would have declined by $2,000. The $40,000 increase in revenues would not have offset the increase in the cost of inputs. From the solution to Requirement 3, the cost of inputs without a productivity increase would have been $144,000 (column 2). The increase in the input cost without productivity would have been $144,000 – $102,000 = $42,000. This is $2,000 more than the increase in revenues. Only because of the productivity increase did the firm show an increase in profitability. Chapter 16:
1. Production rate: X: 60 minutes/10 minutes = 6 units per hour Y: 60 minutes/12 minutes = 5 units per hour Z: 60 minutes/15 minutes = 4 units per hour
2. Unit cost under features and characteristics costing: X: $5 + ($22/6) = $8.67 Y: $5 + ($22/5) = $9.4 Z: $5 + ($22/4) = $10.5
3. Unit cost under traditional costing approach:
X: $5 + (10 + 20)/60 × $22 = $16 Y: $5 + (12 + 15)/60 × $22 = $14.9 Z: $5 + (15 + 17)/60 × $22 = $16.7

Chapter 17: 1. The break-even point is as follows:
Units = Fixed costs/(Price – Unit variable cost) = $64,000/($20 – $12) = $64,000/$8 = 8,000
2. The number of units that must be sold to earn a profit of $30,000 is as follows: Units = ($64,000 + $30,000)/$8 = $94,000/$8 = 11,750
3. The contribution margin ratio is $8/$20 = 0.40. With additional sales of $25,000, the additional profit would be 0.40 × $25,000 = $10,000.
4. To find the number of units sold for a profit equal to 20 percent of sales, let target income equal (0.20)(Price × Units) and solve for units.
Operating income = (Price × Units) – (Unit variable cost × Units) – Fixed costs (0.2)($20)Units = ($20 × Units) – ($12 × Units) – $64,000
$4 × Units = $64,000 Units = 16,000
The income statement is as follows:
Sales (16,000 × $20) $320,000 Less: Variable expenses (16,000 × $12) 192,000 Contribution margin $128,000 Less: Fixed expenses 64,000 Operating income $ 64,000
Operating income/Sales = $64,000/$320,000 = 0.20, or 20%
5. The margin of safety is 10,000 – 8,000 = 2,000 units, or $40,000 in sales revenues

Chapter 19: 1. Year 1 Year 2 Year 3 Year 4 Year 5 Prime cost $125,000 $ 600,000 $1,640,000 $1,640,000 $ 526,500 Setup cost 5,000 9,600 80,000 80,000 12,000 Depreciation on special equipment 13,000 13,000 13,000 13,000 13,000 Expediting — 15,000 40,000 35,000 — Rework 12,500 45,000 60,000 60,000 6,750 Other overhead 50,000 300,000 800,000 800,000 270,000
Total COGS $205,500 $ 982,600 $2,633,000 $2,628,000 $ 828,250 Divided by units ÷ 25,000 ÷150,000 ÷ 400,000 ÷ 400,000 ÷135,000
Unit COGS $ 8.22 $ 6.55 $ 6.58 $ 6.57 $ 6.14 2. Year 1 Year 2 Year 3 Year 4 Year 5 Warranty repair $ 6,250 $ 7,500 $ 10,000 $ 10,000 $ 3,375 Commissions (5%) 18,750 150,000 400,000 360,000 101,250 Advertising 250,000 150,000 100,000 100,000 25,000 Total marketing expenses $275,000 $ 307,500 $ 510,000 $470,000 $ 129,625 Divided by units ÷ 25,000 ÷150,000 ÷400,000 ÷400,000 ÷135,000 Unit marketing expense $ 11.00 $ 2.05 $ 1.28 $ 1.18 $ 0.96 3. Year 1 Year 2 Year 3 Year 4 Year 5 Sales $ 375,000 $3,000,000 $8,000,000 $7,200,000 $2,025,000 Less: COGS 205,500 982,600 2,633,000 2,628,000 828,250 Gross profit $ 169,500 $2,017,400 $5,367,000 $4,572,000 $1,196,750 Less: Marketing expenses 275,000 307,500 510,000 470,000 129,625 Operating income (loss) $(105,500) $1,709,900 $4,857,000 $4,102,000 $1,067,125 Five-year operating income $11,630,525 Less: Design and development expenses 300,000 Excess of revenue over all costs $11,330,525 Yes, the Mixalot was profitable over the five-year cycle, even after the design and development expenses were subtracted. Note that these expenses do not appear on the operating income statement required for external reporting.

4. The initial price set for the Mixalot was $15. This is the lowest price of those charged during the five-year period. It appears that Melcher Company was using a penetration pricing strategy for the Mixalot. This makes sense given that the Mixalot was not a radically new product; that is, there were other appliances on the market that could do what the Mixalot could do. There were blenders to mix milkshakes, knives and chopping boards to cut up vegetables, and food processors to mix and chop. Melcher Company needed to get the Mixalot out into actual kitchens to build demand. Notice, too, the large marketing expenditures in the first year to create awareness. This also helps to support price increases down the line. Finally, by the fifth year, the Mixalot is in the declining stage of the product life cycle. Probably other companies have begun producing competing products, and the number of new Mixalots demanded has declined. Chapter 20:

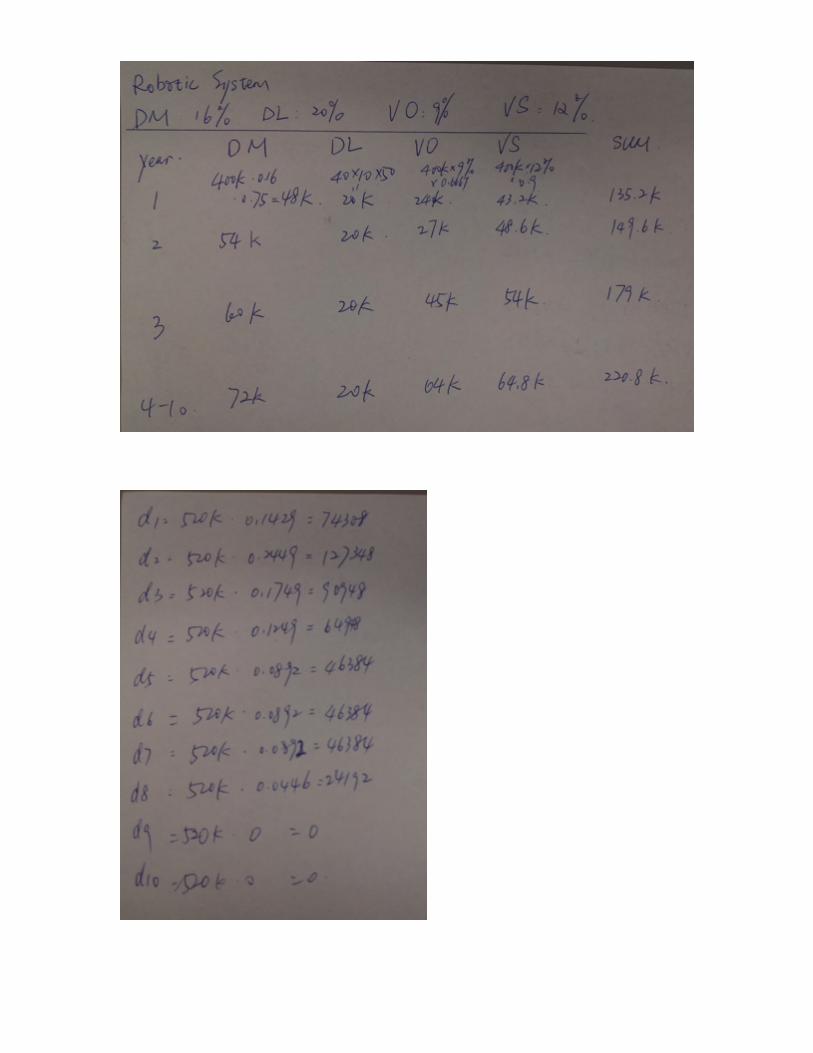

Since NPV for Robotic System is higher than the NPV for the Manual System at i=MARR, choose the Robotic System.