IDSP- Jalpaiguri Annual Report -2011-jalpaigurihealth.com/upload/download/7IDSP Annual Report...
24
IDSP: Annual Report-2011 Page 0 IDSP- Jalpaiguri Annual Report -2011- Report Produced by: IDSP Unit, CMOH Office, Jalpaiguri
Transcript of IDSP- Jalpaiguri Annual Report -2011-jalpaigurihealth.com/upload/download/7IDSP Annual Report...

IDSP: Annual Report-2011 Page 0
IDSP- Jalpaiguri
Annual Report
-2011-
Report Produced by:
IDSP Unit,
CMOH Office, Jalpaiguri
IDSP: Annual Report-2011 Page 1
Contents
Page No.
A. Disease Scenario
1. Water Borne Diseases …. 2-9 (Acute Diarrhoeal Disease, Bacillary Dysentery, Enteric
Fever, Viral Hepatitis)
2. ARI/ ILI…………………….. 10-11
3. Measles & Chicken Pox……. 12-14
4. Malaria……………………. … 15-17
5. AES/JE ……………………… 18-19
B. Outbreak……….……………… 20-21
C. IDSP Training……………………… 22
D. Sharing of IDSP Report……………. 22
E. Reporting Status…………………… 23

IDSP: Annual Report-2011 Page 2
1. Water Borne Diseases
A. Acute Diarrhoeal Disease including AGE in 2011
Sl.
No.
Name of the
Blocks/
Institutions
Acute Diarrhoeal Disease including AGE as reported in
‘P’ form
No. of cases Case load (%) Incidence
1. Sadar 16302 12.19 51.01
2. Rajganj 12629 9.44 39.09
3. Maynaguri 25785 19.28 80.45
4. Dhupguri 12089 9.04 25.39
5. Mal 7300 5.46 24.18
6. Meteli 3344 2.50 27.75
7. Nagrakata 4221 3.16 32.01
8. Falakata 9279 6.94 32.08
9. Madarihat 7495 5.6 35.52
10. Kalchini 3660 2.74 12.74
11. APD-I 6471 4.84 28.84
12. APD-II 7879 5.87 35.01
13. Kumargram 5139 3.84 25.37
14. District Hosital 8802 6.58
15. Alipurduar SDH 952 0.71
16. Mal SDH 2407 1.80
TOTAL 133754 100.00 36.58
IDSP: Annual Report-2011 Page 3
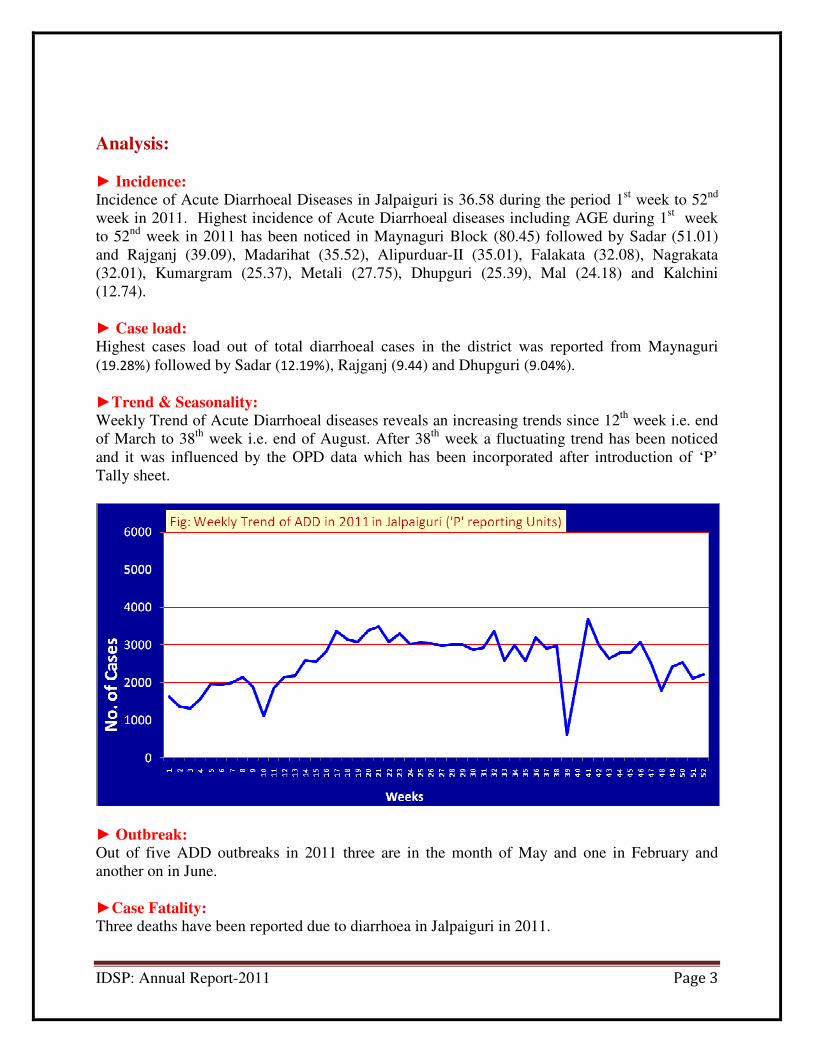
Analysis:
► Incidence:
Incidence of Acute Diarrhoeal Diseases in Jalpaiguri is 36.58 during the period 1st week to 52
nd
week in 2011. Highest incidence of Acute Diarrhoeal diseases including AGE during 1st week
to 52nd
week in 2011 has been noticed in Maynaguri Block (80.45) followed by Sadar (51.01)
and Rajganj (39.09), Madarihat (35.52), Alipurduar-II (35.01), Falakata (32.08), Nagrakata
(32.01), Kumargram (25.37), Metali (27.75), Dhupguri (25.39), Mal (24.18) and Kalchini
(12.74).
► Case load:
Highest cases load out of total diarrhoeal cases in the district was reported from Maynaguri
(19.28%) followed by Sadar (12.19%), Rajganj (9.44) and Dhupguri (9.04%).
►Trend & Seasonality:
Weekly Trend of Acute Diarrhoeal diseases reveals an increasing trends since 12th
week i.e. end
of March to 38th
week i.e. end of August. After 38th
week a fluctuating trend has been noticed
and it was influenced by the OPD data which has been incorporated after introduction of ‘P’
Tally sheet.
► Outbreak:
Out of five ADD outbreaks in 2011 three are in the month of May and one in February and
another on in June.
►Case Fatality:
Three deaths have been reported due to diarrhoea in Jalpaiguri in 2011.
IDSP: Annual Report-2011 Page 4
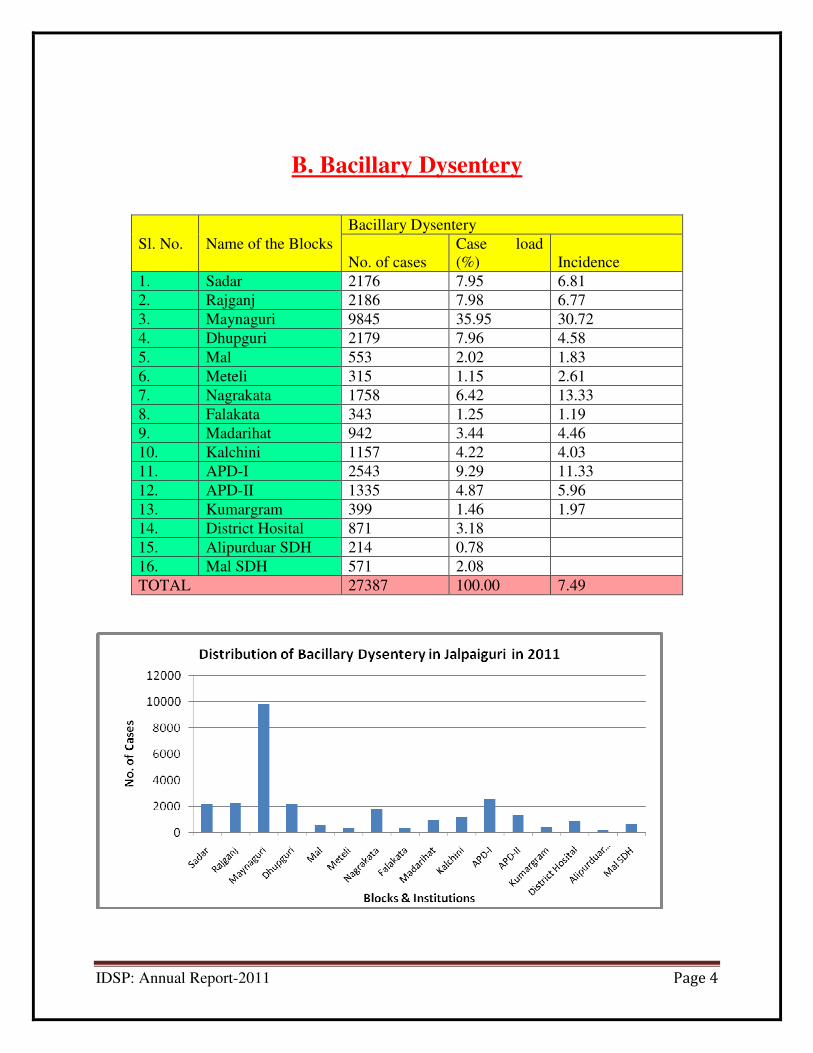
B. Bacillary Dysentery
Sl. No.
Name of the Blocks
Bacillary Dysentery
No. of cases
Case load
(%) Incidence
1. Sadar 2176 7.95 6.81
2. Rajganj 2186 7.98 6.77
3. Maynaguri 9845 35.95 30.72
4. Dhupguri 2179 7.96 4.58
5. Mal 553 2.02 1.83
6. Meteli 315 1.15 2.61
7. Nagrakata 1758 6.42 13.33
8. Falakata 343 1.25 1.19
9. Madarihat 942 3.44 4.46
10. Kalchini 1157 4.22 4.03
11. APD-I 2543 9.29 11.33
12. APD-II 1335 4.87 5.96
13. Kumargram 399 1.46 1.97
14. District Hosital 871 3.18
15. Alipurduar SDH 214 0.78
16. Mal SDH 571 2.08
TOTAL 27387 100.00 7.49

IDSP: Annual Report-2011 Page 5
Analysis:
► Incidence: Incidence Rate of Bacillary Dysentery in Jalpaiguri was 7.49 during the period 1st
week to 52nd
week in 2011. Incidence of Bacillary Dysentery is highest in Maynaguri (30.72)
followed by Nagrakata (13.33), Alipurduar-I (11.33), Sadar (6.81), Rajganj (6.77) and
Alipuduar-II (5.96).
► Case load: In 2011 case load of Bacillary Dysentery was highest in Maynaguri (35.95)
followed by Rajganj (7.98), Dhupguri (7.96) and Sadar (7.95).
►Trend & Seasonality:
A fluctuating trend of Bacillary Dysentery has been noticed throughout the year however,
increasing trend noticed since 12th
week to 32nd
week in 2011. After 38th
week the trend is
influenced by newly introduced OPD data.

IDSP: Annual Report-2011 Page 6
C. Enteric Fever
Sl. No. Name of the
Blocks
Enteric Fever
No. of cases Case load (%) Incidence
1 Sadar 11 0.58 0.03
2 Rajganj 44 2.33 0.14
3 Maynaguri 355 18.76 1.11
4 Dhupguri 254 13.42 0.53
5 Mal 235 12.42 0.78
6 Meteli 73 3.86 0.61
7 Nagrakata 164 8.67 1.24
8 Falakata 212 11.21 0.73
9 Madarihat 8 0.42 0.04
10 Kalchini 0 0.00 0.00
11 APD-I 79 4.18 0.35
12 APD-II 114 6.03 0.51
13 Kumargram 8 0.42 0.04
14. District Hosital 207 10.94
15. Alipurduar SDH 100 5.29
16. Mal SDH 28 1.48
TOTAL 1892 100.00 0.52
IDSP: Annual Report-2011 Page 7
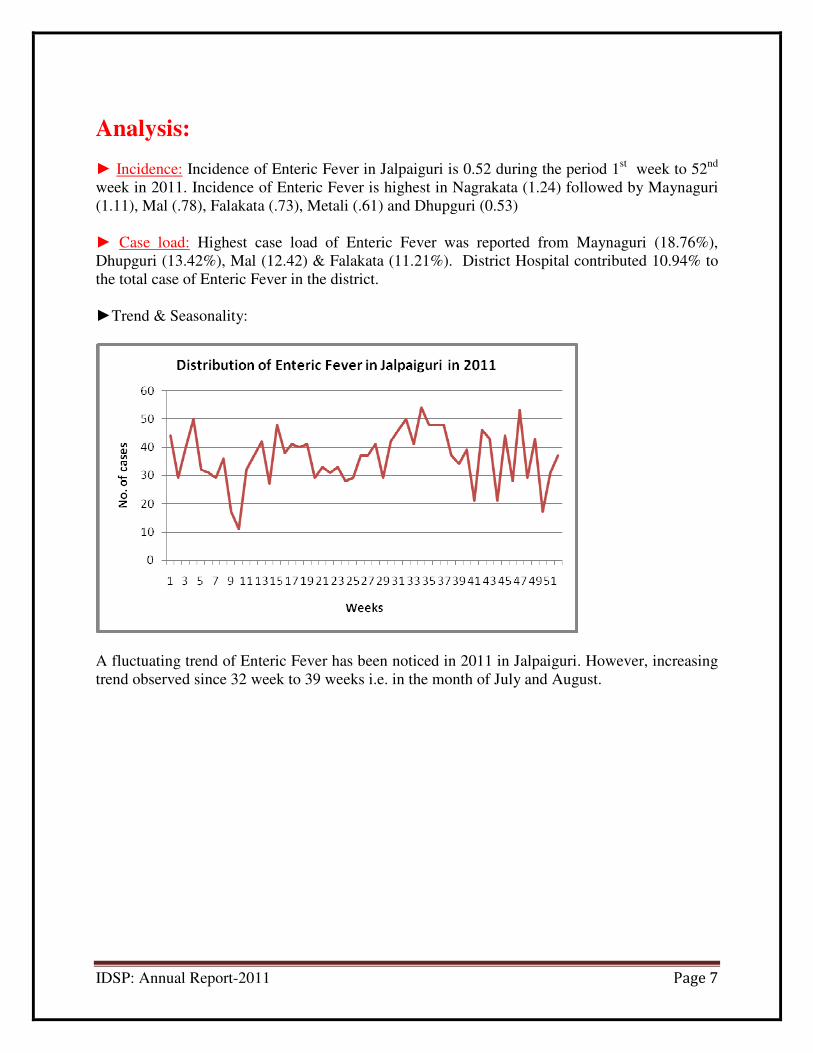
Analysis:
► Incidence: Incidence of Enteric Fever in Jalpaiguri is 0.52 during the period 1st week to 52
nd
week in 2011. Incidence of Enteric Fever is highest in Nagrakata (1.24) followed by Maynaguri
(1.11), Mal (.78), Falakata (.73), Metali (.61) and Dhupguri (0.53)
► Case load: Highest case load of Enteric Fever was reported from Maynaguri (18.76%),
Dhupguri (13.42%), Mal (12.42) & Falakata (11.21%). District Hospital contributed 10.94% to
the total case of Enteric Fever in the district.
►Trend & Seasonality:
A fluctuating trend of Enteric Fever has been noticed in 2011 in Jalpaiguri. However, increasing
trend observed since 32 week to 39 weeks i.e. in the month of July and August.
IDSP: Annual Report-2011 Page 8
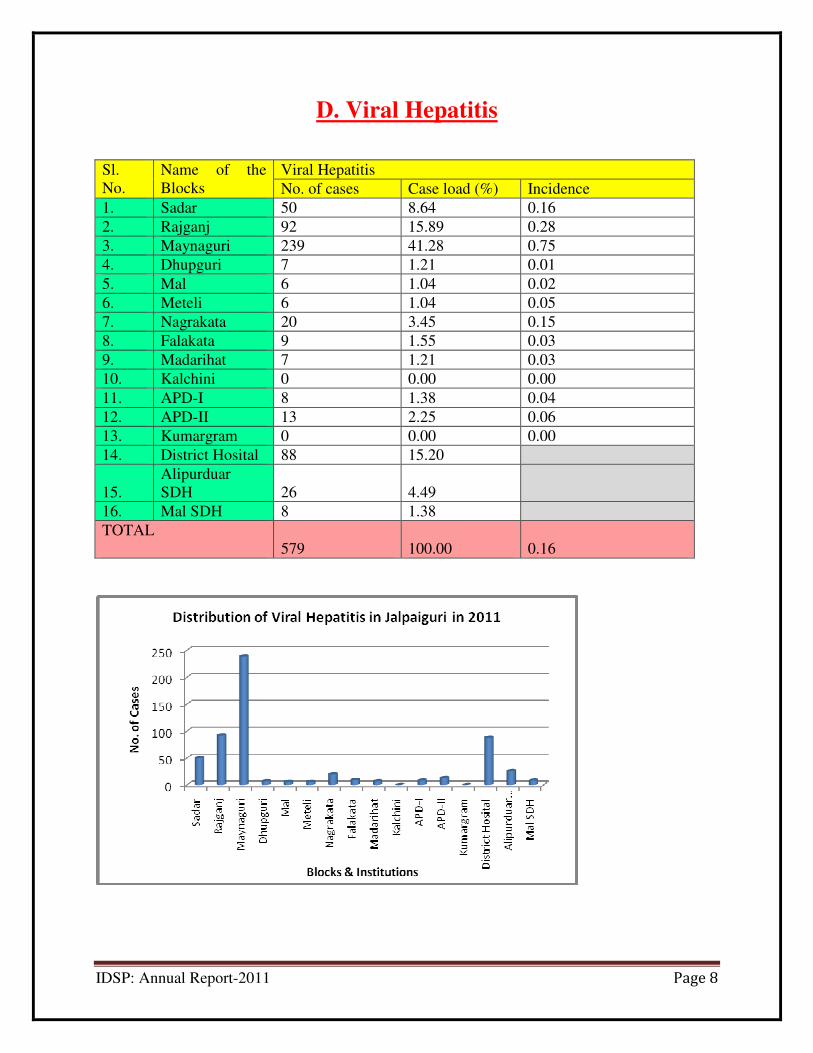
D. Viral Hepatitis
Sl.
No.
Name of the
Blocks
Viral Hepatitis
No. of cases Case load (%) Incidence
1. Sadar 50 8.64 0.16
2. Rajganj 92 15.89 0.28
3. Maynaguri 239 41.28 0.75
4. Dhupguri 7 1.21 0.01
5. Mal 6 1.04 0.02
6. Meteli 6 1.04 0.05
7. Nagrakata 20 3.45 0.15
8. Falakata 9 1.55 0.03
9. Madarihat 7 1.21 0.03
10. Kalchini 0 0.00 0.00
11. APD-I 8 1.38 0.04
12. APD-II 13 2.25 0.06
13. Kumargram 0 0.00 0.00
14. District Hosital 88 15.20
15.
Alipurduar
SDH 26 4.49
16. Mal SDH 8 1.38
TOTAL
579 100.00 0.16
IDSP: Annual Report-2011 Page 9
Analysis:
► Incidence:
Incidence of Viral Hepatitis in Jalpaiguri is 0.16 during the period 1st week to 52
nd week in 2011.
Highest incidence of Viral Hepatitis has been reported from Maynaguri (0.75) followed Rajganj
(.28) and Sadar (.16).
► Case load:
Highest case load is from Maynaguri (41.28%) followed by Rajganj (15.89%), District Hospital
(15.20%) and Sadar (8.64%).
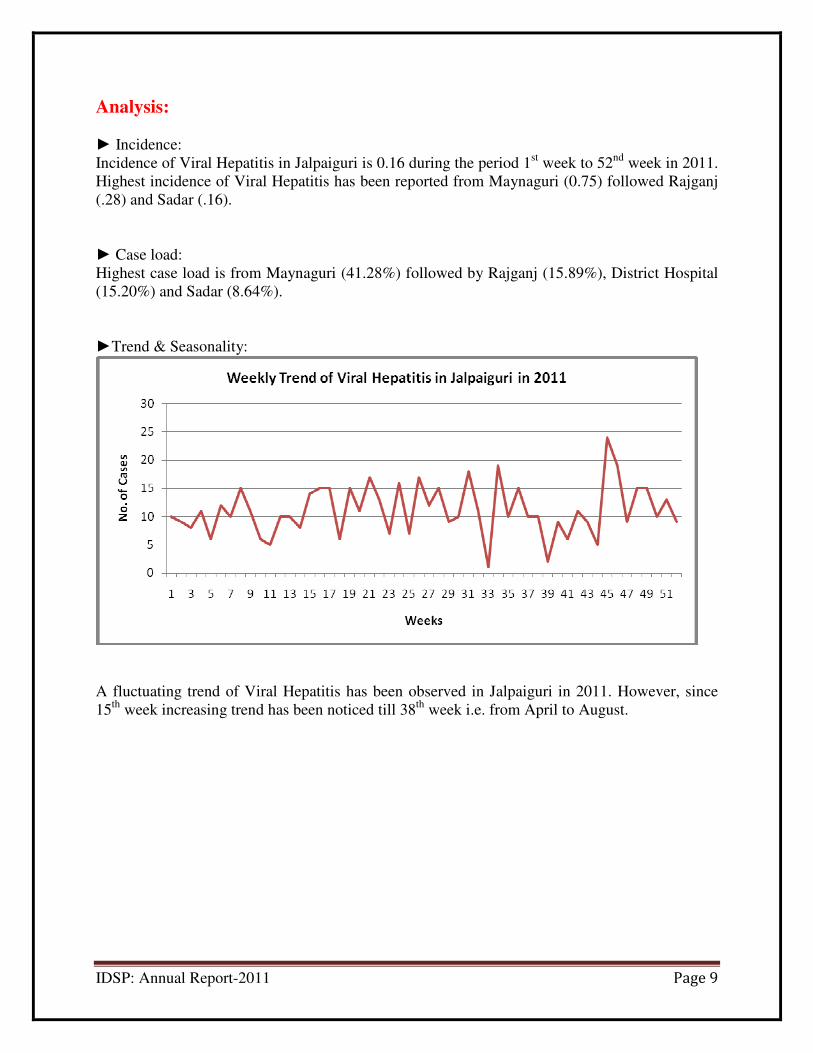
►Trend & Seasonality:
A fluctuating trend of Viral Hepatitis has been observed in Jalpaiguri in 2011. However, since
15th
week increasing trend has been noticed till 38th
week i.e. from April to August.
IDSP: Annual Report-2011 Page 10
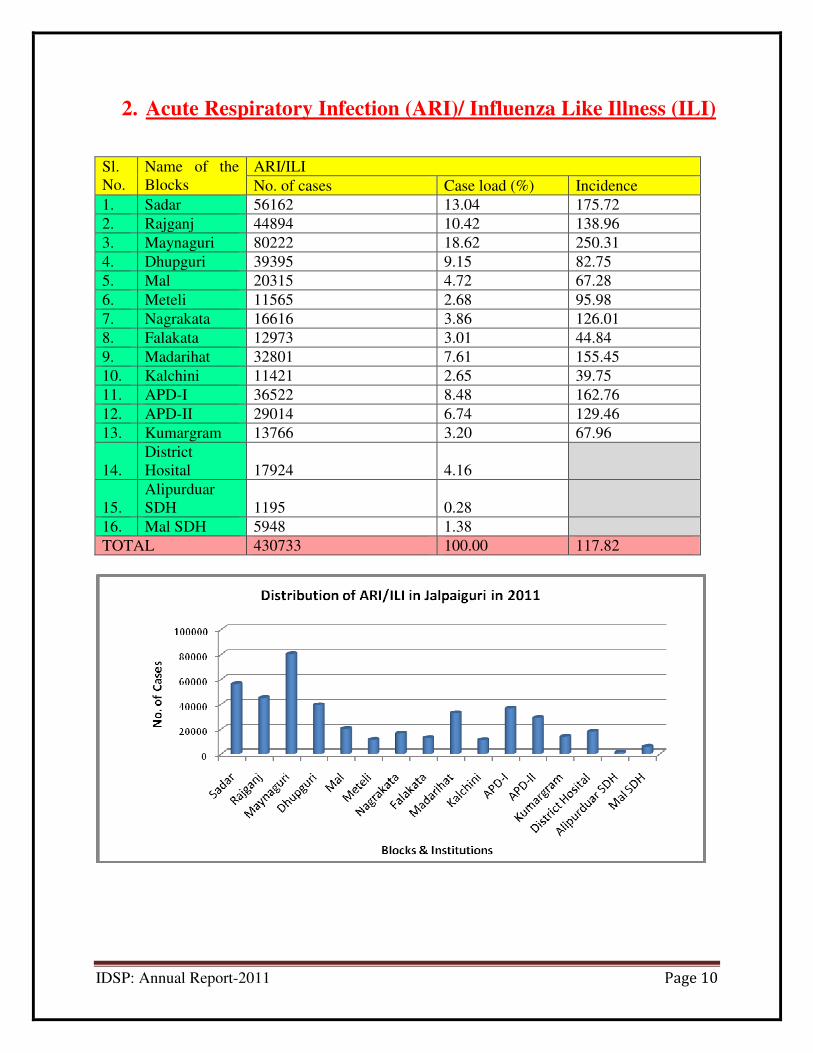
2. Acute Respiratory Infection (ARI)/ Influenza Like Illness (ILI)
Sl.
No.
Name of the
Blocks
ARI/ILI
No. of cases Case load (%) Incidence
1. Sadar 56162 13.04 175.72
2. Rajganj 44894 10.42 138.96
3. Maynaguri 80222 18.62 250.31
4. Dhupguri 39395 9.15 82.75
5. Mal 20315 4.72 67.28
6. Meteli 11565 2.68 95.98
7. Nagrakata 16616 3.86 126.01
8. Falakata 12973 3.01 44.84
9. Madarihat 32801 7.61 155.45
10. Kalchini 11421 2.65 39.75
11. APD-I 36522 8.48 162.76
12. APD-II 29014 6.74 129.46
13. Kumargram 13766 3.20 67.96
14.
District
Hosital 17924 4.16
15.
Alipurduar
SDH 1195 0.28
16. Mal SDH 5948 1.38
TOTAL 430733 100.00 117.82
IDSP: Annual Report-2011 Page 11
Analysis:
► Incidence: Incidence of ARI/ILI is 117.82 per 1000 population in Jalpaiguri in 2011.
Highest incidence is reported from Maynaguri (250.31) followed by Sadar (175.72), APD-I
(162.76), Madarihat (155.45), Rajganj (138.96), APD-II (129.46), Nagrakata (126.01).
► Case load:
Case load was highest in Maynaguri (18.62%) followed by Sadar (13.04%), Rajganj(10.42%),
Dhupguri (9.15%) and APD-I (8.48%).
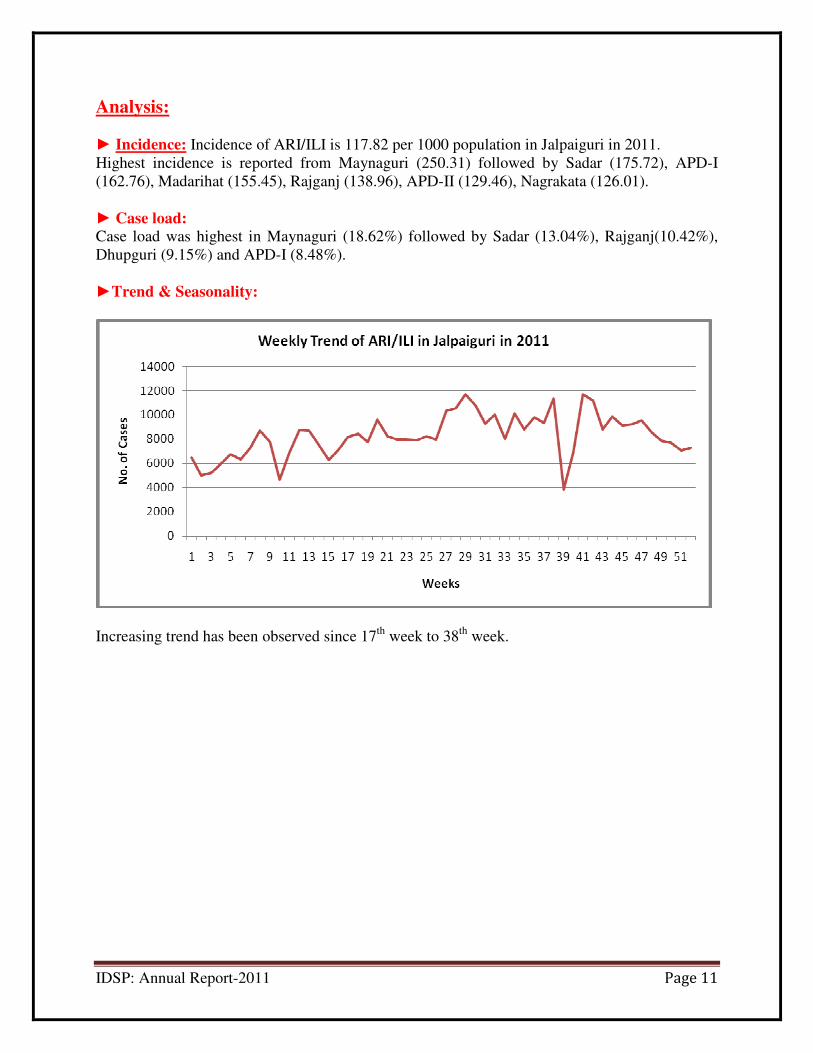
►Trend & Seasonality:
Increasing trend has been observed since 17th
week to 38th
week.
IDSP: Annual Report-2011 Page 12
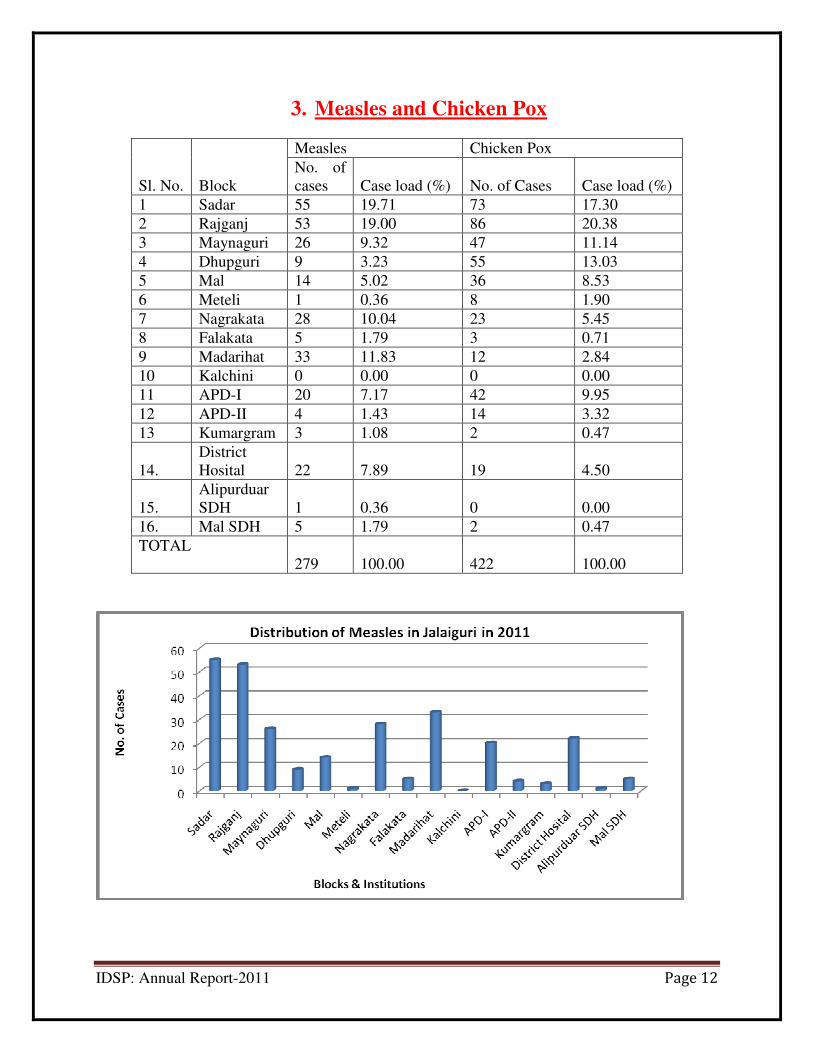
3. Measles and Chicken Pox
Sl. No. Block
Measles Chicken Pox
No. of
cases Case load (%) No. of Cases Case load (%)
1 Sadar 55 19.71 73 17.30
2 Rajganj 53 19.00 86 20.38
3 Maynaguri 26 9.32 47 11.14
4 Dhupguri 9 3.23 55 13.03
5 Mal 14 5.02 36 8.53
6 Meteli 1 0.36 8 1.90
7 Nagrakata 28 10.04 23 5.45
8 Falakata 5 1.79 3 0.71
9 Madarihat 33 11.83 12 2.84
10 Kalchini 0 0.00 0 0.00
11 APD-I 20 7.17 42 9.95
12 APD-II 4 1.43 14 3.32
13 Kumargram 3 1.08 2 0.47
14.
District
Hosital 22 7.89 19 4.50
15.
Alipurduar
SDH 1 0.36 0 0.00
16. Mal SDH 5 1.79 2 0.47
TOTAL
279 100.00 422 100.00
IDSP: Annual Report-2011 Page 13
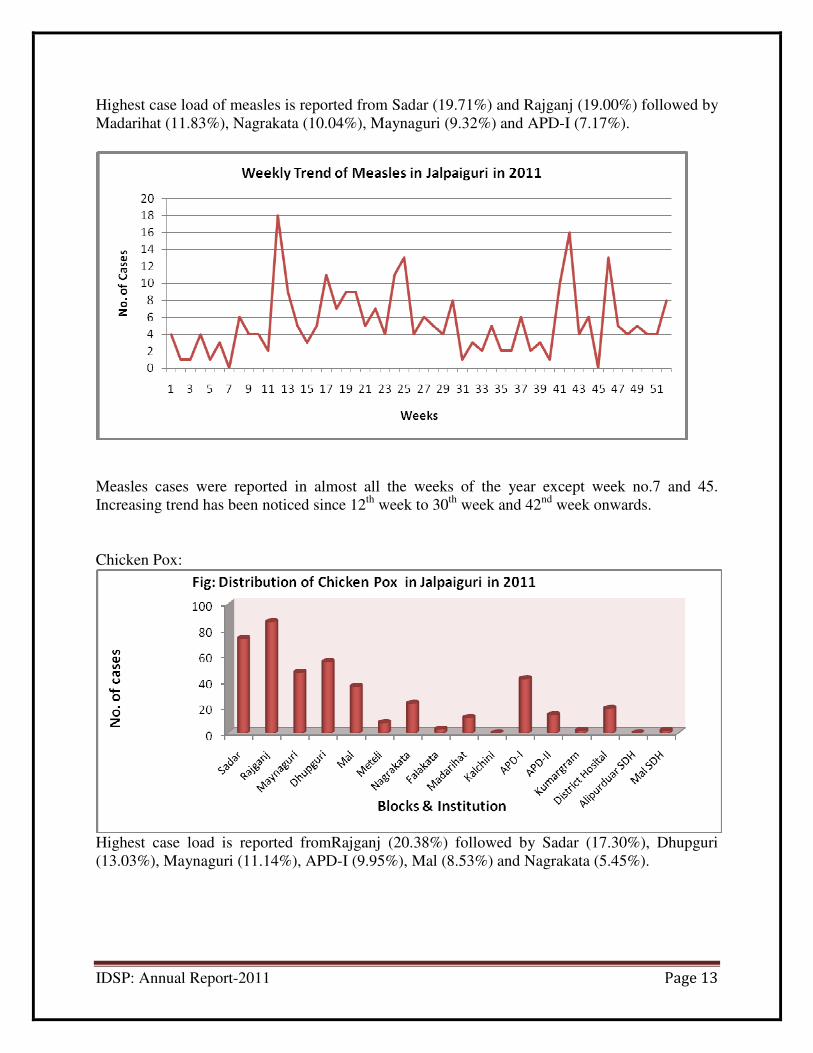
Highest case load of measles is reported from Sadar (19.71%) and Rajganj (19.00%) followed by
Madarihat (11.83%), Nagrakata (10.04%), Maynaguri (9.32%) and APD-I (7.17%).
Measles cases were reported in almost all the weeks of the year except week no.7 and 45.
Increasing trend has been noticed since 12th
week to 30th
week and 42nd
week onwards.
Chicken Pox:
Highest case load is reported fromRajganj (20.38%) followed by Sadar (17.30%), Dhupguri
(13.03%), Maynaguri (11.14%), APD-I (9.95%), Mal (8.53%) and Nagrakata (5.45%).

IDSP: Annual Report-2011 Page 14
Chicken pox was reported in all the weeks of the year. Increasing trend has been noticed since 4th
to 24th
week i.e. in late winter to late summer.
IDSP: Annual Report-2011 Page 15
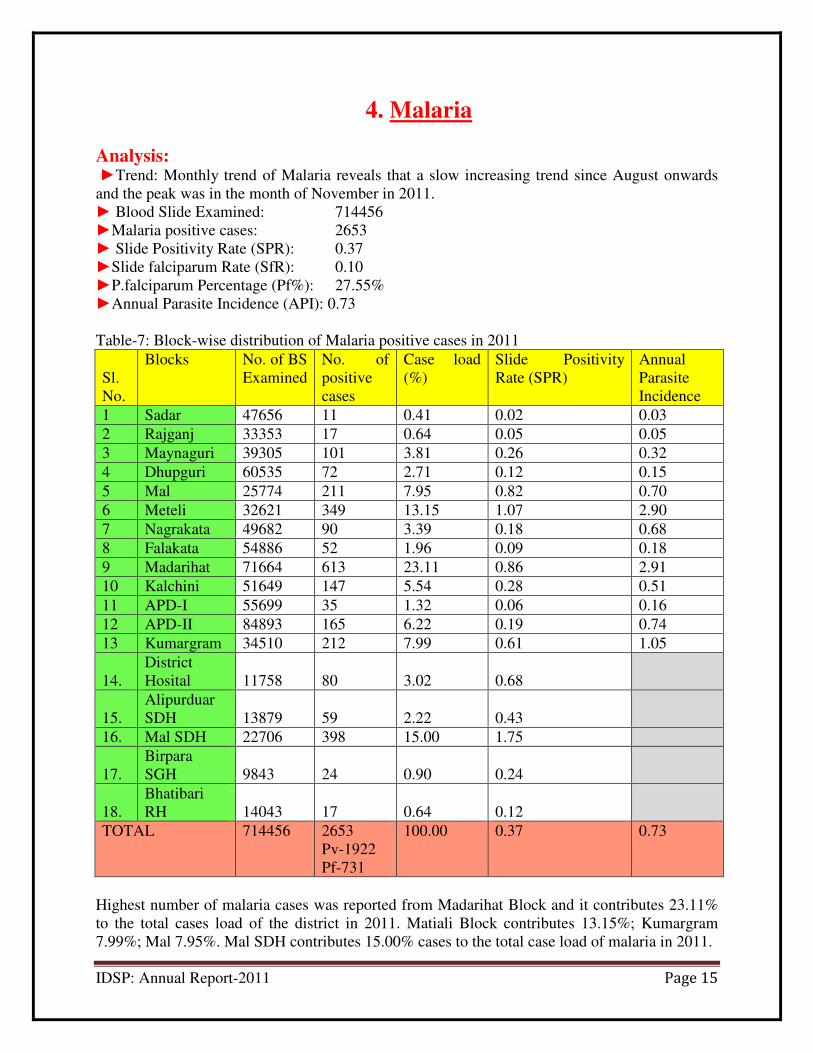
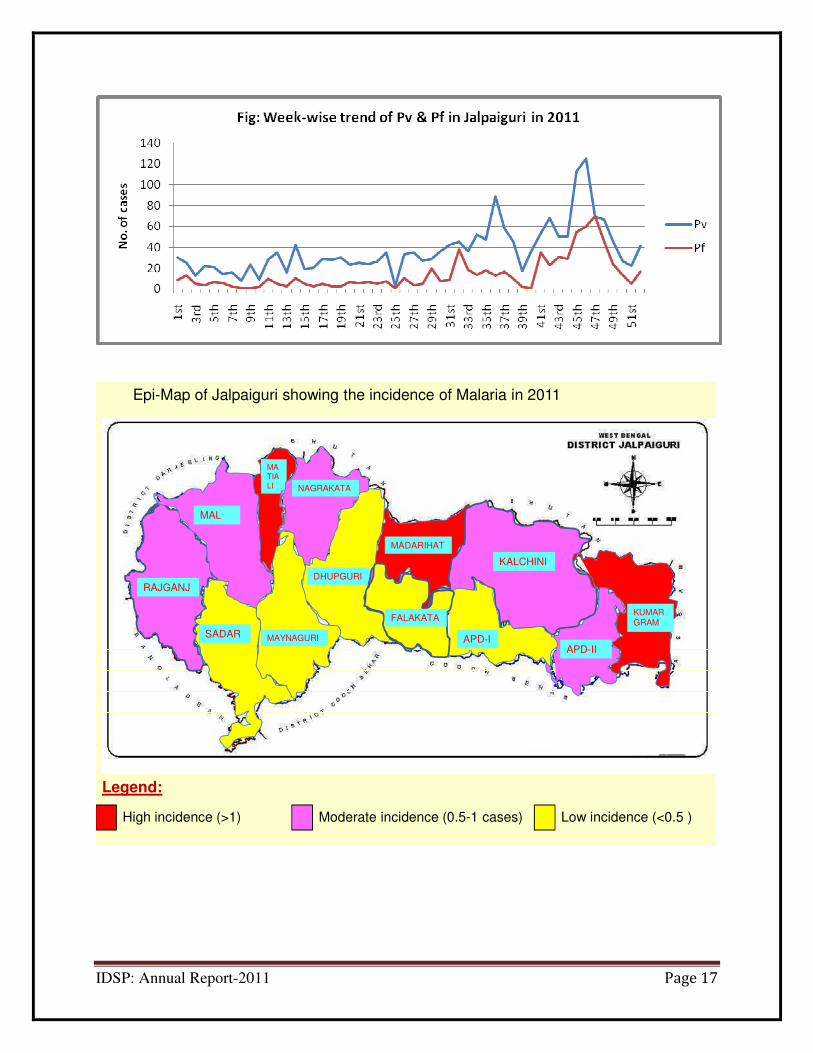
4. Malaria
Analysis: ►Trend: Monthly trend of Malaria reveals that a slow increasing trend since August onwards
and the peak was in the month of November in 2011.
► Blood Slide Examined: 714456
►Malaria positive cases: 2653
► Slide Positivity Rate (SPR): 0.37
►Slide falciparum Rate (SfR): 0.10
►P.falciparum Percentage (Pf%): 27.55%
►Annual Parasite Incidence (API): 0.73
Table-7: Block-wise distribution of Malaria positive cases in 2011
Sl.
No.
Blocks No. of BS
Examined
No. of
positive
cases
Case load
(%)
Slide Positivity
Rate (SPR)
Annual
Parasite
Incidence
1 Sadar 47656 11 0.41 0.02 0.03
2 Rajganj 33353 17 0.64 0.05 0.05
3 Maynaguri 39305 101 3.81 0.26 0.32
4 Dhupguri 60535 72 2.71 0.12 0.15
5 Mal 25774 211 7.95 0.82 0.70
6 Meteli 32621 349 13.15 1.07 2.90
7 Nagrakata 49682 90 3.39 0.18 0.68
8 Falakata 54886 52 1.96 0.09 0.18
9 Madarihat 71664 613 23.11 0.86 2.91
10 Kalchini 51649 147 5.54 0.28 0.51
11 APD-I 55699 35 1.32 0.06 0.16
12 APD-II 84893 165 6.22 0.19 0.74
13 Kumargram 34510 212 7.99 0.61 1.05
14.
District
Hosital 11758 80 3.02 0.68
15.
Alipurduar
SDH 13879 59 2.22 0.43
16. Mal SDH 22706 398 15.00 1.75
17.
Birpara
SGH 9843 24 0.90 0.24
18.
Bhatibari
RH 14043 17 0.64 0.12
TOTAL 714456 2653
Pv-1922
Pf-731
100.00 0.37 0.73
Highest number of malaria cases was reported from Madarihat Block and it contributes 23.11%
to the total cases load of the district in 2011. Matiali Block contributes 13.15%; Kumargram
7.99%; Mal 7.95%. Mal SDH contributes 15.00% cases to the total case load of malaria in 2011.
IDSP: Annual Report-2011 Page 16
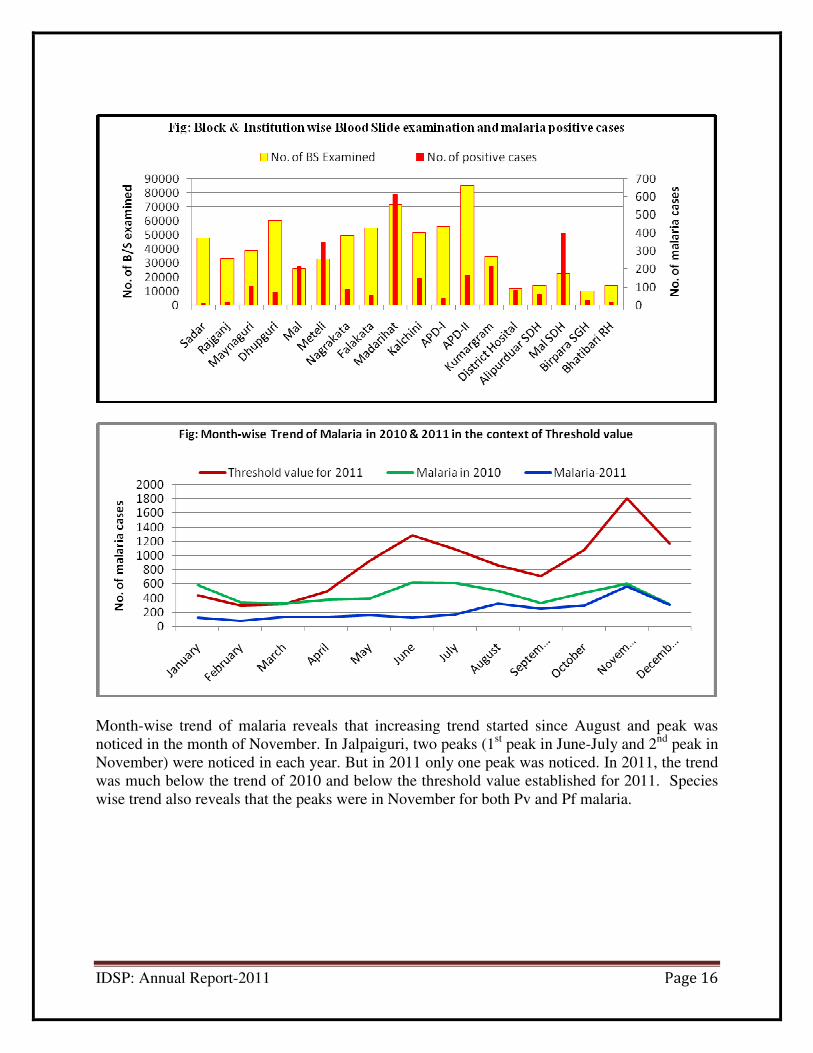
Month-wise trend of malaria reveals that increasing trend started since August and peak was
noticed in the month of November. In Jalpaiguri, two peaks (1st peak in June-July and 2
nd peak in
November) were noticed in each year. But in 2011 only one peak was noticed. In 2011, the trend
was much below the trend of 2010 and below the threshold value established for 2011. Species
wise trend also reveals that the peaks were in November for both Pv and Pf malaria.
IDSP: Annual Report-2011 Page 17
RAJGANJ
MAL
SADAR
DHUPGURI
MATIALI NAGRAKATA
MAYNAGURI
MADARIHAT
APD-II
KALCHINI
APD-I
KUMARGRAM
Legend:
High incidence (>1) Moderate incidence (0.5-1 cases) Low incidence (<0.5 )
Epi-Map of Jalpaiguri showing the incidence of Malaria in 2011
FALAKATA

IDSP: Annual Report-2011 Page 18
5. AES/JE Surveillance
In 2011, a number of 136 cases with Acute Encephalitis Syndrome (AES) have been reported in
Jalpaiguri. Age-group-wise distribution of AES cases reveals that maximum number of cases are
from 1-10 years (27.94%) and 11-20 years (24.26%) age group. Sex distribution of AES cases
reveals that 63% are male and 37% are female. Monthly trend shows that the peak was in July
and August. A number of 34 samples were sent for virology test for JE from DSU, Jalpaiguri.
Table: Age-group wise distribution of AES cases in Jalpaiguri in 2011
Age Group No. of AES
cases
Percentage No. of JE (lab
positive) cases
1-10 yrs. 38 27.94 2
11-20 yrs. 33 24.26 6
21-30 yrs. 18 13.24 0
31-40 yrs. 13 9.56 1
41-50 yrs. 16 11.76 1
51-60 yrs. 9 6.62 1
61+ yrs. 9 6.62 2
TOTAL 136 100.00 13

IDSP: Annual Report-2011 Page 19
AES cases are reported from all the Blocks of Jalpaiguri. But higher number of cases are from
Sadar, Rajganj, Maynaguri, Dhupguri, Mal and APD-II block.
RAJGANJ
MAL
SADAR
DHUPGURI
MATIALI NAGRAKATA
MAYNAGURI
MADARIHAT
APD-II
KALCHINI
APD-I
KUMAR
GRAM
Legend:
High incidence (>10 cases) Moderate incidence (5-9 cases) Low incidence (<5 cases)
Map of Jalpaiguri showing the incidence of AES cases
FALAKATA
JE cases are reported from eight blocks of Jalpaiguri.
IDSP: Annual Report-2011 Page 20
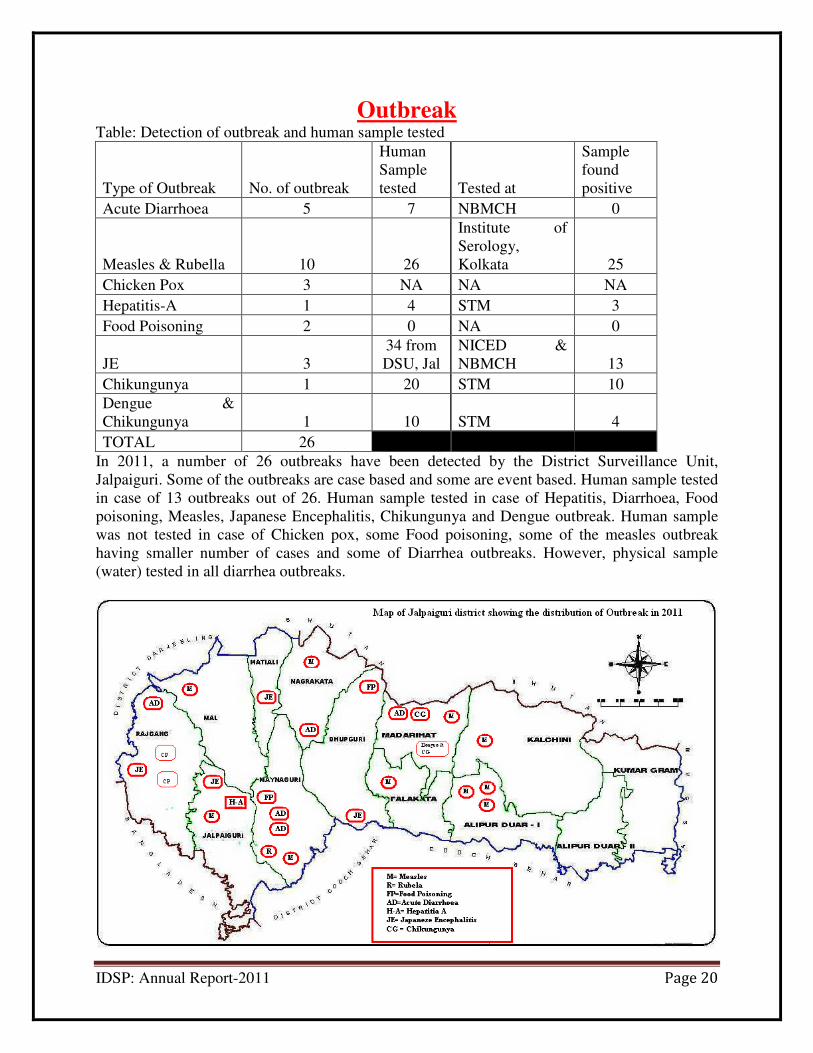
Outbreak Table: Detection of outbreak and human sample tested
Type of Outbreak No. of outbreak
Human
Sample
tested Tested at
Sample
found
positive
Acute Diarrhoea 5 7 NBMCH 0
Measles & Rubella 10 26
Institute of
Serology,
Kolkata 25
Chicken Pox 3 NA NA NA
Hepatitis-A 1 4 STM 3
Food Poisoning 2 0 NA 0
JE 3
34 from
DSU, Jal
NICED &
NBMCH 13
Chikungunya 1 20 STM 10
Dengue &
Chikungunya 1 10 STM 4
TOTAL 26
In 2011, a number of 26 outbreaks have been detected by the District Surveillance Unit,
Jalpaiguri. Some of the outbreaks are case based and some are event based. Human sample tested
in case of 13 outbreaks out of 26. Human sample tested in case of Hepatitis, Diarrhoea, Food
poisoning, Measles, Japanese Encephalitis, Chikungunya and Dengue outbreak. Human sample
was not tested in case of Chicken pox, some Food poisoning, some of the measles outbreak
having smaller number of cases and some of Diarrhea outbreaks. However, physical sample
(water) tested in all diarrhea outbreaks.

IDSP: Annual Report-2011 Page 21
A network has been established with the referral Laboratories of NBMCH, Kolkata School of
Tropical Medicine, NICED-Kolkata, WHO-NSP Siliguri and PHE, Jalpaiguri for testing of
various types of samples during outbreak.
Seasonality of Outbreak: Seasonality of different types of outbreak reveals that, measles and chiken pox outbreaks were
reported in January, February, March, May and December i.e. the period from winter to summer
season. Outbreak of Acute Diarrhoea found in February, May & June. Outbreak of Japanese
Encephalitis detected in the month of August. Chikungunya and Dengue outbreak detected in the
month of November and December.
Learning from the outbreaks:
In case of outbreak we always try to find out the cause and recommend measures to control it.
During measles outbreak it has been observed that vaccine coverage is poor in most of the
affected area and vaccine efficacy was low (as found in Buxa hill of Kalchini Block). Irregular
supply of measles vaccine and Vitamin-A have been noticed. In case of diarrhea outbreak, water
contamination was the main cause. Chikungunya and Dengue outbreak occurred in the month of
November and December at Madarihat block. Large numbers of domestic containers played a
conducive role as breeding ground for Aedes mosquito. And Pulse cleaning (once in a week on a
particular day for four times) was the best preventive action to destroy breeding ground along
with spray of Kerosine oil in the waste stagnant water. In future following action may be taken
reduce the burden of morbidity during outbreak:
(i) Special attention should be given to the forest villages, Tea Garden area and high altitude
villages and cut off area for routine immunization/ vaccine coverage to prevent vaccine
preventable diseases.
(ii) Disinfection of water in these vulnerable areas should also be done on a regular basis.
(iii) NGOs working in the ‘hard to reach area’ should submit report of disease surveillance
weekly.

IDSP: Annual Report-2011 Page 22
Training Status:
Table: IDSP Training Status in Jalpaiguri in 2011
Participants No. of Batches No. of Participants
Medical
Officers
02 34
Paramedical
Staff
02 54
Data Entry
Operator
01 28
TOTAL 05 116
In 2011, IDSP training was conducted for Medical Officers (2 batches), Paramedical Staff (2
batches) and Block Data Entry Operators (one batch). Altogether a number of 116 participants
attended the training programme in five batches.
There are demand for training for newly appointed Medical Officers, Block paramedical staff
like BSI and MI and peripheral staff like GP supervisors and ANMs.
Information sharing and Feedback:
Information to action is the ultimate goal of the disease surveillance system. Information is
shared by the DSU by following means:
(i) Weekly Feedback to the Block
(ii) District MIES – monthly
(iii)Block MIES – monthly
(iv) Sharing of Annual report- yearly.
(v) Over telephone as and when required

IDSP: Annual Report-2011 Page 23
Consistency Report:
Reporting of ‘P’ Units: Total ‘P’ Reporting Units= 55
S.No Block
Week : 1 TO 52 , 2011
PHC
Govt. Hospital/ID
Hospitals/CHC/Medical College
Total no.
of Rus
No. of
units
reported ≥
80% Time
No. of
units
reported
between
50%-80%
Time
No. of
units
reported
<50% or
Null Time
Total no.
of Rus
No. of
units
reported ≥
80% Time
No. of
units
reported
between
50%-80%
Time
No. of
units
reported
<50% or
Null Time
1
SADAR
BLOCK 6 6 0 0 1 1 0 0
2 RAJGANJ 3 3 0 0 1 1 0 0
3 MAYNAGURI 6 6 0 0 1 1 0 0
4 DHUPGURI 4 4 0 0 1 1 0 0
5 MAL 4 4 0 0 1 1 0 0
6 MATIALI 3 2 1 0 0 0 0 0
7 NAGRAKATA 3 3 0 0 0 0 0 0
8 FALAKATA 2 2 0 0 1 1 0 0
9 MADARIHAT 4 4 0 0 1 1 0 0
10 KALCHINI 2 2 0 0 0 0 0 0
11 APD-I 3 3 0 0 1 1 0 0
12 APD-II 3 3 0 0 1 1 0 0
13 KUMARGRAM 3 2 1 0 0 0 0 0
Total 46 44 2 0 9 9 0 0
Reporting of ‘L’ Units: Total ‘L’ Reporting Units= 43
Block
Week : 1 TO 52 , 2011
PHC(Lab.)
Govt. Hospital(Lab.)/ID Hospitals(Lab.)
/CHC(Lab.)/Medical College(Lab.)
Total
no. of
Rus
No. of
units
reported ≥
80% Time
No. of
units
reported
between
50%-80%
Time
No. of
units
reported
<50% or
Null Time
Total no.
of Rus
No. of units
reported ≥
80% Time
No. of units
reported
between
50%-80%
Time
No. of units
reported
<50% or
Null Time
1
SADAR
BLOCK 4 4 0 0 1 1 0 0
2 RAJGANJ 1 1 0 0 1 1 0 0
3 MAYNAGURI 3 1 2 0 1 1 0 0
4 DHUPGURI 2 2 0 0 1 1 0 0
5 MAL 4 4 0 0 1 1 0 0
6 MATIALI 3 1 2 0 0 0 0 0
7 NAGRAKATA 3 3 0 0 0 0 0 0
8 FALAKATA 1 1 0 0 1 1 0 0
9 MADARIHAT 4 4 0 0 1 1 0 0
10 KALCHINI 1 1 0 0 0 0 0 0
11 APD-I 3 3 0 0 1 1 0 0
12 APD-II 3 3 0 0 1 1 0 0
13 KUMARGRAM 2 2 0 0 0 0 0 0
Total 34 30 4 0 9 9 0 0
In Jalpaiguri, 96.36% ‘P’ units and 90.70% ‘L’ units are consistent. 90% ‘S’ units are reporting
regularly. Only five private units are reporting to the DSU regularly.