IDFC Indian Infrastructure - Challenges
18
Indian Infrastructure - Challenges Milind Joshi Managing Director September 2010
-
Upload
sudarshan-subhash -
Category
Documents
-
view
237 -
download
3
description
Overview of IDFC Indian Infrastructure - Challenges
Transcript of IDFC Indian Infrastructure - Challenges

Indian Infrastructure - Challenges
Milind Joshi Managing Director
September 2010
2
Introduction to IDFC Project Equity11
The case for investing in Indian Infrastructure22
Financing33
Challenges and Opportunities44
Agenda
3
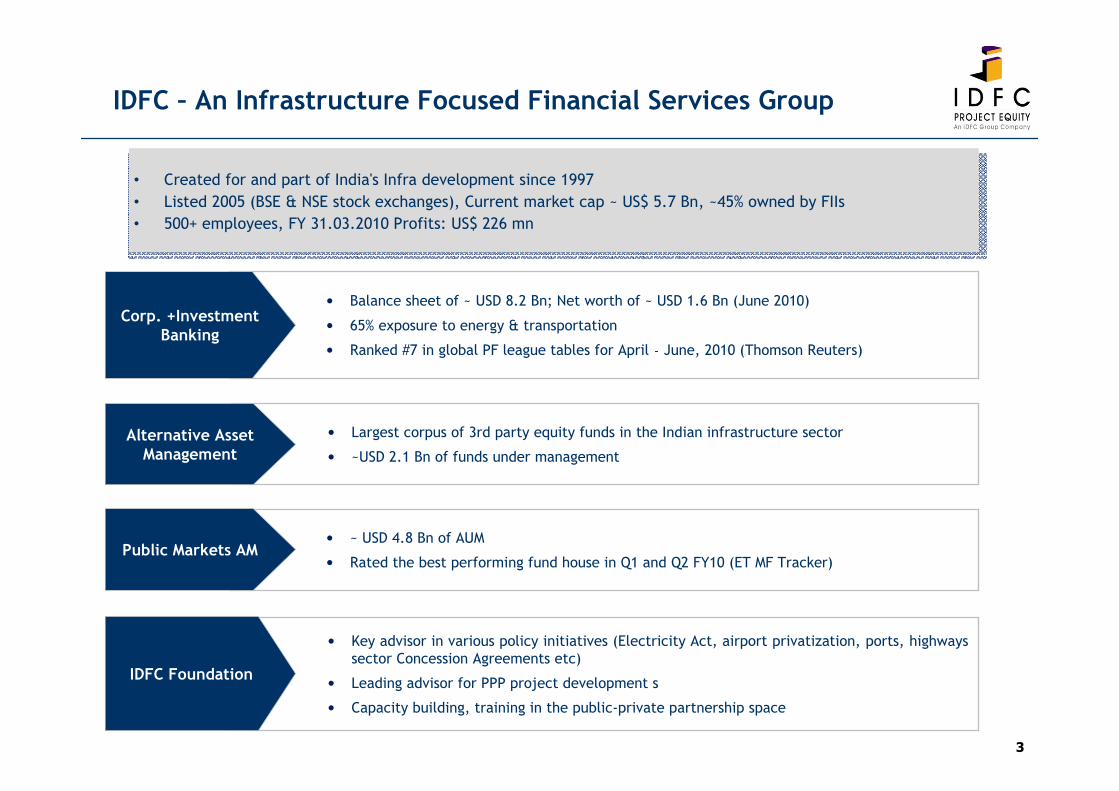
IDFC – An Infrastructure Focused Financial Services Group
� Balance sheet of ~ USD 8.2 Bn; Net worth of ~ USD 1.6 Bn (June 2010)
� 65% exposure to energy & transportation
� Ranked #7 in global PF league tables for April‐June, 2010 (Thomson Reuters)
Corp. +Investment Banking
� Largest corpus of 3rd party equity funds in the Indian infrastructure sector
� ~USD 2.1 Bn of funds under management
Alternative Asset Management
� ~ USD 4.8 Bn of AUM
� Rated the best performing fund house in Q1 and Q2 FY10 (ET MF Tracker)Public Markets AM
� Key advisor in various policy initiatives (Electricity Act, airport privatization, ports, highways sector Concession Agreements etc)
� Leading advisor for PPP project development s
� Capacity building, training in the public-private partnership space
IDFC Foundation
• Created for and part of India's Infra development since 1997
• Listed 2005 (BSE & NSE stock exchanges), Current market cap ~ US$ 5.7 Bn, ~45% owned by FIIs
• 500+ employees, FY 31.03.2010 Profits: US$ 226 mn
4
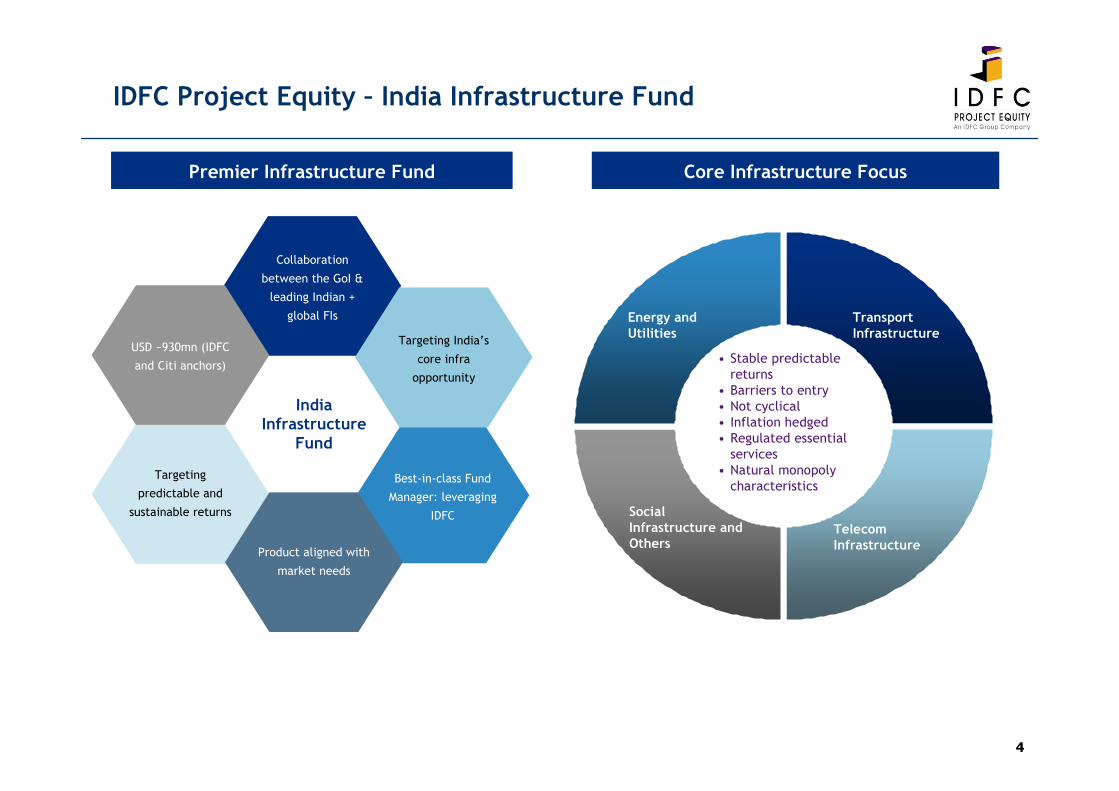
IDFC Project Equity – India Infrastructure Fund
Collaboration
between the GoI &
leading Indian +
global FIs
Targeting
predictable and
sustainable returns
Targeting India’s
core infra
opportunity
Best-in-class Fund
Manager: leveraging
IDFC
USD ~930mn (IDFC
and Citi anchors)
Product aligned with
market needs
India Infrastructure
Fund
Premier Infrastructure Fund Core Infrastructure Focus
• Stable predictable returns
• Barriers to entry• Not cyclical• Inflation hedged• Regulated essential
services• Natural monopoly
characteristics
Energy and Utilities
Transport Infrastructure
Telecom Infrastructure
Social Infrastructure and Others
5
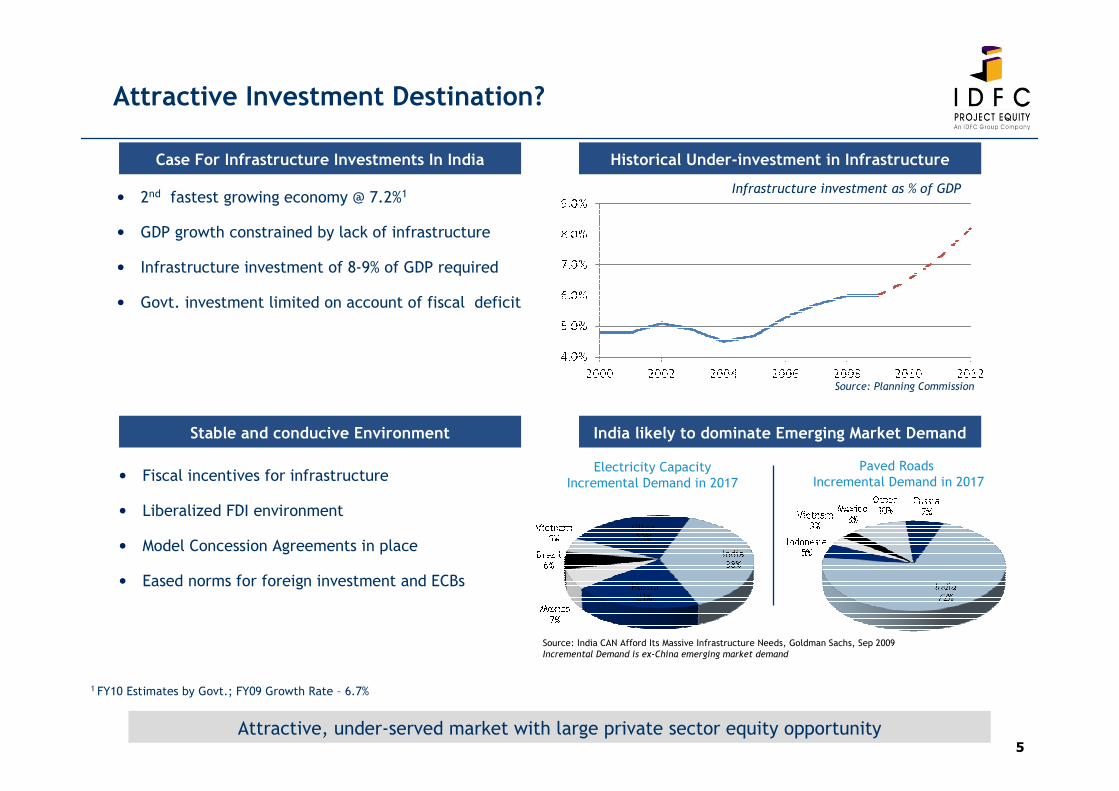
Case For Infrastructure Investments In India
� 2nd fastest growing economy @ 7.2%1
� GDP growth constrained by lack of infrastructure
� Infrastructure investment of 8-9% of GDP required
� Govt. investment limited on account of fiscal deficit
Historical Under-investment in Infrastructure
� Fiscal incentives for infrastructure
� Liberalized FDI environment
� Model Concession Agreements in place
� Eased norms for foreign investment and ECBs
Stable and conducive Environment
1 FY10 Estimates by Govt.; FY09 Growth Rate – 6.7%
Attractive, under-served market with large private sector equity opportunity
India likely to dominate Emerging Market Demand
Electricity Capacity Incremental Demand in 2017
Paved Roads Incremental Demand in 2017
Source: India CAN Afford Its Massive Infrastructure Needs, Goldman Sachs, Sep 2009 Incremental Demand is ex-China emerging market demand
Source: Planning Commission
Infrastructure investment as % of GDP
Attractive Investment Destination?
6
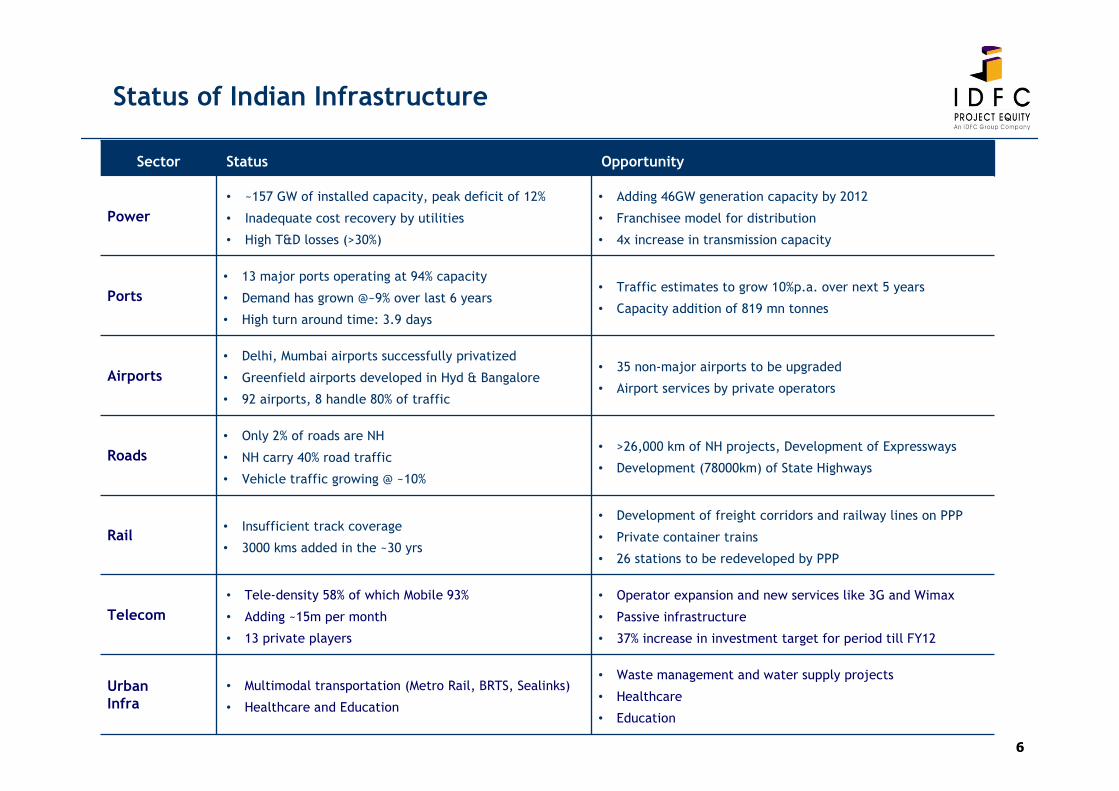
Sector Status Opportunity
Power
• ~157 GW of installed capacity, peak deficit of 12%
• Inadequate cost recovery by utilities
• High T&D losses (>30%)
• Adding 46GW generation capacity by 2012
• Franchisee model for distribution
• 4x increase in transmission capacity
Ports
• 13 major ports operating at 94% capacity
• Demand has grown @~9% over last 6 years
• High turn around time: 3.9 days
• Traffic estimates to grow 10%p.a. over next 5 years
• Capacity addition of 819 mn tonnes
Airports
• Delhi, Mumbai airports successfully privatized
• Greenfield airports developed in Hyd & Bangalore
• 92 airports, 8 handle 80% of traffic
• 35 non-major airports to be upgraded
• Airport services by private operators
Roads
• Only 2% of roads are NH
• NH carry 40% road traffic
• Vehicle traffic growing @ ~10%
• >26,000 km of NH projects, Development of Expressways
• Development (78000km) of State Highways
Rail• Insufficient track coverage
• 3000 kms added in the ~30 yrs
• Development of freight corridors and railway lines on PPP
• Private container trains
• 26 stations to be redeveloped by PPP
Telecom
• Tele-density 58% of which Mobile 93%
• Adding ~15m per month
• 13 private players
• Operator expansion and new services like 3G and Wimax
• Passive infrastructure
• 37% increase in investment target for period till FY12
UrbanInfra
• Multimodal transportation (Metro Rail, BRTS, Sealinks)
• Healthcare and Education
• Waste management and water supply projects
• Healthcare
• Education
Status of Indian Infrastructure
7
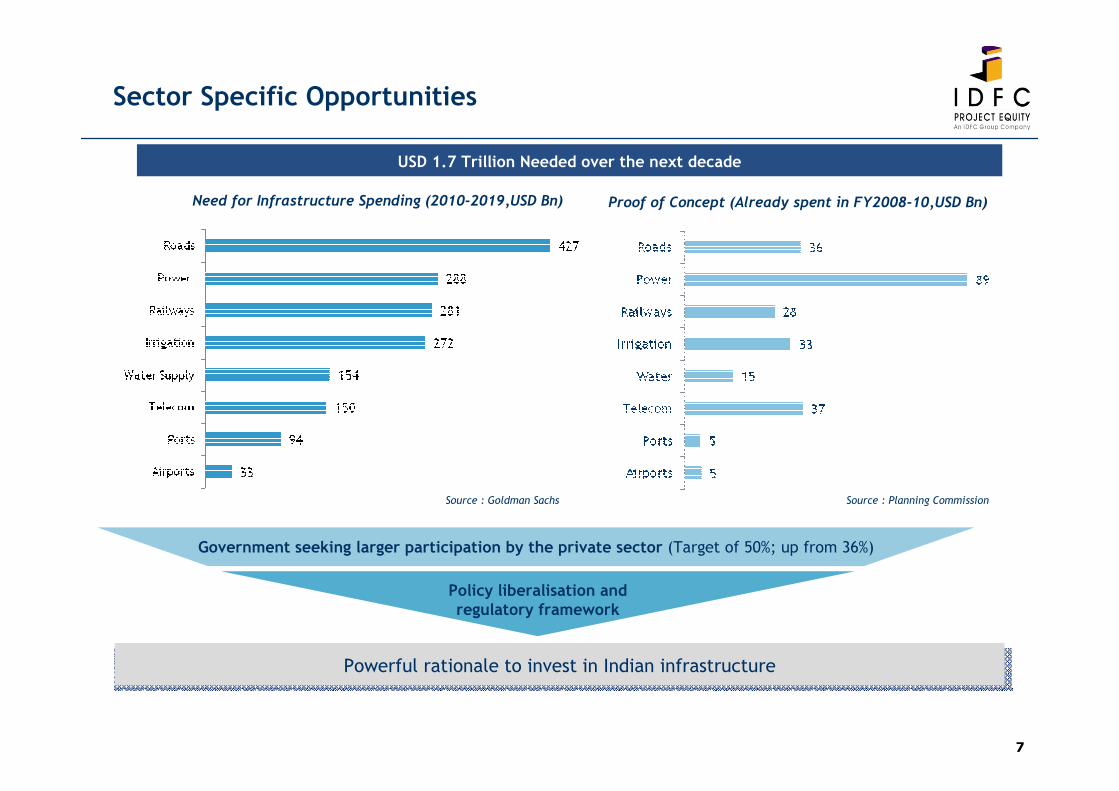
Government seeking larger participation by the private sector (Target of 50%; up from 36%)
Powerful rationale to invest in Indian infrastructure
Policy liberalisation and regulatory framework
USD 1.7 Trillion Needed over the next decade
Need for Infrastructure Spending (2010-2019,USD Bn)
Source : Goldman Sachs
Sector Specific Opportunities
Proof of Concept (Already spent in FY2008-10,USD Bn)
Source : Planning Commission
8
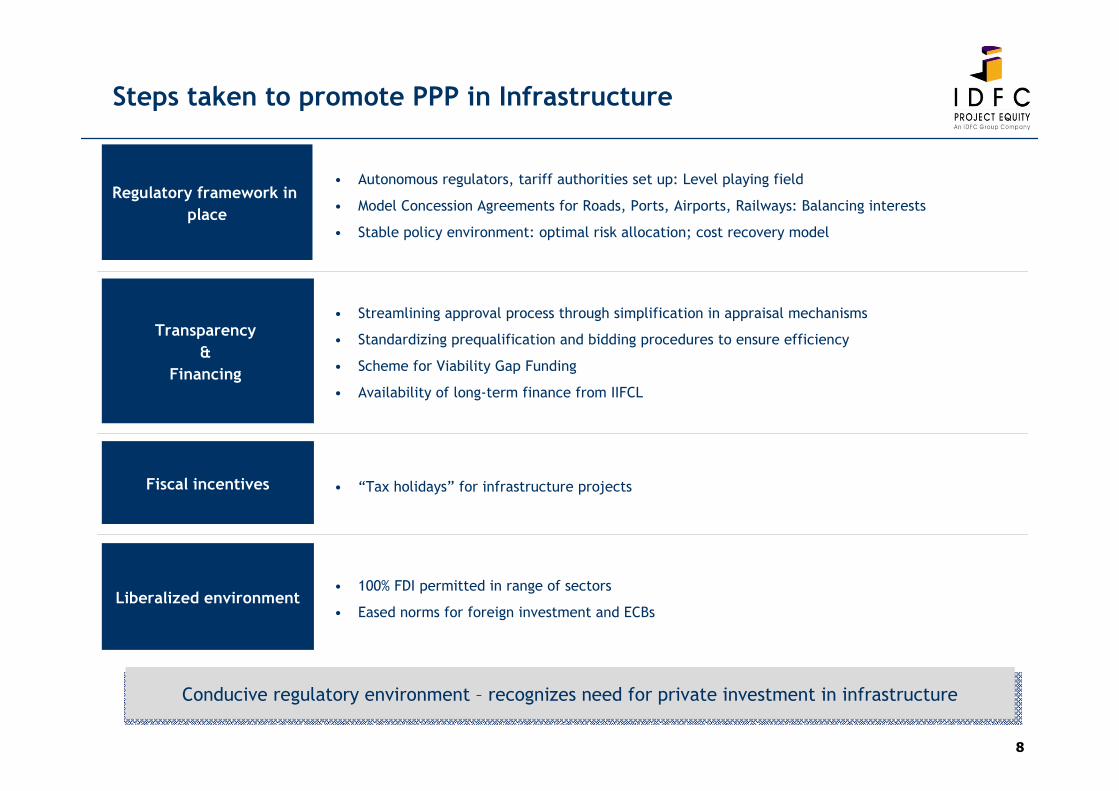
Steps taken to promote PPP in Infrastructure
• Autonomous regulators, tariff authorities set up: Level playing field
• Model Concession Agreements for Roads, Ports, Airports, Railways: Balancing interests
• Stable policy environment: optimal risk allocation; cost recovery model
Regulatory framework in
place
Transparency
&
Financing
• Streamlining approval process through simplification in appraisal mechanisms
• Standardizing prequalification and bidding procedures to ensure efficiency
• Scheme for Viability Gap Funding
• Availability of long-term finance from IIFCL
Fiscal incentives • “Tax holidays” for infrastructure projects
Liberalized environment• 100% FDI permitted in range of sectors
• Eased norms for foreign investment and ECBs
Conducive regulatory environment – recognizes need for private investment in infrastructure
9
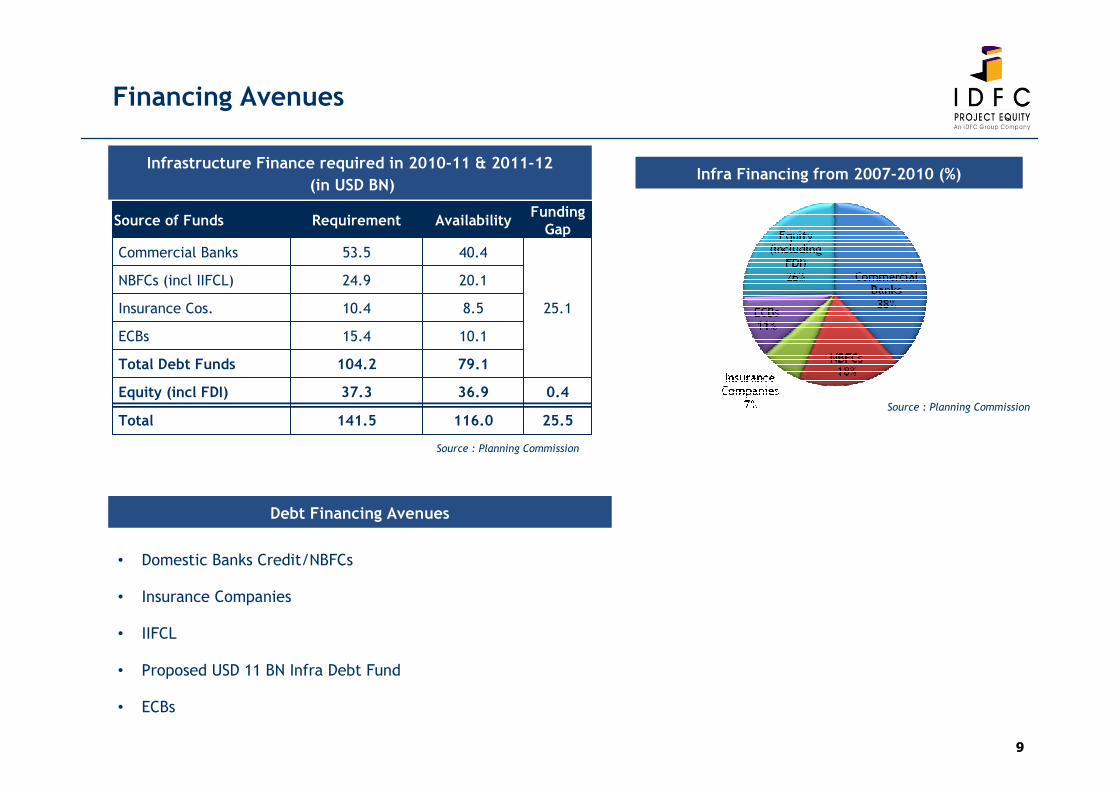
Source of Funds Requirement AvailabilityFunding Gap
Commercial Banks 53.5 40.4
25.1
NBFCs (incl IIFCL) 24.9 20.1
Insurance Cos. 10.4 8.5
ECBs 15.4 10.1
Total Debt Funds 104.2 79.1
Equity (incl FDI) 37.3 36.9 0.4
Total 141.5 116.0 25.5
Infrastructure Finance required in 2010-11 & 2011-12
(in USD BN)
Debt Financing Avenues
• Domestic Banks Credit/NBFCs
• Insurance Companies
• IIFCL
• Proposed USD 11 BN Infra Debt Fund
• ECBs
Source : Planning Commission
Financing Avenues
Infra Financing from 2007-2010 (%)
Source : Planning Commission
10
Credit Financing - Issues
• Fixed rate not available beyond 3 t o 5 years - Leads to interest rate risk
• Tenor Restrictions – typically 10-15 years - Infra projects require very long term financing
• Interest Rate linked to Bank PLRs - Not a very transparent mechanism
• Primarily done by commercial banks – Liabilities are short term
• Need to encourage insurance & pension funds
• Can provide 15-25 year debt
• Commonly provide debt in International markets
Domestic Financing
ECBs
• Ability of foreign banks constrained by India’s sovereign rating
• Project structuring inadequate to provide comfort to foreign banks
• Foreign currency risk difficult and expensive to diversify

11
Holding Company with need for growth capital
Private Equity
Established Holding Company
Asset Level
Project Equity /
Mezzanine Capital
Capital Markets
Equity Financing Avenues Private Equity Funds investing in Infra
India Focused Infra Funds
• IDFC Project Equity
• SBI Macquarie
• Actis
Private Equity Funds investing in Infra
• Sequoia (Ind Bharat)
• TPG Growth (Greenko)
• Bessemer (ITNL)
Equity Financing
Global Infra Funds
•GE-CSFB
•Morgan Stanley
•AIF
12
Equity Financing
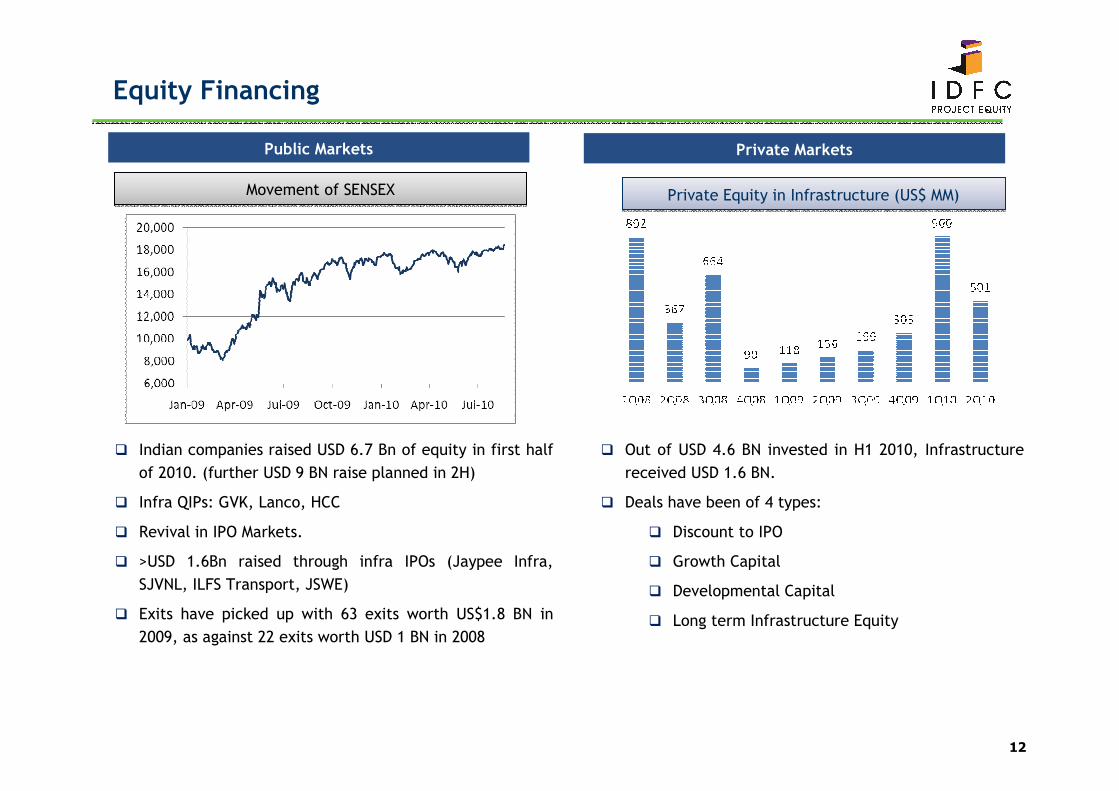
Public Markets Private Markets
Movement of SENSEXMovement of SENSEX
� Indian companies raised USD 6.7 Bn of equity in first half
of 2010. (further USD 9 BN raise planned in 2H)
� Infra QIPs: GVK, Lanco, HCC
� Revival in IPO Markets.
� >USD 1.6Bn raised through infra IPOs (Jaypee Infra,
SJVNL, ILFS Transport, JSWE)
� Exits have picked up with 63 exits worth US$1.8 BN in
2009, as against 22 exits worth USD 1 BN in 2008
� Out of USD 4.6 BN invested in H1 2010, Infrastructure
received USD 1.6 BN.
� Deals have been of 4 types:
� Discount to IPO
� Growth Capital
� Developmental Capital
� Long term Infrastructure Equity
Private Equity in Infrastructure (US$ MM)Private Equity in Infrastructure (US$ MM)
13
Equity Financing
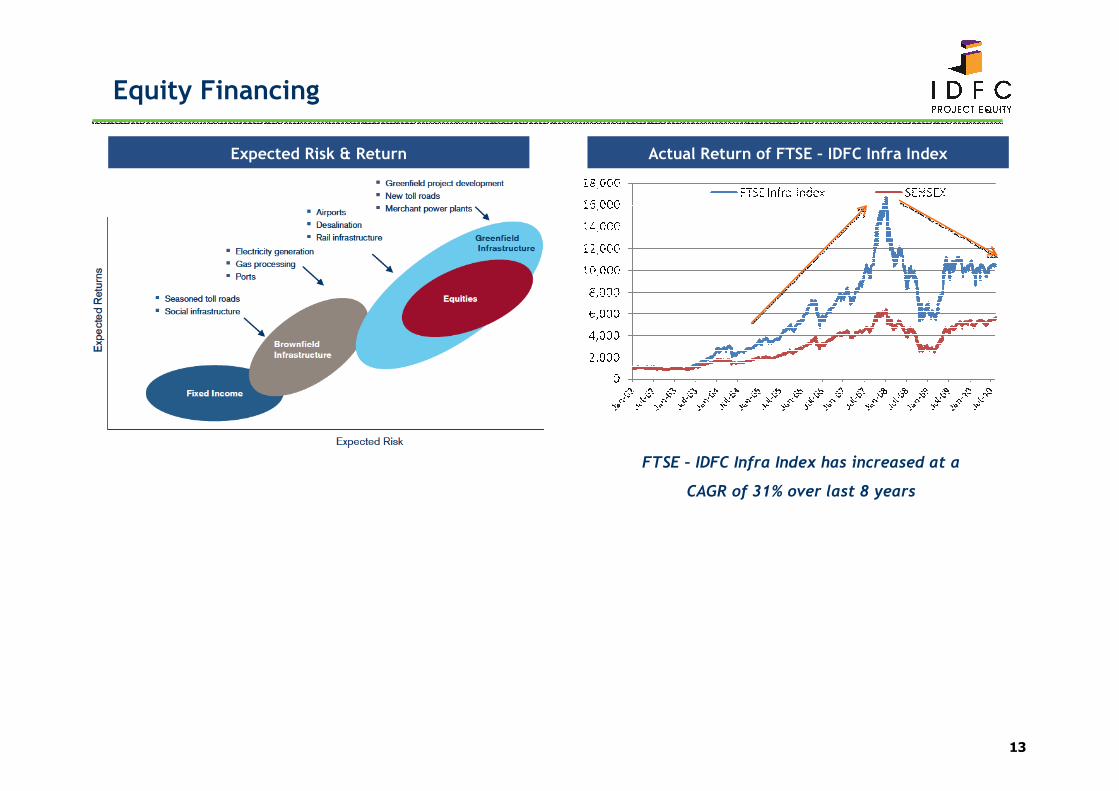
Expected Risk & Return Actual Return of FTSE – IDFC Infra Index
FTSE – IDFC Infra Index has increased at a
CAGR of 31% over last 8 years

14
Challenges for PPP in Infrastructure
• Targets not getting translated to steady pipeline of projects because of limited
institutional capacity
• Multiple Approvals
• Overlap of Jurisdiction
Institutional Capacity
Availability of Capital
• Underdeveloped Debt Capital Markets
• Pension/Insurance Sector to be opened up
• Shortfall in Equity Capital with local sponsors
Execution challenges• Land acquisition issues
• Delayed permits & clearances
Dispute Resolution • Lengthy dispute resolution mechanism
The next frontier in Emerging Challenges for a successful PPP program is “Implementation”
15
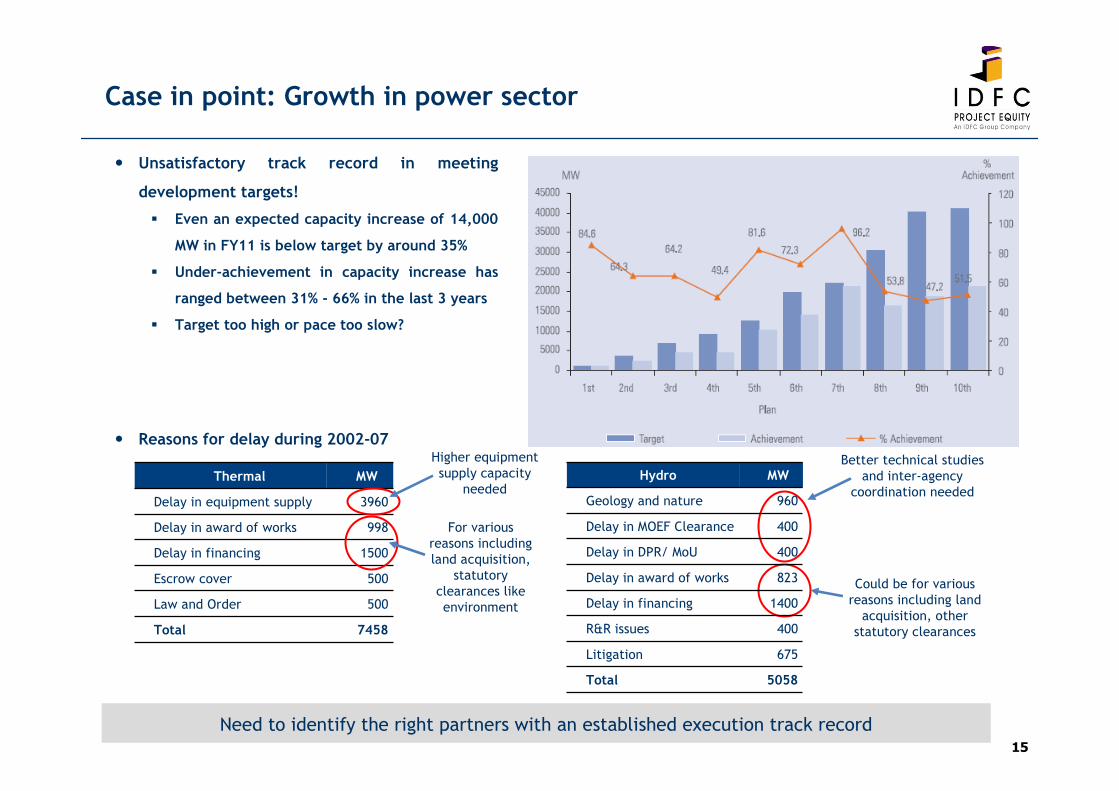
Case in point: Growth in power sector
� Unsatisfactory track record in meeting
development targets!
� Even an expected capacity increase of 14,000
MW in FY11 is below target by around 35%
� Under-achievement in capacity increase has
ranged between 31% - 66% in the last 3 years
� Target too high or pace too slow?
� Reasons for delay during 2002-07
Thermal MW
Delay in equipment supply 3960
Delay in award of works 998
Delay in financing 1500
Escrow cover 500
Law and Order 500
Total 7458
Better technical studies and inter-agency
coordination needed
Could be for various reasons including land
acquisition, other statutory clearances
Hydro MW
Geology and nature 960
Delay in MOEF Clearance 400
Delay in DPR/ MoU 400
Delay in award of works 823
Delay in financing 1400
R&R issues 400
Litigation 675
Total 5058
Higher equipment supply capacity
needed
For various reasons including land acquisition,
statutory clearances like environment
Need to identify the right partners with an established execution track record
16
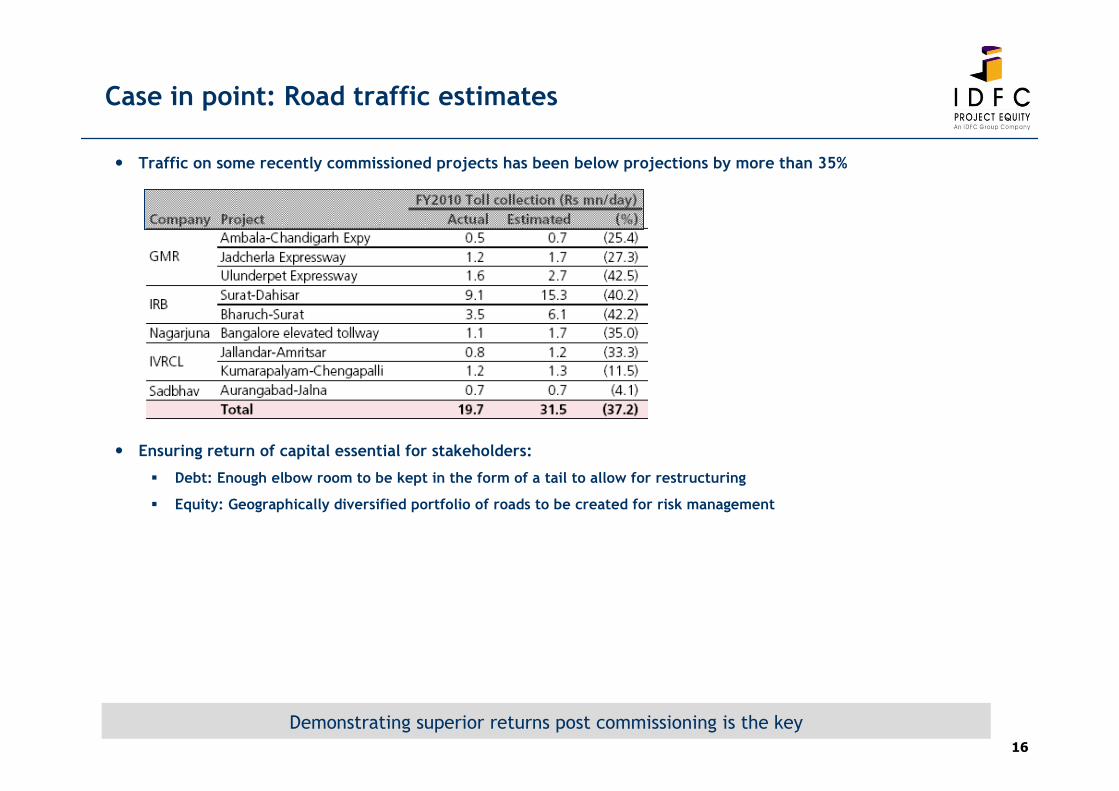
Case in point: Road traffic estimates
� Traffic on some recently commissioned projects has been below projections by more than 35%
� Ensuring return of capital essential for stakeholders:
� Debt: Enough elbow room to be kept in the form of a tail to allow for restructuring
� Equity: Geographically diversified portfolio of roads to be created for risk management
Demonstrating superior returns post commissioning is the key
17
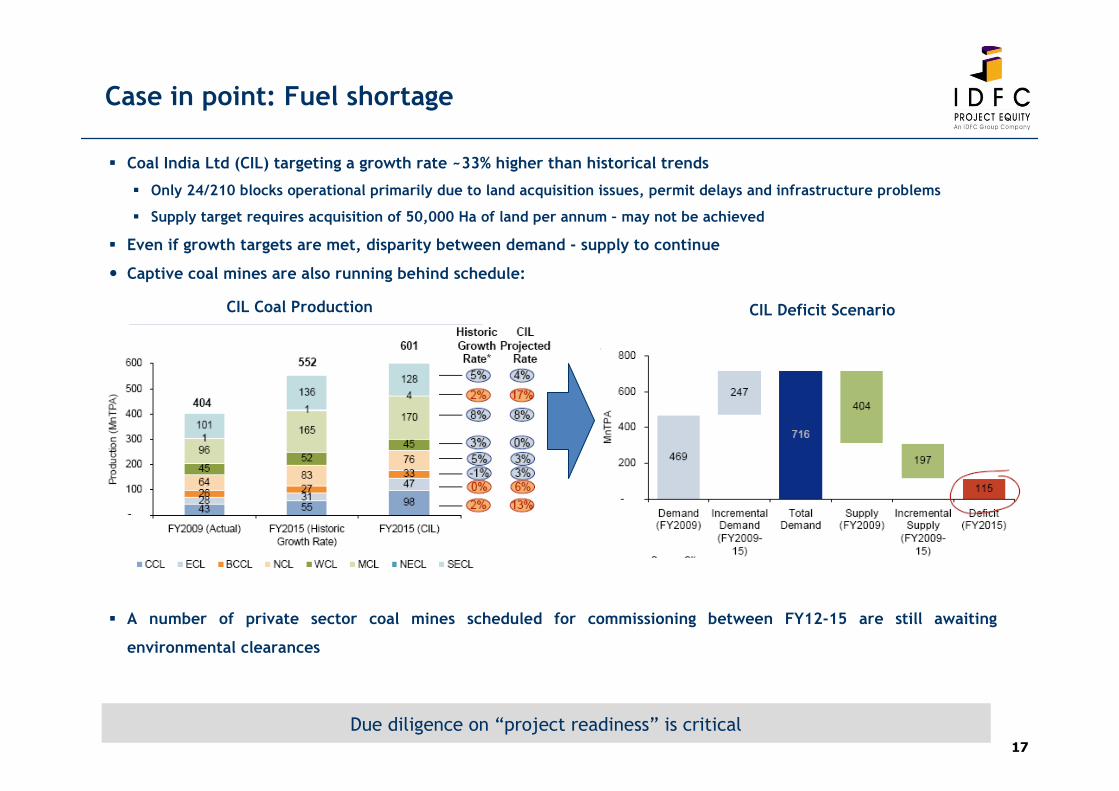
Case in point: Fuel shortage
� Coal India Ltd (CIL) targeting a growth rate ~33% higher than historical trends
� Only 24/210 blocks operational primarily due to land acquisition issues, permit delays and infrastructure problems
� Supply target requires acquisition of 50,000 Ha of land per annum – may not be achieved
� Even if growth targets are met, disparity between demand - supply to continue
� Captive coal mines are also running behind schedule:
� A number of private sector coal mines scheduled for commissioning between FY12-15 are still awaiting
environmental clearances
CIL Coal Production CIL Deficit Scenario
Due diligence on “project readiness” is critical

18
THANK YOU