School Pupil Police OSchool Pupil Police Officer (Hamyare ...

1
Identifying usability aspects with digital
pupil attendance registration in a low
resource context:
A case study from the Gambia
Rambi Nguyen
Master’s Thesis Spring 2021

2

3
Abstract
This thesis identifies essential usability aspects for a pupil attendance application. Usability
often determines a system's survival in operational use. Users may abandon a solution that is
perceived as useless or difficult to use. In the context reported on here, the primary users are
school staff and teachers in the Gambia that do not have the luxury of abandoning a solution
with poor usability, as it is used for their daily work tasks. However, usability is still essential
for them to perform their work as best possible.
This thesis draws on state of the art literature on usability and identifies usability aspects that
are relevant to the context studied. In an exploratory search of essential usability aspects for a
pupil attendance application in a low resource context, the study was conducted with
qualitative data collection methods. The use of qualitative methods has allowed me to
observe the actual use of the application in schools, and converse with the users of a pupil
attendance application with open-ended questions.
The thesis identifies essential usability aspects for a pupil attendance application in a low
resource public education setting. Importantly, communication between designers, users and
other stakeholders can support the application to be more usable, as every actor of the system
can share their opinions and be heard.

4
5
Acknowledgements
I will thank my supervisor, Terje Aksel Sanner, for being patient and giving me guidance
throughout the project. Also thanks to Sarujanthan Subaschandran, my fellow student, for
joining me in the early stages of this academic journey. Thanks to The Ministry of Basic and
Secondary Education (MoBSE) in the Gambia for the hospitality I experienced during my
stay. Another thanks to the two schools, Albyon and Kabafita LBS/SSE, for their hospitality
and participation in the study.
Another big thanks to Terje Hemmingsen, Marius Runningen Larsson, Lilli Minh Nguyen
and Thomas Rosseland for taking their time to support me.

6

7
Table of contents
Abstract 3
Acknowledgements 5
Table of contents 7
Acronyms 10
Introduction 14
Motivation 15
Context 16
Research question and objectives 17
Thesis Structure 18
Background 19
UNs Sustainability Goal 19
HISP 20
DHIS2 20
DHIS2 for Education 20
The Gambia 21
Education in The Gambia 23
Telecommunications, Internet and electricity 25
Related Work / literature review 27
Information System 27
Management information system 28
Education Management Information System 28
SMIS 30
Conceptual Framework 31
User Experience 31
User Interface 31
Usability 31
Jakob Nielsen 10 Usability Heuristic for User Interface Design: 34
Methodology 36
Project Summary 36
Research Method 37
Qualitative research 37
Case study 37
8
Data collection methods 40
Pictures 40
Unstructured/ Open-ended Interviews 40
Observation 41
Data sources/ Involved Actors 43
Documentation 43
Triangulation 44
Data analysis 45
Reflections of data collection 48
Empirical Findings 49
Network capabilities 49
Online/Offline feature: 49
Preparations and Training 50
Questionnaires 51
Unique identification of Pupils 52
School observation 53
Albyon 53
The second approach of Albyon 54
Kabafita 54
Kabafita LBS 54
Kabafita SSE 55
The second approach in Kabafita 55
Conclusion from visit 56
Result and analysis 57
Offline capability 57
Questionnaires 57
Errors 61
Errors during data entry 61
Wrong entry of numbers 61
Duplication of data 62
Training and support 63
Knowledge of use of hardware devices 64
Assessment of Nielsen’s Usability Quality Attribute 64
Learnability 64
Efficiency 65
Memorability 66
9
Errors 66
Satisfaction 67
Conclusion of Nielsen’s usability analyzation 68
Conclusion and reflection of Result and Analysis 68
Discussion 69
Speak the same language 69
Case: Developing for rural users 70
Designing a pupil attendance application for The Gambia 71
The relationship between learnability and efficiency 72
Involve 5 users to test the application: 73
Errors 74
Error Messages 74
Error Prevention 74
Training and Support 76
Summary of discussion 77
Limitations 80
Limitations regarding the data collection 80
Conclusion and future works 82
Practical implication 82
Theoretical implication 83
Future work 84
Bibliography 85
10
List of Figures
Figure 1: Map of The Gambia [12]....................................................................................... 21
Figure 2: Enrolment rate in primary education in The Gambia [18] ...................................... 24
Figure 3: A map of cellphone coverage. 4G, 3G and GSM connection by Africell [50]......... 26
Figure 4: Three parts of an information system [52] ............................................................ 27
Figure 5: Illustration of UX [31] ............................................................................................ 33
Figure 6: Relevant Situation for Different Research Strategies [36, p. 5] ............................. 38
Figure 7: Convergence of Evidence [36, p. 100] .................................................................. 44
Figure 8: Categories made from NVivo ............................................................................... 47
Figure 9: Questionnaire page 1 ........................................................................................... 59
Figure 10: Questionnaire page 2 ......................................................................................... 60
Figure 11: Error message for wrong entry of numbers ........................................................ 62
Figure 12: Error message for duplication of data ................................................................. 63
Figure 13: Why testing with 5 users is sufficient [46] ........................................................... 73
Figure 14: A categorization of observed issues ................................................................... 77

11
List of Tables
Table 1: Table of educational system in The Gambia [19, pp. 30, Table 3.1] ...................... 25

12
Acronyms
ADR Action Design Research (ADR)
DHIS2 District Health Information Software 2
EMIS Education Management Information Systems
GDP Gross Domestic Product
GSM Global System for Mobile Communications
GUI Graphical User Interface
HISP Health Information Systems Programme
HMIS Health Management Information System
HISP Health Information Systems Programme
HISP UiO Health Information Systems Programme University in Oslo
HISP WCA Health Information Systems Programme West Central Africa
ICT Information and Communication Technology
ID Identification
IMF International Monetary Fund
ISP Internet Service Providers
IS Information System
IT Information Technology
LBS Lower Basic School
MoHERST Ministry of Higher Education Research Science and Technology
MIS Management Information System
MoBSE Ministry for Basic and Secondary Education
MoE Ministry of Education
NNGROUP Nielsen Norman Group
OOSC Out of school children
PWA Progressive Web Application
SDG Sustainable development goals
SMIS School Management Information System
SMS Short Message Services
SRN Student Registration Number
SSE Senior Secondary Education
UI User Interface
UiO University in Oslo

13
UNICEF United Nations International Children Emergency Fund
UX User Experience
WIFI Wireless Fidelity

14
Introduction
Globally, approximately 1.5 billion children and youths are enrolled in kindergartens,
primary and secondary schools and universities [1]. The access to education in developing
countries is steadily increasing, whereas enrolment in higher education is rising, adult
education programmes and literacy rates are improving. Access to basic education can
transform the lives of the disadvantaged [1].
Student absenteeism is a challenge for many developing countries. Absenteeism refers to a
pupil that for some reason does not attend school. According to Unesco, 67 million children
are out of school in primary age, 53 percent of this number consist of girls and 43 percent of
them are in sub-Saharan Africa [1]. Many of them may not receive education in all of their
lifetime. Enrolment rates are negatively impacted by dropout rates, armed conflicts and the
consequences of political disarray. Countries with armed conflicts make out 40 percent of
Out Of School Children (OOSC) [1]. Gender disparities are today a major issue that stagnate
the progress in education. In the end, these limitations affect the basic literacy skills of the
people, and make it difficult to combat or end poverty.
This master thesis focuses on usability aspects of a pupil attendance application that enables
monitoring of pupil attendance. In this context, usability aspects constitute any function that
allows a system or application to be usable for the end-users.

15
Motivation
Education has the power to improve livelihood and health that can contribute to social
stability and long term economic growth [2]. Education plays a key role in human, social, and
economic development, which makes basic education a vital human right.
With the present digital technologies and tools, we can create sustainable and efficient
solutions for the education sector. There are many applications, but not all of them are usable
for their intended purpose. Furthermore, many systems put in place in the education sector in
developing countries are poor on usability simply because usability is not considered
important, or just due to lack of awareness of usability issues. This affects the users of the
application and their ability to monitor the attendance of pupils and take appropriate action.
16
Context
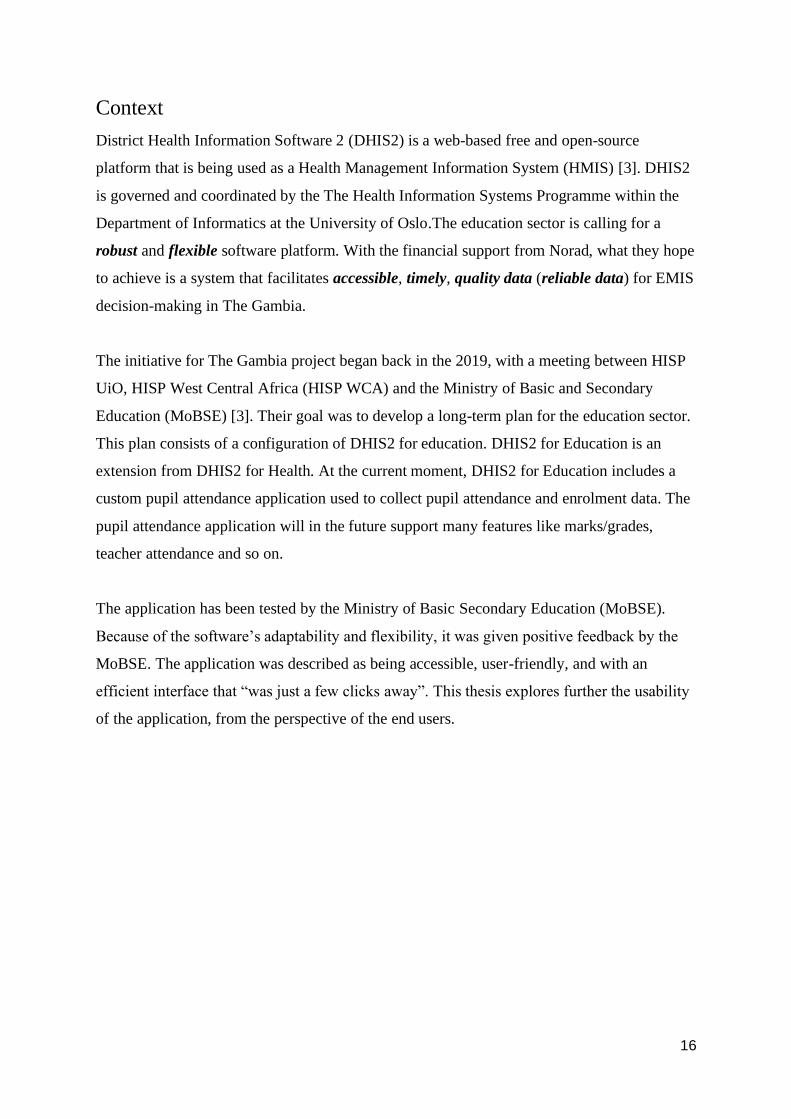
District Health Information Software 2 (DHIS2) is a web-based free and open-source
platform that is being used as a Health Management Information System (HMIS) [3]. DHIS2
is governed and coordinated by the The Health Information Systems Programme within the
Department of Informatics at the University of Oslo.The education sector is calling for a
robust and flexible software platform. With the financial support from Norad, what they hope
to achieve is a system that facilitates accessible, timely, quality data (reliable data) for EMIS
decision-making in The Gambia.
The initiative for The Gambia project began back in the 2019, with a meeting between HISP
UiO, HISP West Central Africa (HISP WCA) and the Ministry of Basic and Secondary
Education (MoBSE) [3]. Their goal was to develop a long-term plan for the education sector.
This plan consists of a configuration of DHIS2 for education. DHIS2 for Education is an
extension from DHIS2 for Health. At the current moment, DHIS2 for Education includes a
custom pupil attendance application used to collect pupil attendance and enrolment data. The
pupil attendance application will in the future support many features like marks/grades,
teacher attendance and so on.
The application has been tested by the Ministry of Basic Secondary Education (MoBSE).
Because of the software’s adaptability and flexibility, it was given positive feedback by the
MoBSE. The application was described as being accessible, user-friendly, and with an
efficient interface that “was just a few clicks away”. This thesis explores further the usability
of the application, from the perspective of the end users.
17
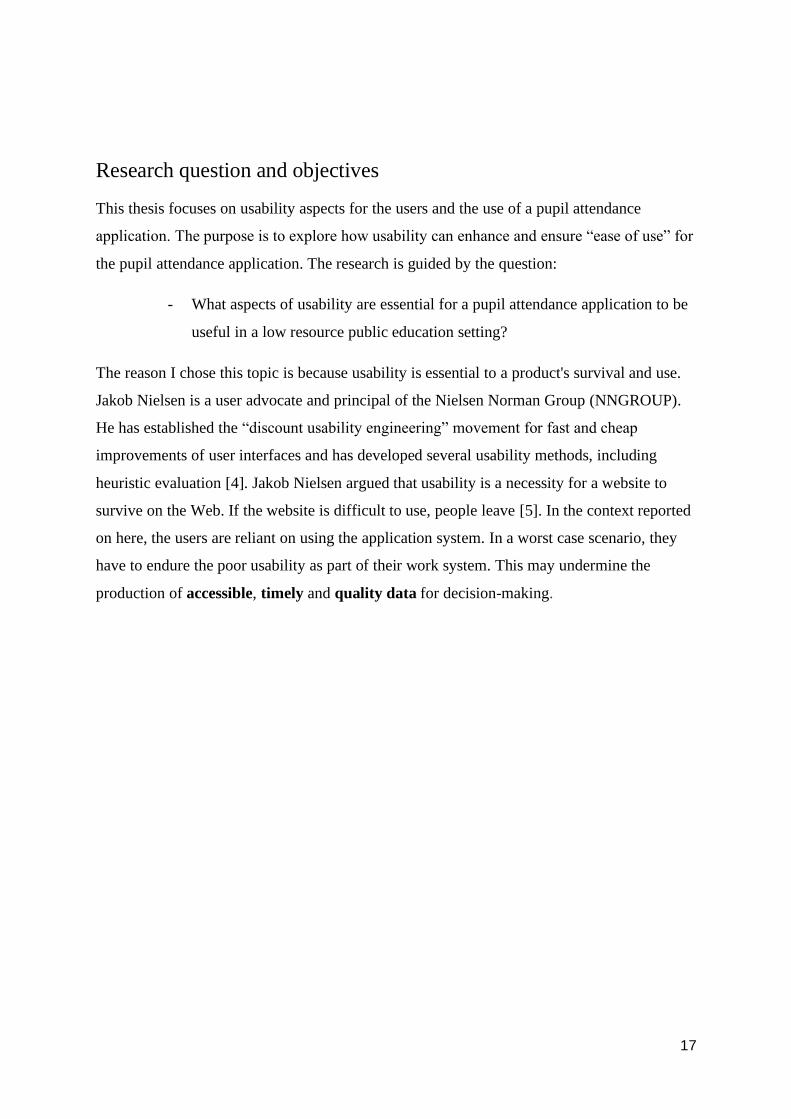
Research question and objectives
This thesis focuses on usability aspects for the users and the use of a pupil attendance
application. The purpose is to explore how usability can enhance and ensure “ease of use” for
the pupil attendance application. The research is guided by the question:
- What aspects of usability are essential for a pupil attendance application to be
useful in a low resource public education setting?
The reason I chose this topic is because usability is essential to a product's survival and use.
Jakob Nielsen is a user advocate and principal of the Nielsen Norman Group (NNGROUP).
He has established the “discount usability engineering” movement for fast and cheap
improvements of user interfaces and has developed several usability methods, including
heuristic evaluation [4]. Jakob Nielsen argued that usability is a necessity for a website to
survive on the Web. If the website is difficult to use, people leave [5]. In the context reported
on here, the users are reliant on using the application system. In a worst case scenario, they
have to endure the poor usability as part of their work system. This may undermine the
production of accessible, timely and quality data for decision-making.
18
Thesis Structure
Chapter 2: Background
The chapter presents an overview of the education sector in the Gambia.
Chapter 3: Related Work / literature review
The chapter provides a review of relevant literature for the study.
Chapter 4: Methodology
The chapter reports on the methods used for data gathering and analysis.
Chapter 5: Empirical Findings
The chapter presents the findings from my observation in The Gambia.
The presentation consists of the network experience in the country,
the tools to collect information regarding pupils and the school visits.
Chapter 6: Result and analysis
In this chapter, I provide a presentation of the result derived from the data
collection. This chapter also includes some of the literature review to
assess the findings.
Chapter 7: Discussion
This chapter discussiones the study findings with state of the art research in the field.
A summary of
discussion will present the important the essential
usability aspect for the study.
Chapter 8: Conclusion

19
Background
This section will give an overview of The Gambia education sector background information.
The information consists of general facts about the country regarding geography,
demography and especially the educational system.
UNs Sustainability Development Goals
This initiative was adopted by all the United Nations (UN) Member States back in 2015. The
Sustainable Development Goals (SDG) provide a shared interest for peace and to achieve a
better sustainable future for all. In addition, they embrace the global challenges alongside
poverty, inequality, climate change, environmental degradation, peace and justice [6].
The SDG has an agenda in which its ambition is to fulfill these goals within 2030. There are
17 goals in this comprehensive plan, but in this thesis I will narrow it down and focus on the
relevant goals to the educational sector. It is arguable that all 17 goals are to some degree
relevant to education, but a selection of these goals land a bigger impact than the rest. Out of
the 17 goals, the ones marked in bold beneath, are the ones I have chosen to explore [6]:
1. Quality education
2. Gender Equality
3. Reduce inequalities
The most relevant goal for this thesis is first of all the Quality education (Goal 4). This goal
will ensure inclusive and equitable quality education and promote lifelong learning
opportunities for all [7]. The quality education has a motive to achieve their targets by 2030
and the relevant goals for this thesis is by following [8]:
1. Ensure that all girls and boys will complete their free, equitable and quality primary
and secondary education.
2. Ensure that all girls and boys have access to quality early childhood development,
care and pre-primary education so that they are ready for primary education.
3. Ensure equal access for all women and men to affordable and quality technical,
vocational and tertiary education, including university.

20
HISP
Health Information Systems Programme (HISP) is a global movement to strengthen Health
Information Systems [9]. Their work began back in the ‘90s, and the HISP University of Oslo
(UiO) is one of the leading organisations when it comes to contribution of design,
implementation support, research and sustain Health information systems in the developing
countries.
The goal of HISP is to enable and support countries to strengthen their health system and
their capacity. The incentive is to govern the Health Information System in a sustainable way
to improve the management and delivery of health systems [9].
DHIS2
District Health Information Software 2 (DHIS2) is an open source, web-based health
management information system (HMIS) platform [10]. Nowadays, the DHIS2 is the world
largest HMIS platform and the platform is being used by 72 low and middle-income
countries. The core of DHIS2 software is developed and coordinated by the HISP UiO [10].
DHIS2 for Education
UN Sustainable Development Goal 4 (Quality education) aims at improving learning
outcomes and equitable access to education [11]. DHIS2 for Education is an extension from
DHIS2 for Health, and can collect data for analysis and visualization for the education sector
[11]. The platform is open-source and offers a flexible solution which supports many use
cases. DHIS2 for education is compatible with many devices such as desktop computers,
mobile devices, creation of custom web and Android applications, and it supports integration
with other software platforms [11].

21
The Gambia
The Republic of The Gambia is positioned in West Africa and is the smallest country within
the mainland. The country itself is surrounded by Senegal, and the Atlantic Ocean is covering
the western part of the country. This country has an area of 10 689 square kilometres which is
almost the same size as a Norwegian former county, Rogaland, with 9326 square kilometres.
According to Google, the population of The Gambia is currently 2,28 million and is almost
corresponding to half of the population of Norway. The capital of The Gambia is Banjul, and
the largest cities are Brikama and Serekunda.
Figure 1: Map of The Gambia [12]
As for the historical events, The Gambia shares roots with many West African countries in
the slave trade. Because of the geographical location of the country, The Gambia became a
key factor for many colonists, and they were first colonized by the Portoguese and thereafter
became a part of the British Empire. During the colonial times, The Gambia was affected and

22
influenced by the colonists, and today the official language is English. The country hosts
many ethnic groups from Western Africa, and therefore has other native languages like
Mandinka, Wolof, Fula, Serer and many more.
Farming, fishing and tourism are the main pillars of The Gambia’s economy. The poverty
rate of the population is 48,6%, where 70% of the population is located in rural areas. These
numbers are based in 2015 [12].
The Gross Domestic Product (GDP) is a monetary value of final goods and services—that is,
those that are bought by the final user—produced in a country in a given period of time [13].
In 2018, The Gambia had a GDP of 1,624 billion dollar, while Norway had 434,2 billion in
comparison [14]. There is a big gap between these two countries and the differential is almost
at 267%. In terms of International Monetary Fund (IMF) within world basis ranking in 2020,
The Gambia is ranked at 172th and the lowest rank is 194 [15]. This makes The Gambia one
of the poorest based on IMF ranking.

23
Education in The Gambia
The United Nations International Children Emergency Fund (UNICEF) has been working to
save children's lives in over 70 years. This organization is the largest internationally within
promotion and protection of children’s rights. Nowadays, UNICEF has a known presence in
more than 190 countries [16].
UNICEF is in cooperation with the Government of The Gambia to achieve the education
policy goals [14]. This policy is aligned with the Sustainable Development Goal 4, and is
done through communication with the Ministry of Basic and Secondary Education (MoBSE).
The SDG 4 is focusing on accesible, equitable and inclusive education for all [14]. Due to the
expanding of the educational sector annually, the country is facing a challenge to meet up
with requirements to steady the growth in terms of resources. These resources are classrooms,
learning materials and teachers. The goal is to realize his and her rights to educate, but due to
low performance in learning outcomes, a strategic partnership and collaboration with the
MoBSE is needed. Many factors are stagnating the progress of quality education in this
country. These factors can be related to disability, access of education, family choice of
education and social norms that drive child marriage [17].
The solution UNICEF propose is to support the MoBSE with a programme whilst the aim is
to achieve an inclusive education system to provide comprehensive early childhood education
to all children, in conjunction with health, nutrition and protection interventions, and to
ensure the rights of all children to appropriate quality education [17].
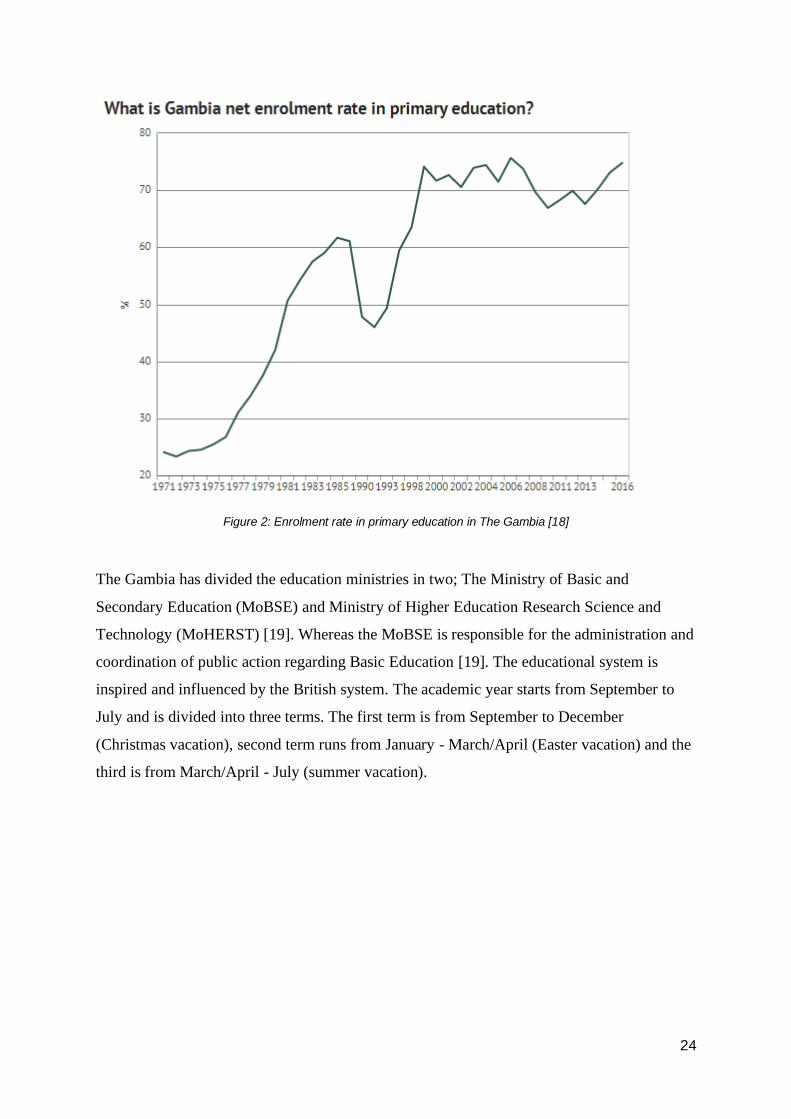
The education in The Gambia should mandate free and compulsory primary education [12].
Achieving this constitution had been difficult due to lack of resources, and coupled with the
current education infrastructure. Back in 2005, the net enrolment rate in primary education
was at 71,5% of the children, and 74,8% in 2016 [18]. This ratio shows that it is steadily
growing, and can impose a challenge for the educational sector if they cannot keep up with
the resources.
24
Figure 2: Enrolment rate in primary education in The Gambia [18]
The Gambia has divided the education ministries in two; The Ministry of Basic and
Secondary Education (MoBSE) and Ministry of Higher Education Research Science and
Technology (MoHERST) [19]. Whereas the MoBSE is responsible for the administration and
coordination of public action regarding Basic Education [19]. The educational system is
inspired and influenced by the British system. The academic year starts from September to
July and is divided into three terms. The first term is from September to December
(Christmas vacation), second term runs from January - March/April (Easter vacation) and the
third is from March/April - July (summer vacation).

25
School level Years of education Age Grades
Early Childhood
Development(ECD)
3 3-6 1st-3rd
Lower Basic
School(LBS)
6 7-12 1st-6th
Upper Basic
School(UBS)
3 13-15 7th-9th
Senior Secondary
Education(SSE)
3 16-18 10th-12th
Table 1: Table of educational system in The Gambia [19, pp. 30, Table 3.1]
Telecommunications, Internet and electricity
The Gambia has four main telecommunication companies. Africell and Comium are both
foreign-owned, Gamtel is state-owned and Qcell is private-owned. According to
Privacyshield, the penetration of the mobile phones is well over 100 percent [20]. The
cellular subscriptions are at 119,6 per 100 habitants (est. 2018) [21].
There are four main Internet Service Providers (ISP) in the country; Gamtel, Africell,
Netpage, and Qcell [20]. In 2011, the quality of connectivity was improved due to a launch
with submarine cable in the African Coast to Europe. Even with the improved connectivity,
the numbers of Internet users are quite low. Only 19,84% of the population are using the
Internet (est July 2017) [22].

26
Figure 3: A map of cellphone coverage. 4G, 3G and GSM connection by Africell [50]
The map over shows the coverage with the particular type of signals. The purple indicates
GSM connection, which covers most of the country. While the yellow displays 3G coverage
which covers the capital and smaller parts of the country. Lastly, the orange indicates 4G or
LTE, and covers Serekunda areas.
Approximately a half of the population have access to electricity [22]. Whereas urban areas
have a higher access than rural areas, and the differential is 69% (urban) vs 19% (rural). Thus
maintaining electricity in their home in rural areas can be costly for many people. The main
source of electricity comes from fossil fuels [22]. The country also produces renewable
electricity, but the numbers are scarce.
27
Related Work / literature review
Information System
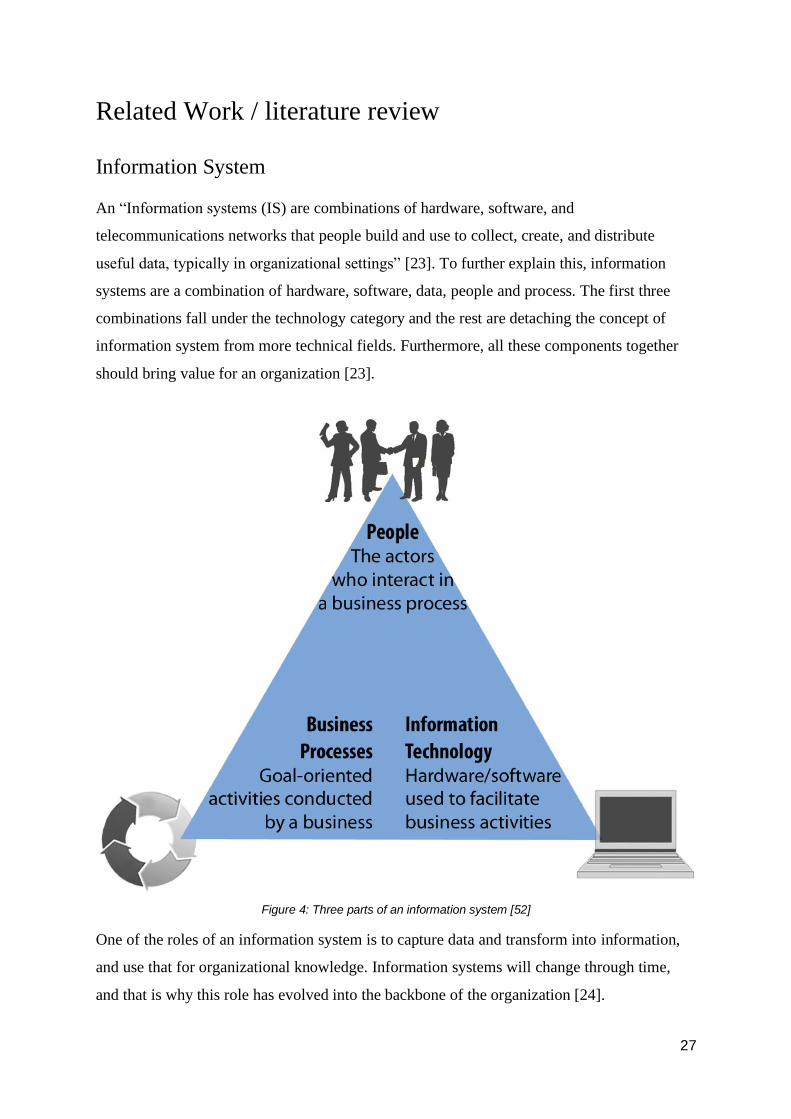
An “Information systems (IS) are combinations of hardware, software, and
telecommunications networks that people build and use to collect, create, and distribute
useful data, typically in organizational settings” [23]. To further explain this, information
systems are a combination of hardware, software, data, people and process. The first three
combinations fall under the technology category and the rest are detaching the concept of
information system from more technical fields. Furthermore, all these components together
should bring value for an organization [23].
Figure 4: Three parts of an information system [52]
One of the roles of an information system is to capture data and transform into information,
and use that for organizational knowledge. Information systems will change through time,
and that is why this role has evolved into the backbone of the organization [24].

28
Management information system
A «Management Information Systems (MIS) is the study of people, technology,
organizations, and the relationships among them. MIS professionals help firms realize
maximum benefit from investment in personnel, equipment, and business processes. MIS is a
people-oriented field with an emphasis on service through technology» [24].
A management information system is a subset of information system. As information systems
is used to collect, process and store data. Then the management information system
aggregates and disseminates this data for decision makings [24].
Education Management Information System
The acronym of Education Management Information System is commonly known as EMIS.
Although, reviewing from an extant literature, finding a common definition proved
challenging. Based on Cassidy, EMIS means different to different people [25]. It seems to be
all about the perspective based on the author, or the present circumstances of the setting.
There are many definitions that can be observed to complement each other, but some of them
may not cover a comprehensive definition of EMIS. EMIS has existed for decades, but
received more use after the ‘90s.
One of the definition of an EMIS provided by Wako [26, p. 3]:
“The acronym EMIS stands for “Education Management Information System”. It is a
system for organizing information base in a systemic way for the management of
educational development. It is an information center in the ministry of education
responsible for collection, processing, analyzing, publication, distribution, rendering
information services for users of educational information.”.
The problem with Wako's definition of EMIS may leave some actors in the shadows.
Considering that actors like humans play a huge role to constitute an EMIS, and in the
present event, technology has been more frequently used as well. In this case, Cassidy's
definition of EMIS shows to be more comprehensive, and has been widely referred to by
others [27]. This is the following [25, p. 27]:

29
“An Education Management Information System (EMIS) is a system for the
collection, integration, processing, maintenance and dissemination of data and
information to support decision making, policy-analysis and formulation, planning,
monitoring and management at all levels of an education system. It is a system of
people, technology, models, methods, processes, procedures, rules and regulations
that function together to provide education leaders, decision makers and managers at
all levels with a comprehensive, integrated set of relevant, reliable, unambiguous, and
timely data and information to support them in completion of their responsibilities.”
Cassidy’s definition shows to include important actors, functions and properties which may
constitute to be a more successful EMIS. Therefore, this definition will be adopted for this
thesis because of its detailed description compared to Wako’s.
The main purpose of an EMIS is to assimilate comprehensive information regarding the
management of educational activities to make it available for a variety of users. These users
are teachers, principals, curriculum planners, inspectorate officials, financial controllers,
planners, policy, adviser and political leaders. The parents and pupils are included as well.
The service provided by EMIS will benefit the entire community [28, p. 5]. The success of
EMIS consist mainly of three key factors [27]:
1. Timely and reliable production
2. Data integration and data sharing among the departments
3. Effective use of data and information for educational policy decisions.
According to Wako [26, p. 47], the challenges facing EMIS is the following:
1. Getting dedicated workers to improve the situation, and to take away control and
command type from the management in such a way it can lead to a continuous
learning environment.
2. Awareness: The purpose of having a coordination unit is to mark a significant
awareness among the actors in the ministry of education. Despite doing a good effort
on substantive work, Sub-Saharan Africa is facing a challenge when it comes to using
the educational statistics for decision making.

30
3. Budget Allotment: In addition to awareness among the decision makers and planners,
allocate necessary budget to acquire new technology, mailing data collection
instruments to schools, undertaking research and surveys will supplement statistical
results.
4. Personnel shortage: There is an inadequate amount of professionals, both in quality
and quantity. The resources required to train long term professionals in EMIS is
lacking, due to allocation of budget.
5. Overrating of the capacity of EMIS: Due to rapid change of technology and
coordination of information systems for education, has led to a need for short and
long term training of personnel. The EMIS personnel need to train themselves before
they can produce. This is somehow overlooked by the decision makers within the
ministry.
6. Training: Due to rapid change of technology, adapting to these circumstances takes
time for the professional EMIS worker. It requires time to gain this knowledge, and is
often overlooked by the decision makers.
SMIS
School Management Information System (SMIS) is an application for managing school and
pupil information [29, p. 37]. According to UNESCO, SMIS refers to the school-side
information system and can be established as a web-based extension for EMIS. The SMIS is
an alternative system which is installed as a software on a computer and coupled with EMIS.
Through this system, the school staff can enter information, and the application
administrators should secure the determined information to be regularly reported to the
national EMIS.
SMIS aids data on individual pupils accessible at the national level and the data accessible
through the web. The web-based SMIS ensures the data to be up-to-date to provide EMIS to
reflect on the current situation based on the records. Practically, the SMIS allows monitoring

31
individual pupils and following them up. Likewise, moving from school to school or
supporting them based on their needs. The pupil attendance application used in this thesis is
by definition a SMIS.
Conceptual Framework
User Experience
User Experience (UX) is described as the name says, the experience from the user. UX
concerns all the aspects of the user’s experience when interacting with the product, service or
facility [30]. To illustrate the UX, we can use a website as a term. The UX will concentrate
on how the user is feeling happy before, during and after using the website. To elaborate even
further, we can try phrase UX as a question [31]:
- Did the user have a pleasant experience with the visit of the website?
UX is a consequence of the presentation, functionality, system performance, interactive
behaviour and assistive capabilities of the interactive system [31]. To further explain the
definition easier, the UX deals with interaction between the design and the user.
User Interface
User Interface (UI) is what the user sees, hear, touch, talk to or control and direct [32].
Shihong also explains that UI is often “the product” and further allows the user to see and
may make their decision on. The UI can be described as interaction or communication
between human (user) and device. Objects like display screen, keyboards, a mouse and the
appearance of a desktop are parts of the UI.
Usability
There are many definitions of the term, “Usability”. The definition could be either technical
or general described. Usability refers to, “Ease of the product, and includes Graphical User
Interface (GUI) but everything else that touches the user” [32]. Another definition refers to,
“Usability extent to which a system, product or service can be used by specified users to
32
achieve specified goals with effectiveness, efficiency and satisfaction in a specified context
of use” [33]. These two definitions can be used interchangeably because both refers to give
the users satisfaction and to accomplish the desired goal. Usability is commonly known as
“ease-of-use” or “user-friendliness”, but it is broader than that.
Jakob Nielsen explained usability more as a framework, which is: “Usability is a quality
attribute that assesses how easy user interfaces are to use. The word "usability" also refers to
methods for improving ease-of-use during the design process” [5]. The quality attributes are
learnability, satisfaction, effectiveness, efficiency, memorability, and errors. Nielsen further
explained usability as a part of usefulness and includes utility for the explanation. Utility is a
quality attribute likewise usability, but the utility refers to the functionality of the design.
While usability concerns how easy and pleasant these functions are [5]. To explain
furthermore, the utility will ask whether the product provides the features you need, and
usability refers to how easy and pleasant these features are to use. Utility and usability
together will determine how useful the product is.
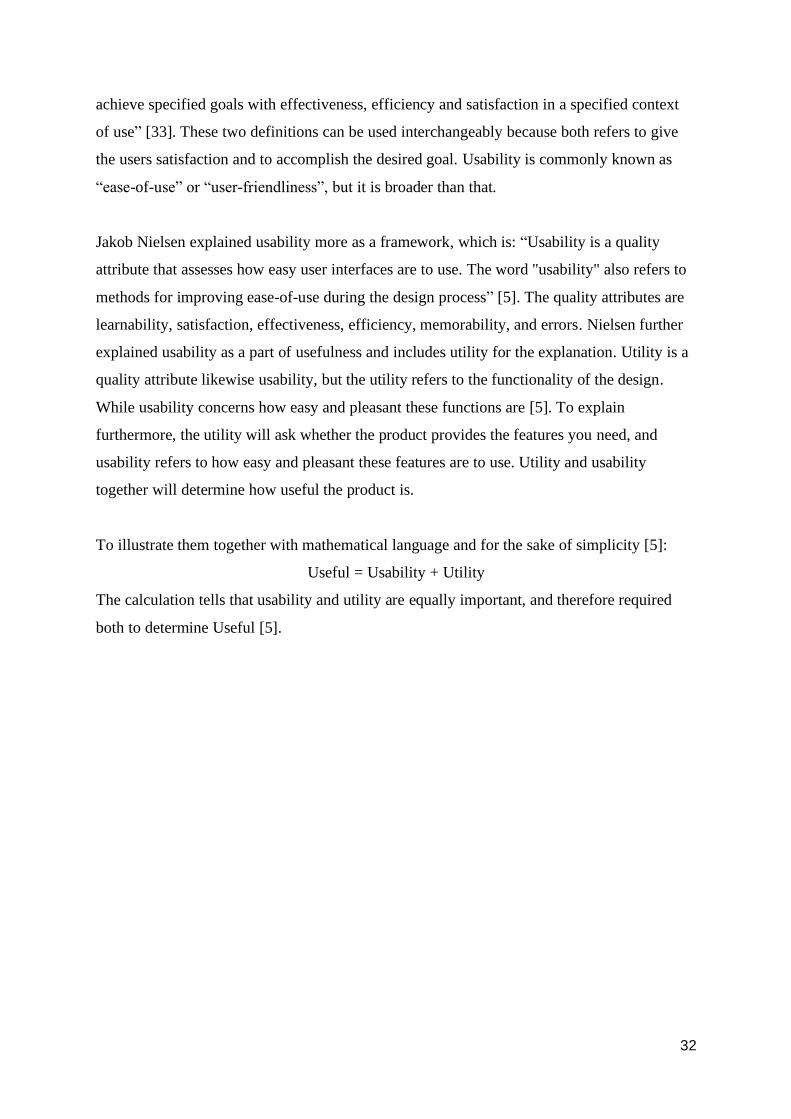
To illustrate them together with mathematical language and for the sake of simplicity [5]:
Useful = Usability + Utility
The calculation tells that usability and utility are equally important, and therefore required
both to determine Useful [5].
33
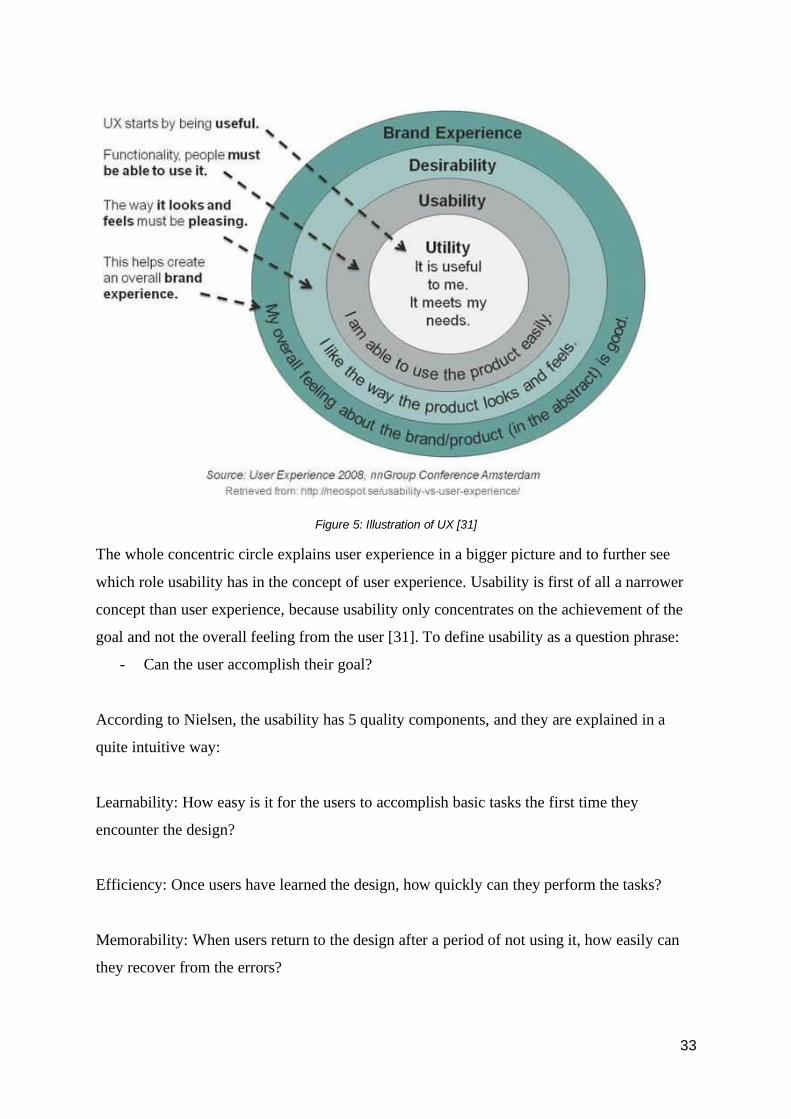
Figure 5: Illustration of UX [31]
The whole concentric circle explains user experience in a bigger picture and to further see
which role usability has in the concept of user experience. Usability is first of all a narrower
concept than user experience, because usability only concentrates on the achievement of the
goal and not the overall feeling from the user [31]. To define usability as a question phrase:
- Can the user accomplish their goal?
According to Nielsen, the usability has 5 quality components, and they are explained in a
quite intuitive way:
Learnability: How easy is it for the users to accomplish basic tasks the first time they
encounter the design?
Efficiency: Once users have learned the design, how quickly can they perform the tasks?
Memorability: When users return to the design after a period of not using it, how easily can
they recover from the errors?
34
Errors: How many errors do users make, how severe are these errors, and how easily can they
recover from the errors?
Satisfaction: How pleasant is it to use the design?
Jakob Nielsen 10 Usability Heuristic for User Interface Design:
Jakob Nielsen has developed 10 usability heuristics in cooperation with Rolf Molich. These
heuristics are based on factors of 249 usability problems and the 10 usability heuristics are
behaving as rules of thumb rather than guidelines [34].
1. Visibility of system status
• The system should always keep users informed about current state and actions
through appropriate visual cues and feedback within reasonable time.
2. Match between system and the real world
• The system should speak the users’ language, with words, phrases and
concepts familiar to the user, rather than system-oriented terms. Follow real-
world conventions, making information appear in a natural and logical order.
3. User control and freedom
• Users often choose system functions by mistake and will need a clearly
marked “emergency exit” to leave the unwanted state without having to go
through an extended dialogue. Support undo and redo.
4. Consistency and standards
• Users should not have to wonder whether different words, situations, or
actions mean the same thing.
5. Error prevention
• Even better than good error messages is a careful design which prevents a
problem occurring in the first place. Either eliminate error-prone conditions or
35
check for them and present users with a confirmation option before they
commit to the action.
6. Recognition rather than recall
• Minimize the user’s memory load by making objects, actions, and options
visible.
7. Flexibility and efficiency of use
• Accelerators - unseen by the novice user - may often speed up the interaction
for the expert user such that the system can cater to both inexperienced and
experienced users. Allow users to tailor frequent actions.
8. Aesthetic and minimalist design
• Dialogues should not contain information which is irrelevant or rarely needed.
Every extra unit of information in a dialogue competes with the relevant units
of information and diminishes their relative visibility.
9. Help user recognize, diagnose, and recover from errors
• Error messages should be expressed in plain language (no codes), precisely
indicate the problem, and constructively suggest a solution.
10. Help and documentation
In connection with answering the research question, the research of Nielsen Norman Group
has been adopted to identify the essential usability aspects for the application. Since the
research question empathizes with the essential usability aspects, one needs to understand
what usability is. In terms of explaining usability, I had to include user interface and user
experience to see the whole picture. The five usability quality components will be used to
measure and research the application. In addition to including the 10 usability heuristic to see
the relevance with the encountered issues.
36
Methodology
This section will cover methodology and procedure within my master thesis. The choice of
methods will be presented, as well as a clarification as to why the method is a suitable choice
for the purpose. Project summary will be presented first before I describe the use of
methodology. The section will also outline methods used during observation in the field.
Project Summary
As I explained earlier in the Research Question chapter; The main focus of this thesis is to
explore and observe the pupil attendance for EMIS to further uncover essential usability
aspects for the application.
The project started in the beginning of 2019 with meetings with the supervisor and his team.
During this time of period, it was essential for me to join meetings and workshops with the
supervisor’s team, since a clarification and an insight of the project is needed for me to
understand the domain. The following year, I had a meeting with two girls from NTNU to
present us the current EMIS system in The Gambia. During the DHIS2 Annual Conference,
the leader of MoBSE met me to further discuss the project and when I could commence an
observation in The Gambia.
As the project was during the pre-pilot phase, factors like limitations were to be expected. I
had to switch from my first approach with Action Design Research (ADR) to a Case study.
Because the first study was to research a Progressive Web Application (PWA) that could
benefit the context of study. I could not contribute to this study since they had an application
going, and it made more sense to observe this instead of reinventing it. Therefore it was more
appealing for me to change the research method to a Case Study, to explore for the essential
usability aspect with the current pupil attendance application. This application was ready to
test with the user, and I could observe the design and how it works.
Primarily, the visit to The Gambia was planned to be on several trips, but I ended taking one
trip and it lasted for three weeks. Because we thought three weeks should be sufficient for the
study, but it was shown to limitate the study in a later time. The importance during the field
study was to collect data regarding usability aspects in terms of Nielsen Norman Groups
37
definition of usability. Usability refers to “ease-of-use” within the system and I had to
observe the users of the system to see how they behave during data entry.
Research Method
Qualitative research
According to Robert K. Yin, there is a challenge to arrive at a singular definition of
qualitative research. Many disciplines will be left in the shadow, given the definition is too
short. Supposing the definition is too broad, it may be useless globally [35, p. 7]. Yin
furthermore compares the qualitative research in line with sociological research,
psychological research, or education research.
Based on Robert K. Yin, one should consider what features are involved in qualitative
research [35, p. 7]. First of all, qualitative research is used to study the meaning of people’s
lives, under real-world conditions. Secondly, to represent the views and perspectives of the
participants in a study. This means that qualitative research can capture the people's
perspectives who live in the context to further represent the real-life events. Lastly, sources of
evidence like observations, interviews and inspections of documents and artifacts are part
of a qualitative research. These sources of evidence are used to study real world settings and
the participants within it.
Case study
Case study is a research methodology, typically in social and life sciences. There is no one
definition of case study research. Depending on the field of interest, the case study gives the
investigators the opportunity to focus on a “case” and retain a holistic and real-world
perspective such as managerial processes, school performance, international relations and
maturation of industries [36, p. 2].
The first definition provided by Yin, can be simply explained as a study of the meaning of
people’s lives, under real-world conditions. What people perform in their everyday roles and
express them is individual based on the setting and circumstances they are in. The qualitative
38
research has an ability to capture their perspective and represent the real-life conditions.
Furthermore, qualitative research has an impact to cover contextual conditions when it comes
to people's social, institutional, and environment conditions [35, pp. 7-8].
A case study can be either descriptive, exploratory and explanatory. It can further be designed
such as a single or multiple case, depending on the research. The case study is applicable to
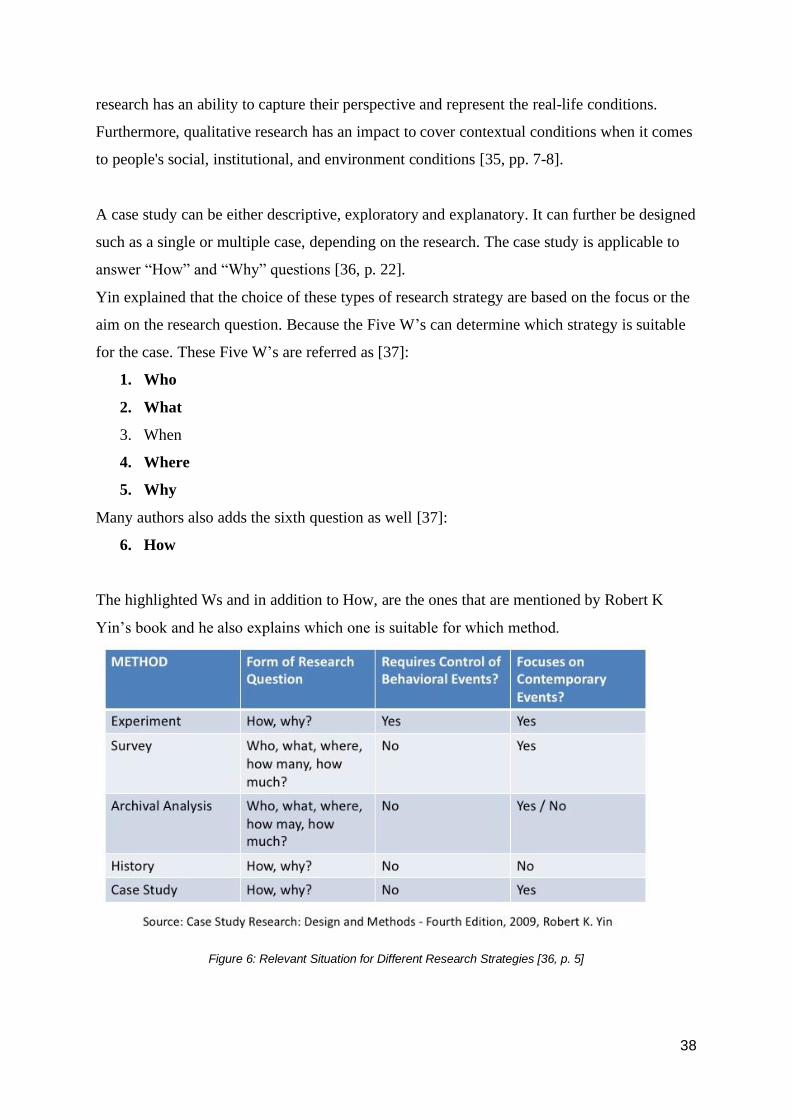
answer “How” and “Why” questions [36, p. 22].
Yin explained that the choice of these types of research strategy are based on the focus or the
aim on the research question. Because the Five W’s can determine which strategy is suitable
for the case. These Five W’s are referred as [37]:
1. Who
2. What
3. When
4. Where
5. Why
Many authors also adds the sixth question as well [37]:
6. How
The highlighted Ws and in addition to How, are the ones that are mentioned by Robert K
Yin’s book and he also explains which one is suitable for which method.
Figure 6: Relevant Situation for Different Research Strategies [36, p. 5]
39
However, my research questions are mainly focusing on “What”, and Yin explains that some
“What” can be justifiable rationale to be conducted as an exploratory case study, as long as
the goal is to develop pertinent hypothesis and proposition to further inquiry [36, p. 5]. My
study will in the best effort give propositions to further be inquired or to be used for future
research.
As mentioned, the case study can be designed as singular or multiple (multiple methods), and
the singular was the suitable choice for me. Since multiple case studies concentrate on a
larger study, which include quantitative data, and my data collection does not provide any
quantitative data [36, p. 150]. Thus, creating a multiple would be difficult for my case.
The study is focusing on the social interaction between humans and computers, in addition to
some degree, a study of individuals and groups [36, p. 1]. A case study will then be a suitable
choice for this study.
According to Robert K. Yin [36, p. 13]:
A case study is an empirical inquiry that…
“...investigates a contemporary phenomenon within its real-life context, especially
when the boundaries between phenomenon and context are not clearly evident.”.
For my thesis, an exploratory case study is a fitting choice to help me answer the proposal
research question. Because I do not know much about the domain and therefore exploring the
field is essential for me to get a clearer picture of the study. I am exploring the essential
usability aspects for a pupil attendance application, and being in the field to observe social
phenomenon and the behavior between the user and the interaction with the application is
needed to understand more of the domain. Even more so to achieve better evidence to which
aspect of usability is important for the pupil application.
40
Data collection methods
There are six sources of evidence according to Robert Yin, and some of them were mentioned
in the Qualitative Research section. A case study would benefit by including as many
sources of evidence as possible. Because the sources of evidence encompass their own
strength and weakness, in fact, combining the various sources will balance the strength and
weakness together.
The six evidence consist of documentation, archival records, interviews, direct observations,
and physical artifacts. The list is also extensive by including films, photographs, and
videotapes [36, p. 85].
I used pictures, interviews, observation and some documentations for the thesis. The
following section will elaborate the evidence and findings, and justification of why I chose
the methods and data gathering methods.
Pictures
I used pictures to document or analyze in connection with the application. Oral consent was
followed before the pictures were taken. These images are mainly for recreating a memory of
the situation and to document them as evidence. The camera was used at the MoBSE and at
the school visits. I avoided taking pictures with peoples faces since it requires a formal
written agreement and an oral agreement would not be sufficient. The pictures were taken by
mobile phones and the device was a Samsung S8. In conclusion, these pictures are used to
document my observation and for the readers to see what I saw.
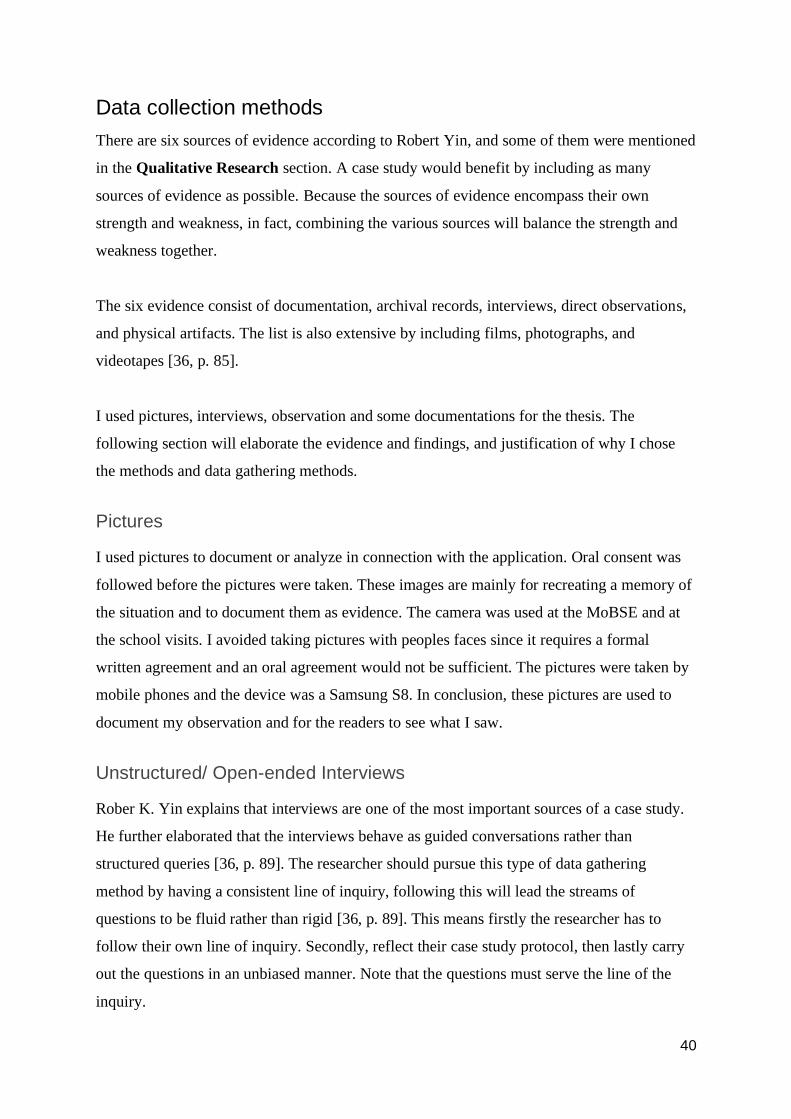
Unstructured/ Open-ended Interviews
Rober K. Yin explains that interviews are one of the most important sources of a case study.
He further elaborated that the interviews behave as guided conversations rather than
structured queries [36, p. 89]. The researcher should pursue this type of data gathering
method by having a consistent line of inquiry, following this will lead the streams of
questions to be fluid rather than rigid [36, p. 89]. This means firstly the researcher has to
follow their own line of inquiry. Secondly, reflect their case study protocol, then lastly carry
out the questions in an unbiased manner. Note that the questions must serve the line of the
inquiry.

41
The way I conducted the interview was unstructured interview/open-ended and the reason is
quite simple; the direction of the interview should be as freely as possible. It was utmost
important for me to safeguard the person’s integrity during and after the interview. Thus, I
distanced from taking sensitive information and anonymized people that were involved. Due
to my knowledge of the domain and being inexperienced as a researcher, the design of the
questions did not fully conventionally follow the guidance provided by Robert K. Yin. He
even suggested the question to be designed to answer “why”. Thus the nature of a “why” has
a relevance to might impose a friendly and non-threatening approach as the researcher
converse with the participants [36, p. 90]. However, many of my conversations did in the best
effort to give the participants a feeling of openness and thereby could elaborate more freely.
Collections from observations gave me a wide variety of data, and the interviews I conducted
will provide a deeper understanding of the domain for the research. In addition, the
interviews allowed me to gain more insight about our research topic and to see a relevance
with my observations. Unstructured interviews are flexible as the question can be adapted,
based on how the responder answers. The unstructured interviews can be seen as “guided
conversations” in preference to strict structured interviews [38]. Thus, when conducting an
unstructured interview, the interviewer does not have any predetermined set of questions.
Instead the interviewer asks more open-ended questions and changes adaptively depending
on the participants' answers in addition to preserving the topic. At first glance, designing
predetermined queries was not feasible due to my insufficient knowledge of the domain. For
this reason, unstructured interviews were a suitable choice since I had to explore and try to
gain more insight to better understand the field of study.
Observation
The main data gathering I used in this study was observation. The observation method used
for this thesis was Direct Observation. Robert K. Yin explained the direct observation as a
passive observation [36, pp. 92-93]. He also stated that this form can be used during
observing meetings, sidewalk activities, factory work, classrooms, and the like [36, p. 92].
Since the definition was less clear, I had to include an addition definition [39]:
“Direct observation is distinguished from participant observation in a number of
ways. First, a direct observer does not typically try to become a participant in the

42
context. However, the direct observer does strive to be as unobtrusive as possible so
as not to bias the observations. Second, direct observation suggests a more detached
perspective. The researcher is watching rather than taking part…”
This method was conducted because I want to set “a wall” between me and the participants.
Reasonably, I wanted the some involvation to be as neutral as possible and to give a space for
the participants to behave naturally. In some situation, I had to be involved to understand
more about the users during data entries, and factors involved within the application. One has
to put themselves “in their shoes” and at the best effort try to experience events in the way
they experience them.
During the stay in the Gambia, I observed following to potentially find the essential usability
aspects:
● The internet capabilities
● The pupil attendance application, DHIS2 for education
● Data entries during school visits.
● Questionnaires
The observation generated most of the data collection, and the main source of data is from
school visits and the meetings. Because the data entry was being used in the schools, and it
makes sense to conduct an observation here. As foretold, I was involved in some situation
because I had to participate with the participants to uncover the advantages and disadvantages
with the application. It was reasonable for me to be in their shoes to understand their
perspective when using the application. Because it is different how we perceive and solve the
task. Therefore, it was important for me to collect the data from the available users to further
see the bigger picture.
Albion was the first school I visited, and MoBSE had some preliminary work before
involving me. During meetings without my involvation, I made sure to not interrupt in any
way between the accountable from MoBSE and the headteachers. It was inevitable for me to

43
be unseen by the participants, in consequence of that, the direction of the meeting may be less
natural. Despite the consequence, the accountables from MoBSE introduced me before and
during the meeting, to ensure the headteacher that accompaniment was to be expected. I felt
that the outcome of the meetings was natural because of the initiative by the accountable
from MoBSE. Subsequently, I documented as much as possible during these types of
meetings and wrote down questions if I found some parts being misleading. The goal from
these meetings was to gather data regarding the pupil attendance.
I had a master student from UiO that accompanied me during the stay in The Gambia. He
contributed to the same research, and we cooperated with the data collection. We were two
when the observation went on, and it allowed us to discuss our individual perceptions and to
further compare our findings. Generally, the first visit to the school was more or less just
meetings and distributing questionnaires for the pupils to fill. Usually, the pupils get a couple
days to fill the questionnaires with their parents, but one must expect some delays. The
observation was noticeable during the second visit to Kabafita SSE. It was an initiative
suggested by the headmaster of this school and he decided to use ninth grade for the pilot. He
requested us to be present while the pupils were filling the questionnaires, supposing that
some terminologies could be misunderstood and we could elaborate to them. We had a
conversation with the leader of MoBSE at the end of the trip. In this conversation, we
delivered him our thoughts with the encountered issues. In a later time, we also sent him and
his team a comprehensive report regarding our observation with the application.
Data sources/ Involved Actors
Interviews and observations served as my main sources for data collection. Both sources
came from MoBSE and urban schools.
Documentation
In addition to observation, interview and pictures, the MoBSE provided me with presentation
and documentation regarding pupil enrolment and attendance. The MoBSE distributed me
with questionnaires (See Figure 9 & 10) and presented their current - and - shift of EMIS. I
will use some of their documentation to answer my assumptions of which aspects of usability
are essentials for the pupil attendance.
44
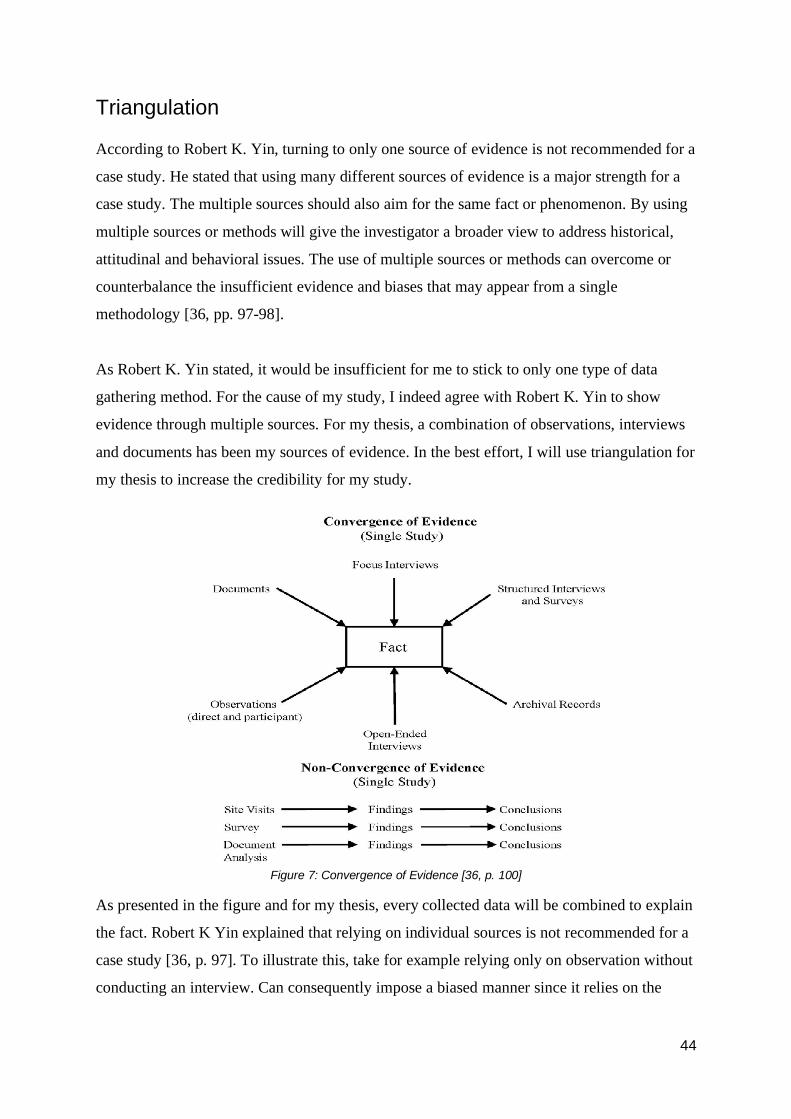
Triangulation
According to Robert K. Yin, turning to only one source of evidence is not recommended for a
case study. He stated that using many different sources of evidence is a major strength for a
case study. The multiple sources should also aim for the same fact or phenomenon. By using
multiple sources or methods will give the investigator a broader view to address historical,
attitudinal and behavioral issues. The use of multiple sources or methods can overcome or
counterbalance the insufficient evidence and biases that may appear from a single
methodology [36, pp. 97-98].
As Robert K. Yin stated, it would be insufficient for me to stick to only one type of data
gathering method. For the cause of my study, I indeed agree with Robert K. Yin to show
evidence through multiple sources. For my thesis, a combination of observations, interviews
and documents has been my sources of evidence. In the best effort, I will use triangulation for
my thesis to increase the credibility for my study.
Figure 7: Convergence of Evidence [36, p. 100]
As presented in the figure and for my thesis, every collected data will be combined to explain
the fact. Robert K Yin explained that relying on individual sources is not recommended for a
case study [36, p. 97]. To illustrate this, take for example relying only on observation without
conducting an interview. Can consequently impose a biased manner since it relies on the

45
researcher's subjective judgement. Therefore, my analysis will in the best effort keep the
convergence of evidence.
Data analysis
This section will outline how I performed the analysis. The data collection has been
qualitative which consist of interviews, observations and field notes. Data analysis can be
summarized by using examination, categorizing, tabulating, testing [36, p. 109]. In addition
to combining qualitative and quantitative evidence(triangulation) to address evidence in the
study. It is noteworthy to mention that the edition I used for this thesis is threatened to be
outdated, and therefore I would attempt another analysis method than proposed by Robert K
Yin. Due to my data collections’ insufficiency, and my inexperience as a researcher, I had to
choose an analysis method that will fit my data and correspond to my ability as well.
Initially, these collected data are raw information thus needed to be processed to further make
sense. There is a lot of raw information which needs to be narrowed down and finding
patterns within the data, and to further identify the themes of these data. Firstly, I transcribed
interview notes, compiled the field notes and photos, and from this point it was possible for
me to try out coding. Secondly, there was no record of audio during the interview, because I
felt without it could make the conversation more free. Lastly, the analysis method chosen for
my thesis is Thematic Analysis.
What is Thematic Analysis?
Thematic Analysis was originally developed by Virginia Braun and Victoria Clarke for
psychology research [40]. This method is used for analyzing qualitative data, and due to its
flexibility, it can be adapted to many different kinds of research. Thematic analysis allows the
researchers to find out something about people’s views, opinions, knowledge, experiences or
values from a set of qualitative data [40].
There are two approaches when conducting Thematic analysis:
1. Inductive involves allowing the data to determine your themes

46
2. Deductive involves coming to the data with some preconceived themes you expect to
find reflected there, based on theory or existing knowledge.
I had some preconceived themes developed by Nielsen Norman Group during my research.
These themes involve using the usability attributes from Conceptual Framework.
Subsequently, after choosing between inductive and deductive, the researcher should decide
between semantic and latent approaches.
1. Semantic approach will focus on people’s stated opinion
2. while Latent approach tends to in revealing their statements about their assumptions
and social context.
I focused on the users’ opinions during field study in The Gambia to uncover the essential
usability aspects. In summary, this thesis will use deductive with semantic approach to
analyze the data collections.
NVivo 12 is a tool for organizing, storing and analyzing the data collection. The tool is
specialized for qualitative research, thus the structure from qualitative is less structured
compared to quantifiable research. The interviews, video tapes, surveys with open answers
and so on, are categorized to be less structured data [41]. I chose to use NVivo 12 to analyze
my qualitative data and to categorize the codes.
47
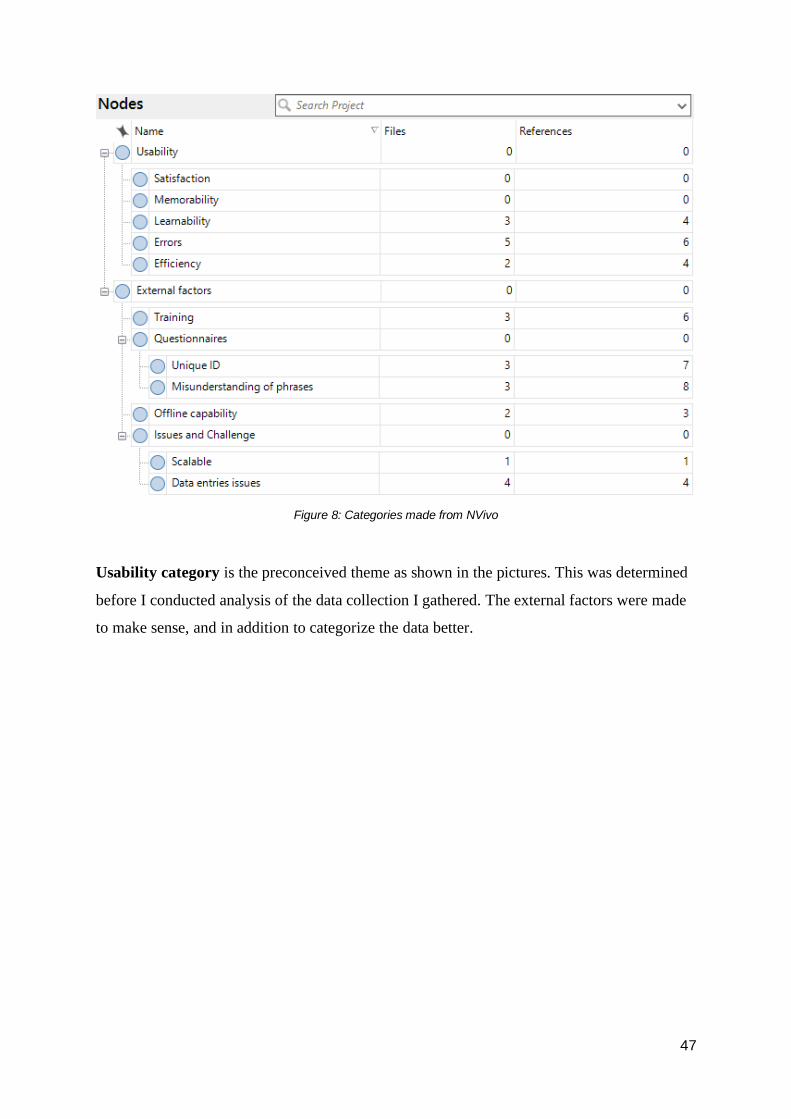
Figure 8: Categories made from NVivo
Usability category is the preconceived theme as shown in the pictures. This was determined
before I conducted analysis of the data collection I gathered. The external factors were made
to make sense, and in addition to categorize the data better.
48
Reflections of data collection
This section will reflect my data collection and to justify the chosen methodologies.
The Gambia has a cultural and social difference compared to Norway. Thereby, remaining
flexible and adaptable during field study in the Gambia was ideal for me. Sometimes,
unfortunate situations can occur and it can lead to plans being adjusted. The circumstances
may be under effect of change and political conditioning may result in the absence of relevant
actors. I was aware that changing my intended plans may occur and by any means, adapting
to the situation was necessary. The original plan was to travel to the Gambia on several
occasions, thus reassessment of plans had to occur whereas delays and limitation factors
became a part of the picture. Despite being able to travel several times, I ended up with one
trip in three weeks. Then again, this inflicted my data collection and constrained my
understanding to the field. Based on my knowledge and the experience of the domain, it was
difficult for me to take the advantage of the timeframe given to me. By reflecting on the
timeframe, it would be beneficial for me to collect data in several trips to the Gambia. As a
consequence of collecting the data in one trip, I lost the opportunity to reflect over the data
collections and to plan for the next approach for data collection purposes.
The outcome of results depends on my data collection and how I proceed with the research.
The methods I use would affect the result and the evidence of the study. Qualitative research
cannot generalize populations at large by itself. The reason being that qualitative research
majorly focuses on a small population in contrast to quantitative with a wider population.
Assumptions cannot be made from data collection beyond a small population [35, p. 226].
Following, by combining qualitative and quantitative will increase the validity and reliability
of the research and to further generalize the study. Due to the fact that quantitative data
provides a macro view with larger samples and in addition to enable the conclusion to be
generalized by combining those two research methods. This in fact will comply with
triangulation, hence multiple sources can overcome and counterbalance the weakness of
qualitative and quantitative by itself.

49
Empirical Findings
This chapter concerns the practical use of DHIS2 application with the users from the chosen
schools. The chapter will start with an introduction of network capabilities in The Gambia,
followed by how I prepared the training for the users. Subsequently, a description of what
went wrong during observation and a comparison with the issues I experienced and how the
users felt. This chapter will concern every part that is necessary for the application to be
useful.
Network capabilities
The network access is very poor compared to Norway. However, The Gambia have access to
4G network, but we can discuss if the price is efficient for a long term strategy for a low
resource school. During the visitation, I subscribed to a monthly subscription by Africell with
4mb/s speed for internet access. The 4G was working fine in the area I spent the night (Bijilo)
and in Banjul (MoBSE office and Albion School). I observed that the internet connection was
unstable, seeing that when I crossed the transition from town to town. Even so, the school I
visited had neither WIFI or 4G dongles to access the internet.
Online/Offline feature:
The application lets the users perform daily tasks without internet connections. As long as
there is no internet access, the laptop will stay offline and the user can do the task without
being dependent on the internet for the functions to work. The online function was only used
when the MoBSE needed to collect data. The data from Chromebooks will synchronize to the
web and will be available in the browser for the MoBSE. To synchronize the data, the
accountable from MoBSE must bring a 4G dongle to access the internet since the schools
don't have WIFI. This feature was founded to be very essential for The Gambia and it could
be the same for the corresponding countries.
I knew from my prior preparations that accessing the internet could be a challenge to some
degree. I wanted to follow up the fact by experiencing the access and even more to confirm
the expectation. The lack of resources to access the internet could be a challenge for the data
collection to be timely and efficient for the educational sector. Online/offline function for
pupil attendance is one of the solutions used in the Gambia to support against poor internet
50
access. I also had the opportunity to test and document the online/offline feature. The
Chromebook will stay in offline mode until they get connected to an internet source. Online
function was used when MoBSE came for data collection and they had to bring a 4G dongle
to transmit the data to the internet.
Preparations and Training
I did preparation in University in Oslo (UiO) before I travelled to The Gambia. I attended a
workshop with the HISP/EMIS team to understand more of the domain. My supervisor made
sure that I got the relevant information before the visit. It was not possible for me to explore
the application during my time in UiO.
I got access to the application through the first day at the MoBSE office. A demonstration of
the application was provided by the MoBSE. The purpose of the preparation was to retrieve
data regarding usability. I evaluated the application through 5 quality components based on
the definition of usability provided by NNGroup. It was to some degree sufficient for me to
evaluate learnability, errors, efficiency and satisfaction during the first time encountering the
application. Evaluation of memorability was not feasible since I had to be absent from using
the application. Because memorability is based on how easy it is to re-establish the use when
encountering it after a while.
The data of the most interest to me, was to register the pupil attendance and enrolment.
Reason being that usability deals with whether the goal is achieved. The goal in this case was
if I could register the pupil. Secondly, I gather data related to misunderstanding of phrases
and features that I did not understand. I wanted to see if other users experienced the same as I
did. The last objective in preparation was to test how the error handling behaved. This was
tested through checking of duplicate data and to provoke an error. I left some questionnaire
fields empty, wrote the same pupil twice and so on in an attempt to provoke an error.
I kept the preparation quite simple because I needed to reflect over my assumptions with
other users and to see if I can encounter other issues. My intention was to approach
cautiously and in my best effort try not to miss any important data as I visit the schools.
51
Questionnaires
NOTE: See Figure 9 & 10.
The questionnaire was used to gather data regarding the pupil biological and socio
information. These questionnaires are paper based and we distributed the papers to each
school to collect data from pupils. They had a couple of days to fill in the papers and deliver
the forms for data entries.
To begin with, these questionnaires had been a main tool to collect data from pupils regarding
their socio-economics and biological information. The old system is all paper based while the
new one deals with a combination of paper-based and digital solution. They transfer the
provided data from questionnaires(paper-based) to the Application(Digital solution). While
the old solution was transferring the questionnaires to the books provided by MoBSE.
The books collected the following information:
School admission register:
School admission register is for enrolment data.
The school admission register is known as The Exercise book
Pupil attendance register
Pupil attendance register is for daily attendance data.
The form within the application in Chromebooks is a mimic of the questionnaires. As I
mentioned earlier about the function of the questionnaires, the teacher had to transfer the data
from paper to a computer. The report from an earlier visit conducted by two master students
says that the teacher felt transferring data from paper to data was time consuming with the
prior system. This demand made by the Ministry showed in a later time that the teachers
ended up only using the exercise book.
52
Unique identification of Pupils
Unlike in Norway, The Gambia does not have a national ID for the population, thus the
teachers/users had to manually generate an ID for each pupil. These Identification numbers
are unique, and will follow the pupil throughout the entire education.
The enrolment is divided in two cases: New student/existence and transfer students.
According to the Student Admission Profile paper and the information MoBSE provided to
me; Old Student registration numbers are used for transition pupils, then School admission
numbers and Unique Student registration numbers are for New and existing students. Even if
the enrolment is divided in two cases, the MoBSE are determined to keep one of them for
future related registration. Since the system is under changing and existing students are
already enrolled, thus they had to keep the old registration for that purpose.
Enrolment:
Re-admission(Old registration method)
Contains indicator:
Old SRN(Old Student Registration Number)
Name of previous School
School code
Last class attended
Date of leaving
New admission fields(New registration method)
Contains indicator:
School admission number
Unique SRN(Student Registration Number, generated by EMIS)
It was discussing how they should generate the unique Student ID, either as manual filling by
the users or for the application to generate automatically. Either way, there were some quick
solutions since the project was under a pre-pilot phase. The MoBSE suggested that we format
the Student ID as followed:
53
1: Five numbers for school code
2: Four numbers for the enrolment year
3: Three numbers for the Student ID
These numbers are combined/merged and will be the unique ID for the pupil. The first five
numbers will identify the school the pupils are enrolled in. Subsequently, the next four
numbers are to identify the enrolment year. Lastly, the final three numbers will be the pupils
ID numbers. The Student ID numbers are generated based on their position in the registration
queue, by meaning, the first pupil will get number 001 and the next 002 and this will go
ascending.
(11111)(2222)(333) ⇒ 200102016001
Once again, generating the Student ID is manual work for the users (Teacher, IT
accountable).
School observation
This section will describe the pupil attendance application during observation. What went
well and issues within the application throughout the observation. As mentioned in Chapter 5,
two schools were chosen as pilots and I observed them on two occasions. The objective on
the first visit was to clarify the purpose of the pilot and to train the staff. The second time was
to collect data regarding accomplishment of registration and collect data regarding incoming
issues. Both schools were urban and not rural.
Albyon
This school is located in Banjul and in the neighbourhood of MoBSE. Since Albyon was
close, it was more convenient to prioritize this school before the other schools. The MoBSE
had already started their work before involving me. Usually, the first visits were more or less
just for introductory purposes. Since MoBSE already launched the pre-pilot in Albyon, there
was not much new information to be gained on the first visit. Despite the current situation, it

54
was attainable for me to collect data regarding user interaction and usability terms during this
visitation.
During the first attempt with the application, I found adding a new pupil was not quite
intuitive and I felt a need to verify this issue with the users. The accountables for daily and
enrolment registration in Albyon could verify my assumption. In contrast with this issue,
once we knew how the add function worked, it was intuitive for us to use it.
The second approach of Albyon
Albyon experienced a delay on gathering the questionnaires from the pupils. However, we
did a synchronization with the current data to inspect for further issues. It was registered
duplication on some pupils and the accountable from MoBSE had to do some quick fix to
ensure the synchronization went through. The synchronization will not allow any
transmission of daily attendance and enrolment if the data entry is wrong.
I asked the IT accountable from this school whether they had experienced any issues that
could stagnate their workflows. They explained to me that navigation with only a trackpad
was not very efficient, and they felt using cursors and TAB to navigate to the next field
could make the work more efficient. Despite that issue, they told me that they believed the
system would be of aid.
Kabafita
The Kabafita is an urban school and is located south of Banjul. The school is divided in two
parts, Lower Basic School and Secondary School Education. Both schools were next to each
other and there were only walls separating the two schools. This school had not had data
collected by MoBSE previously, which was an opportunity for me to collect the data from
scratch. The accompaniment from MoBSE suggested that I took control and tried in my best
effort to direct the introduction of the pre pilot to the Kabafita schools.
Kabafita LBS
The lower basic school consists of 1-7 grade and is somewhat similar to the Norwegian grade
school system. The headteacher of the school was absent during my visitation, but had been
55
notified in advance of our presence there. The deputy headteacher was the stand in and
helped me arrange a meeting with other accountables of the school. A young teacher was
chosen by the deputy headteacher to be responsible of the application training. There were
also two teacher pupils from the Netherlands during this meeting. The purpose of this
meeting was to train the users to be capable of entering the data to the application. I
distributed 45 questionnaires to this school among the fifth grade pupils.
Kabafita SSE
The secondary school education consists of 8-12 grades and I visited them right after
Kabafita LBS. The headteacher and a teacher were present during this meeting. In similarity
with the recent visit, I introduced to them the intention of the pre-pilot. Kabafita SSE chose
the ninth grade for the pre-pilot. Usually during these meetings, I provide the questionnaires
and then leave, because the pupils need time to fill these questionnaires with their parents or
guardians. Despite the usual routine, the headteacher suggested that the pupils should fill the
questionnaires while I was present. He argued that I could elaborate to them in case of
misunderstanding. Accordingly, the headteacher ensured that I had a teacher to accompany
me.
This suggestion was unique in comparison with the method MoBSE suggested. I found the
suggestion from the headteacher reasonable, since I could collect data regarding timeliness,
misinterpretation of concepts and how these questionnaires worked in practice. It turns out
that the questionnaire was confusing for some pupils. Fieldnames like “Distance from School
(in KM)”, “Mentally Challenged?” and “How long did it take you to get to school(minutes)
were a recurring confusion during the observation.
The second approach in Kabafita
The Kabafita LBS was delayed and we could not gather any data from this school. On the
other hand, Kabafita SSE finished their data entry and was ready for synchronization. There
was registered duplication of data during synchronization and some invalid data entries.
Again, the accountable from MoBSE had to do some quick fix to get rid of duplication of
data. Duplication of data occurred usually when the user is registering the pupil’s Unique ID,
56
and this occurred in Albyon as well. Subsequently, we had a problem with another data field.
The problem started first from the questionnaire field. I will discuss this issue in Result,
section Errors during data entry, case 1.
Conclusion from visit
I wanted to observe the use and collect data regarding usability from the users. These users
are working in the schools, their thoughts and perceptions are relevant data as well. Since
these users are entering the data to the application, would it be natural for me to focus on
them. I sympathize that errors are to be expected during pre-pilot and the application is not
fully developed yet. However, I learned a lot during these visits, and I could observe where
the users misinterpreted the application. Subsequently, a visit to a rural school would benefit
my study to map essential usability for them as well.
There is a weakness with the suggestion provided by the headteacher of Kabafita SSE,
besides for being quite efficient. Many of these fields are not sufficient to be filled by the
pupil themselves. For example, the health data should be filled by their parents/guardians or
with a certified health personnel because it is mostly unlikely that a young pupil knows every
detail.
57
Result and analysis
This chapter presents the result derived from the outcome of Empirical Findings and data
analysis. My contribution and evaluation of the pupil attendance application was during pre-
pilot. The following section will also present the essential usability aspect that is found from
the analysis. Many essential usability aspects are still left uncovered.
Offline capability
I described in the previous chapter the lack of continuous access to the internet, and the fact
remains the same. The school does not have access to WIFI. The lack of resources is limiting
the schools from reporting attendance daily and they strive to utilize the very few resources
they have. Due to a strict budget, adding an additional cost by having Internet access in every
school may be costly for them in the long term. In addition, some areas may not gain access
to WIFI or 4G due to poor Internet infrastructure. The ministry has a solution to support them
with a 4G dongle for that purpose. The schools can connect through the dongle to transfer the
collected data. This solution did capture my attention as it solves the connectivity problem for
the schools. The offline mode is a very important function for a pupil application to be useful
with the same context as The Gambia. The offline function lets the user complete entry of
enrolment and attendance data, and the collected data will be stored locally until they
transmit to the web. This solution showed me that the application can somehow simulate a
“real time” daily attendance, despite the data not being transmitted on the same day.
Questionnaires
I explained in the earlier chapter the content of the questionnaires, and how they were used
during field study. The questionnaires have purposes and goals, which means there is
usability within these questionnaires. These papers are for enrolment data, biological data and
socio-economic data about the pupils, and these data are considered to be useful for the
ministry to ensure quality education for the pupils. Because the data provided by these
questionnaires will be used to monitor the pupils. As the questionnaire informs the pupils
physically or mentally challenges, their contact information, what communication equipment
they have access to, and so on… However, the questionnaire had not been easy to utilize.
58
As the content from these questionnaires should be designed for the intended users. This
implies that the questions should be answerable for the pupil and their parents/guardian.
Whereas, the field names like Physically and Mentally from section 3: Reserved
information should be discussed if these should be answered by their parents or by a health
responsible like doctors. Another discussion will be if an integration between Health
Management Information Systems and Education Management Information System would be
beneficial for this situation. I discussed this with my supervisor and to achieve this, an unique
ID for both systems must be created to be able to communicate.
Some questions and examples should be rephrased to a degree that the pupils and their
parents/guardian can understand. For instance, field 5.8: How long did it take you to get to
school was a concurrent question from the pupils(Kabafita SSE) because converting hours to
minutes shows to be a struggle. The teacher assisted them, but he showed the wrong format.
Even though the paper specifies that minutes is the format. This is because the entry point
from the questionnaires has three boxes, which the teacher interprets to be
Hours/Minutes/Seconds. In addition to the example(middle column from the questionnaire)
did not support them either. Whereas the example provided: [What time did you leave home
today? What time did you arrive at school? on time?] does not help them to understand
the intended question: How long did it take you to get to school(minutes)?. In overall,
these questionnaires can make the data entry challenging, and consequently cause poor
quality data.

59
Figure 9: Questionnaire page 1
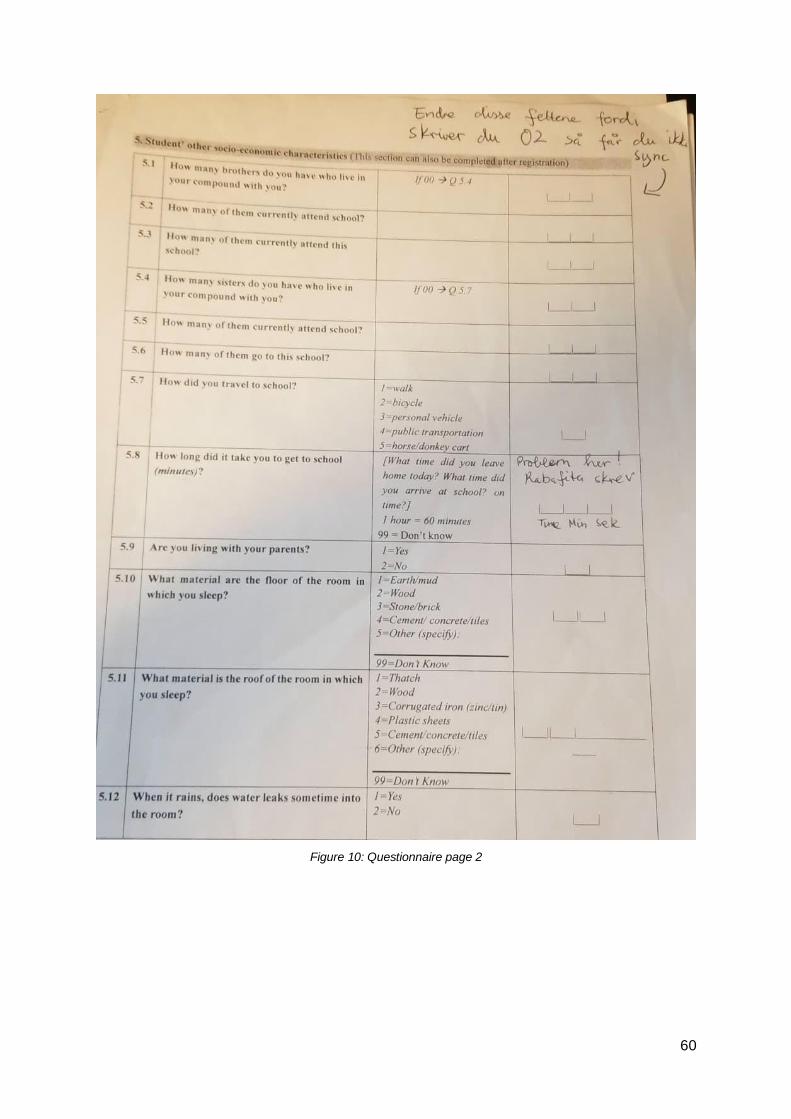
60
Figure 10: Questionnaire page 2

61
Errors
Errors were to be expected since the application was not fully developed yet. I did however,
not experience any severe or critical errors throughout using the application. The same
corresponds to the other users of the application. The error messages were not triggered
during data entry, but only when synchronization happens. The following section will show
and explain the errors.
Errors during data entry
The errors that encountered will be described as cases underneath:
Case 1: Wrong entry of numbers:
value_not_zero_or_positive_integer
Case 2: Duplication of data:
ERROR: Some of your data failed to sync. Check their sync status: programs with
error are marked as "icon", TEI's and events as "icon"(Duplication)
Wrong entry of numbers
The forms from the application should in practice mimic the questionnaire. My observation
has shown that not every field corresponds to this. The questionnaire field 5.1(See Figure:
questionnaire page 2) from the questionnaire expects the user to write 00 if the pupil doesn’t
have brothers or sisters. If the user writes 00 in the application, the system does not render
any error, but if the user writes 01 then an error message will appear during synchronization.
This is because 00 is a zero value and 01 is not zero or a positive number.

62
Figure 11: Error message for wrong entry of numbers
Duplication of data
The application should in practice mitigate the users from duplication of data according to
their leader. However, I could observe occurrences of duplication of data. The question is
how this is possible, and when the application captures it? First, there is no data validation
during entering the pupil’s unique ID(OLD SRN/ SRN). Many of the users experienced
struggle with manually inputting these IDs. Lastly, the application captures the duplication
when the data is synchronizing, thus none of the users would notice.
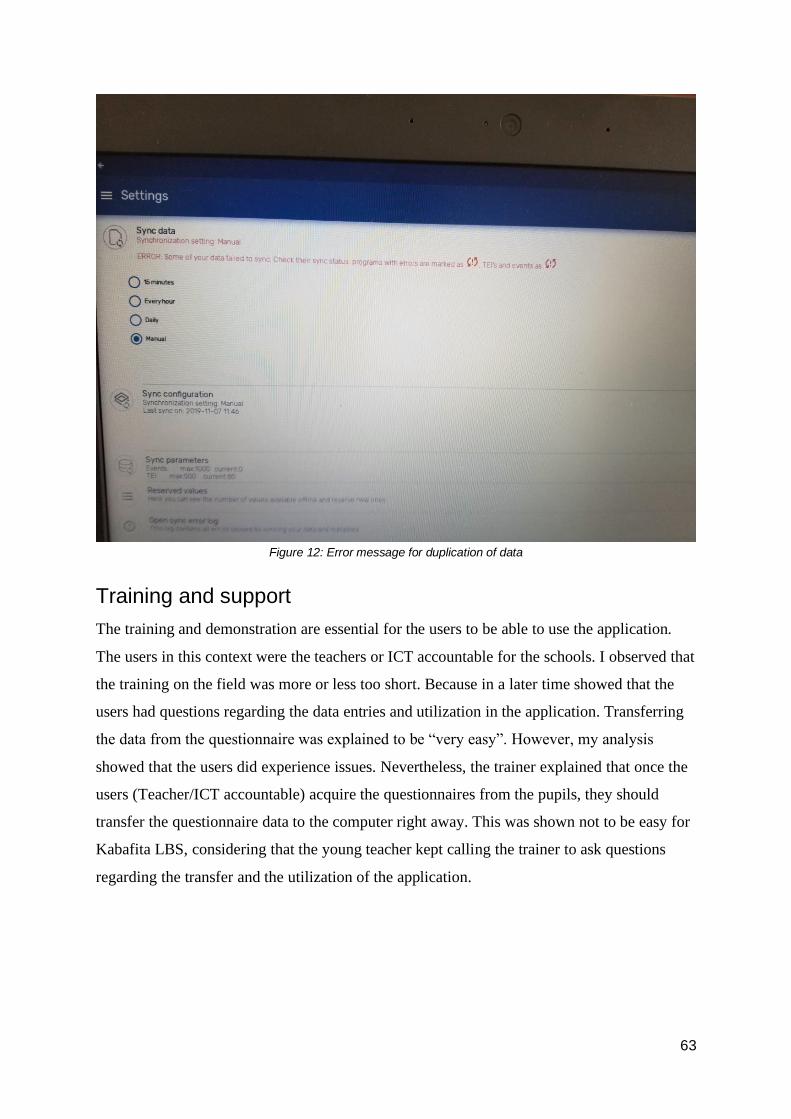
63
Figure 12: Error message for duplication of data
Training and support
The training and demonstration are essential for the users to be able to use the application.
The users in this context were the teachers or ICT accountable for the schools. I observed that
the training on the field was more or less too short. Because in a later time showed that the
users had questions regarding the data entries and utilization in the application. Transferring
the data from the questionnaire was explained to be “very easy”. However, my analysis
showed that the users did experience issues. Nevertheless, the trainer explained that once the
users (Teacher/ICT accountable) acquire the questionnaires from the pupils, they should
transfer the questionnaire data to the computer right away. This was shown not to be easy for
Kabafita LBS, considering that the young teacher kept calling the trainer to ask questions
regarding the transfer and the utilization of the application.
64
Knowledge of use of hardware devices
Google Chromebooks were used during my observation. The Android Tablets were
demonstrated to me but were not used in the pre-pilot. The observation shows that some users
lacked information on how to use the Chromebooks. Simple user interaction like writing
capital letters was not intuitive for them. I had to show the user to press Shift+”letter”, and
this finding may correspond for other users.
Assessment of Nielsen’s Usability Quality Attribute
In terms of Nielsen’s definition of usability, I will use the five quality components defined by
Nielsen Norman Group to analyze my findings. The analysis was based on the data collected
from the users, and coupled with my subjective judgement of the pupil attendance application
during observation. There will be a description of each quality component as an introduction
before I discuss each component.
As usability deals with a goal, the goal for this assessment involves registration of the pupil
attendance and enrolment.
Learnability
Definition provided by NNGroup:
How easy is it for users to accomplish basic tasks the first time they encounter the design? [5]
This component is about how easy it is for you to use the application and still accomplish
your daily task. To illustrate this component for my study, I will connect this component with
my observation.
My first encounter with the application was during the first day at the MoBSE. The ministry
provided me with a demonstration of how it worked. The question is whether the
demonstration somehow violates or hurts the evaluation of learnability? But if I compare this
with the real-world convention, it would be natural to have a demonstration for the new users
anyway. Because how much information you gain from the demonstration may be subjective,
and it may not be quite intuitive when you use it on your own. Subsequently, based on my

65
experience, I encountered an issue when registering the pupils. Adding the new pupil was an
experience challenge, because the add-button does not display until the user presses the
search button first. The function is quite understandable, because this function can be one of
the factors to mitigate against duplication of data since the user has to check if the pupil
already exists before adding. In practice, this function misled me and commonly the users
from each school.
Efficiency
Definition provided by NNGroup:
- Once users have learned the design, how quickly can they perform tasks? [5]
This component talks about how quick and easy they can perform the daily task after learning
the application. Now that the users know how it works, then the next step is to evaluate how
quick the user can utilize it.
After I understood the use, it was possible for me to evaluate efficiency. Efficiency in this
context will be how fast can I register a pupil’s enrolment and daily attendance. Beside the
add-button issue, I encountered a navigation problem that will reduce the efficiency.
Basically, the form in the laptop should be mimicking the questionnaire. Which means every
field name in the questionnaire is to be found in the application. Transferring the information
from the questionnaire to the application was not a challenge for me and the users. Rather, the
explanation provided in the middle column from the questionnaire led to an error.
Subsequently, moving from field to field using the laptop was not convenient, because
navigation was possible only through a trackpad. Navigation with TAB or cursors was not
implemented during pre-pilot and this issue was picked up on by myself and other users. We
can argue that the user may be proficient after every iteration of use, but in the end, the
efficiency was hindered by the use of trackpad navigation. Another aspect to improve the
efficiency is to connect with a mouse. Either way, adding extra equipment to improve the
workflow should not be necessary for the users. The application should be efficient as
possible, and support the option to add equipment based on the users preference of work.
66
It took me three steps to finish an attendance. First, the user has to press “Add New” and then
it navigates the user to the next screen. Secondly, the user must choose the date and the
school. Lastly, they can now choose the attendance and finish and complete. I will argue that
this process can be done in two steps, by combining the second and the last step together.
Whereas the application will improve efficiency and still maintain a minimalistic design for
the users. I think that removing this type of redundancy can speed up this process.
Memorability
Definition provided by NNGroup:
When users return to the design after a period of not using it, how easily can they reestablish
proficiency? [5]
This component is about after a period of not using the application, will it still be natural for
the user to come back and accomplish daily tasks?
Consistency is an important aspect to apprehend the memorability. If the user knows the
design after they are returning to it, then they will not struggle cognitively and furthermore
having an easy reestablishment. The study lasted for three weeks and I do not think it was
sufficient time for me to determine the memorability of the application. In addition to my
data collection does not provide any information to this attribute. Another consideration is
that the application was under development, thus the application is not consistent enough,
since it will get new features later on. This consideration limits me from fully evaluating the
memorability.
Errors
Definition provided by NNGroup:
How many errors do users make, how severe are these errors, and how easily can they
recover from the errors? [5]

67
The definition provided from NNGroup is already explained in directness, but this
component is concerning if one encounters an error, is a critical error? Is it easy for the users
to recover from it?
The pre-pilot version of DHIS2 pupil attendance application was flexible during this stage. It
was possible to “close and finish” the registration of attendance or enrolment and still be able
to edit later on. The system was not complex during pre-pilot and the intended goal is to
register the pupil enrolment and daily attendance which is not a complex operation in the first
place. Of course, I did encounter some errors and these error messages did not show up until
synchronization. The errors I experienced were not that severe or critical, but rather common
issues that led to more work for the users. These common issues were usually duplicated
data, and this could be mitigated if a data validation was implemented. The data validation
will check if the OLD SRN or SRN already existed, and the quality check should do the same
for every unique variable.
To illustrate the quality check, take for example a registration of email; You have the option
to choose which username you want to use, and the website validates right after you filled the
username to check for whether it exists or not. Basically, you are free to move on to the next
step if the username does not exist. The same could be essential for a general pupil
attendance application as well. Because each time the users encountered duplication of data,
they had to fix this by themselves or get support from an accountant from MoBSE. It was
possible to recover from errors, but only if you had technical background. The error messages
were not intended for the regular user, but rather for the developers.
Satisfaction
Definition provided by NNGroup:
How pleasant is it to use the design? [5]
Do the service meet the users expectations and needs by using the application?
It was not sufficient for me to evaluate this attribute due to inadequate data collections.
68
Conclusion of Nielsen’s usability analyzation
Using the quality attribute provided by Nielsen’s group to analyze my findings has shown
pros and cons of the pupil attendance application, and its perceived ability to be useful. The
application was at an early development, thus it has room for improvement. These
improvements may construct the system to be more efficient and more usable for the users.
Conclusion and reflection of Result and Analysis
The purpose of this thesis was to research essential usability aspects that will serve for a
pupil's attendance in a low resource public education setting. The data was collected during
pre-pilot, and the analysis was conducted on that collection of data. The analysis shows in a
later time that I could have been missing some essential data during my observation. I
reasoned this in the chapter Method: Reflection of data collection, due to my knowledge on
the domain during that time. Missing the opportunity to reflect over my data collection, and
prepare for a new approach to collect the data has shown to be a disadvantage when fully
analyzing the quality attributes.
I will discuss this further in the Discussion chapter. I see the derivation of results from the
analysis has appeared to miss some essential data. As collecting data to analyse memorability
and satisfaction required more time and the proper method. I see in a later perspective that
conducting a comprehensive Usability Testing could be the proper method. As I could
capture more of the user’s behaviours, and their interpretation while using the application to
strengthen my evidence. I will discuss this further in Discussion and Future work.

69
Discussion
This section concerns a discussion about my findings, results and analysis. I will discuss with
other researchers, and use Nielsen’s Ten heuristics from the literature review to discuss as
well.
My findings show that involving users is essential to uncover usability issues.
In Chapter 3: Methods, it was mentioned that I tested the application before I was involved
with the users. This was specifically because I wanted to compare my thoughts with theirs to
observe the differences in how we perceived the use of the application. Once again, my
findings show that we shared to some degree a common ground with the difficulties. I think
involving the users to test the application was essential, because I learned to understand their
interpretation and they provided me a confirmation to what I felt could be an issue. In
conclusion, Nielsen’s usability heuristics are based on experience from a different context.
This could lead to usability evaluation being more challenging, as the user may lack ICT
knowledge. Therefore they provided me with insufficient data. This will be discussed under
Limitations on data collection.
Speak the same language
From Background: Literature review, the usability quality attribute “Match between system
and the real world“, says the system should speak the same language as the user, with words,
phrases and concepts familiar to the user is an important usability aspect. Nielsen Group
stated that designers/programmers should never assume that their interpretations and
understanding of words or objects match those of their users [42]. How we perceive and
interpret the world around us varies from individual to individual. To illustrate this
furthermore, take for instance the questionnaire from the result; The designer of the
questionnaire meant it was “very easy” and straightforward. However, the observation during
Kabafita SSE turned out to be different from the anticipation by the designer. First of all, it is
arguably to say that it is not sufficient to let the pupil answer these questionnaires by
themselves, and should have support from their parents or guardians. However, due to some
parents’- or guardians' illiteracy, it is not unlikely that some of the pupils may have to explain

70
or read for their parents and guardians. Based on my findings, I will argue that these
questionnaires should be discussed whether the ministry should rephrase it or discuss for
which data is necessary, and be more answerable for the pupils/parents/guardians.
The next section, Developing for rural users, will continue the discussion with the same use
of heuristic. This is a presentation of a concern that I think may implicate a challenge, and
including this Usability Heuristic may support the case. Although, this needs to be studied.
Case: Developing for rural users
Chapter: Empirical findings stated that a rural visit was not possible due to the constraints.
From the chapter: Background, ICT and Technology confirms a distinction of network
capabilities between rural and urban areas, whereas 4G and 3G are accessible in the western
part of The Gambia. As we go further to the east, GSM-signal is dominating these areas, but
only two areas have access to 3G. A tablet with an extension of the prior SMS solution was
provided to support these rural areas for attendance of pupils and teachers. The design of the
tablet showed me to be easier than using old phones with no touch interfaces. Because the
application formats the input from the users which in theory will serve to reduce the errors,
and then send the daily attendance through SMS. The reason I said in theory, is because I had
no opportunity to explore the tablet solution during my field trip and therefore it needs further
study to conclude.
The literature review explains that developing for the rural can be challenging for the
software engineers and for the other stakeholders [43, p. 1]. Thus, the software developers
must respect the challenges with the limitations of the infrastructures, the cultural differences
and different languages. I cannot comply to this case since I had not visited the rural areas,
but from the chapter Background: The Gambia and the literature review, stated that The
Gambia hosts many languages and therefore the software developers and stakeholders should
also consider mediations or agents to support the different languages in The Gambia [43, p.
1]. The applications should speak the same language as the users, as it can support them to
handle the application.

71
Designing a pupil attendance application for The Gambia
Pruitt and Grudin argue that the users do not always know what they want until they get it
[43, p. 3]. They explained that good design comes from the designer, rather than from the
users. First of all, by involving the users for testing had allowed me to uncover a few
usability issues with the current version of the application. But it required the users to try the
application first, which complies to the first argument of Pruitt and Grudin. During my
interviews with some of the users, I observed that some of them did not have any opinions
regarding the application.
The other argument was shown to be inaccurate to some degree, since navigation with
“Cursors'' and “TAB” through the application was not implemented. This was mentioned
by the users from Albyon. By leaving this function outside, it can lead to a disadvantage for
the experienced users in a later time. This function is defined as an “accelerator” which will
speed up the user interaction according to Nielsen Norman Group [44]. Furthermore, this
function can allow the experienced users to complete common daily tasks faster and more
efficient. Based on my findings, I recommend that the designers/programmers together with
some representative users try to determine the accelerators. This in fact requires the users to
know what they want first. The designer/developer should also know what to determine as an
accelerator, and it could be done by focusing on the feature that is repeatedly used by the
users. This aspect will comply with one of Nielsen Norman Group’s Ten heuristic of user
interface, Flexibility and efficiency of use, in addition to enhancing the Efficiency usability
attribute as well.
Another function that could be handy in the future is batch operation, as the current
application does not support it yet. This implies that the user cannot insert values for several
tracked entities concerning the pupils at the same time. The batch operation can enhance the
inserting speed for the teachers/data enters. The user can expect a lot of repetitive work with
the current application. Another aspect is that the application does not provide auto filling.
Auto filling may increase the speed during inserting enrolment data. These aspects will
potentially be accelerators that need to be studied and discussed to further conclude.
Cooper argues that designers/programmers have too much influence over the human interface
[43, p. 3]. He also stated that the programmers lack skills in this area, leading to doing a poor

72
job out of it. If this is a case in The Gambia, I would recommend the designers/programmers
to involve the users despite their knowledge. The data collected may be a potential benefit to
understand the users’ point of view more in depth. You could argue that this process requires
a lot of time and resources, and consequently not worth it. However, strengthening the
designers/programmers knowledge for the domain, and giving more power to the users
opinions is more beneficial than bad, as far as I can tell. I will also argue that this may help
the case of command-and-control type, since the collaboration between
developers/programmers and users together have more impact versus one person. That is why
the developers/programmers for this field should consider evaluating together with the
representative users to assign these accelerators.
The relationship between learnability and efficiency
Based on Nielsen Norman Group study, there is a difference between learnability and
efficiency, despite being related [45]. To understand them, we must introduce two users: New
user and experienced user. We know that learnability concerns how quickly you can perform
basic tasks during the first encounter of the system. A highly learnability system will be
beneficial for the new users because new users want to learn the system quickly and achieve
the optimum performance. The problem with a highly learnability system is when the user
becomes more advanced. Considering the experienced users strives to complete the task in a
time as short as possible. Therefore, a highly learnable system will be a disadvantage for an
experienced user.
The point is a highly learnable system is not always efficient [45]. A highly learnable pupil
application will provide a lot of instructions and explanations for every process, which
ensures the user to complete the task with the right input. But in the long term, a highly
learnability system will be inefficient for repeated use. Thus, the designer should consider a
balance between learnable and efficient systems so neither the new users nor experienced
users will be left outside of the scope. The key is to maintain a balance between learnable and
efficiency.

73
Involve 5 users to test the application:
Usability test was introduced during Conclusion of Result and Analysis, and if the resource
does not allow that, then Testing with five users can be sufficient to use instead. Nielsen
Norman Group stated that testing with five users is sufficient to gain the best results. I will
explain the Usability Test in Future work.
Figure 13: Why testing with 5 users is sufficient [46]
Initially, testing with zero users gives zero insights! The first single test with a user will give
the programmers/developers a good collection of data. The insights gained from the first
single test uncovers almost a third of what is known about the usability of the design [46].
The second test with another user will uncover many of the same as the first user, but you
may uncover new data for new insights. The third user will generate a small amount of new
data, but supposedly the same as the first or the second user.
As the designers/programmers add more and more, they will learn less [46]. Reasonably, they
will observe the same again, and this can be illustrated as seen on the Figure: 13. The curve
begins to flatten out as one examines after the fifth user, although the figure shows that
testing 15 users is needed to discover all the usability problems in a design. In the long run,
testing with 15 users each time may cause waste of resources and time. Instead of focusing all
resources on one single study, divide it into three studies with five participants in each study
[46].

74
However, this is based on a Nielsen Norman Group’s study, and this can impose a challenge
for the Sub-African context and therefore need to be examined to further conclude. The intent
of this proposal is to collect data to find a balance between learnability and efficiency, that in
the end will benefit the users. As the users know how to handle the application, they can
provide better reports for EMIS statistics. This statistic can be used to facilitate better
decisions in such a degree that will benefit quality education.
Errors
In this section I will divide the Errors in two parts, whereas the first part will be about the
Error messages, and the other will be Error prevention.
Error Messages
Help users recognize, diagnose, and recover from errors is one of the Ten usability
heuristics. This heuristic addresses that the error message should use the same language as
the user, and not in code [47]. In addition to providing suggestions for a solution. The results
derived from my data collection showed that the error messages were not intended for the
users, but rather for the developers. This was not observed as a problem, because the user did
not know at all when an error occurred. Because the errors were shown during
synchronization and the accountability from MoBSE aided the user with solutions. However,
the accountability will not always be present, and the solutions provided were more or less
repetitive work for the users. Then this can be unpleasant for the users to handle without any
indications or visible messages during data entries.
Error Prevention
The best scenario is to prevent the errors from happening in the first place. Although, errors
may occur even if we want to or not. Error Prevention is one of the ten usability heuristics,
which implies a careful design that prevents errors from occurring will be a better alternative
than providing good error messages in the first place [48].
In some occasions of errors, the term Blaming may be assigned to accuse the victim. The
victim in this case is either the user or the developer/programmers. If the fault lies in the

75
user’s mistakes then the term “user error” will describe this phenomenon [48]. On the
contrary, the designers/programmers can be at fault, thus they could make it easier for the
user to commit user errors [48].
Two types of user errors:
Slips: This type of error occurs when the user performs one action, and the outcome becomes
another action. According to Nielsen, typing “i” instead of “o” counts as a slip [48]. Slips are
common in daily life as well, like using salt instead of sugar during cooking. In most cases,
the slip occurs when the user does not devote their attention to their intended task.
Mistake: Mistakes are made when users have goals that are inappropriate for the current
problem or task; even if they take the right steps to complete their goals, the steps will result
in an error [48]. This occurs when the user has incomplete or incorrect information about the
task. For instance, the user’s task was to register a pupil attendance, but ending up with
registering an enrolment instead. Regardless of following the step correctly, the user's attempt
was inappropriate for the task.
Both slips and mistakes occurred during my observation. As stated in Chapter: Result and
Analysis - section Errors, errors were found during data entry and when the user transferred
from the questionnaire to the Application. In respect of the developers and the user, I will
devoid any blaming for these errors. But rather support the current situation by giving input.
Case 1: Wrong entry of data from Result and Analysis shows to be a mistake that can be
fixed by the developers, given that the user did every step correctly and it still resulted in an
error.
Case 2: Duplication of data shows to be a slip made by the user, reason being that
generating a unique ID manually appeared to be less accurate and efficient. Slips can occur
with none being at fault to blame, but manually controlling twelve numbers for a Unique ID
for an entire class is not unlikely to cause the user to miss sometimes. It would likely be more
dependable to let the application generate the Unique ID instead of the users.
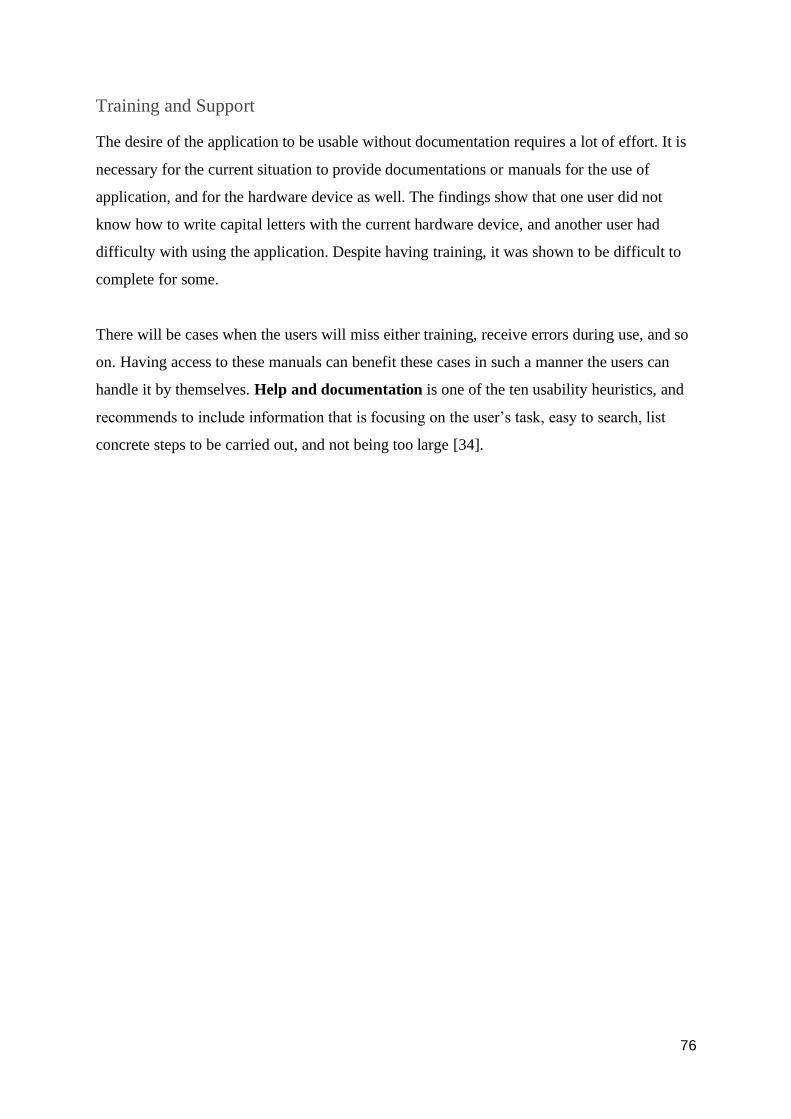
76
Training and Support
The desire of the application to be usable without documentation requires a lot of effort. It is
necessary for the current situation to provide documentations or manuals for the use of
application, and for the hardware device as well. The findings show that one user did not
know how to write capital letters with the current hardware device, and another user had
difficulty with using the application. Despite having training, it was shown to be difficult to
complete for some.
There will be cases when the users will miss either training, receive errors during use, and so
on. Having access to these manuals can benefit these cases in such a manner the users can
handle it by themselves. Help and documentation is one of the ten usability heuristics, and
recommends to include information that is focusing on the user’s task, easy to search, list
concrete steps to be carried out, and not being too large [34].

77
Summary of discussion
Many functions were not implemented during pre-pilot since it makes sense to prioritize
other functions or aspects first. Due to the limited network access, the offline mode for the
application is a high priority. Thereafter, involving registration of enrolment and attendance
data is essential to further test the application during pre-pilot. The pre-pilot was tested
among a small group, which made the current implementation of the application doable.
Occurrence of errors were to be expected, but I am concerned that this will scale up with
more pupils and users. Subsequently, more users and pupils will also require the system to
support many functions to operate the data.
Figure 14: A categorization of observed issues

78
The figure presents a connection between the observed issues and which category it belongs
to. This is all based on my analysis of the observation. With the current data collection, it was
possible to derive some essential usability aspects for the thesis. In total four categories and 2
superior categories. The superior category was made because it has a relation with the
categories. Whilst the offline mode can stand by itself.
The following section will present the essential usability aspects that fit for the current study:
Offline mode: Offline mode is no doubt the most essential aspect, due to its functionality
against poor network capabilities and strict budget. Distributing information through the
Internet is more efficient than on the road. An application which is depending on network
access will not be sufficient for a low resource country. Given that the poor availability of the
Internet and the application should not limitate the users from performing their daily task
force. This function should be considered first when the developers are designing an
application for a low resource country with the same context as The Gambia.
Accelerators: Functions that lets the users accomplish their daily task fast and efficiently is
essential for the cause. The outcome should be timely and reliable as well. To achieve this,
one has to consider accelerators to reduce the repetitive work. In addition to automating
some of the manual work force likewise generating Unique ID’s. These accelerators should
consider user involvement and testing. Firstly, some of the end-users gave me valuable
information to make the application more efficient. Secondly, the end-users will perform the
daily task force (enrolment and attendance registration), thus listening to their opinions and
seeking for a solution can ease their daily task force. Lastly, the developer should search for
confirmation with the end-user by testing the accelerators. See if it actually works.
Communication: Communication is overall one of the most essential usability aspects.
Despite not being a function of the application, communication is still a part of it. Wasting
resources and time is not desirable for a low-resource country, thus guidelines and principles
from NNGroup may have a minimal impact on the resources and correspond can save time.
Considering the observation uncovers many faults that can be reflected based on Nielsen
Norman Group’s study. One can learn from others, but some must be solved locally.

79
Communication is then a key for an application to be usable in this context. Communication
will ensure understanding between the actors of the system. Try to involve the end-users
early as possible, as the experienced users can share their opinion about accelerators to make
the application more efficient. New users can show their opinion regarding difficulty within
the system and so on. Considering every actor of the application can share their opinions to
support the application to achieve the optimum performance. Listen to each other and try to
solve issues locally if possible.
Training and support: Training and support will have a big impact for an application to be
usable to the context. Due to rapid change of technology, the personnel need to learn first
before they can train others. With the shortage of personnel in mind, it was not unpredictable
that the schools would face issues with the implementation of the application. Nevertheless,
giving adequate training and support is a necessary action which helps. Investing more time
on training can impact on the long term, as the user can train other users.
Error handling: The occurrence of errors had many factors, either being a slip or a mistake
made by the users or developers. Based on my view and coupled with the derivation of the
analysis, the Error handling can somehow be reduced by giving proper Training and
support. In addition to implementing accelerators to reduce the repetitive work, and let the
application generate some of the indicators (likewise Unique ID). In summary, Error
handling has a relevance to Training and support, Accelerator and Communication.
Balance between Learnability and Efficiency: Finding a balance between learnability and
efficiency is not an easy task for the developer. The developer should treat these attributes as
a scale. Because as the developer focused too much on one attribute, it will affect the other.
In the context of The Gambia, a little more highly learnability application will be more
beneficial for the time being. Since some of the users have shown lack of device knowledge,
thus the application should support them with more explanations and descriptions. As the
users become more advanced, the developer should counterbalance the scale, which means
reduce the learnability. With all due respect, I empathize that this requires more resources and
time. But if one wants the developer and the end-users to be better at their field, they need to
support each other. The developers need to know who their end-users are, as well as the end-
users should understand what they do. Therefore, test the new implementation in the
application with the end-users to ensure that they really understand it.

80
Limitations
The significant limitations of my thesis are adjustment of study, time, and inexperience. The
research was first initiated as developing an innovative application with Progressive Web
Application. Due to adjustment of research and plans, it was founded to be challenging, and
difficult for me to adapt. Secondly, I could not make the best use of the time frame given to
me. As the collected data was not sufficient for me to use for the new adaption of the
research. I will further explain the data collection in the next section, Limitations regarding
the data collection. It will be an advantage for me to travel to The Gambia on several
occasions, since then I would be able to reflect over my approach between visits. If I had
more time, a new visit to The Gambia would benefit my research in such a manner that I can
strengthen my evidence. Lastly, I have tried to minimize the weakness in my data collection
by reading and seeking answers in different research articles.
Limitations regarding the data collection
It is notable to know that qualitative research has weakness, due to its nature. First of all, I
used only unstructured interviews (Open-ended questions) to impose an unbiased manner in
such a manner that I collected the user’s subjective opinions. Subsequently, I found in a late
time that the interviews I conducted were more or less too thin. The period I conducted data
collection, turns out to be less matured. Since some of the users had little knowledge about
the device during that period, in addition they began to try the application. Thus, they need
more time to understand the device and the application, to further know what they really
want. Maintaining the chain of evidence may suffer from not having quantitative data, such
as conducting a structured interview may help the future researcher to use the result to
generate quantitative metrics. These metrics could also support generalizing the study.
As a result, I had more observation than interviews for this thesis. Due to involvation in some
situation during observation, it can lead me to be potentially influenced the users. Because
not all the users did not know what they wanted, and therefore led me to use my subjective
judgment and opinions. I had to search and explore for essential usability aspects, then I
could seek for the users’ confirmation. In consequence of that, it may influence their
opinions.

81
All things considered, this study would benefit from having a new round of data collection
with more parameters involved. Thus, the users may progress their knowledge of using the
devices and the application, to further gaining more data to determine more essential usability
aspects for the study.

82
Conclusion and future works
The main focus of this thesis is on usability and user involvement in low resource context.
Usability is a key factor for an application to survive and be useful in a low resource context.
There are many factors that need to be involved to make a product usable. Communication
has shown to be the factor that can enhance usability, and even more to uncover many other
usability issues. This thesis has demonstrated that developers and the users are imperfect, but
communication and working together as a team can be better for the good.
The research project has used An Exploratory Case Study to uncover usability aspects for an
pupil attendance to be useful in a low resource context. The research methodology has been
beneficial for the cause, since it led me to conduct a study on social behavior in a small group
of individuals. Thus, the strategy gave me more insight to understand the interaction between
humans and technologies. Even more, it led me to uncover usability issues with the current
application and to propose strategies to help the future related issues.
Practical implication
The practical implication of the project is the interaction between the users and the
application. The initiative of this project began first in Uganda, and sourced to The Gambia
on request. Tracking the pupils with pen and paper had not been efficient over the past
decades, and therefore digitalization was thought to solve the issue. Although, the transition
from pen and paper to digital means had not been straightforward.
Humans and technology have been the main factors to obstruct the progress. Communication
has shown to be the main key to support the current situation between the developers and the
users. In this context, Communication has the effect of understanding the underlying
problem within the use of the application. Communication can also be used to seek for
further improvements with the current application to uncover other usability issues.

83
The pupil attendance application will serve its purpose by supporting reliable and timely data
for the EMIS statistical. Additionally, gathering these statistics will support the decision
makers to further provide a better quality education for the pupils.
Theoretical implication
This thesis aims to answer the research question:
- What aspects of usability are essential for a pupil attendance application to be useful
in a low resource public education setting?
An exploratory case study had been adopted in attempt to answer this research question.
Alongside with observation and interviews has guided this thesis to further answer the
research question. Gathering feedback from the end-users, aligned with observing the
application, supported this thesis to generate the end result.
With regards to the limitations during the study, many usability aspects are still left
uncovered. Although, this thesis can answer the question to some degree with some essential
usability aspects that is core for the current situation. With the derivation of analysis
presented from summary of discussion, the essential usability aspects will be by following:
1. Offline mode
2. Communication
3. Balance between learnability and efficiency
4. Training and support
5. Accelerators
For the time being, the responsibility weighs more on the developer's shoulders. As they need
to design an application with high usability, since some of the end-users lack basic computer
literacy. This may change in the future if one considers involving the end-users more often.
As the end-users will progress by knowing their involvement has an impact on the end
interface. By giving them the opportunity to reflect over their thoughts for what is possible or
84
not with support from the developers. The keyword is “Sharing is power”, and to achieve
this; One must communicate with each other through involvement.
By using the literature review from Nielsen Norman Group to study the context has shown to
be feasible. However, as described in summary of discussion; Some of the issues must be
solved locally through communication between the representative actors. A Usability testing
or Testing with five users may benefit as a new implementation of the application appears.
In addition to when repeated errors occur too often, as the developer should seek the
occurrence by observing what the users really do. Overall, involving the users in early stages
or during development of new implementation can benefit the application to be more usable.
Future work
For the future related study, I would recommend Usability testing to gather more essential
usability aspects. The method can provide more insight about the users while they are using
the application. I would recommend the conductor to give daily work tasks to the users, and
see what they do. Collect these data to understand how they perceive and interpret the tasks.
The goal is to understand the users behaviours, goals, thoughts, and motivations [49].
Usability testing is an observational methodology used to test a product or a service. This is
done by observing a representative user while they use the product. According to Nielsen, the
usability testing is used to uncover problems and opportunities in designs. The ICT expertise
may differ between the users, therefore, try to seek for the representative users.
The designers/programmers cannot design a perfect or a sufficient user experience without
observing the real user when they interact with the design [49]. Therefore, a cooperation
between the designers/programmers and the users can enhance the usability. Thus the users
know better how to handle the application and the designers/programmers will gain more
knowledge.

85
Bibliography
[1] UNESCO, “UNESCO and education: everyone has the right to education,” 2011.
[Online]. Available: https://unesdoc.unesco.org/ark:/48223/pf0000212715. [Accessed
June 2020].
[2] Global Partnership for Education, “Benefits of Education,” 2020. [Online]. Available:
https://www.globalpartnership.org/benefits-of-education. [Accessed June 2020].
[3] DHIS2, “Pilot of Using DHIS2 for digitalising Education Management Information
System, Narrative report,” 2019.
[4] Nielsen Norman Group, “About Jakob Nielsen,” [Online]. Available:
https://www.nngroup.com/articles/author/jakob-nielsen/. [Accessed January 2020].
[5] J. Nielsen, “Usability 101 Introduction to Usability,” 03 January 2012. [Online].
Available: https://www.nngroup.com/articles/usability-101-introduction-to-usability/.
[Accessed July 2020].
[6] United Nations, “Sustainable Development Goals,” [Online]. Available:
https://www.un.org/sustainabledevelopment/sustainable-development-goals/.
[Accessed June 2020].
[7] United Nations, “SDG Goal 4,” [Online]. Available: https://sdgs.un.org/goals/goal4.
[Accessed June 2020].
[8] United Nations, “Sustainable Development Goals - 4 Quality Education,” [Online].
Available: https://www.un.org/sustainabledevelopment/education/. [Accessed
February 2021].
[9] HISP, “Health Information Systems Programme (HISP),” 17 March 2011. [Online].
Available: https://www.mn.uio.no/ifi/english/research/networks/hisp/. [Accessed April
2020].
[10] DHIS2, “About DHIS2,” [Online]. Available: https://www.dhis2.org/about. [Accessed
April 2020].
[11] DHIS2, “DHIS2 for Education,” [Online]. Available: https://www.dhis2.org/education.
[Accessed October 2020].
[12] Wikipedia, “The Gambia,” 3 February 2021. [Online]. Available:
https://en.wikipedia.org/w/index.php?title=The_Gambia&oldid=1004610126.
[Accessed February 2021].
[13] International Monetary Fund, “Gross Domestic Product: An Economy’s All,” 24
February 2020. [Online]. Available:
https://www.imf.org/external/pubs/ft/fandd/basics/gdp.htm. [Accessed February 2021].
[14] Google, “Gross Domestic Product for Norway 2018,” [Online]. Available:
https://www.google.com/publicdata/explore?ds=d5bncppjof8f9_&met_y=ny_gdp_mktp
_cd&idim=country:NOR:SWE:FIN&hl=no&dl=no. [Accessed October 2020].
[15] International Monetary Fund, “World Economic Outlook Database,” [Online].
Available: https://www.imf.org/en/Publications/WEO/weo-
database/2020/October/weo-
report?c=648,142,&s=NGDPD,&sy=2018&ey=2025&ssm=0&scsm=1&scc=0&ssd=1&
ssc=0&sic=0&sort=country&ds=.&br=1. [Accessed February 2021].
86
[16] UNICEF, “Our work in The Gambia,” [Online]. Available:
https://www.unicef.org/gambia/what-we-do. [Accessed September 2020].
[17] UNICEF, “Education,” [Online]. Available: https://www.unicef.org/gambia/education.
[Accessed September 2020].
[18] Knoema, “Gambia - Net enrolment rate in primary education,” [Online]. Available:
https://knoema.com/atlas/Gambia/topics/Education/Primary-Education/Net-enrolment-
rate-in-primary-education. [Accessed September 2020].
[19] S. Byre og I. Gravem, Education Management Information System in Developing
Countries transferring experience of digitalization to The Gambia, 2019.
[20] Privacy Shield, “Gambia - Telecommunications,” [Online]. Available:
https://www.privacyshield.gov/article?id=Gambia-Telecommunications-Sector.
[Accessed February 2021].
[21] Knoema, “Gambia - Mobile cellular subscriptions,” [Online]. Available:
https://knoema.com/atlas/Gambia/topics/Telecommunication/Telecomm-
Services/Mobile-cellular-subscriptions. [Accessed September 2020].
[22] Central Intelligence Agency, “THE WORLD FACTBOOK,” 05 February 2021. [Online].
Available: https://www.cia.gov/the-world-factbook/countries/gambia-the/. [Accessed
February 2021].
[23] D. Bourgeois and D. T. Bourgeois, “Information Systems for Business and Beyond,”
28 February 2014. [Online]. Available:
https://bus206.pressbooks.com/chapter/chapter-1/. [Accessed January 2021].
[24] Texas A&M University, “WHAT IS MIS? | MANAGEMENT INFORMATION
SYSTEMS,” [Online]. Available: https://mays.tamu.edu/department-of-information-
and-operations-management/management-information-systems/. [Accessed February
2021].
[25] T. Cassidy, Education management information systems (EMIS) in Latin America and
the Caribbean: Lessons and challenges. Inter-American Development Bank., 2006.
[26] T. N. Wako, “Education Management Information Systems,” November 2003.
[Online]. Available:
https://unesdoc.unesco.org/ark:/48223/pf0000220621/PDF/220621eng.pdf.multi.
[Accessed May 2020].
[27] EMIS-Blog, “Framing EMIS for IS research,” 2021.
[28] C. Villanueva, “EDUCATION MANAGEMENT INFORMATION SYSTEM (EMIS) AND
THE FORMULATION OF EDUCATION FOR ALL(EFA),” 2003. [Online]. Available:
https://unesdoc.unesco.org/ark:/48223/pf0000156818. [Accessed May 2020].
[29] UNICEF, “Monitor education participation,” December 2016. [Online]. Available:
http://uis.unesco.org/sites/default/files/documents/monitoring-education-
participation.pdf. [Accessed May 2020].
[30] D. Norman, “The Definition of User Experience (UX),” [Online]. Available:
https://www.nngroup.com/articles/definition-user-experience/. [Accessed February
2021].
[31] J. Mifsud, “The Difference (And Relationship) Between Usability And User
Experience,” [Online]. Available: https://usabilitygeek.com/the-difference-between-
usability-and-user-experience/. [Accessed August 2020].

87
[32] S. Huang and A. J.Berre, “Usability and GUI design and principles,” [Online].
Available: https://www.uio.no/studier/emner/matnat/ifi/INF5120/v15/timeplan/f08-
2015-0203-part-2-gui-design.pdf. [Accessed March 2020].
[33] ISO9241-11, “Ergonomics of human-system interaction - Part 11: Usability: Definitions
and concepts,” 2018. [Online]. Available: https://www.iso.org/obp/ui/#iso:std:iso:9241:-
11:ed-2:v1:en. [Accessed February 2020].
[34] J. Nielsen, “Ten Usability Heuristics,” 24 April 1994. [Online]. Available:
https://www.nngroup.com/articles/ten-usability-heuristics/. [Accessed July 2020].
[35] R. K. Yin, “Qualitative Research from Start to Finish,” 2011. [Online]. Available:
https://in.bgu.ac.il/humsos/politics/Documents/Ethics/Yin%20Qualitative%20Research
%20from%20Start%20to%20finish.pdf. [Accessed September 2020].
[36] R. K. Yin, Case Study Research - Design and methods, third edition, 2003.
[37] G. Hart, “The five w’s of online help systems,” 2002. [Online]. Available:
http://www.geoff-hart.com/articles/2002/fivew.htm. [Accessed February 2021].
[38] Saul McLeod, “The Interview Research Method,” 2014. [Online]. Available:
https://www.simplypsychology.org/interviews.html. [Accessed February 2021].
[39] P. W. M. Trochim, “Qualitative Methods,” 10 March 2020. [Online]. Available:
https://conjointly.com/kb/qualitative-methods/. [Accessed February 2021].
[40] J. Caulfield, “How to do Thematic analysis,” 6 September 2019. [Online]. Available:
https://www.scribbr.com/methodology/thematic-analysis/. [Accessed November 2020].
[41] University of Oslo, “NVivo,” 17 March 2017. [Online]. Available:
https://www.uio.no/tjenester/it/forskning/datafangst-og-analyse/nvivo/mer-om.html.
[Accessed October 2020].
[42] A. Kaley, “Match Between the System and the Real World: The 2nd Usability Heuristic
Explained,” 1 July 2018. [Online]. Available: https://www.nngroup.com/articles/match-
system-real-world/. [Accessed October 2020].
[43] T. Degif, Y. Ditrich and M. Kifle, “Contextualizing User Centered Design with Agile
Methods in Ethiopia,” 2017.
[44] A. Harley, “Accelerators,” 8 December 2019. [Online]. Available:
https://www.nngroup.com/articles/ui-accelerators/. [Accessed October 2020].
[45] A. Joyce, “Learnability vs Efficiency in User Interface Design,” [Online]. Available:
https://www.nngroup.com/videos/learnability-efficiency-ui-design/. [Accessed October
2020].
[46] J. Nielsen, “Test with 5 users,” 18 March 2000. [Online]. Available:
https://www.nngroup.com/articles/why-you-only-need-to-test-with-5-users/. [Accessed
October 2020].
[47] J. Nielsen, “Error message guidelines,” 23 June 2001. [Online]. Available:
https://www.nngroup.com/articles/error-message-guidelines/. [Accessed November
2020].
[48] P. Laubheimer, “Preventing User Errors: Avoiding Unconscious Slips,” 23 August
2015. [Online]. Available: https://www.nngroup.com/articles/slips/. [Accessed
November 2020].
[49] K. Moran, “Usability Testing 101,” 1 December 2019. [Online]. Available:
https://www.nngroup.com/articles/usability-testing-101/. [Accessed November 2020].
88
[50] GSMA, “Network Coverage Maps - The Gambia,” [Online]. Available:
https://www.gsma.com/coverage/#8. [Accessed February 2021].
[51] S. Liverpool and C. Missen, “ICT and Education in The Gambia,” [Online]. Available:
https://www.widernet.org/sites/default/files/Gambia.pdf. [Accessed August 2020].
[52] Saylor Academy, “What Are Information Systems?,” 2012. [Online]. Available:
https://saylordotorg.github.io/text_business-information-systems-design-an-app-for-
that/s05-01-what-are-information-systems.html. [Accessed August 2020].
[53] The University of Auckland, “Thematic analysis,” [Online]. Available:
https://www.psych.auckland.ac.nz/en/about/thematic-analysis.html. [Accessed
November 2020].
[54] D. Weedmark, “The History of Management Information Systems,” 31 March 2019.
[Online]. Available: https://bizfluent.com/about-5444925-history-management-
information-systems.html. [Accessed February 2021].
[55] T. Segal, “Management Information Systems vs. Information Tech: What's the
Difference?,” 4 May 2019. [Online]. Available:
https://www.investopedia.com/ask/answers/040315/what-difference-between-mis-
management-information-system-and-information-technology.asp. [Accessed
February 2021].
[56] O. P. Atieno, “AN ANALYSIS OF THE STRENGTHS AND LIMITATION OF
QUALITATIVE AND QUANTITATIVE RESEARCH PARADIGMS,” 2019. [Online].
Available: https://www.scientiasocialis.lt/pec/files/pdf/Atieno_Vol.13.pdf. [Accessed 14
2021].