
Identifying Priority Hazardous Air Pollutants of Potential ... · 9 p-Dichlorobenzene 76.6 8...
35
Identifying Priority Hazardous Air Pollutants of Potential Concern: A Comparison of Toxicity-Weighted Emissions and Ambient Risk Screening Results Regi Oommen, Jaime Hauser, Julie Swift, and Dave Dayton Eastern Research Group, Inc. Morrisville, NC [email protected] Mike Jones, Anne Pope, and James Hemby U.S. EPA Research Triangle Park, NC June 4, 2008 17 th Annual International Inventory Conference – Portland, OR
Transcript of Identifying Priority Hazardous Air Pollutants of Potential ... · 9 p-Dichlorobenzene 76.6 8...
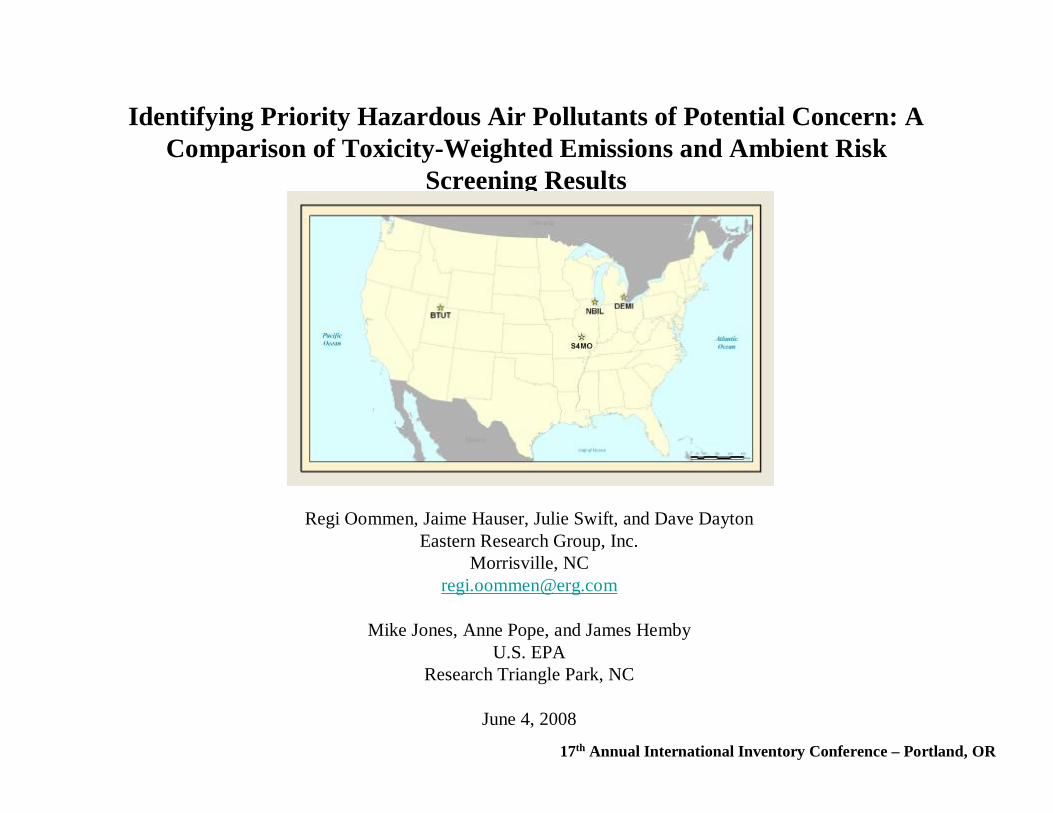
Identifying Priority Hazardous Air Pollutants of Potential Concern: A Comparison of Toxicity-Weighted Emissions and Ambient Risk
Screening Results
Regi Oommen, Jaime Hauser, Julie Swift, and Dave DaytonEastern Research Group, Inc.
Morrisville, [email protected]
Mike Jones, Anne Pope, and James HembyU.S. EPA
Research Triangle Park, NC
June 4, 2008
17th Annual International Inventory Conference – Portland, OR
Acknowledgements
• U.S. EPA – Anne Pope, Mike Jones, and James Hemby
• Other ERG staff: • Dave Dayton • Julie Swift• Jaime Hauser
Oommen, pg 2 17th Annual International Inventory Conference – Portland, OR
Overview of Presentation
• Background on Urban Air Toxics Monitoring Program (UATMP) and Risk
• Toxicity-Weighted Calculations Approach
• Wrap-up
17th Annual International Inventory Conference – Portland, OROommen, pg 3
• Results
Background of the UATMP
• Sponsored by EPA; began in 1987
• Goal: Characterize the composition and magnitude of urban air pollution through ambient monitoring.
• EPA Regional/State/Local/Tribal agencies participate; number of sites varies by year
• Historically, data collected within the UATMP has been considered by EPA as the most representative data available for air toxics monitoring (Level 1 EPA QAPP).
Oommen, pg 4 17th Annual International Inventory Conference – Portland, OR
Background of the UATMP
• Potential of over 50 HAPs
• Pollutants Measured:• Volatile Organic Compounds (VOCs)• Carbonyl Compounds• Metals/Hexavalent Chromium• Semi-VOCs• Speciated Non-Methane Organic Compounds
• Important non-HAPs: acetylene, ethylene, TAME, ETBE
Oommen, pg 5 17th Annual International Inventory Conference – Portland, OR
• HAPs can be both cancer and noncancer
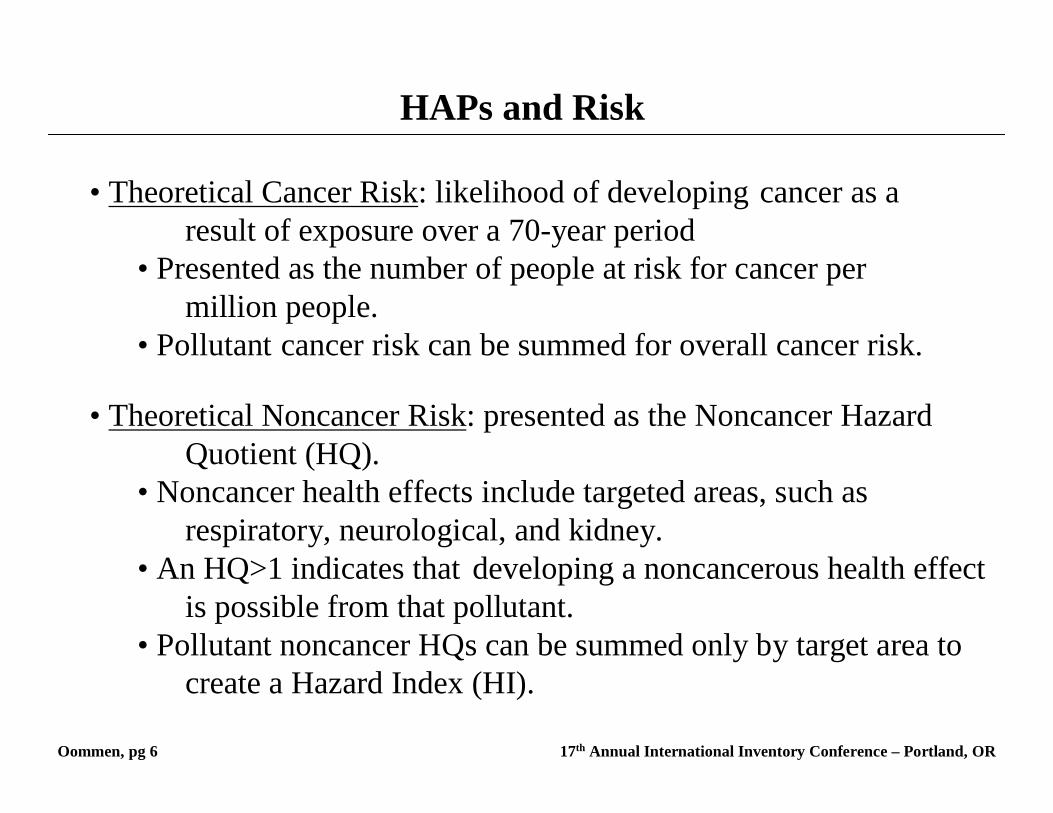
HAPs and Risk
• Theoretical Cancer Risk: likelihood of developing cancer as a result of exposure over a 70-year period
• Presented as the number of people at risk for cancer per million people.
• Pollutant cancer risk can be summed for overall cancer risk.
Oommen, pg 6 17th Annual International Inventory Conference – Portland, OR
• Theoretical Noncancer Risk: presented as the Noncancer Hazard Quotient (HQ).
• Noncancer health effects include targeted areas, such as respiratory, neurological, and kidney.
• An HQ>1 indicates that developing a noncancerous health effect is possible from that pollutant.
• Pollutant noncancer HQs can be summed only by target area to create a Hazard Index (HI).
HAPs and Risk
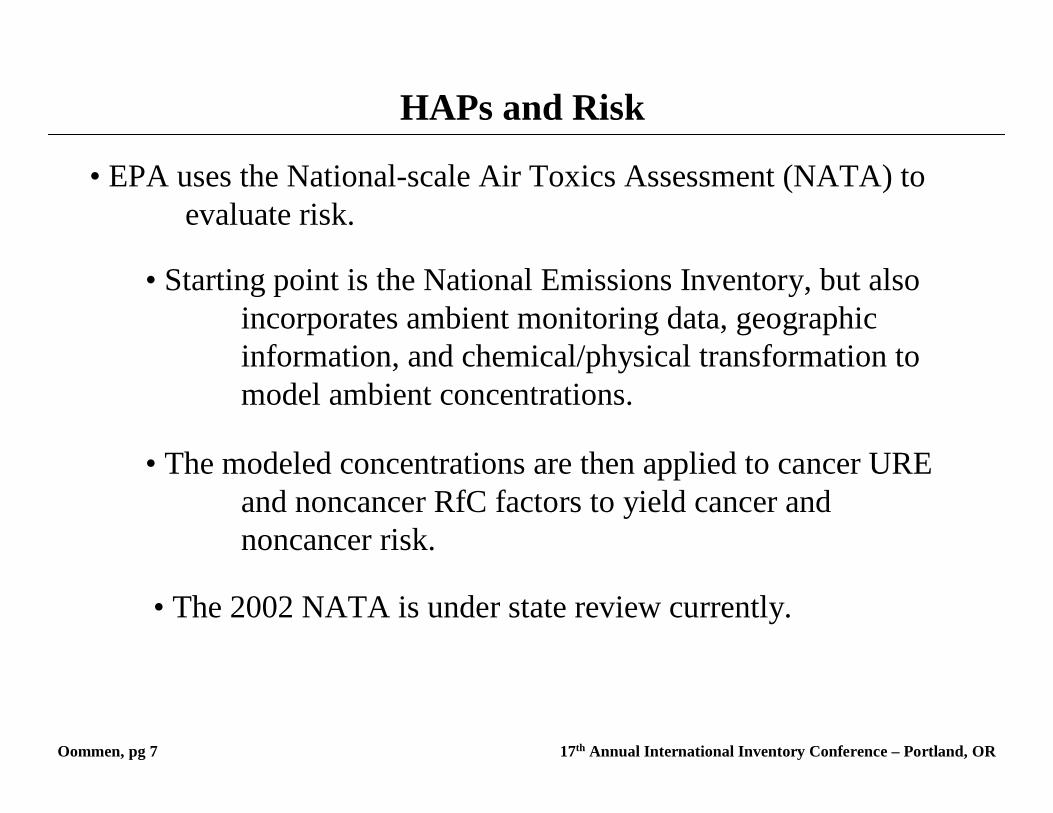
• Starting point is the National Emissions Inventory, but also incorporates ambient monitoring data, geographic information, and chemical/physical transformation to model ambient concentrations.
• EPA uses the National-scale Air Toxics Assessment (NATA) to evaluate risk.
Oommen, pg 7 17th Annual International Inventory Conference – Portland, OR
• The modeled concentrations are then applied to cancer URE and noncancer RfC factors to yield cancer and noncancer risk.
• The 2002 NATA is under state review currently.
HAPs and Risk
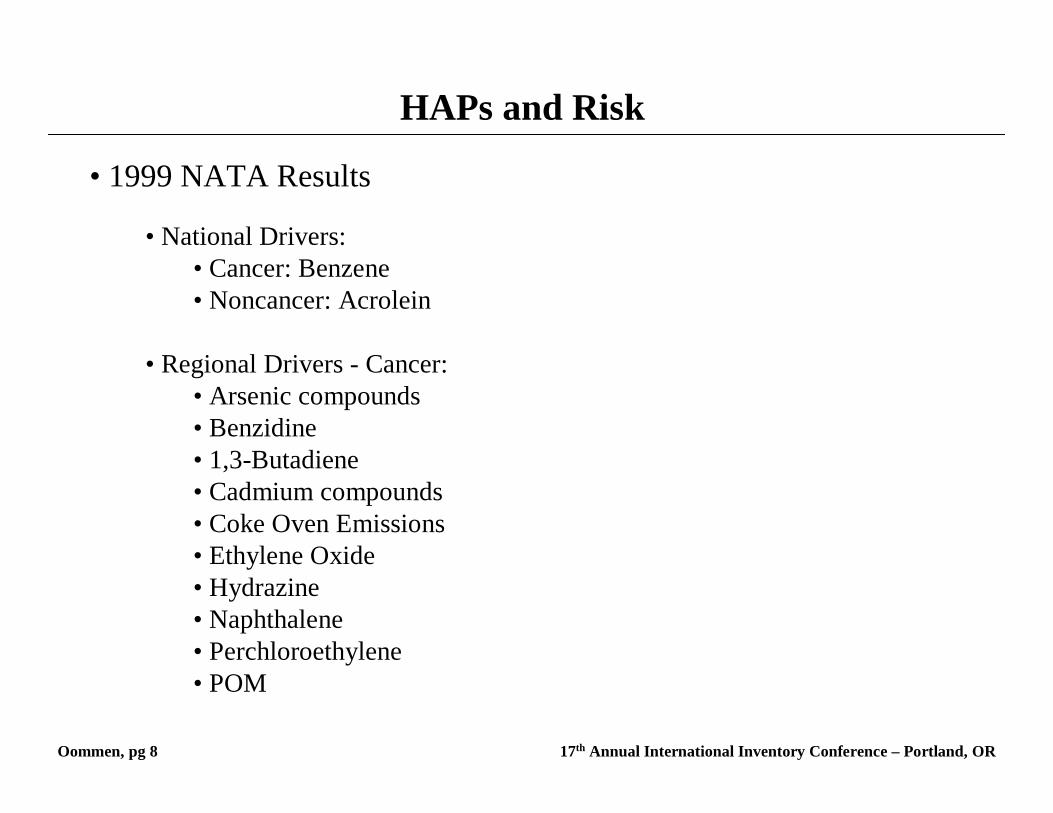
• 1999 NATA Results
Oommen, pg 8 17th Annual International Inventory Conference – Portland, OR
• National Drivers:• Cancer: Benzene• Noncancer: Acrolein
• Regional Drivers - Cancer:• Arsenic compounds• Benzidine• 1,3-Butadiene• Cadmium compounds• Coke Oven Emissions• Ethylene Oxide• Hydrazine• Naphthalene• Perchloroethylene• POM
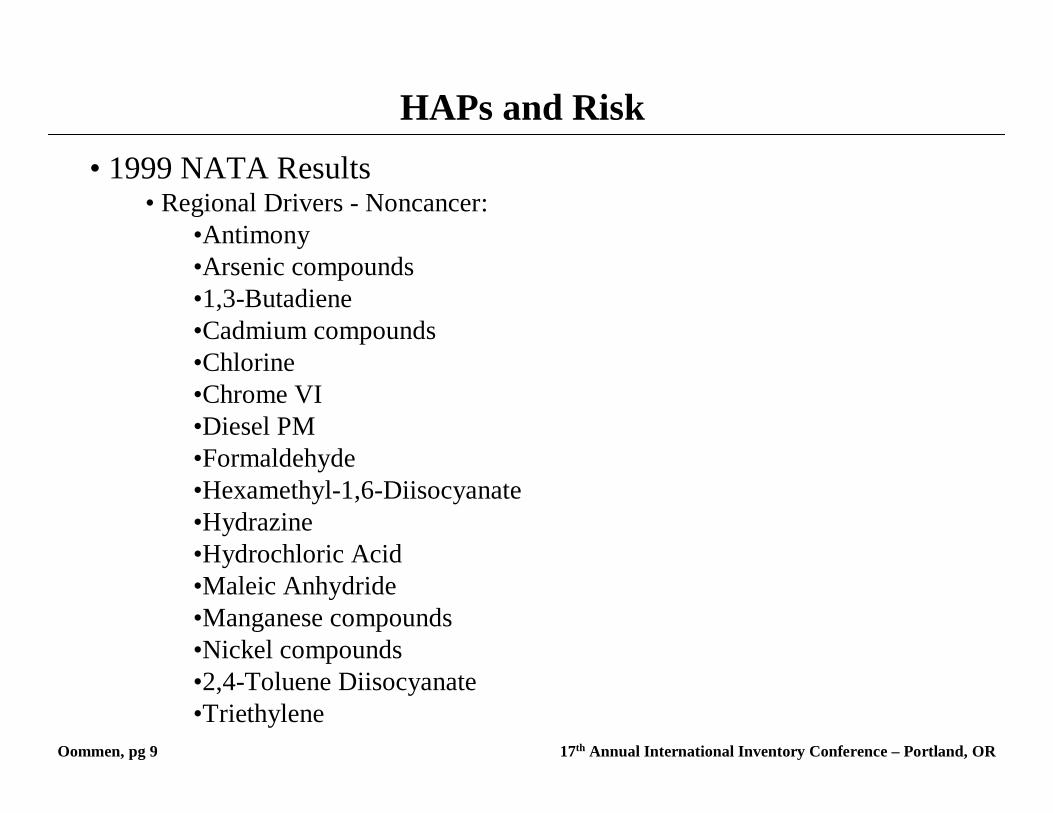
HAPs and Risk• 1999 NATA Results
Oommen, pg 9 17th Annual International Inventory Conference – Portland, OR
• Regional Drivers - Noncancer:•Antimony•Arsenic compounds•1,3-Butadiene•Cadmium compounds•Chlorine•Chrome VI•Diesel PM•Formaldehyde•Hexamethyl-1,6-Diisocyanate•Hydrazine•Hydrochloric Acid•Maleic Anhydride•Manganese compounds•Nickel compounds•2,4-Toluene Diisocyanate•Triethylene
Toxicity-Weighted Emissions
• Question: From an emissions inventory standpoint, what pollutants are most toxic?
• Problem: difficult to assess toxicity by comparing mass emissions…a little dioxin (pounds) can hurt you…
• Solution: tox-weight (or relatively rank the toxicity of) the emissions inventory based on cancer and noncancer benchmarks.
• Further: How do the tox-weighted emissions ranking compare to the ambient monitoring data?
Oommen, pg 10 17th Annual International Inventory Conference – Portland, OR
• Methodology presented at the 2007 Emission Inventory Conference (http://www.epa.gov/ttn/chief/conference/ei16/session6/a.pope.pdf)
• Good approach for comparing emissions and concentrations from a toxicity standpoint.
• Good approach to “screen” and “identify” pollutants of concern
Oommen, pg 11 17th Annual International Inventory Conference – Portland, OR
• Toxicity-Weighted Calculations Approach
• For the 2006 Annual UATMP Report, the Top 10 pollutants based on toxicity-weighted emissions (cancer and noncancer) are calculated for each site’s county.
• Compare the ranking of the cancer and noncancer risk to the ranking of the tox-weighted emissions.
• Note: 2006 is the first year where acrolein sampling occurred year-round.
Oommen, pg 12 17th Annual International Inventory Conference – Portland, OR
Toxicity-Weighted Calculations Approach
• Approach: • Step 1 – Obtain the HAP data from the 2002 NEI (all sectors)
• Step 2 – Except for two chromium species (pollcode = 7440473 and 136), apply the Metal_CN Speciation Factor to extract metal and cyanide mass.
• Step 3 – Apply the chromium speciation factor to pollcodes 7440473 and 136 to determine Cr6+ and Cr3+ emissions
Oommen, pg 13 17th Annual International Inventory Conference – Portland, OR
Toxicity-Weighted Calculations Approach
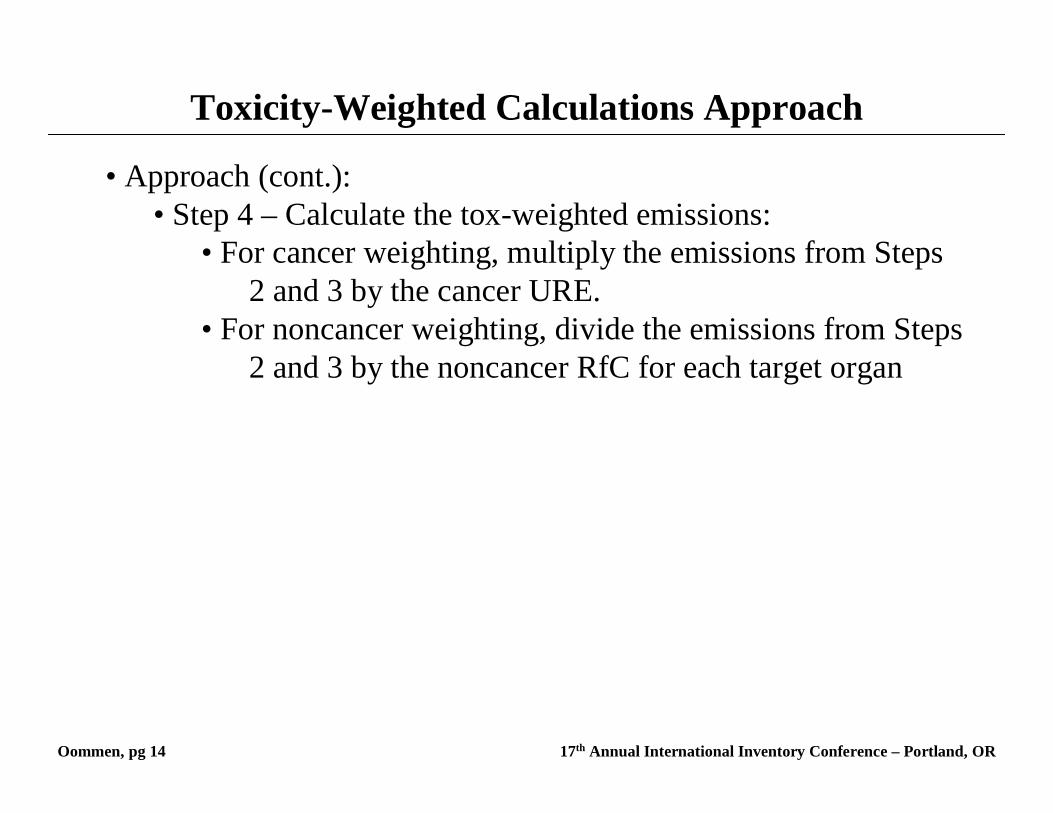
• Approach (cont.): • Step 4 – Calculate the tox-weighted emissions:
• For cancer weighting, multiply the emissions from Steps 2 and 3 by the cancer URE.
• For noncancer weighting, divide the emissions from Steps 2 and 3 by the noncancer RfC for each target organ
Oommen, pg 14 17th Annual International Inventory Conference – Portland, OR
Toxicity-Weighted Calculations Approach
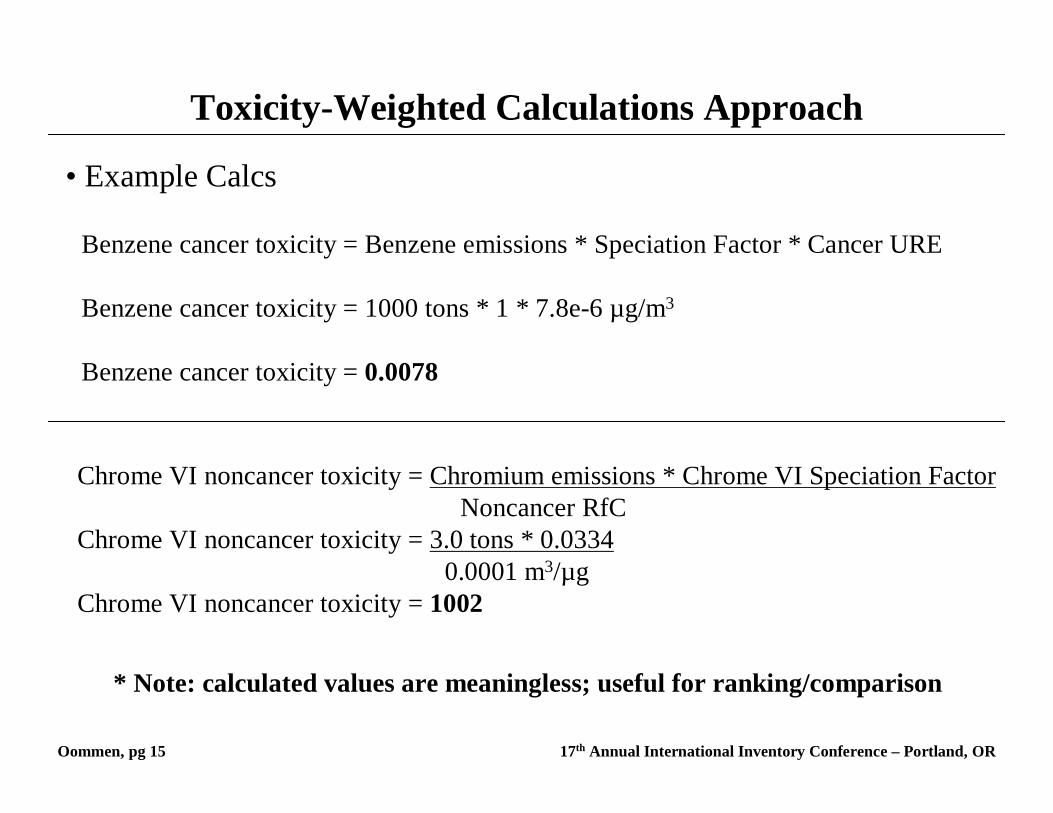
• Example Calcs
Oommen, pg 15 17th Annual International Inventory Conference – Portland, OR
Toxicity-Weighted Calculations Approach
Benzene cancer toxicity = Benzene emissions * Speciation Factor * Cancer URE
Benzene cancer toxicity = 1000 tons * 1 * 7.8e-6 µg/m3
Benzene cancer toxicity = 0.0078
Chrome VI noncancer toxicity = Chromium emissions * Chrome VI Speciation FactorNoncancer RfC
Chrome VI noncancer toxicity = 3.0 tons * 0.03340.0001 m3/µg
Chrome VI noncancer toxicity = 1002
* Note: calculated values are meaningless; useful for ranking/comparison
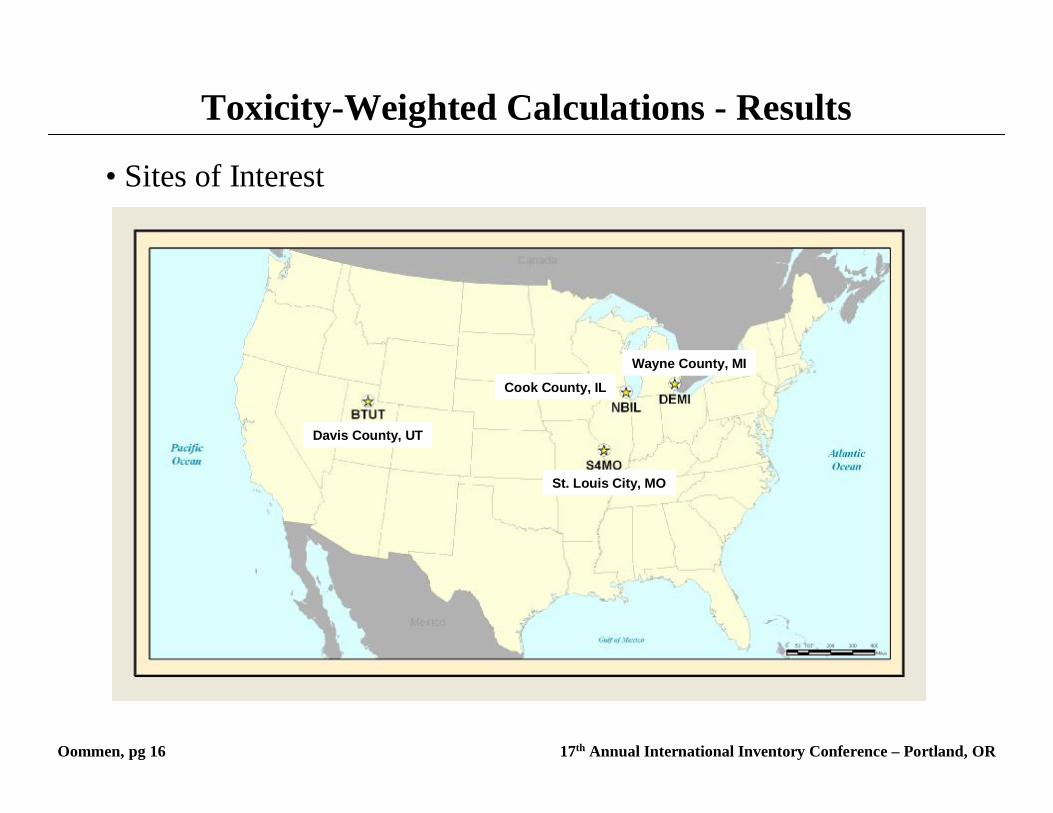
• Sites of Interest
Oommen, pg 16 17th Annual International Inventory Conference – Portland, OR
Toxicity-Weighted Calculations - Results
Wayne County, MI
Cook County, IL
St. Louis City, MO
Davis County, UT
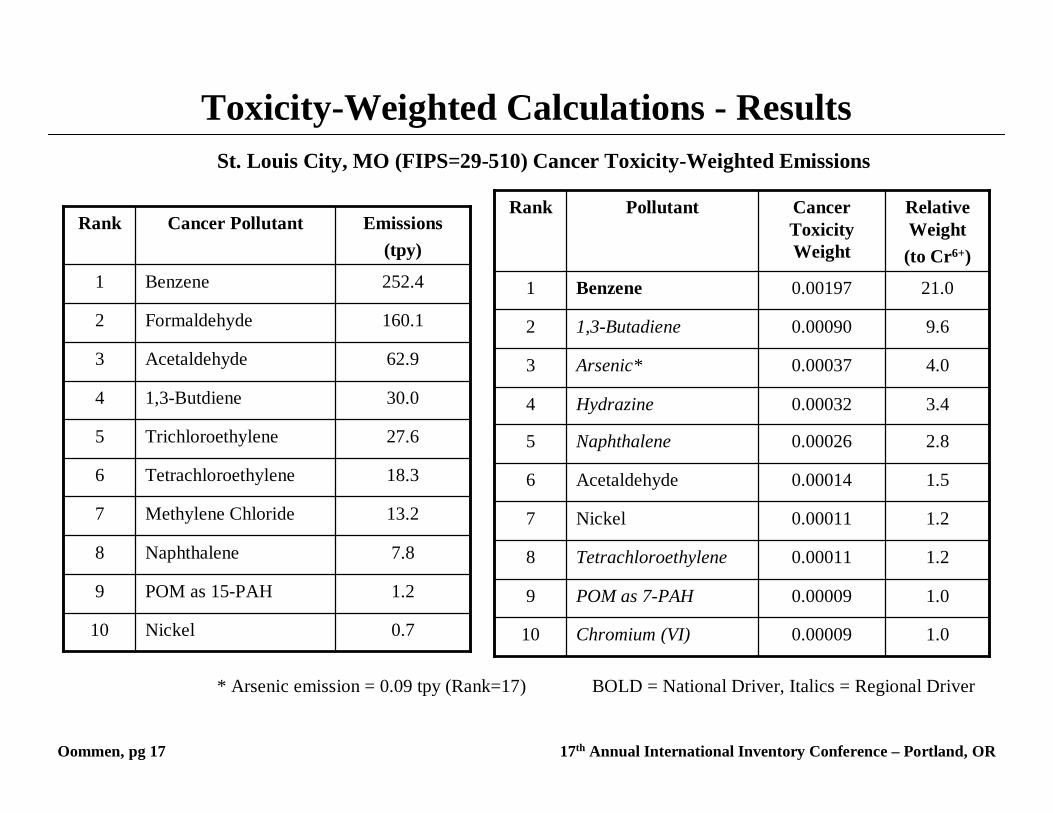
0.7Nickel10
1.2POM as 15-PAH9
7.8Naphthalene8
13.2Methylene Chloride7
18.3Tetrachloroethylene6
27.6Trichloroethylene5
30.01,3-Butdiene4
62.9Acetaldehyde3
160.1Formaldehyde2
252.4Benzene1
Emissions(tpy)
Cancer PollutantRank
0.00009
0.00009
0.00011
0.00011
0.00014
0.00026
0.00032
0.00037
0.00090
0.00197
Cancer Toxicity Weight
1.0
1.0
1.2
1.2
1.5
2.8
3.4
4.0
9.6
21.0
Relative Weight
(to Cr6+)
Chromium (VI)10
POM as 7-PAH9
Tetrachloroethylene8
Nickel7
Acetaldehyde6
Naphthalene5
Hydrazine4
Arsenic*3
1,3-Butadiene2
Benzene1
PollutantRank
St. Louis City, MO (FIPS=29-510) Cancer Toxicity-Weighted Emissions
* Arsenic emission = 0.09 tpy (Rank=17)
Oommen, pg 17 17th Annual International Inventory Conference – Portland, OR
Toxicity-Weighted Calculations - Results
BOLD = National Driver, Italics = Regional Driver
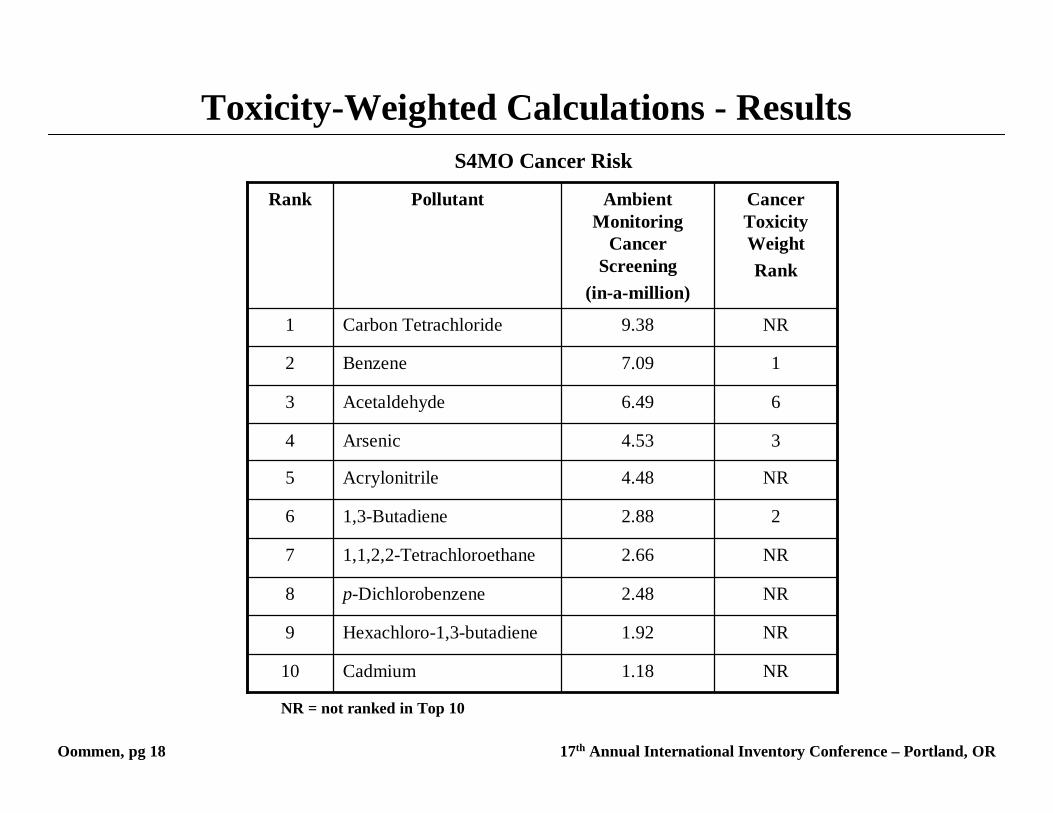
1.18
1.92
2.48
2.66
2.88
4.48
4.53
6.49
7.09
9.38
Ambient Monitoring
Cancer Screening
(in-a-million)
NR
NR
NR
NR
2
NR
3
6
1
NR
Cancer Toxicity WeightRank
Cadmium10
Hexachloro-1,3-butadiene9
p-Dichlorobenzene8
1,1,2,2-Tetrachloroethane7
1,3-Butadiene6
Acrylonitrile5
Arsenic4
Acetaldehyde3
Benzene2
Carbon Tetrachloride1
PollutantRank
S4MO Cancer Risk
Oommen, pg 18 17th Annual International Inventory Conference – Portland, OR
Toxicity-Weighted Calculations - Results
NR = not ranked in Top 10
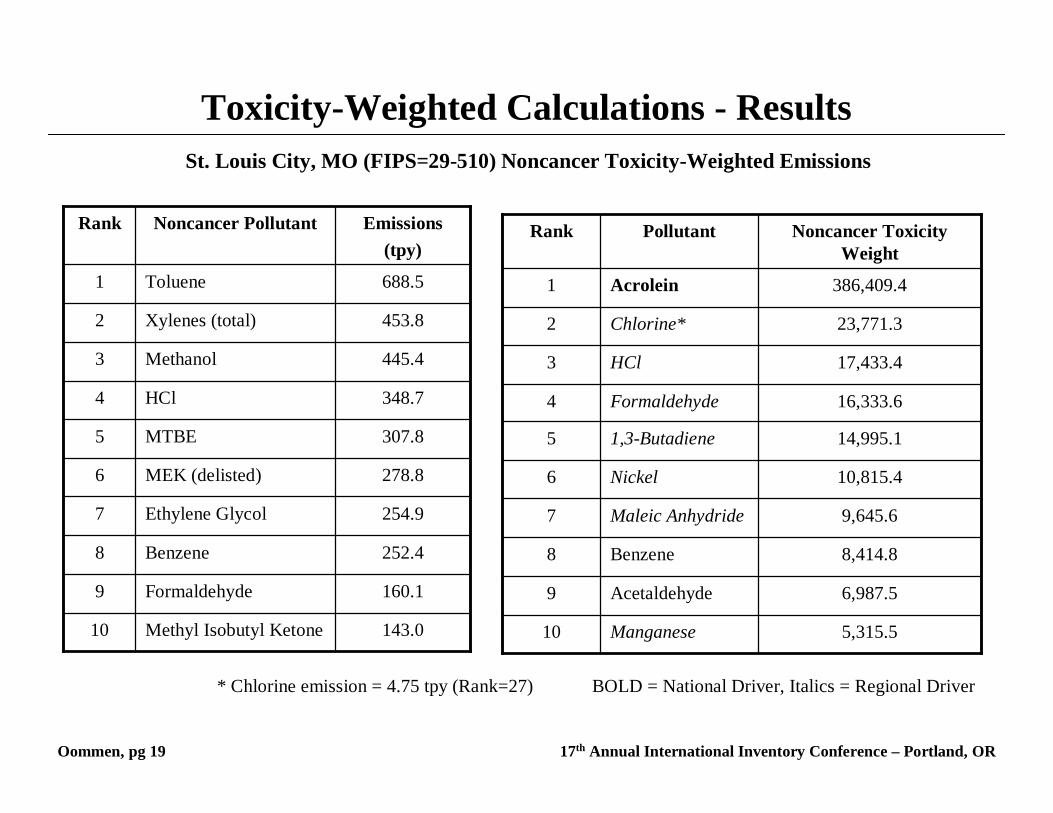
143.0Methyl Isobutyl Ketone10
160.1Formaldehyde9
252.4Benzene8
254.9Ethylene Glycol7
278.8MEK (delisted)6
307.8MTBE5
348.7HCl4
445.4Methanol3
453.8Xylenes (total)2
688.5Toluene1
Emissions(tpy)
Noncancer PollutantRank
5,315.5
6,987.5
8,414.8
9,645.6
10,815.4
14,995.1
16,333.6
17,433.4
23,771.3
386,409.4
Noncancer Toxicity Weight
Manganese10
Acetaldehyde9
Benzene8
Maleic Anhydride7
Nickel6
1,3-Butadiene5
Formaldehyde4
HCl3
Chlorine*2
Acrolein1
PollutantRank
Oommen, pg 19 17th Annual International Inventory Conference – Portland, OR
Toxicity-Weighted Calculations - ResultsSt. Louis City, MO (FIPS=29-510) Noncancer Toxicity-Weighted Emissions
* Chlorine emission = 4.75 tpy (Rank=27) BOLD = National Driver, Italics = Regional Driver
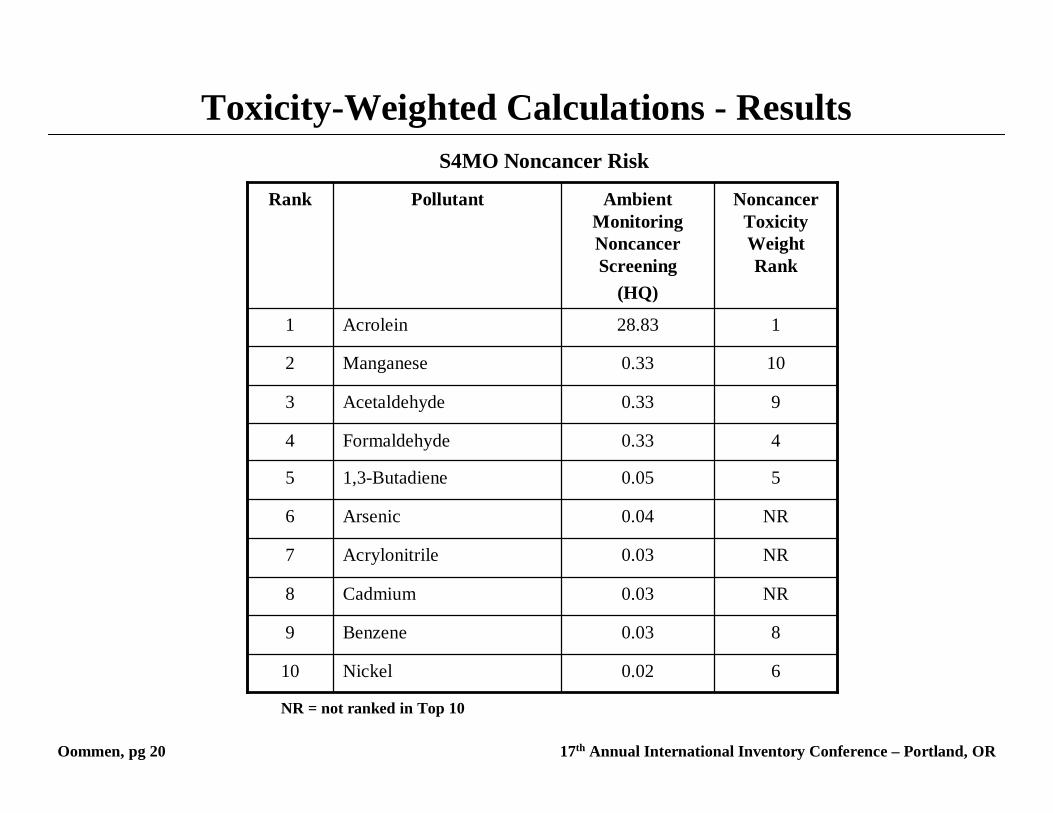
S4MO Noncancer Risk
Oommen, pg 20 17th Annual International Inventory Conference – Portland, OR
Toxicity-Weighted Calculations - Results
0.02
0.03
0.03
0.03
0.04
0.05
0.33
0.33
0.33
28.83
Ambient Monitoring Noncancer Screening
(HQ)
6
8
NR
NR
NR
5
4
9
10
1
Noncancer Toxicity Weight Rank
Nickel10
Benzene9
Cadmium8
Acrylonitrile7
Arsenic6
1,3-Butadiene5
Formaldehyde4
Acetaldehyde3
Manganese2
Acrolein1
PollutantRank
NR = not ranked in Top 10
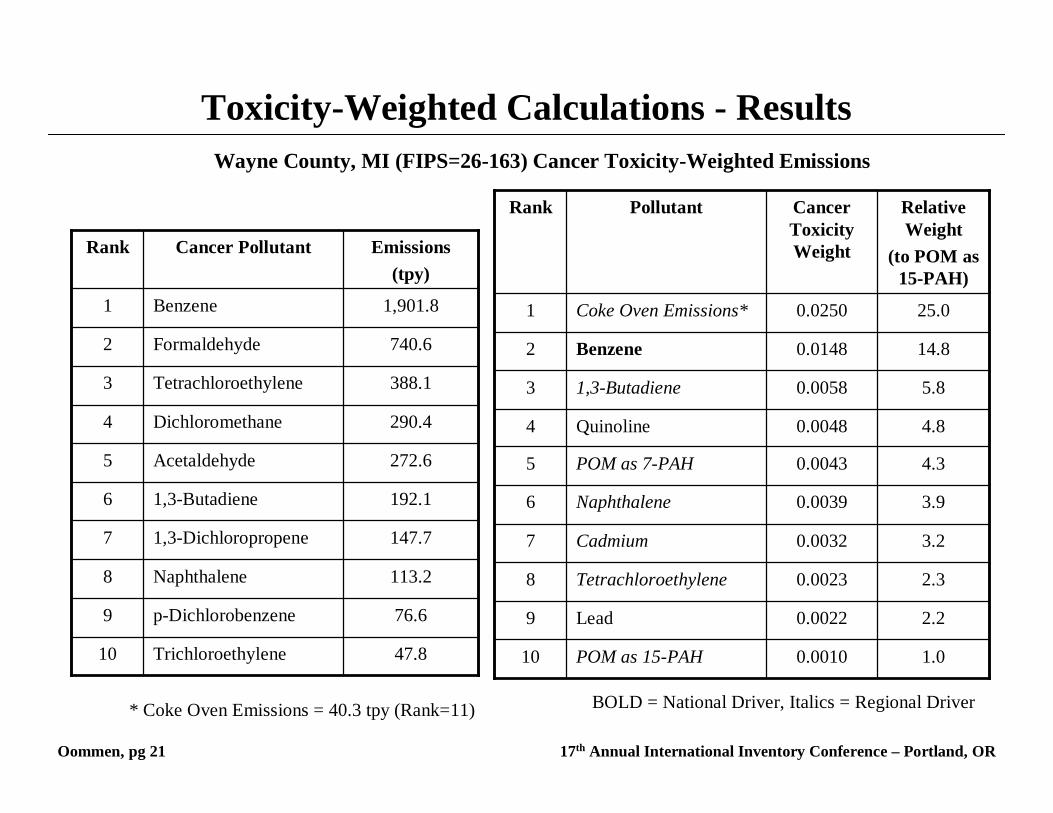
47.8Trichloroethylene10
76.6p-Dichlorobenzene9
113.2Naphthalene8
147.71,3-Dichloropropene7
192.11,3-Butadiene6
272.6Acetaldehyde5
290.4Dichloromethane4
388.1Tetrachloroethylene3
740.6Formaldehyde2
1,901.8Benzene1
Emissions(tpy)
Cancer PollutantRank
0.0010
0.0022
0.0023
0.0032
0.0039
0.0043
0.0048
0.0058
0.0148
0.0250
Cancer Toxicity Weight
1.0
2.2
2.3
3.2
3.9
4.3
4.8
5.8
14.8
25.0
Relative Weight
(to POM as 15-PAH)
POM as 15-PAH10
Lead9
Tetrachloroethylene8
Cadmium7
Naphthalene6
POM as 7-PAH5
Quinoline4
1,3-Butadiene3
Benzene2
Coke Oven Emissions*1
PollutantRank
Wayne County, MI (FIPS=26-163) Cancer Toxicity-Weighted Emissions
Oommen, pg 21 17th Annual International Inventory Conference – Portland, OR
Toxicity-Weighted Calculations - Results
* Coke Oven Emissions = 40.3 tpy (Rank=11) BOLD = National Driver, Italics = Regional Driver
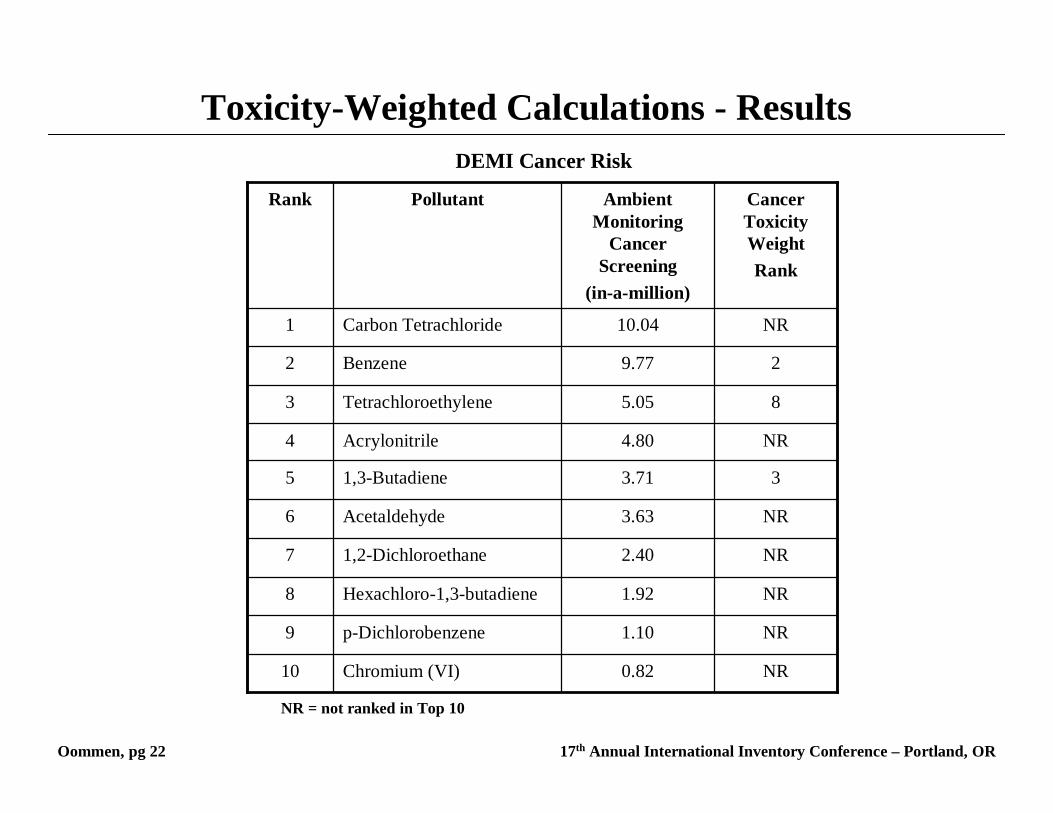
0.82
1.10
1.92
2.40
3.63
3.71
4.80
5.05
9.77
10.04
Ambient Monitoring
Cancer Screening
(in-a-million)
NR
NR
NR
NR
NR
3
NR
8
2
NR
Cancer Toxicity WeightRank
Chromium (VI)10
p-Dichlorobenzene9
Hexachloro-1,3-butadiene8
1,2-Dichloroethane7
Acetaldehyde6
1,3-Butadiene5
Acrylonitrile4
Tetrachloroethylene3
Benzene2
Carbon Tetrachloride1
PollutantRank
DEMI Cancer Risk
Oommen, pg 22 17th Annual International Inventory Conference – Portland, OR
Toxicity-Weighted Calculations - Results
NR = not ranked in Top 10
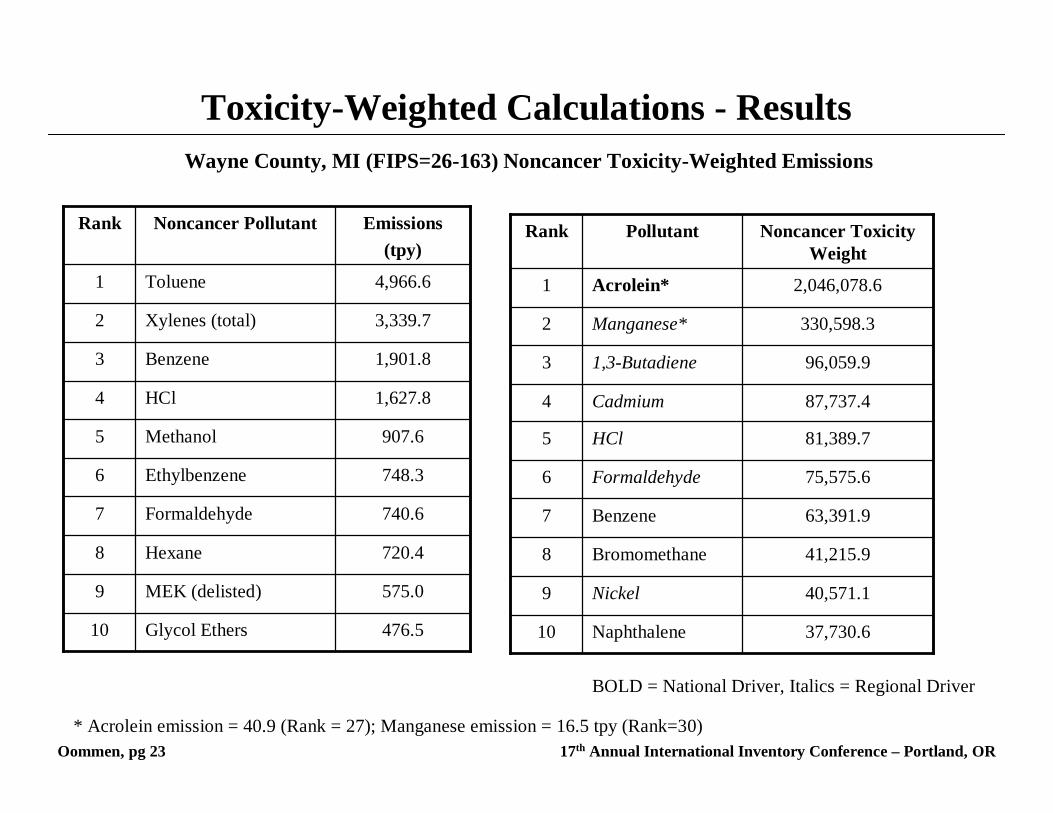
476.5Glycol Ethers10
575.0MEK (delisted)9
720.4Hexane8
740.6Formaldehyde7
748.3Ethylbenzene6
907.6Methanol5
1,627.8HCl4
1,901.8Benzene3
3,339.7Xylenes (total)2
4,966.6Toluene1
Emissions(tpy)
Noncancer PollutantRank
37,730.6
40,571.1
41,215.9
63,391.9
75,575.6
81,389.7
87,737.4
96,059.9
330,598.3
2,046,078.6
Noncancer Toxicity Weight
Naphthalene10
Nickel9
Bromomethane8
Benzene7
Formaldehyde6
HCl5
Cadmium4
1,3-Butadiene3
Manganese*2
Acrolein*1
PollutantRank
Oommen, pg 23 17th Annual International Inventory Conference – Portland, OR
Toxicity-Weighted Calculations - ResultsWayne County, MI (FIPS=26-163) Noncancer Toxicity-Weighted Emissions
* Acrolein emission = 40.9 (Rank = 27); Manganese emission = 16.5 tpy (Rank=30)
BOLD = National Driver, Italics = Regional Driver
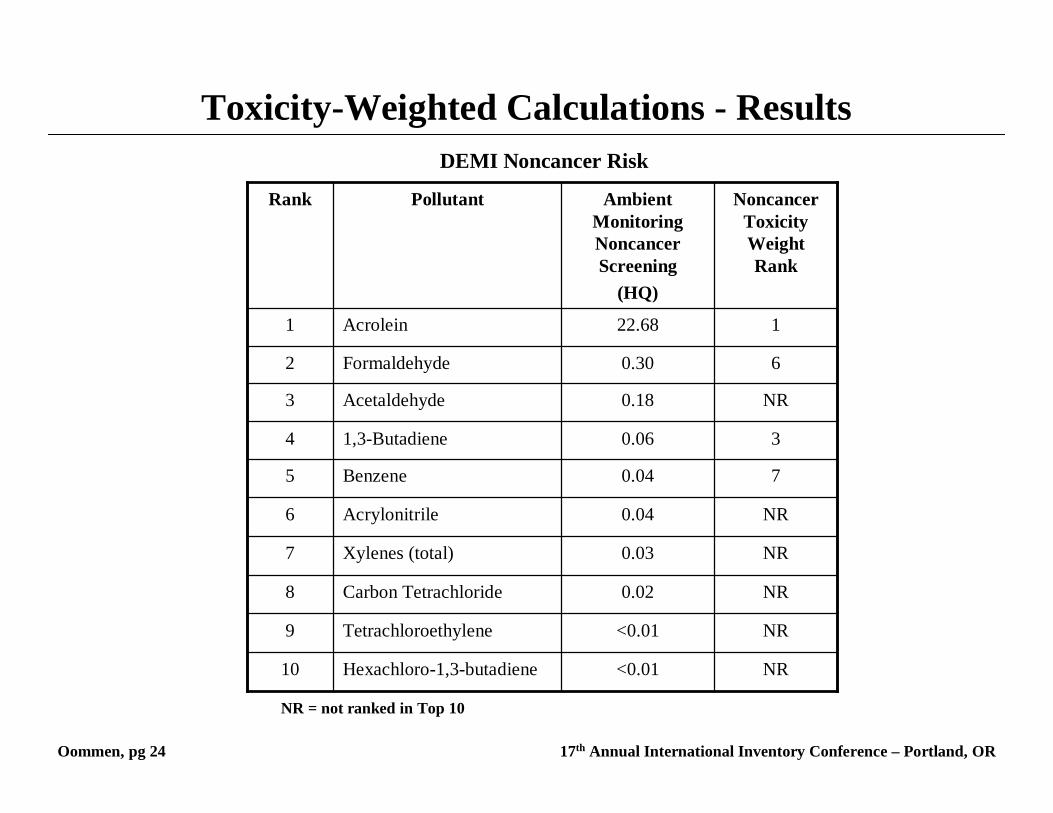
DEMI Noncancer Risk
Oommen, pg 24 17th Annual International Inventory Conference – Portland, OR
Toxicity-Weighted Calculations - Results
<0.01
<0.01
0.02
0.03
0.04
0.04
0.06
0.18
0.30
22.68
Ambient Monitoring Noncancer Screening
(HQ)
NR
NR
NR
NR
NR
7
3
NR
6
1
Noncancer Toxicity Weight Rank
Hexachloro-1,3-butadiene10
Tetrachloroethylene9
Carbon Tetrachloride8
Xylenes (total)7
Acrylonitrile6
Benzene5
1,3-Butadiene4
Acetaldehyde3
Formaldehyde2
Acrolein1
PollutantRank
NR = not ranked in Top 10
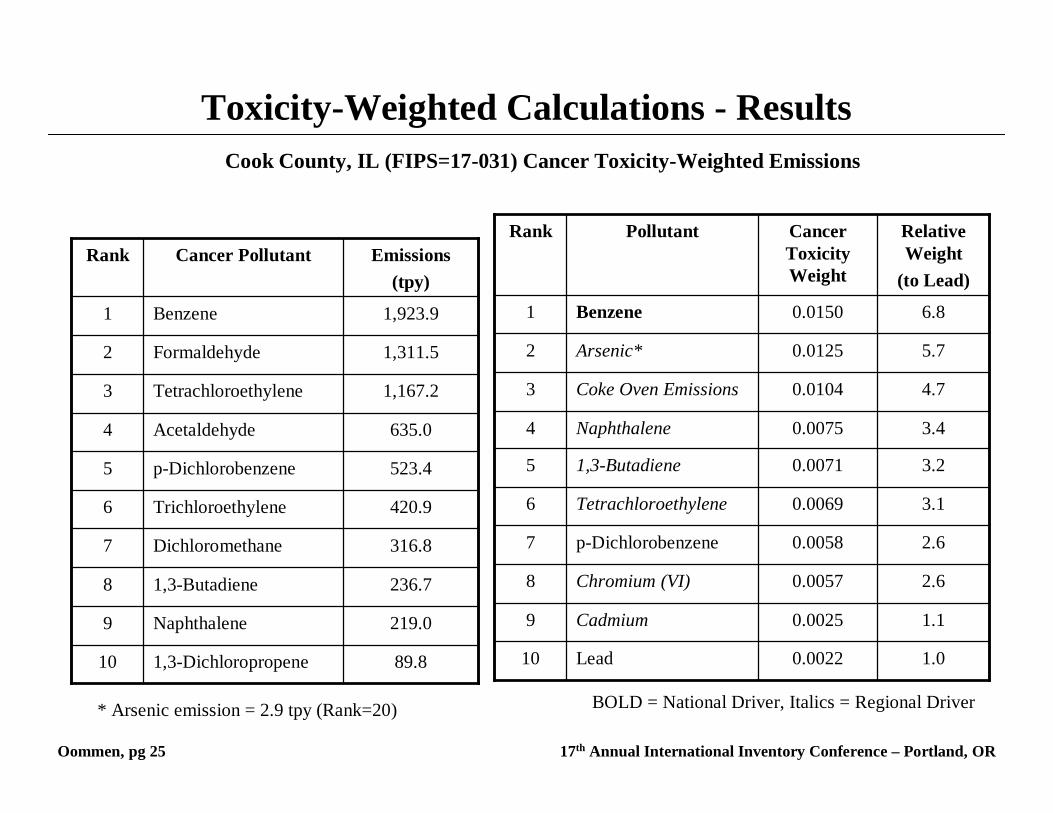
89.81,3-Dichloropropene10
219.0Naphthalene9
236.71,3-Butadiene8
316.8Dichloromethane7
420.9Trichloroethylene6
523.4p-Dichlorobenzene5
635.0Acetaldehyde4
1,167.2Tetrachloroethylene3
1,311.5Formaldehyde2
1,923.9Benzene1
Emissions(tpy)
Cancer PollutantRank
0.0022
0.0025
0.0057
0.0058
0.0069
0.0071
0.0075
0.0104
0.0125
0.0150
Cancer Toxicity Weight
1.0
1.1
2.6
2.6
3.1
3.2
3.4
4.7
5.7
6.8
Relative Weight
(to Lead)
Lead10
Cadmium9
Chromium (VI)8
p-Dichlorobenzene7
Tetrachloroethylene6
1,3-Butadiene5
Naphthalene4
Coke Oven Emissions3
Arsenic*2
Benzene1
PollutantRank
Cook County, IL (FIPS=17-031) Cancer Toxicity-Weighted Emissions
Oommen, pg 25 17th Annual International Inventory Conference – Portland, OR
Toxicity-Weighted Calculations - Results
* Arsenic emission = 2.9 tpy (Rank=20) BOLD = National Driver, Italics = Regional Driver
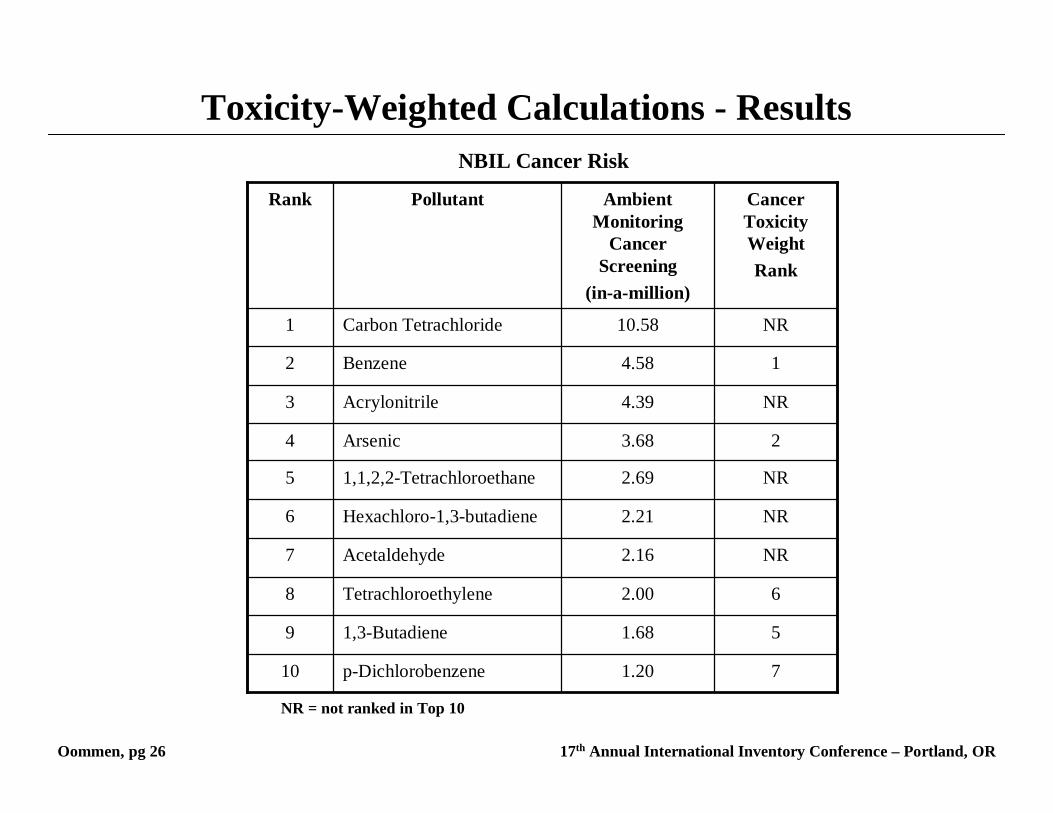
1.20
1.68
2.00
2.16
2.21
2.69
3.68
4.39
4.58
10.58
Ambient Monitoring
Cancer Screening
(in-a-million)
7
5
6
NR
NR
NR
2
NR
1
NR
Cancer Toxicity WeightRank
p-Dichlorobenzene10
1,3-Butadiene9
Tetrachloroethylene8
Acetaldehyde7
Hexachloro-1,3-butadiene6
1,1,2,2-Tetrachloroethane5
Arsenic4
Acrylonitrile3
Benzene2
Carbon Tetrachloride1
PollutantRank
NBIL Cancer Risk
Oommen, pg 26 17th Annual International Inventory Conference – Portland, OR
Toxicity-Weighted Calculations - Results
NR = not ranked in Top 10
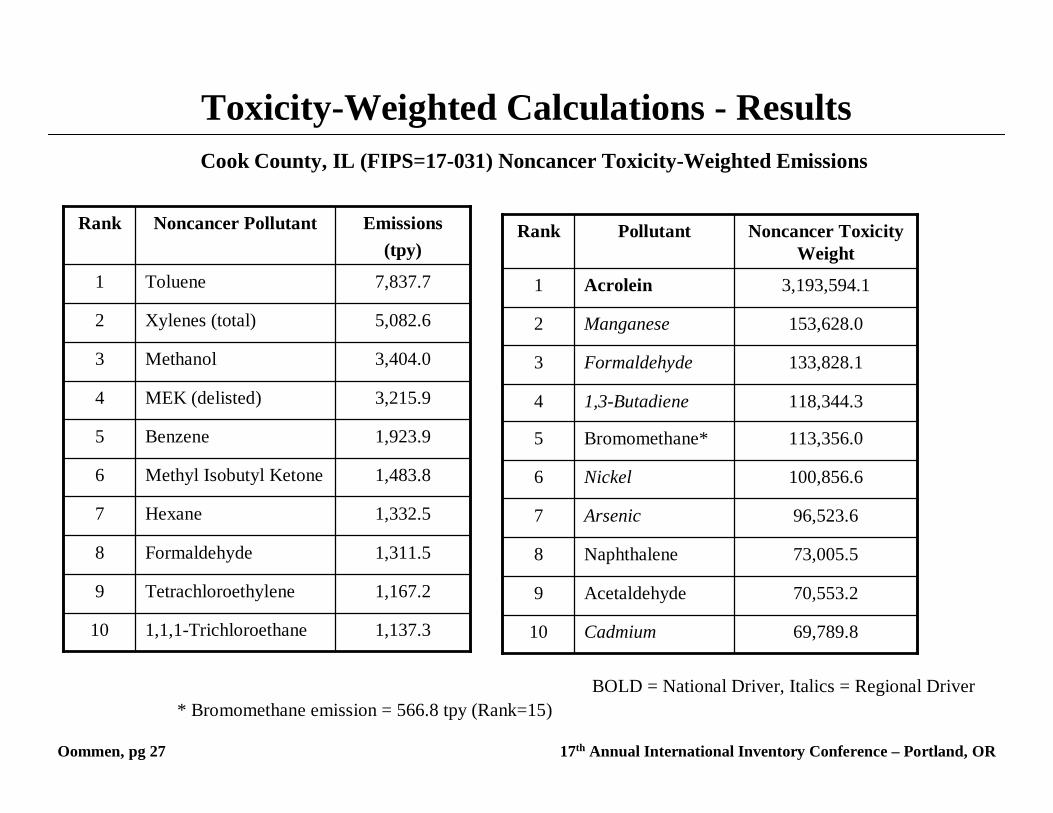
1,137.31,1,1-Trichloroethane10
1,167.2Tetrachloroethylene9
1,311.5Formaldehyde8
1,332.5Hexane7
1,483.8Methyl Isobutyl Ketone6
1,923.9Benzene5
3,215.9MEK (delisted)4
3,404.0Methanol3
5,082.6Xylenes (total)2
7,837.7Toluene1
Emissions(tpy)
Noncancer PollutantRank
69,789.8
70,553.2
73,005.5
96,523.6
100,856.6
113,356.0
118,344.3
133,828.1
153,628.0
3,193,594.1
Noncancer Toxicity Weight
Cadmium10
Acetaldehyde9
Naphthalene8
Arsenic7
Nickel6
Bromomethane*5
1,3-Butadiene4
Formaldehyde3
Manganese2
Acrolein1
PollutantRank
Oommen, pg 27 17th Annual International Inventory Conference – Portland, OR
Toxicity-Weighted Calculations - ResultsCook County, IL (FIPS=17-031) Noncancer Toxicity-Weighted Emissions
* Bromomethane emission = 566.8 tpy (Rank=15)BOLD = National Driver, Italics = Regional Driver
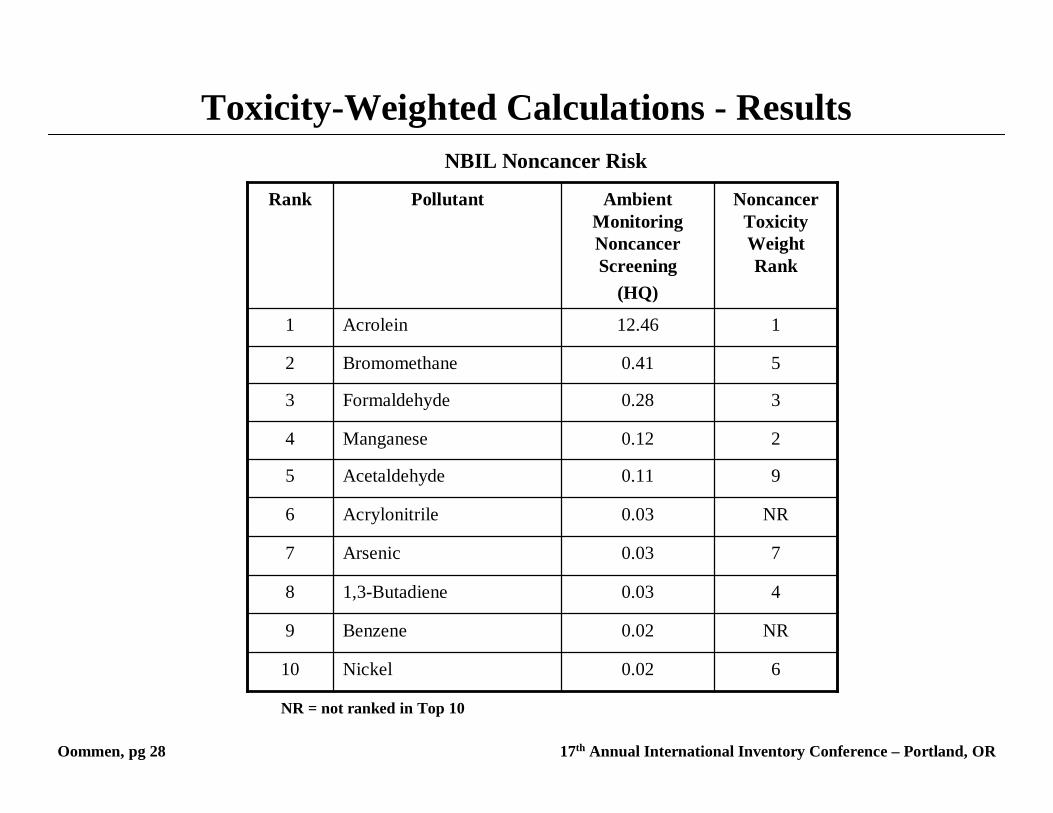
NBIL Noncancer Risk
Oommen, pg 28 17th Annual International Inventory Conference – Portland, OR
Toxicity-Weighted Calculations - Results
0.02
0.02
0.03
0.03
0.03
0.11
0.12
0.28
0.41
12.46
Ambient Monitoring Noncancer Screening
(HQ)
6
NR
4
7
NR
9
2
3
5
1
Noncancer Toxicity Weight Rank
Nickel10
Benzene9
1,3-Butadiene8
Arsenic7
Acrylonitrile6
Acetaldehyde5
Manganese4
Formaldehyde3
Bromomethane2
Acrolein1
PollutantRank
NR = not ranked in Top 10
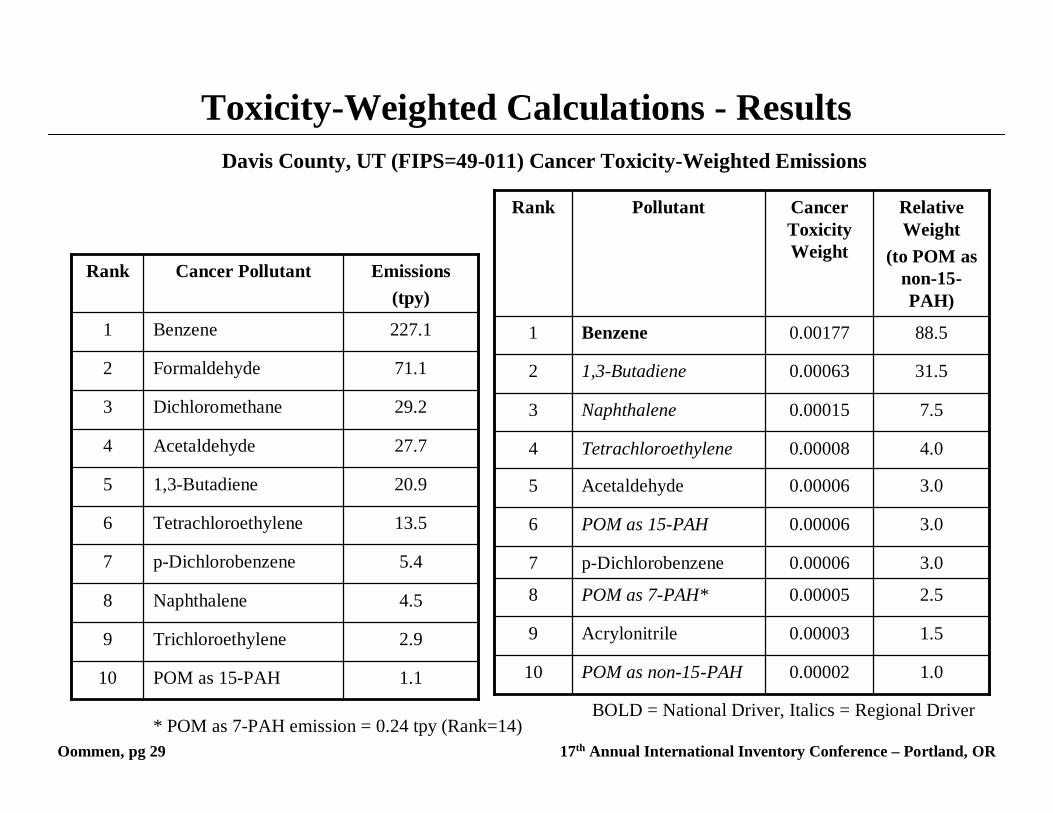
1.1POM as 15-PAH10
2.9Trichloroethylene9
4.5Naphthalene8
5.4p-Dichlorobenzene7
13.5Tetrachloroethylene6
20.91,3-Butadiene5
27.7Acetaldehyde4
29.2Dichloromethane3
71.1Formaldehyde2
227.1Benzene1
Emissions(tpy)
Cancer PollutantRank
0.00002
0.00003
0.00005
0.00006
0.00006
0.00006
0.00008
0.00015
0.00063
0.00177
Cancer Toxicity Weight
1.0
1.5
2.5
3.0
3.0
3.0
4.0
7.5
31.5
88.5
Relative Weight
(to POM as non-15-PAH)
POM as non-15-PAH10
Acrylonitrile9
POM as 7-PAH*8
p-Dichlorobenzene7
POM as 15-PAH6
Acetaldehyde5
Tetrachloroethylene4
Naphthalene3
1,3-Butadiene2
Benzene1
PollutantRank
Davis County, UT (FIPS=49-011) Cancer Toxicity-Weighted Emissions
Oommen, pg 29 17th Annual International Inventory Conference – Portland, OR
Toxicity-Weighted Calculations - Results
* POM as 7-PAH emission = 0.24 tpy (Rank=14)BOLD = National Driver, Italics = Regional Driver
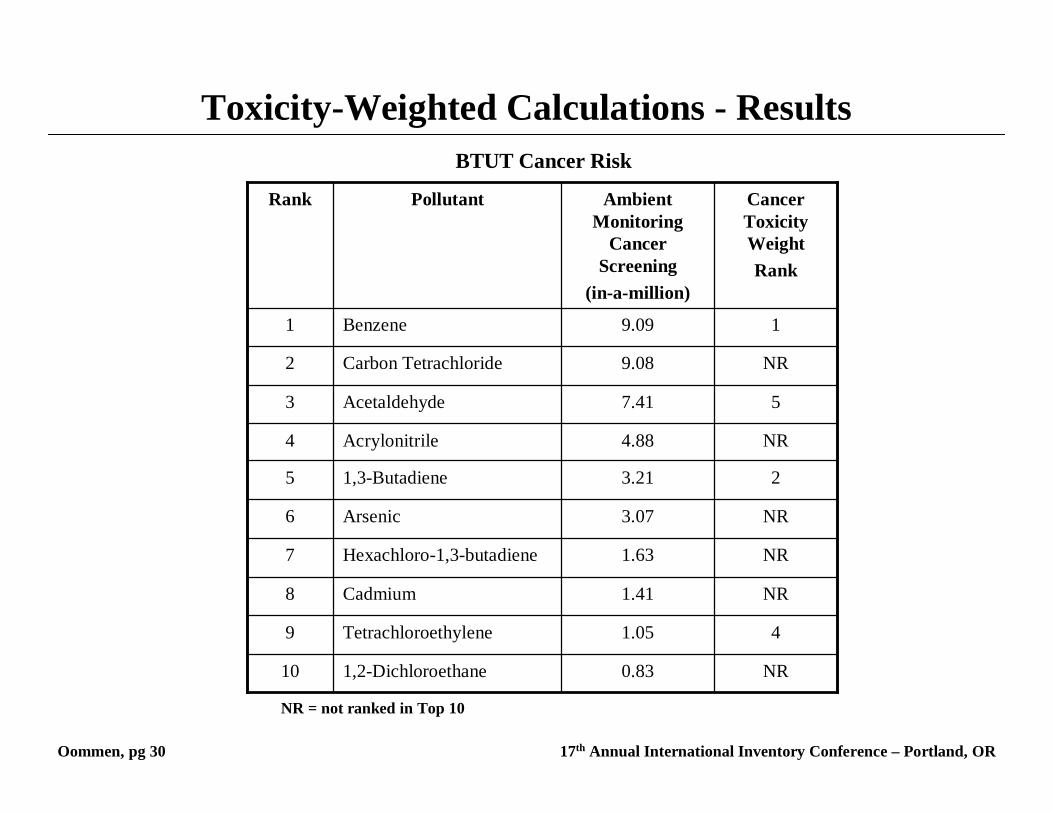
0.83
1.05
1.41
1.63
3.07
3.21
4.88
7.41
9.08
9.09
Ambient Monitoring
Cancer Screening
(in-a-million)
NR
4
NR
NR
NR
2
NR
5
NR
1
Cancer Toxicity WeightRank
1,2-Dichloroethane10
Tetrachloroethylene9
Cadmium8
Hexachloro-1,3-butadiene7
Arsenic6
1,3-Butadiene5
Acrylonitrile4
Acetaldehyde3
Carbon Tetrachloride2
Benzene1
PollutantRank
BTUT Cancer Risk
Oommen, pg 30 17th Annual International Inventory Conference – Portland, OR
Toxicity-Weighted Calculations - Results
NR = not ranked in Top 10
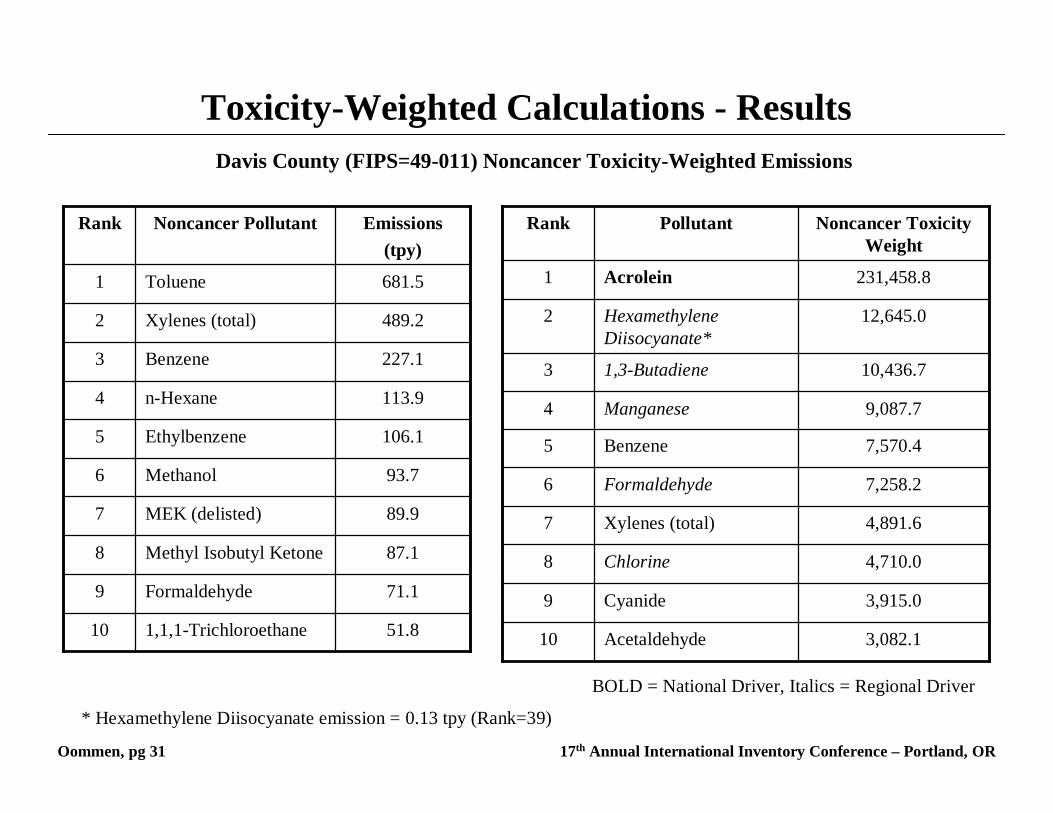
51.81,1,1-Trichloroethane10
71.1Formaldehyde9
87.1Methyl Isobutyl Ketone8
89.9MEK (delisted)7
93.7Methanol6
106.1Ethylbenzene5
113.9n-Hexane4
227.1Benzene3
489.2Xylenes (total)2
681.5Toluene1
Emissions(tpy)
Noncancer PollutantRank
3,082.1
3,915.0
4,710.0
4,891.6
7,258.2
7,570.4
9,087.7
10,436.7
12,645.0
231,458.8
Noncancer Toxicity Weight
Acetaldehyde10
Cyanide9
Chlorine8
Xylenes (total)7
Formaldehyde6
Benzene5
Manganese4
1,3-Butadiene3
Hexamethylene Diisocyanate*
2
Acrolein1
PollutantRank
Oommen, pg 31 17th Annual International Inventory Conference – Portland, OR
Toxicity-Weighted Calculations - ResultsDavis County (FIPS=49-011) Noncancer Toxicity-Weighted Emissions
* Hexamethylene Diisocyanate emission = 0.13 tpy (Rank=39)
BOLD = National Driver, Italics = Regional Driver
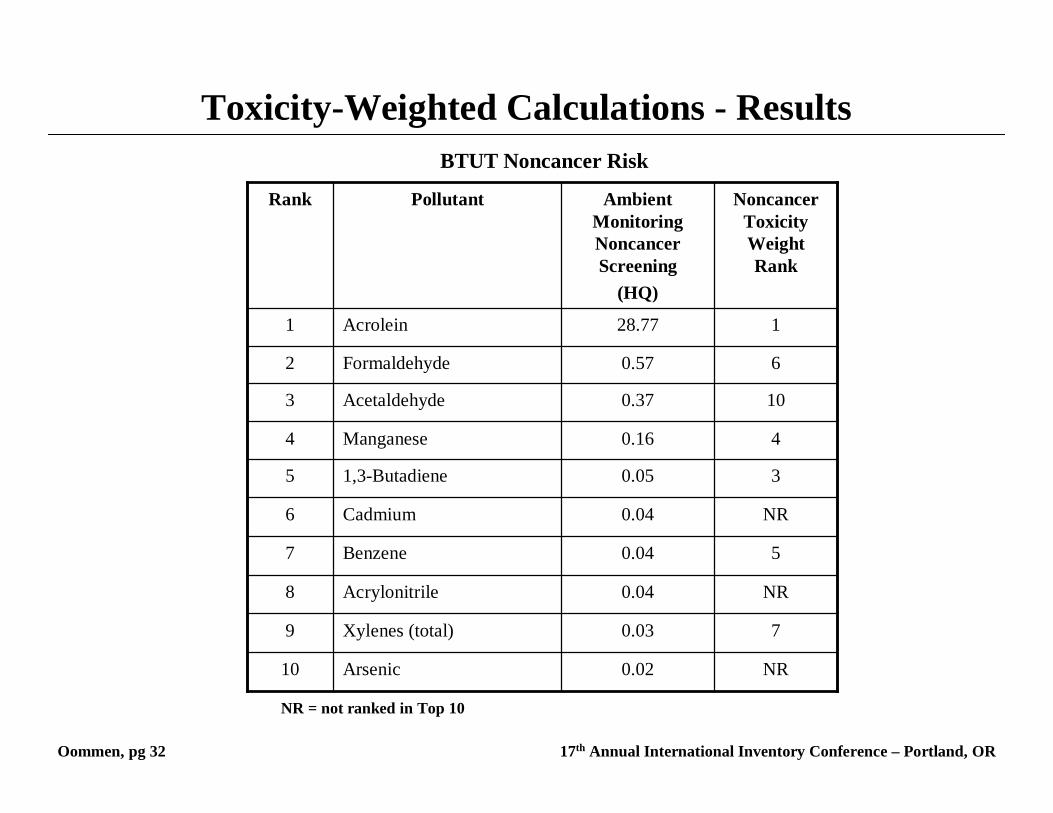
BTUT Noncancer Risk
Oommen, pg 32 17th Annual International Inventory Conference – Portland, OR
Toxicity-Weighted Calculations - Results
0.02
0.03
0.04
0.04
0.04
0.05
0.16
0.37
0.57
28.77
Ambient Monitoring Noncancer Screening
(HQ)
NR
7
NR
5
NR
3
4
10
6
1
Noncancer Toxicity Weight Rank
Arsenic10
Xylenes (total)9
Acrylonitrile8
Benzene7
Cadmium6
1,3-Butadiene5
Manganese4
Acetaldehyde3
Formaldehyde2
Acrolein1
PollutantRank
NR = not ranked in Top 10
Wrap-Up
• Fairly good agreement between mass emissions and cancer tox-weighting in Davis County, UT (7 polls in common among Top 10)
Oommen, pg 33 17th Annual International Inventory Conference – Portland, OR
• Very little agreement between mass emissions and cancer tox-weighting in Wayne County, MI (4 polls in common among Top 10)
• For noncancer toxicity, few Top 10 polls in common:• Davis County, UT = 3 common Top 10 pollutants• Cook County, IL = 1 common Top 10 pollutant
• Toxicity-weighting data from an emissions inventory can be useful in prioritizing pollutants based on risk potential.
Wrap-Up
• OK agreement between cancer tox-weighting in Cook County, IL and NBIL (5 common pollutants among Top 10)
Oommen, pg 34 17th Annual International Inventory Conference – Portland, OR
• Weak agreement between cancer tox-weighting in Wayne County, MI and DEMI (3 common pollutants among Top 10)
• Very good agreement between noncancer tox-weighting: • Cook County, IL and NBIL (8 common Top 10 pollutants)• St. Louis City, MO and S4MO (7)• Davis County, UT and BTUT (7)
• Weak agreement between noncancer tox-weighting: • Wayne County, MI and DEMI (4 common Top 10 pollutants)