Identifying price trends in the Turkey region long … INDUSTRY SOLUTION PAPER: STEEL Identifying...
6
WWW.METALS.PLATTS.COM INDUSTRY SOLUTION PAPER: STEEL Identifying price trends in the Turkey region long steel sector Can advanced price relationship analysis drive opportunities and value? October 2014 by Hector Forster
Transcript of Identifying price trends in the Turkey region long … INDUSTRY SOLUTION PAPER: STEEL Identifying...
www.METALS.pLATTS.coM
INDUSTRY SOLUTION PAPER: STEEL
Identifying price trends in the Turkey region long steel sector
Can advanced price relationship analysis drive opportunities and value?
October 2014by Hector Forster

INDUSTRY SOLUTION PAPER | 2
Identifying price trends in the Turkey region long steel sector
This paper introduces new Platts analysis in identifying price trends and price direction signals in the Turkish rebar, billet and scrap markets. The Platts Turkey ARC Steel Tracker (Turkey ARC ) has been designed to analyze price relationships of inputs and outputs to regional electric arc furnaces and rolling mills, and the suitability of this model and scope for its data is examined.
As price points and commodity trade in Turkey influence the wider Mediterranean region, and this is amplified in other scrap and long steel markets worldwide, the Turkey ARC data and ferrous strength indicator analysis provides a metric for market direction.
PLATTS TURKEY ARC STEEL TRACKER
The Turkey ARC model compares scrap, billet and rebar prices across the Turkish long steels value chain, and is designed to help traders, producers and consumers track price relationships within a related set of commodity prices, which Platts publishes daily:
STCBM00: Turkey Rebar FOBSTBLB00: Black Sea Billet FOB1 (see below for Turkey net forward basis)FETKD00: Turkey Ferrous Scrap HMS 80:20: CFR
The model uses relative proportional analysis, based on prices, to help track interrelated commodity prices relationship compared to 30-day and 60-day moving averages. It gives traders, mills and buyers potential buy and sell insights either for each commodity or for the wider complex by users identifying one or several lead indicators and points of inflection.
The methodology relies on examining interrelated prices that are a factor of each other.
Summary
�� The Platts Turkey ARC Steel Tracker compares scrap, billet and rebar prices across the Turkish long steels value chain against longer-term trends and indicates the extent prices are moving in and out of trend.
1 The Platts FOB Black Sea billet price is given an adjustment factor based on freight rates to allow for a net forward CFR Turkey billet value to be created out of the daily Black Sea price assessment. Historical analysis to date has used $15/mt through to August 5,2014, as a long running average for Handy vessels from Ukrainian or Russian Black Sea ports to Marmara and Izmir regions, which represent the route and port area for freight normalisation going forward. Since then $17.50/mt and $18/mt was used for the voyage and this will be updated as needed and tracked daily.
�� Daily price indicator measures strength of overall market, as sum of day-on-day price moves in the three commodities.
�� The indicators may aid decision making in buying or selling a commodity, and supply and production responses.
THE IMPORTANCE OF TURKEY AS A CENTER FOR SCRAP AND LONG STEEL PRICE TRENDS
Turkey is the largest importer of ferrous scrap in the world. Moreover, it purchases scrap from nearly every source possible: three of the top five scrap-exporting regions count Turkey as the top client for their recycled metal.
Scrap is an extensively traded raw material for steelmaking. Nearly 100 million mt of scrap trades cross-border . The ratio of scrap needed to produce 1 mt of steel is close to 1.1:1.
Electric arc furnaces – the main converter of scrap – account for around 30%, or between 480-500 million mt of crude steel produced around the world. In addition, many steelmakers producing pig iron through the blast furnace route use additional scrap to make crude steel. Excluding China, which focuses on using iron ore, the rest of the world produces nearly 50% of its steel using scrap as the input material.
Turkey could purchase 19.65 million mt of scrap in 2014 , and in Q1 2014 Turkey was one of the few large importing nations that increased its intake on-year.
As a major steel-exporting hub, Turkey’s location allows it access to key developing markets in North Africa and the Middle East. Turkey exported 8.28 million mt of rebar in 2013, making it the largest exporter in the world.
Due to its importance as a pivot for world steel trade, the gross margins of Turkey’s steel mills, and its purchasing and sales prices, are of interest to everyone active in raw materials, or finished-steel trade. In addition to Turkey, Black Sea exporters mainly in Ukraine and Russia make this region a key world steel exporting hub.
Black Sea steelmakers sell billet to the Middle East and North Africa MENA + Turkey (MENAT). This semi-finished product is used as a proxy for the strength of MENAT’s finished long products: rebar, wire rod, merchant bar and sections.
IDENTIfYINg PRICE TRENDS IN ThE TURkEY REgION LONg STEEL SECTOR – Can advanced price relationship analysis drive opportunities and value?
INDUSTRY SOLUTION PAPER | 3
Identifying price trends in the Turkey region long steel sector
In addition, once scrap becomes relatively uncompetitive, or costly, Turkey’s mills will import billet, shifting their procurement as much as possible to semi-finished steel.
Consequently, the relationship between scrap, billet and rebar is vital for consumers of the semi-finished product in MENAT.
DESIGNING TURKEY ARC
The Turkish long-products steel industry is concerned with, among others, three factors for domestic and export rebar sales:
1. The price of the main raw material – Imported ferrous scrap from US and Europe.
2. The price of billet, domestic and competing CIS imports from Black Sea
3. The final sales price of rebar FOB and domestic
Rebar prices are related to the cost of scrap and billet used to roll into the finished product.
Rebar mills with electric arc furnaces may buy scrap and roll billet before producing rebar, or they may bypass buying scrap and procure billet in the domestic or import markets and roll rebar from this material instead. They may drawdown inventory of scrap and/or billet before purchasing additional material too.
The decisions on how to produce rebar, either producing billet from scrap or using merchant billet, may be determined by price or operational and logistics, timing reasons.
Tracking the symbiotic relationships between the three commodities and price differentials can help determine impact along the chain.
Turkey ARC data does not represent a measure of changes in outright prices for each commodity alone, rather, it provides the user with a level of sophistication and understanding around which one of the three commodities may be leading the price formation trend. That can, in turn, lead to insight about what part of the chain may be in line for some type of price correction.
Building Turkey ARC
As noted, the Turkey ARC relies on examining price spreads between rebar and the prices of its two inputs; imported scrap and billet; and measuring changes throughout the chain, alongside market price direction.
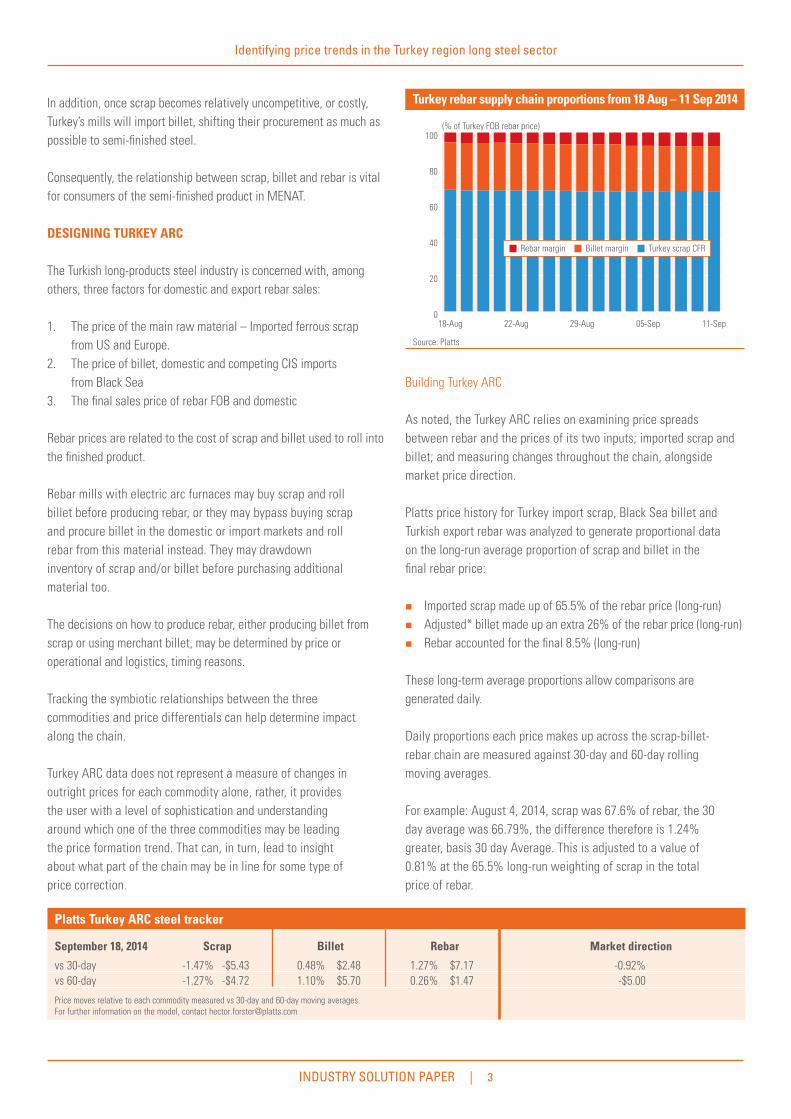
Platts price history for Turkey import scrap, Black Sea billet and Turkish export rebar was analyzed to generate proportional data on the long-run average proportion of scrap and billet in the final rebar price:
�� Imported scrap made up of 65.5% of the rebar price (long-run)�� Adjusted* billet made up an extra 26% of the rebar price (long-run)�� Rebar accounted for the final 8.5% (long-run)
These long-term average proportions allow comparisons are generated daily.
Daily proportions each price makes up across the scrap-billet-rebar chain are measured against 30-day and 60-day rolling moving averages.
For example: August 4, 2014, scrap was 67.6% of rebar, the 30 day average was 66.79%, the difference therefore is 1.24% greater, basis 30 day Average. This is adjusted to a value of 0.81% at the 65.5% long-run weighting of scrap in the total price of rebar.
Platts Turkey ARC steel tracker
September 18, 2014 Scrap Billet Rebar Market direction
vs 30-day -1.47% -$5.43 0.48% $2.48 1.27% $7.17 -0.92%vs 60-day -1.27% -$4.72 1.10% $5.70 0.26% $1.47 -$5.00
Price moves relative to each commodity measured vs 30-day and 60-day moving averages. For further information on the model, contact [email protected]
0
20
40
60
80
100
11-Sep05-Sep29-Aug22-Aug18-Aug
Turkey rebar supply chain proportions from 18 Aug – 11 Sep 2014
Source: Platts
(% of Turkey FOB rebar price)
Turkey scrap CFRBillet marginRebar margin

INDUSTRY SOLUTION PAPER | 4
Identifying price trends in the Turkey region long steel sector
The individual index values for each of the three commodities represents how the commodity and those prices for its two interrelated peers performed on the day to shift their interrelated pricing relationship, relative to historic averages. The index values are adjusted for weighting of each commodity in the three-commodity supply chain.
The index figures generate daily monetary values for each commodity as well as showing volatility with reference to previous high, lows and in the context of historic trading patterns.
The table shows how each commodity is trading relative to the 30-day, and 60-day average of the three commodity intra-price relationships. Each commodity is given by Turkey ARC an index value, which measures a weighted daily percentage of deviation from historic levels, and the prevailing monetary value of that spread.
The percentage is applied to the day’s closing price for the commodity, to calculate the extent to which the price may be over or under the average based on recent trading price relationship analysis.
Daily price mover
A daily price mover “Market Direction” is included to show how Turkey ARC indexes can be compared in the context of the cumulative day-on-day price changes across scrap, billet, rebar and represented as one percentage figure with its dollar value.
The market direction gives additional context and point for analysis, to compare the rebar, billet and scrap index values against movements in price direction and whether the market is weakening, stronger or neutral.
The data for market direction can also be used as a historic indicator of performance across rebar, billet and scrap, useful as a component when identifying lead price indicators and comparing market strength from one day to a previous period or single point.
Historic analysis
Running 30-day and 60-day data for the past two years, scrap and billet are typically inversely correlated. Scrap and billet traded at increasingly divergent values for several weeks before correcting and becoming more aligned.
Partly this may be a function of 30-day rolling averages used in determining the index value for the day’s price relationship and a longer running change in the peer-price composition becoming normalized over time by the model. Volatility is far more intense for scrap and billet than for rebar.
DEEPER ANALYSIS POSSIBLE
The Turkey ARC values can be used in further analysis with outright price spreads, the strength of the market, and to check correlations of scrap, billet and rebar indexes with other market indicators such as outright prices, cross-product spreads, economic and market indicators including currency and stock markets.
Rebar to scrap price spread
The outright price spread between rebar and scrap CFR Turkey is possibly the most keenly watched and cited reference in the Turkish steel long-products arena.
Platts data already calculates this spread and provides daily data:
CMITP00: Scrap Turkey Rebar Spread (TSRS-Platts) US$/mt
This spread value has deteriorated, which may indicate rebar mills are faced with lower margins or overall prices are lower.
Scrap prices as a percentage of rebar has been tracked, and the long run average used in the model is 65.5% scrap comprised for rebar. The
-6
-3
0
3
6
Sep-14Jul-14May-14Mar-14Jan-14Nov-13Sep-13Jul-13May-13Mar-13Jan-13Nov-12Sep-12Jul-12
Platts Turkey ARC steel tracker based on 30-day averages
Source: Platts
(%)
ScrapBillet Rebar Market Direction

INDUSTRY SOLUTION PAPER | 5
Identifying price trends in the Turkey region long steel sector
range since April 2012 has seen a low marked June 6, 2013, where scrap accounted for 58.9% of rebar, through to a high of 69.6% on January 14, 2014.
Over the same data range, the price spread for rebar – scrap has seen the lowest at $175/mt on January 14, 2014, where scrap incidentally made up the highest proportion of the rebar price.
The highest value for rebar/scrap was seem on June 12, 2012 at $245/mt, where scrap made up 60.5% of the overall price, indicating product margins were led by the price and demand for rebar.
Rebar to billet price spread
The rebar to billet spread was analyzed, using FOB Black Sea billet prices with the freight assumptions for Black Sea exports to Turkish ports used by Turkey ARC to compare pricing basis Turkey.
Turkey ARC uses a daily freight rate to net forward billet prices basis Turkey, and analyzing the spread between rebar and Black Sea billet basis Turkey shows the margin at its smallest of $31.50/mt on August 19, 2014, and at its largest at $72/mt on December 2, 2013.
At both points, the proportion of rebar prices over adjusted billet pricing was 5.5% and 12.3% respectively, and compares to the long-running 9.5% average used by the model for the value of rebar over billet.
Both price points saw scrap accounting for over 67% of the price of rebar, greater than the 65.5% average for scrap, putting pressure on billet margins.
Further, the outright price spread between Black Sea billet and scrap CFR Turkey calculated by Platts is offered as daily market data:
BSSTP00: Scrap Turkey Billet Black Sea Spread (TSBS-Platts) US$/mt
Analysis of 30-day turkey ARC indicators with commodity spreads and pricing
Viewing scrap market indicator values generated by Turkey ARC, the significant minus signals indicate a stronger rebar scrap spread usually above $200/mt. The positive scrap index values show prevailing rebar/scrap spreads trending lower despite a few instances at $210/mt.
The strongest scrap indicators in the model are typically correlated with positive overall market direction. The weakest signals for scrap correlate with negative market direction, and lower prices across the complex too.
160
180
200
220
240
-5.0
-2.5
0.0
2.5
5.0
Turkey ARC scrap index compared to rebar/scrap spread:July 2012 – September 2014
Source: Platts
($/mt) (%)
Scrap 30-day ARC index (right)Rebar/scrap spread Trend
25
35
45
55
65
75
-4
-2
0
2
4
6
Source: Platts
($/mt) (%)
Turkey ARC billet index compared to Turkey rebar/billet spread:July 2012 – September 2014
Billet 30-day ARC index (right)Rebar/billet spread Trend
160
180
200
220
240
-3.0
-1.5
0.0
1.5
3.0
Turkey ARC rebar index compared to Turkey rebar/scrap spread:July 2012 – September 2014
Source: Platts
($/mt) (%)
Rebar 30-day ARC index (right)Rebar/scrap spread Trend

Identifying price trends in the Turkey region long steel sector
© 2014 Platts, McGraw Hill Financial. All rights reserved.
Reproduction of this publication in any form is prohibited except with the written permission of Platts. Because of the possibility of human or mechanical error by Platts’ sources, Platts does not guarantee the accuracy, adequacy, completeness, or availability of any Platts information and is not responsible for any errors or omissions or for the use of such Platts information. Platts gives no express or implied warranties, including, but not limited to, any implied warranties of merchantability or fitness for a particular purpose or use. In no event shall Platts be liable for any direct, indirect, special, or consequential damages in connection with subscribers’ or others’ use of this publication.
For more inFormation, please contact the platts sales oFFice nearest you:Web www.platts.com e-mail [email protected]
north america emea latin america asia-paciFic russia +1-800-platts8 (toll-free) +44-(0)20-7176-6111 +54-11-4804-1890 +65-6530-6430 +7-495-783-4141 +1-212-904-3070 (direct)
When billet market indicators are considered, the lowest daily indicators for billet’s relative strength in the Turkey steel supply chain is correlated with higher overall market prices.
Conversely, the opposite is true for the strongest market indicators for billet, where prevailing overall price direction is weak.
The rebar/billet spread shows higher than usual values in the $60-70/mt range when the billet market indicator is at its lowest. As the billet indicator is in the 4-5% range, the rebar billet spread is in the $50s/mt range.
Rebar market indicators from Turkey ARC show the weakest set of values generating low rebar/billet conversion spreads and rebar/scrap spreads in the $180s/mt.
The rebar/scrap spread and rebar/billet price differential show their highest values typically when the rebar market indicators are at their highs. Rebar indicators less pronounced than scrap and billet on the up and down range. Rebar indicators hold usually in 5% range, 2.5% either side around 0.
For further information:Hector Forster, [email protected] Roe, [email protected]
-6
-3
0
3
6
Sep-14Jul-14May-14Mar-14Jan-14-4
-2
0
2
4
Platts Turkey ARC steel tracker based on 30-day averages
Source: Platts
ScrapBillet Rebar Market Direction (right)
(%)