
Identifying Patterns of Potentially Preventable Emergency Mining Theses/Kathleen Alber... ·...
117
Preventable ED Utilization by Children Identifying Patterns of Potentially Preventable Emergency Department Utilization by American Children Kathleen M. Alber A Thesis Submitted in Partial Fulfillment of the Requirements for the Degree of Master of Science in Data Mining Department of Mathematical Sciences Central Connecticut State University New Britain, Connecticut January 2007 Thesis Advisor Dr. Daniel T. Larose Department of Mathematical Sciences
Transcript of Identifying Patterns of Potentially Preventable Emergency Mining Theses/Kathleen Alber... ·...

Preventable ED Utilization by Children
Identifying Patterns of Potentially Preventable Emergency
Department Utilization by American Children
Kathleen M. Alber
A Thesis
Submitted in Partial Fulfillment of the
Requirements for the Degree of
Master of Science in Data Mining
Department of Mathematical Sciences
Central Connecticut State University
New Britain, Connecticut
January 2007
Thesis Advisor
Dr. Daniel T. Larose
Department of Mathematical Sciences

Preventable ED Utilization by Children
2
Identifying Patterns of Potentially Preventable Emergency
Department Utilization by American Children
Kathleen M. Alber
An Abstract of a Thesis
Submitted in Partial Fulfillment of the
Requirements for the Degree of
Master of Science in Data Mining
Department of Mathematical Sciences
Central Connecticut State University
New Britain, Connecticut
January 2007
Thesis Advisor
Dr. Daniel T. Larose
Department of Mathematical Sciences
Key Words: Emergency Department Utilization, Children, National Survey of Children’s Health, Medical Home
Preventable ED Utilization by Children
3
ABSTRACT Emergency department care and primary care are ideally distinct parts of the
health care delivery system. In theory, each answers a specific and different health
care need. However, in practice this distinction blurs. Many visits to hospital
emergency departments are potentially preventable by timely and appropriate primary
care. This paper employs a descriptive data mining approach to the analysis of data
collected by the National Survey of Children’s Health 2003 with the purpose of
identifying global and local patterns of potentially preventable emergency department
utilization by American children. Understanding the factors influencing the decision
to seek emergency department care is an essential step in ensuring adequate and
appropriate health care for all children.
Using SPSS Clementine® data mining software, classification models are
employed to discover nationally significant and geographically specific patterns of
potentially preventable emergency department utilization by children. This paper
identifies numerous patterns. Globally, requirement for care, age, and insurance type
were found to be the most significant predictors of the target behavior. Local patterns
characterize several subsets of the population who are significantly associated with
potentially preventable emergency department utilization. These characterizations
often logically suggest theories which explain a group’s association with such
behavior. In many cases, further directed research would be required to confirm and
clarify these assumptions. These are noted throughout this paper.
Access to quality primary care logically influences the choice of emergency
department care to treat a potentially preventable condition. The American Academy
Preventable ED Utilization by Children
4
of Pediatrics has developed the concept of a ‘medical home’ and detailed the specific
requirements for care defining its existence. This study describes a method of
utilizing survey responses to measure each child’s association with a medical home.
Association rule mining is used to characterize groups of children according to
association with a medical home and investigate potentially preventable emergency
department utilization in the context of access to primary care. Differences in
characteristic patterns of health care utilization for these groups are evident,
suggesting that efforts to encourage the appropriate use of primary care in place the
emergency care would most effectively be tailored according to level of access to
primary care.

Preventable ED Utilization by Children
5
TABLE OF CONTENTS
ABSTRACT.................................................................................................................. 3
INTRODUCTION ........................................................................................................ 6
RELATED RESEARCH .............................................................................................. 9
METHODS ................................................................................................................. 13
Data Preprocessing.................................................................................................. 13
Exploratory Data Analysis...................................................................................... 15
Target Variable – PPA_Visits............................................................................. 15
Predictive Attributes ........................................................................................... 16
Non-Predictive Attributes ................................................................................... 45
Data Preparation for Modeling ............................................................................... 45
Clustering................................................................................................................ 46
Classification Modeling.......................................................................................... 47
National Model ................................................................................................... 48
Insurance Type Model......................................................................................... 58
State Models........................................................................................................ 74
Association Rule Mining ........................................................................................ 86
RESULTS ................................................................................................................... 95
DISCUSSION........................................................................................................... 101
REFERENCES ......................................................................................................... 104
Appendix A: Modeling Attributes ............................................................................ 110
Appendix B: Percent of Children Associated with PPA Visits by State ................. 113
Appendix C: Sources and Derivation of State Characteristic Attributes................. 115

Preventable ED Utilization by Children
6
INTRODUCTION
Each year, approximately 30 million visits to American hospital emergency
departments are made by children aged 18 years or younger (Institute of Medicine
[IOM], 2006; McCraig & Burt, 2005). Many of these visits are avoidable, addressing
conditions which would more appropriately be treated in a primary care setting. Such
visits contribute to overcrowding of emergency departments and are indicative of the
use of emergency department services as a proxy for primary care.
It is generally recognized that health care delivery is optimized on both an
individual and system-wide level when children receive appropriate and consistent
primary care directed by a primary care professional and utilization of hospital
emergency departments is limited to unpreventable medical emergencies. The
positive effect of comprehensive pediatric primary care on children’s health has been
documented (Alpert, Robertson, Kosa, Heagarty, & Haggerty, 1976). Optimally, the
primary care professional has a relationship with the patient and therefore is familiar
with the child’s medical history and family issues and provides not only preventative
and illness care but also follow-up attention and focused advice as necessary. The
parent who is comfortable in his/her relationship with the child’s primary care
professional is more likely to seek advice and care for problems before they escalate
to a more serious and urgent status. Emergency department care is focused on
addressing an immediate concern rather than providing ongoing care. It is a more
expensive and often less medically appropriate alternative to primary care for
children. A recent Institute of Medicine report (IOM, 2006) noted that many hospital
emergency departments are not well equipped to handle pediatric patients. Many

Preventable ED Utilization by Children
7
don’t have the essential supplies on hand for these smallest patients and the majority
lack medical personnel with specialized pediatric training.
Several previous studies have sought to discern factors related to the choice of
emergency rather than primary care for non-urgent conditions (Cunningham, Clancy,
Cohen, & Wilets, 1995; Doobinin, Heidt-Davis, Gross, & Isaacman, 2003; Phelps et
al., 2000; Walls, Rhodes, & Kennedy, 2002). Use of emergency department resources
for the treatment of non-urgent cases is one indicator of a breakdown of pediatric
primary care delivery. Another, with more potentially serious medical consequences,
is exemplified by the ill child who is not provided with appropriate, timely primary
care treatment for a non-urgent condition thus resulting in a deterioration of health
status which requires emergency care. To illustrate, Dombkowski, Stanley, and Clark
(2004) found that asthmatic children who were regularly followed and appropriately
medicated were less likely to require emergency intervention. Another study
(Johnson & Rimsza, 2004) identified several emergent conditions, including epileptic
convulsions, severe ear, nose, and throat infections, and bacterial pneumonia, with
which children who received primary care were four times less likely to be
associated. Putting aside the beneficial effect of the primary care professional as a
health/safety educator, accidents, injuries and poisonings are validly considered not
preventable by primary care professional intervention. For the purpose of this study,
all others are considered at least potentially preventable. This includes most non-
emergent conditions and emergent conditions which may not have escalated to an
urgent nature had proper earlier intervention been sought in a primary care setting.

Preventable ED Utilization by Children
8
This study identifies factors associated with children likely to be brought to an
emergency department for potentially preventable conditions. It employs a data
mining approach to the analysis of data collected for the National Survey of
Children’s Health 2003 [NSCH] which includes data pertaining to 102,353 children
less than 18 years of age. Residents of each of the fifty states and Washington, DC are
represented. Survey responses were provided by a parent or caregiver and describe
the referenced child’s demographic and economic conditions as well as profiling
health status and access and utilization of health care resources. It is noted that
factors which affect children’s emergency department utilization patterns may differ
from those which contribute to adult behavior in this regard. Usually, the decision
about whether or where to seek care for a child is made not by the child himself, but
by a parent or other caregiver and the factors influencing that decision are often more
complicated than those required for an adult determining his or her own personal
medical requirements. Therefore, when examining potential contributing factors,
caregiver and family characteristics which might influence the decision-making
process are considered as well.
As the name implies, the NSCH data is national in scope allowing a more
comprehensive study of utilization patterns than most previous research which
analyzed data collected on a local or statewide level. This thesis initially focuses on
national patterns of potentially preventable utilization of emergency department
resources by children and then investigates geographic variation through the
comparison of factors associated with these patterns on the state level.

Preventable ED Utilization by Children
9
RELATED RESEARCH
There have been numerous previous studies which investigated aspects of
emergency department utilization by children. For the most part, the data analyzed by
these samples represent a limited population, often a single hospital and/or
exclusively publicly insured patients.
Several studies have sought to identify factors associated with non-urgent use
of hospital emergency departments by children. Phelps et al. (2000) investigated the
relationship between non-urgent visits and caretaker characteristics including stated
reasons for bringing the child to the emergency department. This study suggested the
importance of types of family unit and insurance as well as the “modeling effect” of
where the caregiver was taken as a child for ill care. Newcomb (2005) focused on
variables measuring Medicaid children’s access to primary care as well as caretaker
characteristics. The author concluded that non-urgent visits to the emergency
department by a localized group of publicly insured children were at least partly due
to lack of ready access to primary care. Doobinin et al. (2003) surveyed the parents
of children brought to a single urban pediatric emergency department with non-urgent
illnesses to determine their reasons for choosing the emergency department for care.
Considered were issues of convenience as well as parental discrimination of urgency
and knowledge of insurance requirements.
Another research approach focuses on the identification of factors
associated with children who visit an emergency department for any reason and/or the
effects of the implementation of certain policies on emergency department utilization
patterns. These studies classify according to whether or not a child uses the

Preventable ED Utilization by Children
10
emergency department, not the nature or urgency of the complaint. Much of the
research found had a narrowly defined purpose. For example, Pollack et al. (2004)
sought to discover sources of variation in emergency department utilization by
Medicaid-insured Michigan children with chronic or complex health conditions while
Fredrickson, Molgaard, Dismuke, Schukman, & Walling (2004) studied Medicaid-
insured asthmatic children in rural Kansas with similar goals. Kotagal et al. (2002)
explored the relationship between primary care and emergency department utilization
in early infancy by studying Medicaid-insured newborns in Ohio. Likewise, the
potential correlation between continuity/consistency of primary care and emergency
department utilization has been the focus of studies (Christakis, Wright, Koepsell,
Emerson, & Connell, 1999; Gill, Mainous, & Nsereko, 2000; Ryan, Riley, Kang, &
Starfield, 2001).
While others took a dichotomous approach to classification of emergency
department visits, Weinick, Billings, and Burstin (2002) introduced a four class
model which differentiated not only between urgent and non-urgent visits, but further
between emergent conditions which could have been treated or prevented in a
primary care setting and those which required emergency department care and were
not preventable.
Much research is limited to or focused on children who are insured under
Medicaid for a variety of reasons including the established tendency of Medicaid
insured children to visit emergency departments with greater frequency than children
of other insurance classifications (Dombkowski et al., 2004; McCraig & Burt, 2005;
Phelps et al., 2000). This greater utilization may be due in part to some Medicaid

Preventable ED Utilization by Children
11
delivery systems which do not financially penalize patients who make use of the more
expensive emergency department alternative for non-urgent illnesses (Phelps et al.,
2000). Tailoring studies to Medicaid enrollees also has the advantage of practical
applicability of results. When research demonstrates problem areas, public policies
can be implemented to encourage and facilitate more appropriate utilization of
medical resources. Managed care Medicaid programs are an example of such policies
and determination of their success in this regard has been the focus of several studies
(Alessandrini, Shaw, Bilker, Perry, Baker, & Schwarz, 2001; Dombkowski et al.,
2004; Piehl, Clemens, & Jones, 2000). Research using Medicaid data is perhaps also
prevalent because state Medicaid data bases provide a rich, convenient, relatively
available source of data to be analyzed.
As was noted above, most of the research obtained for this review had a
narrow geographic focus. One exception was a study by Luo, Liu, Frush, & Hey
(2003) who investigated whether type of insurance coverage affects the likelihood
that a child visits the emergency department. This study utilized the 1997 Medical
Expenditure Panel Survey, a national survey. The authors studied data pertaining to
10,193 children from across the country and included potential predictor variables
describing basic demographic information and type of insurance. They achieved
some different results than many of the more limited studies indicating that a more
diverse dataset may provide different insight. Ryan et al. (2001) also pointed out the
importance of diversifying study populations. Noting that data for most previous
studies originated in urban hospital/clinic settings, they focused their study on rural
adolescents.

Preventable ED Utilization by Children
12
Certain correlations with various forms of emergency department utilization
were noted by multiple studies. The first, mentioned above, is between insurance type
and emergency department utilization by children. The heavier utilization of
emergency department services by Medicaid insured children was noted by most
studies. Another is the child’s age. Infants and adolescents were observed to be more
likely visitors to hospital emergency departments than children of the ages in between
these two groups (Johnson & Rimsza, 2004; Pollack et al., 2004). A care-giver’s
marital status has also been found to be predictive of the tendency to bring a child to
the emergency department for care (Kotogel et al., 2002; Phelps et al., 2000).
Additionally, the mother’s level of education has been associated with the use of
emergency department services (Alessandrini et al., 2001; Ryan et al.,2001). These
correlations were considered in designing this study and interpreting results.

Preventable ED Utilization by Children
13
METHODS
This study utilizes SPSS Clementine® 10.0 data mining software to analyze
the NSCH 2003 data. The primary data mining task is descriptive in nature with the
goal of identifying patterns and trends of preventable emergency department
utilization by children. Bivariate analysis was employed to explore the relationship
between potentially pertinent survey response attributes and the target behavior.
Additionally, Clementine® decision tree and association rule modeling tools were
utilized to allow the identification and clarification of multivariate patterns.
Data Preprocessing
The NCHS data set includes 301 variables describing diverse aspects of
children’s health. Many of these are unrelated to hospital emergency department
utilization for potentially preventable conditions and therefore were disregarded by
this study. Retained for consideration were variables describing (a) demographic
characteristics including age, gender, family structure, primary language, race, and
caregiver education; (b) health status; (c) insurance type; (d) family income; (e)
health care access and utilization; (f) family risk behaviors; and (g) geographical
home.
Assessing the quality and completeness of the data is a crucial step in the
successful modeling process. Missing attribute values in the NSCH data are
prevalent for several reasons. The design of the survey is such that many questions
are asked only when responses to other questions indicate the appropriateness. For
example, if a respondent indicates that the child has not received any medical

Preventable ED Utilization by Children
14
attention in the referenced year, further questions regarding frequency or type of
medical care received are omitted. Consequently, records associated with such
children are missing values for these attributes. Two sections of the survey are age-
specific. Each respondent answers only the questions targeted to the referenced
child’s age group resulting in missing values for attributes associated with questions
of the section applying to the other age group. Additionally some missing values are
the result of the respondent’s inability or refusal to answer a question or errors in
capturing or storing the response. Missing values were handled as follows:
1. Where there was a logical means of discerning the appropriate replacement
for the missing data, that replacement was made. In the example above, a
response indicating that a child received no medical attention in the
referenced year clearly implies zero values for attributes reflecting the
number of visits for preventative primary care, sick care, and emergency
department care.
2. Where the correct replacement was less obvious but a reasonable
approximation could be determined, that replacement was made. For 57%
of the attributes, the majority class was assigned. Others required more
involved deductive processes which are detailed in the exploratory data
analysis section which follows.
3. Where an appropriately logical replacement value could not be discerned or
approximated, the record was removed from consideration. This resulted in
the removal of a very small subset (1.3%) of records which were missing
values for attributes such as gender or education level.

Preventable ED Utilization by Children
15
Each variable in the data set is identified by a question code. For ease of
modeling, attributes were renamed so as to be understandable. Additional attributes
were derived using the information conveyed in NSCH responses. Appendix A lists
the 37 attributes utilized in modeling and references the corresponding data set
question code(s).
The NCHS survey implemented a design of top-coded variables which
effectively suppress outliers.
Exploratory Data Analysis
A significant challenge in the application of data mining to the NSCH data set
is the derivation of an effectual attribute set. NSCH attributes are answers to specific
survey questions. Some can be individually considered as potential predictors, but
most attributes are derived using a selection of responses.
Target Variable – PPA_Visits
The target behavior is the use of a hospital emergency department for
potentially preventable conditions. The NSCH data includes three variables which
were used to derive a single attribute, PPA_visits, to classify each record according to
whether the referenced child made at least one such visit. The first refers to the total
number of emergency department visits. If that number is one, a second attribute
indicates whether the visit was in response to an accident injury or poisoning. If more
than one, a third variable holds the number of visits in response to accident injury or
poisoning.

Preventable ED Utilization by Children
16
PPA_visits is set as false if survey responses indicate that the referenced child
made no visits to an emergency department or that all such visits were due to
accidents, injuries, or poisonings. The target variable is true if the referenced child
made one or more visits to an emergency department which were not due to accident,
injury, or poisoning. Using these criteria, 11.62%, or 11,890 of the NSCH
respondents are identified as having visited the emergency department for potentially
preventable reasons.
Predictive Attributes
Age
Analysis of the NSCH data indicates that patterns of potentially preventable
hospital emergency department utilization vary by age, with younger children
generally making more such visits than those who are older. Survey respondents
specified the age of the referenced child in years. For the purposes of this study, ages
were binned into groups: (a) infants of ages 0 or 1 years, (b) preschoolers between the
ages of 2 and 5 years, (c) young school age children between the ages of 6 and 9
years, (d) middle school aged children between the ages of 10 and 12 years, and (e)
adolescents between the ages of 13 and 17 years. Among the children referenced by
the survey, infants were most likely to be linked with a potentially preventable
emergency department visit. Close to one-quarter of infants were associated with the
target behavior in the studied year. As age increases, the tendency to make such a
visit decreases. Only 7.37% of the adolescents referenced in the survey indicate a trip
to the emergency department for a problem not related to an accident, injury or
poisoning.

Preventable ED Utilization by Children
17
Table 1
Percent of Children Associated with a Potentially Preventable/Avoidable Emergency Department Visit by Age Group
Age Group Percent Associated with PPA Visit 0-1 23.58 2-5 15.85 6-9 9.83
10-12 7.52 13-17 7.37
Caregiver Structure
The decision to seek emergency care for a child is usually made by that
child’s caregiver(s). It has been suggested that the number and relationship of
caregivers residing with the child influences that decision. The NSCH provides two
variables which can be used to ascertain the caregiver structure of the child’s family
unit. The RELATION field refers to the relationship of the person providing the
information for the survey. By survey design, this respondent is the parent or
guardian who lives in the household and knows the most about the health and health
care of the child. The TOTADULT3 field specifies the number of adults living in the
household. Using these two variables, a new attribute is derived which indicates
whether the child resides with (a) a single mother, (b) a single father, (c) a single
other caregiver, (d) two adults, or (e) three or more adults.
Phelps et al. (2000) noted that single caregivers were more likely bring a child
for a non-urgent emergency department visit and speculated that this may be due to
lack of input from another adult in the evaluation of the necessity of such care.
Children of single mothers represented in the NSCH data are indeed more likely to be
associated with a potentially preventable visit to a hospital emergency department
than those living in households with two or more adults. This is also true of children

Preventable ED Utilization by Children
18
with a single caregiver who is neither mother nor father. However this data indicates
that single fathers are the least likely caregivers to seek preventable emergency care
for their children. This suggests a gender difference in a caregiver’s inclination to
seek emergency care for a child.
Caregiver Education
The NSCH data includes indication of the highest education level attained by
any member of household. For the studied children, a higher level of household
member education is associated with a lesser likelihood of a visit to an emergency
department for potentially preventable reasons. The difference is most notable for
those who have continued their education past high school graduation. Links exist
between education level and income and insurance type, suggesting the possibility of
education level functioning as a covariant of these factors. However data
investigation showed that education level is indeed an independent factor in the
decision to seek potentially preventable emergency department care for a child,
particularly in middle income and/or privately insured families.
Primary Language/Interpreter
Of those interviewed in this nationwide survey, 7.56% identified some
language other than English as their primary home language. These households are
more likely to be associated with a child’s visit to an emergency department for
potentially preventable conditions. An additional survey question was posed of
respondents who indicated a non-English primary language to ascertain whether an
interpreter would be required for effective communication between a
patient/caregiver and medical personnel. By segmenting the group of records

Preventable ED Utilization by Children
19
indicating a non-English primary language according to the need for an interpreter, a
clear association between this requirement and potentially preventable emergency
department utilization was established. In fact, children from families with primary
language other than English who do not require an interpreter to effectively
communicate with medical personnel are approximately equally likely to visit the
hospital emergency department with potentially preventable problems as children
who come from homes where English is the primary language. In contrast, those who
require an interpreter are almost twice as likely to make such as visit as their peers
with greater facility for the English language.
Race/Ethnicity
The NSCH identifies four racial designations: white, black, multiple race or
other. A new classification, ‘unknown’, is created to apply to children of respondents
who do not know or refuse to provide a racial designation. A separate survey answer
indicates whether the child is of Hispanic or Latino origin. Data exploration led to
the discovery that most of the children classified as of unknown race are Hispanic.
This suggests that the absence of Hispanic designation as one of the survey choices
for race left respondents uncertain about the appropriate response to describe the race
of the referenced child. Consequently, a new variable was derived combining the two
survey responses in order to allow Hispanic as a possible primary race/ethnicity. This
new variable includes in the multiple race category those children who were
identified as black or white race and also of Hispanic origin. All other records
indicating Hispanic origin are categorized as Hispanic.

Preventable ED Utilization by Children
20
Distribution of data by race with regard to the target variable indicates that
black children are most likely to be brought to a hospital emergency department with
potentially preventable conditions. Hispanic and multiple race children are slightly
less likely than black children to make such visits, but more likely than white
children.
Insurance Type
Multiple survey responses provide information as to the existence and type of
health care insurance coverage for the referenced child. A single attribute was
derived combining this information to identify each referenced child as covered by
Medicaid, private, or no insurance. Examining this variable with respect to
associated potentially preventable emergency department visits indicates a
significantly greater tendency for such visits by Medicaid insured patients.
Table 2 Rate of Potentially Preventable Emergency Department Utilization by Insurance Type
Insurance Type % Associated with a PPA Visit Medicaid 19.65% Private 9.23%
Uninsured 9.48%
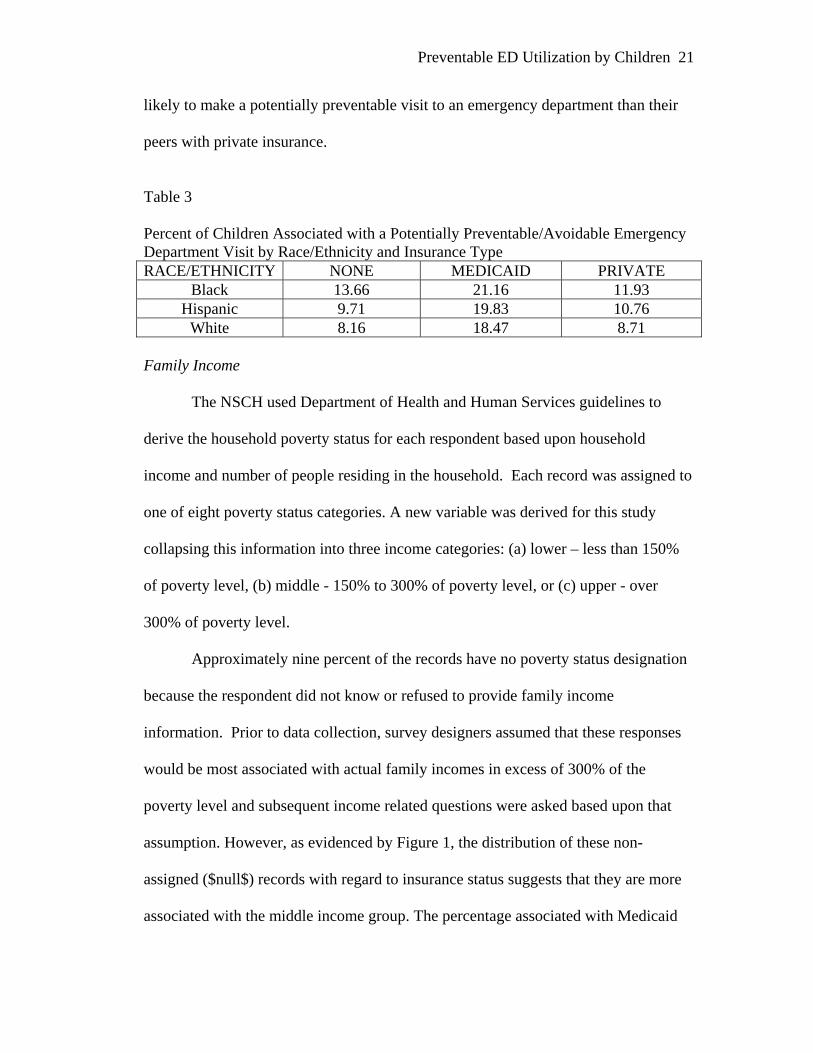
This strong association between Medicaid insurance and potentially
preventable emergency department utilization is consistent across all three major
racial/ethnic categories. Concerning other insurance classifications, it is noted that
uninsured Hispanic and white children are slightly less likely to be brought to an
emergency department with preventable conditions than those who are privately
insured. Black children without health insurance on the other hand are even more
Preventable ED Utilization by Children
21
likely to make a potentially preventable visit to an emergency department than their
peers with private insurance.
Table 3 Percent of Children Associated with a Potentially Preventable/Avoidable Emergency Department Visit by Race/Ethnicity and Insurance Type RACE/ETHNICITY NONE MEDICAID PRIVATE
Black 13.66 21.16 11.93 Hispanic 9.71 19.83 10.76
White 8.16 18.47 8.71 Family Income
The NSCH used Department of Health and Human Services guidelines to
derive the household poverty status for each respondent based upon household
income and number of people residing in the household. Each record was assigned to
one of eight poverty status categories. A new variable was derived for this study
collapsing this information into three income categories: (a) lower – less than 150%
of poverty level, (b) middle - 150% to 300% of poverty level, or (c) upper - over
300% of poverty level.
Approximately nine percent of the records have no poverty status designation
because the respondent did not know or refused to provide family income
information. Prior to data collection, survey designers assumed that these responses
would be most associated with actual family incomes in excess of 300% of the
poverty level and subsequent income related questions were asked based upon that
assumption. However, as evidenced by Figure 1, the distribution of these non-
assigned ($null$) records with regard to insurance status suggests that they are more
associated with the middle income group. The percentage associated with Medicaid

Preventable ED Utilization by Children
22
insurance is particularly telling. Medicaid is allocated primarily on the basis of
income. While income requirements vary by state, it is logically expected that there
would be few Medicaid recipients in the upper income category. Additionally, the
lack of medical insurance is atypical of upper income families and yet a significant
minority of the unassigned records indicates no coverage.
Figure 1. Association of insurance type with income group.
While it can be assumed that the respondents who did not know or refused to specify
household income are not exclusively representative of a single income group, it
appears that they are most representative of the middle income group and therefore,
these records were assigned as such for the purposes of this study.
There is a strong association between family income and potentially
preventable emergency department visits. The likelihood of such visits increases as
income level decreases. However, given the aforementioned relationship between
family income and Medicaid coverage, this study considered the possibility of this
association as a covariant effect of insurance type. Records were segmented by
insurance type. Within each insurance type, preventable emergency department
utilization was most strongly associated with the lower income group and that
association weakened as income increased. In fact, this pattern was most pronounced
among the privately insured which comprise close to 70% of the surveyed population.

Preventable ED Utilization by Children
23
Thus it was concluded that both income level and insurance type separately influence
the likelihood of potentially preventable emergency department visits.
General Health
The NSCH data includes an attribute which reflects the survey respondent’s
description of the referenced child’s general health as (a) excellent, (b) very good,
(c) good, (d) fair, or (e) poor. Fortunately, a large majority of children, 87.11%, enjoy
excellent or very good health. However, general health status is clearly linked with
the propensity for potentially preventable emergency department visits. Children
associated with less well conditions are more strongly linked with these visits.
Figure 2. Percent of children associated with a potentially preventable/avoidable emergency department visit by general health specification.
Primary Care Variables As this study seeks to identify factors associated with hospital emergency
department visits which might have been prevented by appropriate and timely

Preventable ED Utilization by Children
24
utilization of primary care resources, variables which measure necessity, access, and
quality of primary care are of great interest.
Medical home.
It is logically assumed that access to quality primary care would be a deterrent
to potentially preventable emergency department utilization. The concept of a
medical home is advanced by the American Academy of Pediatrics [AAP]
(Children’s Health Topics: Medical Home, n.d.). Historically, the existence of a
medical home was defined solely by association with a primary care physician. The
NSCH data suggests that such an association does not have a significant effect on the
likelihood of a potentially preventable visit to a hospital emergency department.
However, the AAP has expanded the definition of the concept of a medical home to
be primary care which is accessible, continuous, comprehensive, family-centered,
coordinated, compassionate, and culturally effective. Under this definition, the
existence of a medical home requires not just the presence of a doctor, but the
availability of high quality primary care. By utilizing information obtained in
response to NSCH survey questions, a consideration of medical home which is more
in keeping with this expanded definition can be attained and considered as potentially
predictive of the target behavior. Bethell, Read, and Brockwood (2004) discussed
using population-based national data sets to ascertain the degree of association with a
medical home for children with special health care needs. They described the
necessity and challenge of the development of a quantitative measure of medical
“homeness” and discussed how survey responses could be used to make at least an
approximate measurement of medical home for children referenced in the surveys.

Preventable ED Utilization by Children
25
Their work led to the inclusion of several questions in the NSCH survey pertaining to
the discernment of a medical home. Building upon this work, this study utilized
responses to these and other survey questions to develop a scoring method to provide
an indication of each referenced child’s association with a medical home.
The AAP definition identifies seven dimensions to be considered when
determining the existence of a medical home for a child. The NSCH survey
instrument was analyzed and questions identified which provide some measure of six
of these seven dimensions. It was determined that no measure of family-centeredness
was available from this data. This process is detailed in Table 4. Obviously, these are
not comprehensive or ideal measures of each dimension. For example, a primary care
practice which employs bilingual doctors and nurses would be arguably more
culturally competent than one which calls in an interpreter as needed. However, this
exercise in determining the existence of a medical home is limited by the information
available in the survey data which provides no indication of the linguistic abilities of
medical practice personnel. The goal is to achieve the best approximation of a child’s
association with a medical home that is possible given the constraints of the questions
asked.

Preventable ED Utilization by Children
26
Table 4 NSCH Questions Addressing the Seven Dimensions of Medical Home
Dimension Question Description S5Q06A How often can help be obtained from personal
MD on phone? accessible
S5Q07A How often is immediate care available from personal MD?
family-centered none continuous S5Q01 Does child have a personal doctor or nurse?
PREV_CARE (derived from
S5Q08A, S5Q08B, S4Q03R)
During the previous year, did the child make the appropriate number of preventative care visits to their personal doctor according the schedule recommended by the American Academy of Pediatrics for children of their age?
S4Q07 During the previous year, did the child receive all the medical care necessary?
S5Q02 How often does personal MD spend enough time with child?
S5Q04 How often does personal MD explain things in an understandable way?
S6Q28 Did personal MD ask about learning, development or behavioral concerns?
comprehensive
S6Q29 IF LDB concerns, did personal MD give information to address those concerns?
S5Q09B If specialist was needed, did personal MD help get specialist care?
coordinated
S5Q10B If special services, equipment or other health care was needed, did personal MD help get it?
S5Q09C If specialist was needed, how often did personal MD talk to patient/caregiver about what would happen at specialist visit?
compassionate
S5Q10C If special services, equipment or health care was needed, how often did personal MD talk to patient/caregiver about it?
culturally competent
S5Q13A If an interpreter was required, how often was one available to assist with personal MD visits?
A medical home score variable was derived to represent each child’s
relationship with a medical home on a scale of 0-100. The existence of one or more
medical professionals identified by the caregiver as the referenced child’s personal

Preventable ED Utilization by Children
27
doctor or nurse is considered a necessary, though not sufficient, measure of medical
home. Therefore records indicating the lack of association with a personal doctor or
nurse were assigned a medical home score of zero. Not all of the fourteen measures
of medical home described above are collected from each survey respondent.
However, there are five core measures which are collected concerning every child
who has identified a personal doctor or nurse and has sought medical care of any kind
in the survey reference period. The other nine variables contain information collected
only if the child required certain health care in the referenced period. For example,
Question S5Q06A is asked only if the caregiver indicates that phone assistance was
required and sought and Question S5Q13A is asked if the primary household
language is other than English and the caregiver indicated that an interpreter was
required for adequate communication with the medical professional. Therefore, in
order to assure accurate and comparable medical home scores both for healthy
children who used few non-preventative medical resources in the referenced period as
well as those for whom more resources were required, the medical home score was
designed to include two components. The first is a base score which incorporates the
more universal measures of continuous, comprehensive medical care. Each of these
is assigned a value and the values are summed to attain a base measure of medical
home. For children over five years of age who needed and received only preventative
care during the referenced year and required no interpreter, the medical home score is
determined solely on the basis of these five variables. Those who have received their
recommended preventative care from a health care professional who always devotes

Preventable ED Utilization by Children
28
ample time and provides understandable guidance receive a perfect medical home
score of 100.
Table 5 Measures of Care Contributing to Base Medical Home Score
Measure Description Value Personal_MD Child has a personal doctor or nurse. 40
Prev_Care Child received AAP recommended # of preventative visits,
15
Got_Care Child received all necessary medical care during the past year.
15
MD_Time How often did doctor spend enough time with the child?
always – 15 usually – 10 sometimes – 5 never - 0
MD_Explain How often did doctor explain things in an understandable way?
always – 15 usually – 10 sometimes – 5 never - 0
The second component adjusts the medical home score to reflect inadequate provision
of primary care services addressing individual health care needs. For example,
comprehensive medical care for children under five requires that the personal doctor
provide guidance about learning, developmental, and behavioral concerns. If he/she
neglects to provide this, the medical home score is decremented. Likewise, if the
child (or caregiver in support of the child) required assistance by phone, immediate
care for illness or injury, referral to and help with a specialist or special medical
equipment or care and any of these needs were not met by their personal medical
practice or clinic, the value of the medical home score is decreased. Each of these
measures of failure to provide a medical home is assigned a value and the total
medical home score is decremented by that value if response to the pertinent survey

Preventable ED Utilization by Children
29
question indicates the appropriateness of this action. If the response indicates that the
need was adequately met or if the question did not apply to the referenced child, the
medical home score is not adjusted. The medical home score then is defined as the
total of the base measure of comprehensive care less adjustments.
Table 6
Adjustments to Base Measure of Medical Home
Measure Description Decrement Value
MD_Phone_Help How often did doctor provide help by phone when needed?
never – 15 sometimes – 10 usually – 5 always- 0
Got_Immed_MD How often did doctor provide immediate care when needed for illness or injury?
never – 15 sometimes – 10 usually – 5 always - 0
LDB_MD_Conc Doctor did not ask about learning, development or behavioral concerns for child under 5.
10
LDB_MD_Info Doctor did not provide information to address stated concerns about learning, development or behavior for child under 5.
10
Spec_PMD_Access Doctor did not help patient get specialist care when needed.
10
Spec_PMD_Explain How often did doctor talk to patient/caregiver about what would take place during specialist visit (if specialist required)?
never -5 sometimes – 5 didn’t go - 5 otherwise - 0
SCare_PMD_Access Doctor did not help patient get special equipment or care when needed.
10
SCare_PMD_Explain How often did doctor explain about needed special equipment or care?
never – 5 sometimes – 5 didn’t get – 5 otherwise - 0
Got_Interp How often was an interpreter provided if one was needed to adequately communicate with doctor?
never -5 sometimes – 5 otherwise - 0

Preventable ED Utilization by Children
30
The medical home score provides a measure of the strength of the association
of the referenced child with a medical home. Fortunately, for those who have a
personal doctor or nurse and therefore a non-zero medical home score, higher scores
are more prevalent than lower.
Figure 3. Distribution of survey respondents according to medical home score.
It was hypothesized that children with stronger associations with quality medical
homes would be less likely to utilize the emergency department for potentially
preventable conditions. In general, this hypothesis was not supported by the data.
However, for the very small segment of the survey population comprised of children
associated with a personal doctor or nurse and medical home scores less than 50,
there is a link between lower medical home score and greater likelihood that the child
has made at least one potentially preventable visit to the emergency department. This
is illustrated by Figure 4. Only approximately 1% of the children referenced by the
survey belong to this group. These children identify a personal health care provider

Preventable ED Utilization by Children
31
but apparently receive very few primary care services from him/her. In fact, over 98%
of these children do not receive the recommended preventative care. They also
receive considerably less sick care outside of a hospital.
Figure 4. Percent of children associated with a potentially preventable/avoidable emergency department visit by medical home score.
While the medical home score provides a measure of the child’s access to
quality primary care, for the vast majority of survey respondents it is not a
particularly strong indicator of potentially preventable emergency department
utilization. A more predictive relationship exists between the base medical home
score, the first component of the medical home score calculation, and the target
behavior. Recall that this base score measures the referenced child’s consistent access
to a personal health care professional who offers recommended preventative care and
provides adequate time and explanations as necessary. It is also dependent on whether
the child receives all necessary medical care, but does not reflect the adjustments
indicating the degree to which special health care needs are met. By definition, a
base medical home score is either zero, if the child has no personal doctor or nurse, or

Preventable ED Utilization by Children
32
40-100 if there is an associated personal medical professional. Figure 5, the
normalized histogram of base medical home scores, shows the proportionate
association with potentially preventable emergency department visits.
Figure 5. Percent of children associated with a potentially preventable/avoidable emergency department visit by base medical home score
As the base medical home is more predictive of the target behavior, it is
adopted as the measure of access to quality primary care for the purpose of this study.
Children associated with base medical home scores of 75 or more are considered as
having a medical home. Note the difference in behavior with regard to potentially
preventable emergency visits for those children who claim to have a personal doctor
but based upon their base medical home score do not have an established medical
home. This 8.65% of the population are far less likely to visit the emergency
department with such problems than those with a medical home. They are also far
less likely to make such a visit than children who have no personal doctor.
A medical home variable was derived which indicates a child’s level of access
to adequate basic primary care. Each record is categorized according to association

Preventable ED Utilization by Children
33
with (a) a personal medical professional who provides a medical home, (b) a personal
medical professional but no medical home, or (c) no personal medical professional.
Attributes measuring the specialized care features which were reflected as deductions
in the more comprehensive medical home calculation are considered as separate
potential predictors, with the exception of those relating to learning, developmental
and behavioral concerns which were found to be unrelated to the target behavior.
Specialized care features.
Figures 6 and 7 demonstrate how improved access to medical advice by phone
or immediate primary care for illness or injury decreases the likelihood of a
potentially preventable emergency department visit.
Figure 6. Association of access to medical phone advice with potentially preventable/avoidable emergency department use.
Figure 7. Association of access to immediate care for illness or injury with potentially preventable/avoidable emergency department use.

Preventable ED Utilization by Children
34
On the other hand, patients with access to a primary care provider who consistently
provides explanations as to the necessity for and process of obtaining required
specialized equipment are more likely to make a potentially preventable visit to a
hospital emergency department. It is possible that greater attention is devoted to those
patients with the most significant health care needs and these would be the patients
most likely to require emergency care.
Figure 8. Association of frequency of primary care provider’s explanation of specialist care with potentially preventable/avoidable emergency department use.
Likewise, children with a primary care provider who coordinates access to a
specialist or specialized care or equipment are more, not less, apt to make a
potentially preventable emergency department visit.
Figure 9. Association of primary care provider’s assistance in obtaining specialist with potentially preventable/avoidable emergency department.
While the availability and nature of primary care influences the likelihood of a
potentially preventable emergency department visit for children who require

Preventable ED Utilization by Children
35
specialized care, figures 6 through 9 clearly indicate that the children least associated
with such visits are those who require or seek no special care.
Sick care/Sick days.
Sick care refers to the number of times the referenced child saw a medical
professional for non-preventative reasons outside of a hospital in the twelve months
prior to the survey. The data indicates a clear relationship between number of sick
visits and a potentially preventable emergency department visit. The more often a
child seeks medical care outside of the hospital, the more likely he/she will seek
potentially preventable care in a hospital emergency department. This relationship
applies throughout the range of number of sick care visits. This suggests that this
attribute primarily indicates level of wellness rather than discriminate between
primary or emergency care when a child’s illness is primary care treatable. Very few
of the surveyed children used the emergency department exclusively in place of
primary sick care. Only 1.8% of the referenced children are associated with a
potentially preventable emergency department visit but not a sick care visit to a
primary health care provider. Sicker children who require more medical care are more
likely to seek or be sent by a medical professional to the emergency department for
some of that care. In fact, nearly half the referenced children who made more than 12
sick care visits also made at least one potentially preventable emergency department
visit.
The number of school days missed due to illness provides another measure of
wellness for all school-age children, including those who are not typically brought to
a medical professional for treatment of illnesses. As the number of sick days

Preventable ED Utilization by Children
36
increases, so does the likelihood of a potentially preventable emergency department
visit.
Health Conditions
NSCH survey questions investigated the existence of particular health
conditions which require treatment. Ideally this treatment would be provided in a
primary care setting. However, when primary care is not sought or provided in a
timely and effective manner, children dealing with these conditions are more likely to
require emergency department services identified by this study as potentially
preventable. Asthma and allergies (respiratory, food, or skin) are two of these
conditions. Each of these is associated with more than ten percent of the study of
population and is therefore considered individually as a possible risk factor for
potentially preventable emergency department utilization. Several other conditions
occur in smaller segments of the pediatric population. Each one is associated with a
greater likelihood of potentially preventable visits to emergency departments.
However, they are optimally not considered individually because their numbers are
too small to be statistically significant. Instead, they are grouped into a single flag,
Health_Conditions which is true if the child exhibits one or more of these conditions.
Asthma.
Of the children studied by the NSCH, 11.92% were reported to have been
informed by a health care professional at some point that they had asthma. Caregiver
responses indicated that 8.5% of the children still had the condition at the time of the
survey. This latter group can be segmented according to whether the referenced child
experienced an episode of asthma (asthma attack) within the 12 months prior to the

Preventable ED Utilization by Children
37
survey. Such an episode serves as an indicator of unsuccessful management of the
child’s asthma. For the purposes of this study, children identified by their caregiver as
no longer having asthma were grouped with those who never had asthma in the ‘no
asthma’ category. As is quantified in Table 7, records corresponding to children who
have recently suffered an asthma attack are considerably more likely to be also
associated with a potentially preventable emergency department visit. This is hardly
surprising. Asthma attacks which require emergency department care are classified as
such as they theoretically could be prevented by appropriate, regular treatment and
medication.
Table 7 Percent of Children Associated with a Potentially Preventable/Avoidable Emergency Department Visit by Asthma Classification
Asthma Classification Percent Associated with a PPA Visit Asthma with recent attack 27.81 Asthma with no recent attack 15.40 No asthma 10.51
The link between regular, appropriate medication and decreased necessity for
emergency department intervention for children with asthma was reported by
Dombkowski et al (2004). The NSCH data is limited in the information it provides
concerning adherence to an asthma medication regimen. Survey responses provide an
indication of the elapsed time since the child with asthma last received medication for
this condition. There is no distinction as to whether the medication is designed to
prevent asthma attacks or respond to them or the frequency or regularity with which it
is administered. For the referenced children, more recent medication is associated
with an increased likelihood of potentially preventable emergency department

Preventable ED Utilization by Children
38
utilization. It is noted that children with more severe asthma are more likely to
receive frequent medication. Additionally, those with poorly managed asthma are
likely to frequently require medication in response to episodes. Consequently,
children with more severe or unmanaged forms of the disease are more represented
among the most recently medicated. Therefore, rather than measuring the effect of
appropriate medication in preventing unnecessary emergency department attention for
asthmatic conditions, it appears that this attribute functions as an indicator of asthma
severity and management of the condition. The data also includes a separate variable
which reflects the respondent’s subjective assessment of the severity of the referenced
child’s asthma. There is the clear and logically expected association between greater
perceived severity and increased likelihood of a potentially preventable emergency
department visit.
In summary, while this data does not allow the opportunity to study the effect
of a regular sustained program of medication as it relates to the necessity of
emergency care, it does provide indicators of asthma severity and management. More
severe and/or less managed asthma are strongly associated with potentially
preventable emergency care.
Allergies.
Children with respiratory, food, or skin allergies are more likely to visit a
hospital emergency department with a potentially preventable problem than their non-
allergic peers. This is particularly true for those with food allergies. In this survey,
23.14% of the 3945 children with food allergies made potentially preventable visits to

Preventable ED Utilization by Children
39
an emergency department. This is almost twice the percentage of the general survey
population associated with a visit of this nature.
Other health conditions.
Other health conditions which afflict fewer children are also associated with
significantly greater potentially preventable emergency department utilization.
Table 8 indicates the prevalence of these conditions and the percentage of those
afflicted who are associated with a preventable emergency department visit.
Table 8 Percent of Children Associated with a Potentially Preventable/Avoidable Emergency Department Visit by Health Condition
Condition Percent of Survey Population Afflicted
Percent Associated with a PPA Visit
Diabetes 0.34 28.65 Depression 4.03 18.08 Bone, Joint, or Muscle Problem 3.47 19.03 Developmental Delay or Physical Impairment
3.57 22.83
Severe Headaches or Migraines 4.61 18.22 >= 3 Ear Infections, Past Year 3.80 24.37 None 87.2 10.86 Of the surveyed children, 15.37% have one or more of these conditions. They are
identified in the modeling process by the derived flag attribute Health_Conditions.
Condition severity.
Children with mild forms of the aforementioned conditions are less likely to
require potentially preventable emergency care than those for whom the conditions
are more severely manifested. The Condition_Severity variable reflects the severity
of the most severe condition for children afflicted with allergies or any of the
conditions combined in the Health_Conditions flag.

Preventable ED Utilization by Children
40
Figure 10. Association of condition severity with potentially preventable/avoidable emergency department use.
Exercise
The survey questioned the number of days per week that a child six years of
age or older vigorously exercised. For children who exercise, the number of days
does not have a marked effect on the likelihood of a potentially preventable
emergency department visit. However, children who consistently refrain from
exercise are significantly more likely to make such a visit. Consequently, a flag
attribute was derived to indicate if the referenced child of at least six years of age
engages in regular exercise.
Weight
The NSCH data includes a derived variable which identifies the referenced
child as (a) underweight, (b) normal weight, (c) at risk for becoming overweight, or
(d) overweight. The overweight category includes children at or above the 95th
percentile of BMI-for-age. Approximately 18% of the referenced children are
classified as overweight. Children under six years of age who are identified as
overweight are not significantly more likely to be associated with a potentially
preventable visit to an emergency department. However overweight school-age
children are 45% more likely to make such a visit than their peers of other weight
classifications. Overweight school-age children, particularly those ten years of age

Preventable ED Utilization by Children
41
and older, are also more likely to refrain from regular exercise. However these
children are no more or less likely to use emergency department services for
potentially preventable reasons than their overweight peers who exercise.
The referenced child’s weight is considered in modeling in the form of a
derived flag variable which indicates whether or not the ‘overweight’ classification
was applied by the NSCH formula.
Geographical home
State.
The NSCH survey was designed to provide approximately equal
representation of children from each of the 50 states plus the District of Columbia.
Additionally, survey design ensured that each of these 51 subsets would be
independent data sets allowing for statistically accurate subsetting by state (NSCH
Survey Design, 2005). The percentage of records associated with a potentially
preventable emergency department visit varies significantly by state. Appendix B
contains a table ranking the states from least association to greatest.
States associated with the most extreme patterns of potentially preventable
emergency department utilization were profiled in order to gain insight into shared
characteristics which may influence these patterns. The first consideration was
disproportionate populations of groups which were previously established to be more
represented among those who engage in the target behavior. Poverty status,
education and race have been shown to be predictive of potentially preventable
emergency department utilization. State deviation in prevalence of the target behavior
related to differences in population concentrations with regard to these factors merely

Preventable ED Utilization by Children
42
confirms the consistent importance of these factors in influencing this behavior.
Additionally, differing access to primary and emergency care within each state may
contribute to variations in emergency department utilization. This study included a
comparison of the number of children per practicing pediatrician and the number of
hospitals per square mile in each state. These attributes were derived using
information obtained from multiple sources as described in Appendix C.
Table 9
Comparison of Characteristics for States Associated with the Lowest Rates of Potentially Preventable Emergency Department Utilization
State %Pop Below
Poverty Level
%HS/College Grad
% Black Child per Pediatrician
# of Hospitals per 1000
square miles
VT 8.5 88.9/31.3 0.6 1236 1.73 UT 9.1 89.4/28.4 0.9 2551 0.58 CT 8.1 87.5/33.5 10.1 1220 9.49 NE 9.8 90.8/26.8 4.3 2608 1.22 CO 9.7 88.7/36.0 4.1 1966 0.81
Table 10
Comparison of Characteristics for States Associated with the Greatest Rates of Potentially Preventable Emergency Department Utilization
State %Pop Below Poverty Level
%HS/College Grad
% Black Child per Pediatrician
# of Hospitals per 1000
square miles
MS 16 81.2/19.3 36.8 2883 2.26 WV 17.4 78.7/15.3 3.2 2068 2.74 LA 17 79.8/22.3 33.0 1994 4.91 DC 16.8 86/46.4 57.7 484 229.51 KY 14.4 82.8/21.3 7.5 2154 2.89
Tables 9 and 10 confirm the relationship between poverty, education and the
target behavior on a state level. Consistent with national patterns, the states

Preventable ED Utilization by Children
43
associated with the highest rates of potentially preventable emergency department
utilization have proportionately greater populations identified as living below the
poverty level or lacking in educational attainment. Conversely, emergency
departments in states with considerably fewer poor and less educated residents see
fewer potentially preventable cases.
In general, states with the highest rates of potentially preventable emergency
department utilization are home to significant black populations and blacks are much
less represented in those with lower rates. Connecticut and West Virginia are
exceptions to this rule indicating that race is independently less influential in
determining potentially preventable emergency department utilization in these states.
DC is somewhat atypical of states showing greatest association with
potentially preventable emergency department utilization. While its black population
and percentage living below the poverty level clearly associate it with similarly
grouped states, it boasts more college graduates than any state in the country. The
nature of this district is that two very different groups coexist within its boundaries:
the very poor as well as those associated either directly or indirectly with the national
government who tend to be well educated, compensated, and insured. However
further investigation indicates that within DC each group engages in the target
behavior in a manner consistent with similarly characterized groups outside the
district.
The national average for children per clinically active pediatrician is 1769.
There is no consistent deviation from this average among either of the groups of
states which represent the extremes of the target behavior suggesting that this

Preventable ED Utilization by Children
44
measure of accessibility to a pediatrician has no apparent individual effect upon the
level of utilization of hospital emergency departments for potentially preventable
reasons. On the other hand, there is evidence that the concentration of hospitals
within a state is significant. In general, the states most associated with the target
behavior have more hospitals per 1000 square mile area than those least associated
with it. Again Connecticut, which is second only to the District of Columbia in
hospitals per thousand square miles and yet boasts among the lowest of rates for
potentially preventable emergency department visits, is an exception. Note however
that Connecticut also has a large number of pediatricians with respect to the number
of children within the state, indicating that health care in general is very available in
this state. It is logical that if a hospital is conveniently located, the choice to seek
care there instead of at an alternative facility is more attractive. However if
pediatricians are also readily available, the convenience factor may be less of an
influence. Given the suggestion that these two factors may have a combined effect on
a state’s rate of potentially preventable emergency department visits, new variables
were derived to include in modeling these measures of availability of practicing
pediatricians and hospital emergency care. Values were calculated for each state and
then the new variables assigned to each record according to the associated state of
residence.
Character of residence.
The NSCH data includes an attribute which indicates whether the referenced
child resides within a metropolitan statistical area (MSA). This designation is applied
only to records of children who reside in states with sufficient populations in both
Preventable ED Utilization by Children
45
MSA and non-MSA areas. There is a slightly greater tendency for children in non-
metropolitan areas to make a potentially preventable visit to a hospital emergency
department.
Non-Predictive Attributes
Several attributes were considered but discovered to be lacking any significant
association with the target behavior. These include gender, age position within the
household, caregiver country of origin, and geographic region. Additionally, the
presence of smoker in the household was considered. In general, this data suggests
weak positive correlations between children who reside with a smoker and potentially
preventable visits to a hospital emergency department and between such children and
the existence or aggravated severity of respiratory allergies or asthma. Unfortunately,
a survey design error resulted in the omission of this question when surveying
caregivers of children less than six years of age for the first six months
(approximately one third) of the period in which the survey was administered (NSCH
Design, 2006). Consequently the survey data includes a group of approximately 13%
of the response records, primarily associated with infants and toddlers, for which the
existence of a smoker in the household is unknown. Rather than remove these
records when modeling, this decision was made to disregard this attribute.
Data Preparation for Modeling
In preparation for modeling, the NSCH data set was randomly split into
training and test data sets, each of which were determined to be characteristic of the
entire set. The training data was balanced in order to assure sufficient representation

Preventable ED Utilization by Children
46
of the relatively rare target class which indicates a potentially preventable emergency
department visit. The balanced training data set is composed of more than 16,000
records with relatively equal representation of target attribute values.
Clustering
K-means clustering was employed to form two clusters which are
characterized by Table 11. Comparing the clusters, the first is less associated with the
target behavior. In general, the children represented by this cluster are healthier with
fewer allergies, asthma, and other health conditions. Fewer needed immediate care
by a primary care provider or specialist. Almost all of the children who have no
primary care doctor are assigned this cluster. Hispanic children are more than twice
as likely to belong to this cluster. This group also includes the majority of those who
require an interpreter to communicate with a medical professional. Records assigned
to cluster 2, on the other hand, are significantly more likely to be associated with a
potentially preventable emergency department visit. This cluster is characterized by
sicker children who are more likely to suffer from allergies, asthma, or other health
conditions, particularly those with moderate to severe forms of these conditions.
Children referenced by the records in this cluster were more likely to need immediate
or specialized medical care or medical assistance by phone. Almost all are associated
with a medical home and are insured, either under Medicaid or private plans. Given
the disparate concentrations of records associated with a potentially preventable or
avoidable emergency department visit in the two clusters, cluster assignment can be
used as a predictive indicator of target class.

Preventable ED Utilization by Children
47
Table 11 Cluster Characterization using Full Data Set
CLUSTER 1 CLUSTER 2 % associated with PPA visit 7.26 25.69
Indicators of Wellness
mean # sick care visits 1.24 3.88 mean number of sick days 2.50 5.89
mean general health 1.41 1.87 % with allergies 13.16 62.88
% with multiple allergies 1.20 15.71 % with asthma 3.78 24.04
% with health conditions 6.80 44.05 % with severe health condition 0.75 6.45 % who get no regular exercise 7.06 8.95
% who are overweight 17.55 20.57 % who required specialist 7.42 67.40
% who required specialized equipment or care
2.88 29.30
% who required immediate care
16.78 60.36
Access to Health Care
% with medical home 71.31 96.03 % Medicaid insured 21.42 23.75
% uninsured 9.88 4.58 % who sought medical advice
by phone 27.75 71.97
% who need interpreter 2.07 0.79
Demographics Median age group 6-9 6-9
Median Income Group middle middle % with post high school
education 72.85 81.05
% Hispanic 6.56 3.1 % Black 9.55 8.6
Classification Modeling
Exploratory data analysis identified factors which are individually related to
potentially preventable emergency department utilization and detailed the nature of

Preventable ED Utilization by Children
48
those relationships. Data mining classification modeling techniques allow the
investigation of more sophisticated multivariate patterns. Since the goal of this study
is the discovery and description of trends, the choice of modeling technique was made
with consideration of transparency of results. Decision tree algorithms produce
interpretable rules which detail the interaction of factors influencing the target
behavior. In addition to providing a global description of the data set with regard to
the target behavior, decision tree rules can be used to identify and characterize
interesting subpopulations which are disproportionately associated with this behavior.
Algorithms which construct decision trees include Classification and Regression Tree
(CART) (Breiman, Friedman, Olshen, & Stone, 1984) as well as C5.0 and its
predecessors ID3 and C4.5 (Quinlan, 1993). An alternative classification approach
would be the application of a covering algorithm such as PRISM or RIPPER which
produce lists of rules which could be used to identify multivariate patterns of
potentially preventable emergency department utilization.
National Model
A CART model was built using the full, balanced training set to gain insight
into nationally significant patterns of potentially preventable emergency department
utilization. CART employs a binary, recursive partitioning of the NSCH data set.
This application of CART analyzes how best to utilize the 38 (including cluster)
predictor variables to split the data into smaller groups of records according to shared
class. For this data, there are two target classes. A record is either associated with
potentially preventable emergency department utilization or it is not. At each node,

Preventable ED Utilization by Children
49
CART performs an exhaustive search of the variable set to determine the split which
minimizes the Gini impurity index. This index, which was proposed by Breiman et al.
(1984), measures the extent to which the segments of data assigned to each child node
deviate from the ideal of homogeneous target values and is calculated as follows:
#classes
GiniL = 1 - ∑ (Lj/TL)2 (1) j=1 #classes
GiniR = 1 - ∑ (Rj/TR)2 (2) j=1 Impurity Index = (TL* GiniL + TR* GiniR)/n (3) where: n = the number of records at parent node TL = the number of records in the left child node TR = the number of records in the right child node Lj = the number of records of class j in the left child node Rj = the number of records of class j in the right child node CART builds a tree by adding branches which decrease the impurity of the parent
node until no further reduction in impurity is possible or until stopping criteria have
been satisfied. In designing a classification tree, depth is a crucial consideration. A
tree which is grown beyond the optimal length may overfit the data, achieving
admirable classification accuracy on the training data but generalizing poorly to new
data. Conversely, insufficient depth limits the trees predictive capability and often
disregards rules which demonstrate interesting patterns of behavior. To address this
concern, stopping criteria were set to limit the depth of this tree to five levels under
the root node.

Preventable ED Utilization by Children
50
Figure 11. National decision tree.
By design, the root node attribute is the variable which most cleanly splits the
data according to class. At each subsequent level of the tree, the attribute chosen is
that which most cleanly splits the remaining data according to class. Consequently,
the top splits of this decision tree illustrate some of the most important patterns of
potentially preventable emergency department utilization by children.

Preventable ED Utilization by Children
51
Table 12
Top Level Split Attributes – National Model Attribute Split
cluster 1 First Split cluster cluster 2
< 6 years old Second Split age group school-age Medicaid insurance type
none or private 0 sick care visits sick care
> 0 sick care visits <= 5 sick days off school
Third Split
sick days > 5 sick days off school
This model stresses the importance of the child’s level of wellness in
determining potentially preventable emergency department utilization. The most
significant partition separates the generally healthy children assigned to cluster 1
from the less-well children, including most with asthma, allergies or health conditions
which require immediate or special care, of cluster 2. The number of sick care visits
outside of a hospital setting or days home sick from school are also considered in
determining the referenced child’s association with illness and hence potentially
preventable emergency department utilization. That ill children are more likely
visitors to an emergency department for any reason is not a particularly startling or
actionable finding. However, this model also addresses factors which influence the
decision to seek care in an emergency department setting for potentially preventable
problems when the child is ill.
Of considerable importance is the age of the child. CART distinguishes the
behavior of school-age children in this regard from that of those younger. Infants and
preschoolers are strongly associated with potentially preventable emergency
department utilization. In contrast, school-age children are considerably less so.

Preventable ED Utilization by Children
52
Indicators of wellness are particularly important in isolating the group of school-age
children who do visit the emergency department with potentially preventable
concerns.
The type or existence of medical insurance coverage also plays a role in a
caregiver’s decision to seek potentially preventable care in an emergency department.
CART segments the population of generally healthy, cluster 1 children under the age
of six according to this factor. Those with Medicaid are shown to be significantly
more associated with such care than those who have no insurance or are privately
insured. In fact, while CART utilizes this attribute to partition a specific subset,
exploratory data analysis concluded that this relationship holds for the full data set.
Additionally the level of education attained by a caregiver influences the
decision as to where to seek care for a child. Children in cluster 2 generally require
more medical care than other children. CART found that a caregiver with college
education is more likely to refrain from utilizing emergency department services to
obtain that care for their school-age child, particularly when the child is not
significantly ill as is evidenced by no more than five days absent from school.
Finally, this model detailed an effect of lack of association with a personal
doctor. Generally healthy school-age children of cluster 1 without private health care
insurance who have been ill enough to receive care outside the hospital are likely to
also make a potentially preventable visit to the emergency department if they have no
personal doctor. The support for a decision tree rule is the proportion of records
which satisfy the split conditions defining the path from root to the given terminal
node. The support for this rule is a scant 1.775% of the training data. Therefore,

Preventable ED Utilization by Children
53
further data investigation was undertaken to assure its generality. Confidence refers to
the proportion of records satisfying the split conditions which are correctly classified
by the rule. The noted confidence of 63.2% applies to the balanced training data. In
order to perform a valid comparison, the confidence of this rule as measured on the
unbalanced training records was contrasted with that measured on the test data set.
Table 13 provides evidence that this rule is in fact generally applicable.
Table 13
Comparison of Rule Confidence on Training and Test Set Rule Unbalanced
Training Set Test Set
if cluster 1 and school-age and any sick care and not privately insured and no personal doctor
.169 .171
Still further investigation examined whether the effect of the lack of association with
a personal doctor was limited to the population for which CART designed this rule.
That population was segmented based upon four attribute values: (a) cluster 1, (b)
school-age, (c) sick care visits > 0, and (d) Medicaid or no insurance. However, it was
discovered that the effect of the lack of a personal doctor on potentially preventable
emergency department utilization patterns applies more broadly to all records which
indicate any sick care visits outside of a hospital, regardless of insurance type, age or
cluster. Sick children who have no personal doctor are more likely to seek potentially
preventable care in an emergency department. Figures 12 and 13 illustrate this
pattern. Children without a personal doctor who do not visit a doctor outside of a
hospital for sick care are less likely than those with a medical home to seek
potentially preventable emergency department care. Children of every basic medical
home status are more likely to make a potentially preventable emergency department

Preventable ED Utilization by Children
54
visit if they have sought sick care outside of a hospital. For those with no doctor or
with a personal doctor but no medical home, this change in potentially preventable
emergency department utilization rate is greater than for those with a medical home.
Figure 12. Association with potentially preventable emergency department use by basic medical home category for children who make no sick care visits.
Figure 13. Association with potentially preventable emergency department use by basic medical home category for children associated with 1 or more sick care visits.
This suggests a more general rule than that described by CART.
Table 14 Comparison of Medical Home Decision Rules
Rule Antecedent Consequent Support Confidence CART if cluster 1 and school-age
and any sick care visits and not privately insured and no personal doctor
PPA 0.018 0.632
Generalized if no medical home (no doctor or a doctor but no medical home) and any sick care visits
PPA 0.097 0.65

Preventable ED Utilization by Children
55
This more general rule has greater support and confidence than that constructed by
CART. Note that CART’s more specific rule applied only to cluster 1. This is largely
because the clustering process grouped more than 95% of records associated with the
lack of personal doctor in cluster 1. While the lack of a personal doctor is associated
with increased likelihood for potentially preventable emergency department
utilization for children of both clusters, those few who are assigned cluster 2
overwhelmingly likely to make such a visit.
Figure 14. Association with potentially preventable emergency department use by basic medical home category for children of cluster 2.
Model Evaluation
Classification accuracy provides a quantitative measure of this model’s ability
to determine association with potentially preventable emergency department
utilization. Of the training data records, 75.06% were correctly classified. When
applied to the test data, this model achieved an overall accuracy rate of 74.85%. The
consistency of these two rates indicates the generality of the model, testifying to its
ability to perform equally well on new data.
Only 11.44% of the test data records indicate association with a potentially
preventable emergency department visit while 88.56% are pre-classified as not
associated with this target behavior. Thus, though this model incorrectly classifies
37.32% of the records which are associated with a potentially preventable visit, these

Preventable ED Utilization by Children
56
comprise a very small portion of the records classified as non-visitors as is reflected
in the false negative rate of 0.059. On the other hand, the 23.58% of non-visitors who
are misclassified are a significant portion of those visitors resulting in a false positive
rate of 0.744.
Figure 15. Predicted vs. actual association with potentially preventable emergency department visit – national model.
Figure 16 graphically illustrates the performance of this model which predicts
potentially preventable emergency department utilization for 8516 (28.05%) of the
test records. This group includes 62.68% of the records which are pre-classified as
associated with the target behavior along with 23.58% of the records which would
correctly have been assigned the opposite classification. This corresponds to a lift of
2.23.
Figure 16. Gains chart for national model.

Preventable ED Utilization by Children
57
If the model less liberally applied the positive classification, the effect would be to
move the arrow to the left along the curve, decreasing the number of records
incorrectly identified as associated with the target behavior (false positives), but also
the number of those correctly classified as such. In this case, the trade-off for
identifying a reasonable percentage of potentially preventable emergency department
visitors is accepting the misclassification of a significant number of records which are
pre-classified as non-visitors but follow patterns identified by the model to be
associated with such a visit.
Achievable accuracy for this model is limited by the attributes’ ability to
measure necessity for potentially preventable care. While available attributes measure
association with illness of any nature, for the most part they are incapable of
discerning the severity or term of illness. For example, a sick care visit in response to
a cold appears to the model as identical to one for treatment of pneumonia. Logically,
children associated with illness of a more serious or persistent nature would be more
likely to seek care in an emergency department. Furthermore, it is not unusual for
children, including those who typically seek non-emergent or preventable care in an
emergency department, to experience years in which they require no non-preventative
medical attention.
As the goal of this study is descriptive in nature, evaluation of the success of
this endeavor is not exclusively measured by the overall model accuracy. In addition
to understanding the interaction of factors which broadly describes potentially
preventable emergency department utilization, this project seeks to identify specific
actionable patterns which describe trends of population subsets. These can be

Preventable ED Utilization by Children
58
examined separately and their classification effectiveness measured by rule
confidence. Table 15 details the rules generated from the national model with the
most significant confidence.
Table 15 Decision Rules Generated from National Model
Antecedent Consequent Support Confidence if cluster 1 and school-age No_PPA 0.382 0.739 if cluster 1 and school-age and no sick care No_PPA 0.175 0.836 if cluster 1 and < 6years of age and Medicaid PPA 0.095 0.676 if cluster 1 and school-age and any sick care and not privately insured and no personal doctor
PPA 0.018 0.632
if cluster 2 PPA 0.350 0.722 if cluster 2 and < 6 years of age PPA 0.145 0.819 if cluster 2 and school-age and > 5 sick days PPA 0.093 0.760 if cluster 2 and school-age and <= 5 sick days and family education <= high school grad
PPA 0.024 0.703
Insurance Type Model
Health insurance status has been established as a significant contributing
factor in the decision to seek potentially preventable emergency department care. In
an effort to better understand how behavior patterns differ among children with
various types of health insurance, the CART interactive tree builder function was
used to build a classification model in which the training data is first split according
to insurance type so that separate branches individually model the training data
associated with each insurance type.
The cluster attribute was intentionally not included in this model. Clustering
groups similar records together. The k-means algorithm when applied to the NSCH
data grouped those records with attribute values which indicated similar degrees of
wellness and requirements for immediate or specialized care. These factors are highly

Preventable ED Utilization by Children
59
predictive of the target behavior. Consequently, clustering was employed as a useful
tool to increase the predictive accuracy of the national model. However, when cluster
is used, the specific factors which influence the choice of classification are somewhat
less transparent. Therefore, in an attempt to maximize descriptive value of this
second model, cluster was omitted from the input list.
The interactive tree builder function implemented in SPSS Clementine® 10.0
allows the data miner to apply knowledge of the data in determining split attributes
and values (Clementine® 10.0 Users Guide, 2005, Appendix C). The interactive tree
can be grown a level at a time. At each split, the data miner is afforded the
opportunity to accept the split determined by CART as most capable of decreasing
the impurity index or instead choose a competing predictor and/or customize the split
conditions. In this decision, he/she has access to information about available
predictors and the change in impurity available with each choice. For the NSCH data,
the CART algorithm recognized Sick_Care as the best split attribute.
Figure 17. Clementine® defined split.

Preventable ED Utilization by Children
60
Given the modeling decision to investigate patterns of potentially preventable
emergency department utilization by insurance type, this choice was overridden in
favor of the Insurance attribute using the ‘Select Predictor’ dialog box.
Figure 18. Customizing split attributes using Clementine® select predictor dialog box.
Note that this dialog box provides information as to the potential improvement
associated with each competing predictor. Improvement is the degree to which the
impurity could be reduced by a split using that predictor. As the Gini index has been
specified for this model as the measure of impurity, improvement is specifically
defined as the difference between the Gini impurity index of the parent and that of the
resulting child nodes. In this case, the choice of Insurance as a split variable in place
of Sick_Care results in less improvement for this initial split but facilitates the
descriptive goals of this model.
As the tree grows, there are nodes at which multiple predictors promise very
similar improvements. In these cases, the decision to override CART’s first choice
can result in a more descriptive or understandable tree with negligible effect on
classification accuracy. Also, customizing splits can have a positive effect on the
descriptive ability of the model. In the interactive insurance model, an
MD_Phone_Help split was designed by CART to group attribute values ‘usually’ and

Preventable ED Utilization by Children
61
‘not sought’ in one branch and ‘never’, ‘sometimes’, and ‘always’ in the other. This
split does not describe an understandable pattern of behavior. The split was
customized, instead grouping ‘usually’ with other attribute values indicating that
medical advice was sought by phone, resulting in no discernible difference in
accuracy and a far more understandable pattern of behavior.
Figure 19. Customizing split values using Clementine® define split dialog box.
Another advantage of the interactive method of building a decision tree is the
ability to test the effect of specific attributes on different subsets of the population.
An attribute split which contributes to the identification of a pattern can be tested on a
node in the same branch closer to the root to determine if the pattern can be
generalized. Likewise, an attribute can be chosen to split the data of various tree
branches in turn to compare the relative influence and effect on the target behavior
when applied to different groups. While these splits may result in less effective

Preventable ED Utilization by Children
62
classification and therefore not become part of the final tree, they afford the
opportunity to gain knowledge of the data.
Interactive modeling allows the data miner to grow or prune a tree by level or
branch providing more specific control over the design and depth of each branch and
optimizing the descriptive value of the resulting tree. The three branches of the NSCH
insurance type tree designed interactively are described in detail in the following
sections.
Medicaid Insurance Branch
It has been noted that children covered by Medicaid health care insurance are
significantly more likely than their privately insured or uninsured counterparts to visit
hospital emergency departments with potentially preventable problems. Nationally,
11.62% of all NSCH respondents indicated such a visit. By comparison, 19.65% of
those who are insured by Medicaid engaged in this target behavior. This strong
association with potentially preventable emergency department utilization is reflected
in the decision rules built by CART to classify records of Medicaid insured children.
Figure 20. Medicaid decision tree branch.

Preventable ED Utilization by Children
63
This model classifies the majority of training records, 78%, as potentially
preventable emergency department visitors. The strongest indicators of such a visit
are evidence of an illness which was treated outside of a hospital setting and age.
Table 16
Split Attributes – Medicaid Insurance Branch Attribute Split
0 sick care visits First split after insurance split
sick care > 0 sick care visits
< 6 years old age group school-age
<= 3 sick care visits
Second split after insurance split
sick care > 3 sick care visits
< 6 years old Third split after insurance split
age group school-age
required immediate medical care
Fourth split after insurance split
got_imm_MD
required no immediate medical care black or other Fifth split after insurance
split race
white, Hispanic, multiple race, or unknown
none sixth split after insurance split
health conditions at least one
All Medicaid insured children less than six years old are identified as likely
associated with this target practice. School-age children who make no primary sick
care visits are among the few who are not classified as likely to make a potentially
preventable emergency department visit. Those who have made more than three such
visits are confidently classified as likely to make a potentially preventable emergency
department visit. Finally, those who have made one to three sick care visits are
classified according to their need for immediate medical care, race, and the existence
of health conditions. The necessity for immediate medical care in addition to sick care
results in a classification as potentially preventable emergency department visitor.

Preventable ED Utilization by Children
64
Black children have previously been shown to seek potentially preventable
emergency department care at a greater rate than children of other races. This model
classifies all black children who have sought any primary sick care as likely
associated with this practice.
Table 17 summarizes rules generated from this model with significant
confidence. Note that support refers to that of the model as a whole, not the individual
branch.
Table 17
Decision Rules Generated from Medicaid Branch Antecedent Consequent Support Confidence
if any sick care visits PPA 0.211 0.746 if 1-3 sick care visits PPA 0.132 0.689 if > 3 sick care visits PPA 0.076 0.840 if 1-3 sick care visits and < 6 years old PPA 0.069 0.756 if no sick care visits and school-age No_PPA 0.042 0.692 if 1-3 sick care visits and school-age and required any immediate medical care
PPA 0.022 0.684
if 1-3 sick care visits and school-age and required any immediate medical care and race = black or other
PPA 0.010 0.710
No Medical Insurance Branch
The NSCH data indicates that children who lack any form of medical
insurance make potentially preventable emergency department visits at a rate which is
consistent with that of privately insured children, but less than half that of Medicaid
insured children. This is the least represented insurance type in the NSCH data. Only
8.69% of the referenced children are uninsured. Consequently, the depth of this
branch is limited by the relative scarcity of records.

Preventable ED Utilization by Children
65
Figure 21. Uninsured decision tree branch.
As for Medicaid insured children, careful examination of the model indicates
that uninsured children who use the emergency department for potentially preventable
care are most recognizable by their utilization of other health care resources. Those
who seek no primary care for illness in person or medical advice by phone either lack
the necessity for such care or are hesitant to seek care due to financial concerns
imposed by the lack of insurance coverage. These children typically do not seek
potentially preventable care in an emergency department and are so classified by this
model.
Family income determines the classification of those who do visit a health
care professional to address an illness. Uninsured children from upper income
families are considerably less likely to make a potentially preventable emergency
department visit than those from lower or middle income families. The former are
classified by the model as non-visitors and the latter as visitors. Those of lower or
middle income families who seek phone advice in addition to making one or more
sick care visits are particularly likely to use emergency department services to address

Preventable ED Utilization by Children
66
a potentially preventable concern. The use of multiple health care resources may
indicate more frequent, persistent, or serious illness.
Table 18
Split Attributes – Uninsured Decision Tree Branch Attribute Split
0 sick care visits First split after insurance split
sick care > 0 sick care visits
sought medical advice by phone
md_phone_help
did not seek medical advice by phone lower, middle
Second split after insurance split
income upper
sought medical advice by phone
Third split after insurance split
md_phone_help
did not seek medical advice by phone
For uninsured children, CART recognizes that indication of necessity for care and
income are more predictive of the target behavior than age. However, further data
exploration confirms that younger children without health insurance do make more
potentially preventable emergency department visits than older children who are
similarly uninsured.
Figure 22. Effect of age on potentially preventable emergency department utilization for uninsured children.

Preventable ED Utilization by Children
67
Table 19 summarizes rules generated from this model which achieved significant
confidence. These illustrate the importance of evidence of necessity for care in
determining association with a potentially preventable emergency department visit.
Once again, support is measured for the entire model. The limited concentration of
records associated with the lack of insurance results in corresponding small support
for these rules.
Table 19
Decision Rules Generated from Uninsured Branch Antecedent Consequent Support Confidence
if no sick care No_PPA 0.035 0.759 if no sick care and no medical advice by phone No_PPA 0.030 0.803 if at least 1 sick care visit and lower or middle income and medical advice sought by phone
PPA 0.013 0.748
Private Insurance Branch
More than 63% of the balanced training records reference children who have
private health care insurance coverage. These children are the most likely to have
access to adequate health care resources outside of a hospital.
Figure 23. Association with basic medical home by insurance type.
Nevertheless, they visit emergency department at a rate similar to that of uninsured
children.

Preventable ED Utilization by Children
68
Figure 24. Private insurance decision tree branch.
For Medicaid or uninsured children, the best discriminator between those who
seek potentially preventable emergency department care and those who do not is the
need for sick care of any kind. For those who are insured privately, it is the need for
immediate medical care. Those with private medical insurance who require no
immediate care are unlikely to visit the emergency department with a potentially
preventable concern. In fact the CART branch dedicated to the classification of this
group identifies only infants and preschoolers with less than excellent health who
have sought primary sick care as likely to make such a visit.
All the attributes used to partition the privately insured training data measure
necessity for care or age. This branch of the decision tree classifies records as
potentially preventable visitors to an emergency department only with evidence of
extensive, immediate or specialized care or less than excellent general health. As with

Preventable ED Utilization by Children
69
the Medicaid branch, the threshold of required care to gain this classification is lower
for infants and preschoolers.
Table 20
Split Attributes – Private Insurance Decision Tree Branch Attribute Split
required immediate medical care
First split after insurance split
got_imm_md
required no immediate medical care
sought medical advice by phone
md_phone_help
did not seek medical advice by phone 0 sick care visits
Second split after insurance split
sick care > 0 sick care visits
< = 6 sick care visits sick care > 6 sick care visits
< 6 years old
Third split after insurance split
age group school age
< 6 years old age group school age excellent
Fourth split after insurance split
gen_health < excellent
required a specialist Fifth split after insurance split
spec_pmd_explain
did not require or made no visit to a specialist
Table 21 summarizes the generated decision rules with significant confidence.
Table 21
Decision Rules Generated from Private Insurance Branch Antecedent Consequent Support Confidence
if no immediate care needed and no sick care visits
No_PPA 0.159 0.801
if no immediate care needed and no sick care visits and school-age
No_PPA 0.120 0.844
if immediate care needed and phone advice sought and < 7 sick care visits and age < 6
PPA 0.069 0.718
if immediate care needed and medical phone advice sought and > 6 sick care visits
PPA 0.031 0.822

Preventable ED Utilization by Children
70
Comparison of Insurance Type Branches
All three branches of the insurance type model focus primarily on partitioning
the data according to likely necessity for care. Regardless of insurance type, children
are not brought to an emergency department unless care is necessary. What differs is
the typical level of care required for classification as a potentially preventable visitor.
Potentially preventable immediate concerns are those which could be treated with
prompt attention in primary care or emergent conditions which might have been
prevented by earlier primary care. Privately insured children characteristically seek
emergency department care when the concern is immediate in nature and are more
likely to receive all their non-immediate sick care in a primary setting when
compared with those who are covered by Medicaid or no insurance. While uninsured
children and those insured by Medicaid are also quite likely to seek immediate care in
an emergency department when such care is required, many are associated with a
potentially preventable emergency department visit but no need for immediate care.
These children seek care for clearly non-urgent conditions in an emergency
department. CART specifically identified black Medicaid insured children as
associated with this type of utilization. Further investigation linked black children
with this behavior across all insurance types and age groups. However, the disparity
between black children and those of other racial/ethnic classifications in this regard is
greatest among uninsured children. Black children without medical insurance are
almost as likely to seek potentially preventable care in an emergency room as those
insured by Medicaid. Uninsured white and Hispanic children are considerably less

Preventable ED Utilization by Children
71
likely to seek such care, behaving much more like their privately insured peers in this
regard.
Table 22
Comparison of Percentage of Test Records Associated with a Potentially Preventable Emergency Department Visit by Population and Insurance Type
% Associated with PPA Visit Population Medicaid Insurance
Private Insurance
No Insurance
Black 21.09 12.46 18.58 White 17.58 8.73 8.20 Hispanic 18.4 9.66 9.36
Overall, Medicaid insured children are most likely to seek potentially
preventable emergency department care. In fact, the rate at which infants and
preschoolers are brought for such care is so significant that CART requires no
evidence of illness to classify them as likely visitors.
This model relies upon attributes which indicate utilization of primary care
resources in an attempt to gauge level of wellness and necessity for care which might
be sought in an emergency department. As with the general national model, these
measures are imperfect indicators. Many children are treated repeatedly in a primary
care setting and never seek emergency department care. Others utilize the emergency
department in place of primary care. In an effort to understand whether the type of
medical insurance affects the tendency to choose the emergency department
exclusively for care, the percentage of potentially preventable emergency department
visitors who use the emergency department as a sole source of primary care was
calculated by insurance type. Records referencing these children indicate a potentially

Preventable ED Utilization by Children
72
preventable visit to a hospital emergency room but no sick care visits to any health
care professional outside of a hospital.
Table 23
Potentially Preventable Emergency Department Visitors who Use the Emergency Department as a Sole Source of Care – Test Data
Insurance Type PPA, No Sick Care PPA % ED as Sole Source of Care
Medicaid 204 1274 16.01 No Insurance 70 262 26.72
Private 286 1937 14.77 Uninsured children are most likely to seek care exclusively in an emergency
department. Despite the strong association between Medicaid health care insurance
and potentially preventable emergency department utilization, children covered by
Medicaid are considerably less likely than their uninsured peers to receive all their
primary care in an emergency department.
Model Evaluation The insurance type model correctly classifies 73.17% of the test data. Like the
national model, it misclassifies a significant number of records which are not
associated with a potentially preventable emergency department visit, resulting in a
false positive rate of 0.762. It also fails to correctly classify 38.96% of those who are
appropriately associated with such a visit but, given the predominance of the negative
class, these records comprise a small percentage of those assigned the negative
classification. Hence the false negative rate is only 0.063%.

Preventable ED Utilization by Children
73
Figure 25. Predicted vs. actual association with potentially preventable emergency department visit – insurance model.
Note that the national model and the insurance type model performed
similarly. Both relied predominantly upon indicators of necessity for care and age in
determining class. Cluster, which was chosen as the most significant split attribute by
the national model, was intentionally disregarded in the insurance modeling process
in the interest of improved transparency. Nevertheless, the accuracy of this model
approached that of the national model. The combined lift chart of Figure 26 compares
the performance of the two models. Arrows indicate the lift attained when each model
was applied to the test data.
Figure 26. Comparative lift of national and insurance models as applied to test data.

Preventable ED Utilization by Children
74
State Models The national and insurance type models identify the most significant
nationally applicable patterns of potentially preventable hospital emergency
department utilization. Segmentation of the training data by state affords the
opportunity to investigate geographic variations in these patterns. Separate CART
models were built for each of the fifty states and the District of Columbia. Each was
tested for general applicability using an independent, hold-out test data set.
The state models consistently reinforced the importance of indicators of
wellness or necessity for care and age in predicting the target behavior. As these
patterns have already been established and discussed, the focus of this section is
limited to rules noted in the state models which suggest patterns which were not
identified by the models of national scope. These CART rules are used as the starting
point of an investigation which seeks to determine if the suggested patterns apply
nationally or are uniquely characteristic of certain geographic areas. Where they do
suggest differences, additional extensive data exploration further defines and clarifies
those differences. This technique identified two factors associated with geographic
variation in potentially preventable emergency department utilization. Additionally,
understanding of generally applicable patterns of such utilization is broadened with
the identification and analysis of rules included in individual state models but not in
models built using the complete data set.
Preventable ED Utilization by Children
75
Geographic Variation Distance from hospital.
Thirty-five states have significant enough population in both MSA and non-
MSA areas to have this designation of residency applied to data collected there.
When considered as a group, children who reside in non-MSA areas are more likely
to be from less educated, lower or middle income families and are either uninsured or
insured by Medicaid. They are less likely to have a medical home and more likely to
be white. They are also more likely to visit a hospital emergency department with a
potentially preventable concern. However, when the data is segmented by state, there
are three states which, although they adhere to these demographic patterns do not
follow the typical pattern of potentially preventable emergency department
utilization. Children residing in non-MSA areas of Iowa, Nebraska, and Texas are
less likely to make a potentially preventable visit than their peers in MSA areas. An
investigation into shared characteristics which might explain this departure from
common utilization patterns revealed that pediatricians are in short supply in these
states. In fact, when compared to other states, these three have among the greatest
values for number of children per clinically active pediatrician. Aside from this
commonality, Nebraska and Iowa share many similarities with each other and few
with Texas. Nebraska and Iowa have significantly more children living in non-MSA
areas than most other states. In these states, approximately half the children surveyed
lived in rural areas. Both MSA and non-MSA areas in Nebraska and Iowa boast a
greater than average percentage of families with higher levels of education and
income, privately insured children and those who have a medical home. Children of

Preventable ED Utilization by Children
76
color make up a significantly smaller percentage of the population, particularly in
rural areas. Texas on the other hand, has a larger than average percentage of lower
income citizens with no insurance or doctor and little education. As is the case for
other states with both MSA and non-MSA designations, these characteristics are
somewhat less prevalent in MSA areas. However in Texas the relative disparity
between MSA and non-MSA areas in terms of the prevalence of these characteristics
is considerably less than the average for all states with such designation. Hispanic and
multiple race children are represented in both MSA and non-MSA areas in Texas at
2-3 times their average representation. Children of black or white race are
proportionately less represented than average. In fact, in MSA areas of Texas, white
children comprise only 41.53% of the surveyed population. Texas is unusual among
states with fewer clinically active pediatricians per child in that the vast majority of
children are clustered in MSA areas. In general, the density of pediatricians is
inversely proportional to the percentage of children living in non-MSA areas. In
Texas, 86.84% of the surveyed children reside in MSA areas, a percentage
significantly greater than the average of 72.7%.
Doobinin et al. (2003) investigated the significance of convenience in
determining whether to utilize a hospital emergency department. They considered the
tendency of urban children to seek emergency department care in place of primary
care due to proximity and hours of availability. It is suggested that in rural areas far
removed from hospitals, the opposite tendency is driven by the inconvenience of
traveling great distances to obtain hospital care. In these areas it may be more
convenient to obtain primary care which, given the scarcity of available pediatricians,

Preventable ED Utilization by Children
77
may be provided by general practitioners who lack specialized training in pediatrics.
These primary care physicians, realizing the travel burden, may be hesitant to suggest
a trip to a hospital emergency department if at all possible to treat the condition
locally. It is also logical that parents residing in such areas would be cognizant of the
inherent time delay in obtaining emergency department care and would therefore be
more likely to address issues before they became emergencies.
As the NSCH does not provide a means of determining the distance from a
hospital for each child, the previous assumptions can not be conclusively supported or
refuted by this data. However, the database created for the Mapping Health Care for
America’s Children Project (AAP, 2003) does present information regarding
geographic location of clinically active pediatricians within each state. Pediatricians
tend to cluster in MSA areas, particularly those with hospitals. There are significant
geographic areas in Nebraska, Iowa, and Texas which not only lack a clinically active
pediatrician, but also are far removed from any clusters of pediatricians which might
indicate the availability of hospital care. This suggests that distance from emergency
care may be one characteristic shared by non-MSA residents of these three states.
Additional data would be required to thoroughly investigate the correlation between
distance from a hospital and rate of potentially preventable emergency department
utilization.
Need for an interpreter.
Children for whom an interpreter is required for effective communication
between caregiver/patient and medical personnel are more likely to be associated with
a potentially preventable emergency department visit. The strength of this association

Preventable ED Utilization by Children
78
varies widely by state as does the representation of children concerned. While the
NSCH data indicates a national average of 1.76% of children who require an
interpreter, many states, most notably Maine, West Virginia, Montana, North Dakota,
and Vermont, have few or no such children among those referenced by this survey.
On the other hand, 7.11% of the children in CA require an interpreter for effective
communication with health care personnel. Arizona, Nevada, Oregon, Rhode Island
and Texas also have strong representation of this group. The likelihood that a child
requiring an interpreter will make a potentially preventable visit to an emergency
department in states with the greatest concentration of such children is below the
national average of 20.45%. In states with moderate populations of non-English
speaking families requiring interpreters, including Connecticut, Delaware, and New
Jersey, children from such families are far more likely to be brought to an emergency
department with potentially preventable complaints. In these states, over 30% of the
responding children who require interpreters are associated with a potentially
preventable visit. Furthermore, while this group of children is more associated with
Medicaid than any other insurance, the type of medical insurance has no apparent
effect on the tendency for them to seek care in a hospital setting. Perhaps children
who do not speak English are more likely to find bilingual medical personnel or
interpreters in a hospital emergency department. States with the largest
concentrations of non-English speaking families may offer more primary care settings
staffed with personnel who can effectively communicate in patients’ primary
languages. However children in states with more moderate non-English speaking
populations may find it difficult to obtain such care. Further research utilizing data

Preventable ED Utilization by Children
79
with measures of availability and location of multilingual medical personnel would be
required to confirm this supposition.
General Trends
Most of the rules generated for the individual state models identified patterns
which do not indicate geographic differences in behavior, but rather highlight patterns
of behavior which generally apply to children across the nation. In many cases, the
CART rule defined a very specific subset of children associated with the target
behavior, which additional data analysis proved could be validly generalized to a
larger population.
Asthma.
Numerous state models include rules predicting potentially preventable
emergency department visits according to asthma related factors. Many models
predict a visit to an emergency department with strong confidence if a child has had a
recent asthma attack. Such an attack is the best available indicator of ineffectively
managed asthma. Models included asthma rules applying to various subsets of the
population. Further data investigation verified that unmanaged asthma is a strong
indicator of potentially preventable emergency department utilization independent of
other factors.
Income and Insurance.
The uninsured branch of the insurance type model noted a difference in target
behavior for children who required some sick care according to family income. Those
from families with income classified as ‘upper’ are less associated with a potentially
preventable emergency department visit. Several state models included rules which

Preventable ED Utilization by Children
80
supported this pattern which applies not only to the uninsured but to those who are
privately insured as well. Family income does not have a significant effect on
potentially preventable emergency department utilization for Medicaid insured
children. While most of these children do come from lower income families, the
minority from middle or upper income families engage in the target behavior at a rate
consistent with those of lower incomes.
Figure 27. Combined effect of income and insurance type on potentially preventable emergency department utilization.
Race and age.
Several state models utilized race to segment data. Rules consistently separate
black children from white children in classifying according to the target behavior.

Preventable ED Utilization by Children
81
However, classification of Hispanic children is dependent on age. Hispanic infants
make potentially preventable emergency department visits at rate very similar to
black infants. As age increase, the likelihood of a visit decreases for all races, but
does so most dramatically for Hispanics. By adolescence, Hispanic children behave
most similarly to white children.
Figure 28. Combined effect of race and age on potentially preventable emergency department utilization.
Medical home and sick care.
The effect of access to a medical home on potentially preventable emergency
department utilization differs according to necessity for care as measured by sick care

Preventable ED Utilization by Children
82
visits outside of a hospital. Healthy children with no medical home who require no
sick care are less likely to engage in the target behavior than similarly healthy
children with a medical home. However, when consideration is limited to those who
require sick care, the absence of a medical home is associated with greater likelihood
of a potentially preventable emergency department visit.
Figure 29. Combined effect of medical home status and amount of sick care on potentially preventable emergency department utilization.
Caregiver structure and age.
Exploratory data analysis found that children of single mothers are more
likely to make a potentially preventable emergency department visit than those who
are cared for in two-parent homes while those raised by a single father are least likely
to make such a visit. CART devised rules which suggest age plays a role in
determining the influence of caregiver structure on the decision to seek potentially
preventable emergency care for a child. Further data investigation showed that indeed

Preventable ED Utilization by Children
83
single fathers of infants behave similarly to single mothers in this regard.
Preschoolers with single fathers seek such care at a rate less than that of children with
single mothers but still greater than those cared for by two parents. The characteristic
hesitance of single fathers to seek potentially preventable emergency department care
for their children is evident only for school-age children.
Figure 30. Combined effect of caregiver status and age on potentially preventable emergency department utilization

Preventable ED Utilization by Children
84
Caregiver education and medical advice by phone.
The effect of consistently available medical advice by phone on potentially
preventable hospital emergency department utilization was noted to be dependent on
caregiver level of education. Children of caregivers with less than a high school
education are no less likely to make a potentially preventable emergency department
visit if consistent access to medical advice by phone is available. In more educated
families, the availability of such advice is associated with decreased likelihood of
such a visit.
Figure 31. Combined effect of consistently available medical phone advice and education on potentially preventable emergency department utilization.
Perhaps there is more effective communication between the doctor and caregiver or
the doctor feels more confident in accepting the more educated caregiver’s appraisal
of the nature of the child’s problem. Ineffective communication may result in the
medical decision to direct that the child be brought to the emergency department or

Preventable ED Utilization by Children
85
the degradation of the child’s condition resulting in the necessity of emergency care.
Regular exercise and age.
The school-age child who does not participate in regular exercise is more
likely to make a potentially preventable emergency department visit than his/her peer
who does exercise. While this pattern holds for all school-age children, for the NSCH
data, it is most pronounced for those between the ages of 10 and 12.
Figure 32. Combined effect of lack of exercise and age on potentially preventable emergency department utilization.

Preventable ED Utilization by Children
86
Association Rule Mining
As this thesis focuses on the utilization of hospital emergency department
services which are preventable by appropriate timely primary care, it is instructive to
thoroughly investigate how access to and utilization of adequate primary care
resources impacts such emergency department utilization. A final modeling exercise
therefore employs a supervised a priori association rule mining technique to develop
an understanding of health care requirements and utilization characteristic of groups
of children who are (a) associated with a medical home, (b) associated with a
personal doctor who provides less than the standard of care required of a medical
home, or (c) lacking association with a personal doctor and hence, with a medical
home. Clarification of the distinct manner in which each of these groups utilize health
care resources provides insight into how and why each typically seeks potentially
preventable emergency department care.
The a priori algorithm was developed by Agrawal and Srikant (1994) to
address the challenge of efficiently determining associations among attributes in a
large database. The SPSS Clementine® version of a priori was applied to the NSCH
data to generate rules which demonstrate the associations of other attribute values
with each medical home class. Each association is quantified by measures of support,
confidence, and lift. Rule support refers to the coverage of the rule measured as the
proportion of all records for which the rule is true. Antecedent support is the prior
probability of the antecedent within the data set. The confidence or accuracy of the
rule measures the ability of the antecedent to predict the consequent. It is calculated
by dividing the rule support by the antecedent support. Clementine® also calculates

Preventable ED Utilization by Children
87
lift which is the ratio of the rule confidence to the prior confidence of the consequent.
A rule with a lift which exceeds one demonstrates a positive association between
antecedent and consequent. Greater lifts imply stronger associations.
The practical value of an association rule is determined by the rule confidence
deviation from the prior confidence of the consequent. In this supervised application
of the a priori algorithm, consequents are restricted to Base_Med_Home attribute
values which describe access to a medical home. Therefore, prior confidences are
determined by the distribution of this attribute.
Figure 33. Base_Med_Home distribution determining prior probabilities for association rules.
A priori limits the number of rules generated by adhering to minimum rule
support and confidence specifications. Because two of the consequent classes are
relatively rare, minimum support and confidence must be set sufficiently low to allow
generation of rules describing associations for these groups of children. This could
result in a prohibitively large number of rules to analyze. However, Clementine®’s a
priori algorithm allows the use of a confidence ratio evaluation measure to restrict the
rules formed to those for which the difference from one of the ratio of rule confidence
to prior confidence of the consequent (or its reciprocal if this ratio is greater than one)
exceeds some specified minimum. Stated more succinctly, rules are included if
| Lift -1| > evaluation measure lower bound (4)

Preventable ED Utilization by Children
88
This method addresses the challenge of recognizing proportionately significant
changes in confidence when outcomes are not evenly distributed as is the case with
medical home classifications. It limits the generation of rules of little value while
allowing the inclusion of rules describing associations with rare categories such as the
No_Med_Home classification.
The a priori algorithm requires categorical inputs. The few attributes utilized
in this study which are not categorical can be logically discretized without
appreciable loss of information. In this process, logical groupings were determined by
analysis of CART rules formed using these variables during the classification mining
phase of this project. For example, the categorical representation of sick care
identifies the number of visits to health care professionals outside of a hospital for
treatment of illness as ‘none’, few (1-3), or many (4 or more) because CART
determined the significance of these groupings in earlier health care utilization
analysis. Similarly, general health was grouped as ‘excellent’, ‘very good’, or ‘less
than very good’. Additionally, it was noted that CART rules used attributes which
detailed relative availability of medical assistance by phone and immediate access to
primary care as dichotomous indicators of utilization of such resources.
Consequently, flags were derived to more effectively serve this purpose in association
mining.
Association Rules by Medical Home Category
Association with a Medical Home
The majority of children referenced by the NSCH, 76.95%, have access to a
basic medical home. Table 24 identifies the attributes most associated with these

Preventable ED Utilization by Children
89
children. In addition to Clementine® measures of data set antecedent support,
confidence, and lift, this table includes a measure of the rule support within the
medical home classification which indicates the percentage of records so classified
for which the antecedent is true. To illustrate using the first rule in Table 24, this
measure indicates that 79.976% of those children associated with a medical home
received all recommended preventative care. This provides an additional means of
gauging associations and characterizing the group.
Table 24 Rules Identified with Association with a Medical Home
Antecedent Antecedent Support
Confidence Support within Med Home = Yes
Lift
Prev_Care = yes 62.406 98.615 79.976 1.282 Immed_Care = yes 26.730 96.533 33.533 1.254 Phone_Help = yes 37.844 96.057 47.241 1.248 Sick_Care_Visits = many 15.225 89.237 17.656 1.160 Asthma = recent attack 4.969 87.378 5.642 1.135 Sick_Care_Visits = few 46.568 86.629 52.425 1.126 Children with a medical home characteristically make significant use of all
medical resources at their disposal. Of the three groups, they are most likely to
receive all recommended preventative care, immediate and non-immediate ill care in
a primary care setting, and medical advice by phone. They are also most likely to use
emergency department resources for potentially preventable concerns. Of the
children referenced in the NSCH study who were associated with a medical home,
12.29% indicated at least one such visit to an emergency department. Contributing to
their greater health care utilization, these children are more likely than their peers to
require significant care in the form of many ill visits, immediate care, or uncontrolled
asthma.

Preventable ED Utilization by Children
90
Association with a Personal Doctor but No Medical Home
Most children who identify a personal doctor receive sufficient care to
indicate association with a medical home. However, 8.65% of the children referenced
by the NSCH claimed association with a personal health care provider but did not
receive the standard or care required of a medical home.
Table 25 Rules Identified with Access to a Personal Doctor but Lack of Association with a Medical Home
Antecedent Antecedent Support
Confidence Support within Med_Home =
No
Lift
Prev_Care = no 37.594 20.703 89.978 2.394 Income = middle and Sick_Care_Visits = none
14.474 20.220 33.834 2.338
General_Health = very good and Sick_Care_Visits = none
7.312 20.014 16.918 2.314
Sick_Care_Visits = none and Insurance = Private
24.924 18.579 53.533 2.149
Sick_Care_Visits = none 38.207 18.412 81.326 2.129 Sick_Care_Visits = none and General_Health = less than very good
4.118 18.322 8.723 2.119
Sick_Care_Visits = none and General_Health = Excellent
26.777 17.989 55.687 2.080
Sick_Care_Visits = none and Insurance = Medicaid
8.465 17.181 16.814 1.987
Sick_Care_Visits = none and Income = upper
15.016 16.089 27.930 1.860
Insurance = none 8.668 13.501 13.529 1.561 EDUCATIONR = less than high school
4.520 13.165 6.879 1.522
Race = Hispanic 5.769 11.635 7.760 1.346 Phone_Help = no 62.156 11.512 82.721 1.331 EDUCATIONR = high school grad
20.760 11.203 26.887 1.296
Income = lower 19.778 10.748 24.575 1.243 Immed_Care = no 73.270 10.538 89.262 1.219

Preventable ED Utilization by Children
91
These children characteristically underutilize all medical resources. Only 10% adhere
to the recommended schedule of preventative care. Most make little or no use of
primary care resources in the form of immediate or non-immediate sick care visits or
medical assistance by phone. Additionally they are unlikely to be brought to an
emergency department for potentially preventable care. Only 4.28% of the NSCH
children in this group make such a visit. They are more likely to come from less
educated, lower income, uninsured families than their peers with a medical home but
considerably less so than those without any personal doctor. Those of this group who
are insured or come from families of higher income level are likely associated with no
primary sick care visits. In fact the single attribute which most distinguishes this
group is the lack of primary sick care received. Only 18.67% of these children make
a sick care visit as compared with 70.08% of those with a medical home and 43.41%
of those without a personal doctor. While some of these children enjoy excellent
health and receive no sick care because none is required, not all forgo such care due
to good health. Children of every general health status who make no sick care visits
are significantly represented.
Lack of Association with a Personal Doctor
Children who have no personal doctor comprise 14.4% of those studied by the
NSCH. By survey design, when a respondent indicates the lack of association with a
personal health care provider, questions regarding access to health care generally
provided by a personal doctor or nurse are omitted. These include preventative care,
medical phone advice, and immediate primary care. Consequently, every child of this
group is associated with the lack of access to and utilization of these resources.

Preventable ED Utilization by Children
92
Table 26 Rules Identified with Lack of Association with a Personal Doctor
Antecedent Antecedent Support
Confidence Support within Med Home =
No Doc
Lift
Prev_Care = no 37.594 38.306 100 2.660 EDUCATIONR = less than high school
4.520 36.254 11.380 2.517
Insurance = none 8.668 35.785 21.541 2.485 Race = Hispanic 5.769 31.629 12.671 2.196 Insurance = none and General_Health = Excellent
4.545 30.741 9.703 2.135
Income = lower 19.778 24.625 33.822 1.710 Phone_Help = no 62.156 23.169 100 1.609 General_Health = less than very good
12.640 21.722 19.067 1.508
Race = multiple race 10.920 21.534 16.330 1.495 EDUCATIONR = high school grad
20.760 21.329 30.749 1.481
Sick_Care_Visits = none 38.207 21.327 56.586 1.481 Race = black 9.332 20.987 13.601 1.457 num_sick_days = none 23.867 20.726 34.352 1.439 Immed_Care = false 73.270 19.655 100 1.365 Insurance = Medicaid 21.948 18.866 28.755 1.310 Children without a personal doctor are most likely to be raised in less educated, lower
income families and to be uninsured. More Hispanic and multiple race children are
represented in this group than any other. These children are more likely to make a
sick care visit than those with a personal doctor but no medical home but make
considerably fewer than those with a medical home. They are more likely to be of
less than very good health and thus require care that may not be available to them in a
primary care setting due to their lack of association with a personal doctor. However
almost 10% of this group enjoys excellent health but lacks health care insurance
coverage. In addition to financial constraints, the lack of requirement for care may
explain the absence of association with a doctor for this latter group.

Preventable ED Utilization by Children
93
Children without a personal doctor are restricted in their access to medical
care outside of a hospital. They seek potentially preventable care in the emergency
department at a rate of 11.38% which approaches that of those with a medical home.
It is logical to assume that lack of access to primary care results in the use of the
emergency department as a proxy for primary care for many of these children.
Practical Application of Association Rule Mining
The diverse characterizations of these groups suggest that effective efforts to
decrease potentially preventable emergency department utilization would differ
according to medical home status.
Children associated with a medical home have access to quality primary care
as well as emergency care. Initiatives which address the choice of the emergency
department for potentially preventable care when primary care resources are also
available are applicable to this group.
Children who have no personal doctor often lack access to primary care
outside of the emergency department as well as medical insurance or sufficient
income to make such care affordable. These children are more likely to use the
emergency department as a proxy for primary care or to allow health care problems to
deteriorate until emergency care is required. Efforts to encourage less potentially
preventable emergency department utilization for this group must address the
availability and accessibility of primary care services to those of limited resources
who lack insurance.

Preventable ED Utilization by Children
94
The concern regarding potentially preventable emergency department
utilization by children with a personal doctor but no medical home is of a different
nature. For these children, the issue is not the choice of emergency department care in
place of primary care, but rather the hesitancy to seek care at all. While these children
are least likely to make potentially preventable emergency department visits, they are
also least likely to receive attention to illness in a primary care setting. Actions aimed
at ensuring more appropriate health care utilization should address factors which
discourage utilization of preventative and primary care services provided by the
child’s personal doctor.

Preventable ED Utilization by Children
95
RESULTS
In Discovering Knowledge in Data, Larose (2005, p. 197-8) distinguishes
descriptive global models which summarize the relationship of the entire data set with
the target and local patterns which apply to limited subsets of the data. This study
analyzed the NSCH data from both a global and local perspective.
Globally, the most important factor in determining potentially preventable
emergency department utilization is the child’s level of wellness. Before attempting
to ascertain the likelihood that the emergency department will be chosen instead of
primary care when care is required, models first consider whether care will be
required. Evidence of illness in the referenced year in the form of immediate and non-
immediate sick care visits to a primary care provider or requests for medical advice
by phone are indicators of required care. Clusters formed by the k-means algorithm
which are distinguished by their association with level of wellness and health care
utilization also serve this purpose. For those who do require potentially preventable
care, age and insurance coverage influence the choice to seek such care in an
emergency department. Younger children and those with Medicaid insurance are
most likely to do so. Privately insured children are more likely to receive non-
immediate care in a primary care setting and seek care in the emergency department
for immediate concerns.
While the global model provides a broad understanding of potentially
preventable emergency department utilization, local patterns identify how factors
which apply to more limited populations can influence such utilization. These
patterns provide a more complete understanding of the target behavior and often

Preventable ED Utilization by Children
96
suggest methods of steering distinct groups of children with potentially preventable
conditions towards timely utilization of primary care rather than emergency services.
The following local patterns were identified by this study and quantified using the full
NSCH data set:
1. Children insured by Medicaid health plans are more than twice as
associated with potentially preventable emergency department utilization than
privately or uninsured children. This dramatic association exists regardless of general
health status, age or racial/ethnic classification.
2. Black children are 47% more associated with potentially preventable
emergency department visits than children of other races or ethnic backgrounds. This
pattern of behavior is independent of insurance status or income level which suggests
a cultural component in the decision as to where to seek medical attention for a child.
3. Privately or uninsured children from families with greater income are less
likely to make potentially preventable visits to emergency departments than those
with lesser family incomes. This pattern is particularly evident among children with
no health insurance. Uninsured children from upper income families are 42% less
associated with potentially preventable emergency department utilization than
uninsured lower or middle income children. Presumably these families can afford
primary care which is not covered by insurance.
4. Children who have required and received primary sick care but have no
access to a medical home have a 28% greater likelihood of seeking potentially
preventable emergency department care than their peers with a medical home.

Preventable ED Utilization by Children
97
5. Children with asthma are more than twice as likely to seek emergency
department care as those who are not associated with this condition. The association
with such care is most dramatic for children with asthma which is not well managed
as is indicated by a recent asthma attack.
6. School-age children who do not regularly exercise are 51% more likely to
make a potentially preventable visit to an emergency department than their peers who
do exercise. The NSCH data indicates that this pattern most pertains to children
between the ages of 10 and 12.
7. Children from more educated families are less associated with potentially
preventable emergency department visits. They are also more likely to have a
personal health care provider who usually or always provides necessary phone advice.
Furthermore, among all families who have access to consistently helpful medical
advice by phone, greater education is associated with a lesser likelihood that the child
will seek potentially preventable care in an emergency department. Children from
such families with post-high school education are 36% less likely to seek such care
than those from families with lesser educational attainment.
8. Children of single mothers are 36% more likely to be taken to an
emergency department with potentially preventable concerns than children of families
with any other caretaker structure. Single fathers are the least likely to seek such care
for their children. Children in the care of a single father are associated with
potentially preventable emergency department visits at a rate which is 45% less than
that of children with a single mother caregiver. This suggests a gender difference in
caregiver determination of appropriate action in response to a child’s medical need.

Preventable ED Utilization by Children
98
The hesitance of single fathers to seek potentially preventable care in an emergency
department however is influenced by the age of the child, applying most strongly to
children of school age.
9. Overweight school-age children are 45% more likely to use an emergency
department for potentially preventable care than their peers of lesser weight. For
these children, a regular exercise regimen does not decrease the likelihood of this
practice.
10. Children from non-English speaking households who require an
interpreter for effective communication between patient/caregiver and medical
personnel are generally more likely than their English-speaking peers to seek
potentially preventable care in a hospital emergency department. The degree to which
this pattern holds varies by state. In states with the most significant concentrations of
non-English speaking families, children from these families are less associated with
this type of emergency department utilization than similar children residing in states
with smaller non-English speaking populations. While many such children are
insured under Medicaid, this pattern is independent of insurance type. Logically,
bilingual primary care would be more available in areas with large concentrations of
non-English speaking patients. This finding suggests that the availability of
interpreters or bilingual medical personnel in primary care settings would decrease
the rate of utilization of hospital emergency departments for children from non-
English speaking families.
11. Children residing in rural areas which are far removed from hospitals
apparently make fewer potentially preventable emergency department visits. This

Preventable ED Utilization by Children
99
supports the logical assumption that the decision to seek potentially preventable care
in an emergency department is influenced by the geographic distance from residence
to the hospital. More information would be required to support or refute this
suggestion as this data does not include a specific measure of distance between
residence and nearest hospital for each referenced child.
12. Adolescents are the least likely age group to make a potentially
preventable emergency department visit. They make such visits at a rate which is
45% less than that of younger children. While adolescents are frequent visitors to the
emergency department, their visits are predominantly due to accidents, injuries or
poisonings.
13. Uninsured children are most likely to rely exclusively on the emergency
department for care, doing so at a rate which is 53% greater than that of Medicaid
insured children and 68% greater than that of privately insured children.
14. Hispanic children are least likely to be insured or associated with a
medical home. They are three times as likely as children of other racial/ethnic
categories to be uninsured and twice as likely to lack association with a medical
home.
Finally, this study clarified the effect of consistent access to adequate primary
care on potentially preventable emergency department utilization. Health care
utilization patterns were compared by medical home classification providing insight
into how and why each group utilizes the emergency department as part of the
delivery of treatment potentially available in a primary care setting. Children with
access to a quality medical home require and use the most health care resources and

Preventable ED Utilization by Children
100
are most likely to make a potentially preventable emergency department visit.
Caregivers of these children, sometimes with the direction of a primary care
professional, choose the emergency department for care in place of available primary
care. Children who are not associated with a medical home are more likely to utilize
the emergency department for potentially preventable care due to lack of available or
accessible primary care. Children without a personal doctor are most likely to seek
such care in an emergency department. Many lack access to primary care and use the
emergency department in its place. Those who do have a personal doctor but do not
receive the standard of care required of a medical home are least likely to seek
potentially preventable emergency care or any other care. For these children, the
choice is not where to seek care, but whether to seek care. Differences in health care
utilization for these diverse groups suggest that effort to direct children away from the
emergency department and towards primary care for potentially preventable problems
would optimally consider access to a medical home and be tailored accordingly.
Preventable ED Utilization by Children
101
DISCUSSION
This study showed that patterns of potentially preventable emergency
department utilization are relatively consistent nationally. With a few noted
exceptions, state by state analysis demonstrated that most of the studied factors had a
consistent effect on potentially preventable emergency department utilization.
Differences in rules generated by state patterns were most often attributable to
different local concentrations of the subpopulations of focus not differences in
behavior associated with the attributes which define them.
Some of the patterns noted by this study merely confirm previous research and
observational experience in emergency departments across the country. That sick
children, infants, or those covered by Medicaid are more likely to visit an emergency
department for potentially preventable care has been widely noted by those who
provide and study such care. However, others illustrate less obvious and more
actionable influences on the target behavior. Some discerned patterns provide
insightful clarification of the effect of previously studied factors such as age, access
to care, and caregiver structure. Others provide information as to the effect of factors
not evident in previous research including the influence of regular exercise or weight.
Data mining analysis allowed the discernment of multivariate influences on
potentially preventable emergency department utilization leading to a more
sophisticated understanding of how factors interact to affect potentially preventable
emergency department utilization.
This study devised a method of utilizing NSCH data to classify each child
according to access to quality primary care in the form of a medical home. It was

Preventable ED Utilization by Children
102
determined that the degree of association with a medical home significantly
influences health care utilization patterns suggesting that efforts to address
motivations for seeking potentially preventable emergency department care should
consider this indicator of access to quality primary care.
Limitations of Study
As with any study, there are certain limitations which should be noted. First,
the National Survey of Children’s Health data was collected by interviewing a parent
or caregiver of each focal child. Accuracy of the information provided is contingent
upon the respondent’s accurate memory and correct reporting. As such some
inaccuracies are to be expected.
Secondly, the design of this study differentiates as potentially preventable all
emergency department visits which were not the result of accident, injury or
poisoning. This criterion for classification is a reasonably but not absolutely accurate
distinguisher of conditions preventable by primary care. There are uncommon
emergent conditions not the result of accidents, injuries, or poisonings which are
arguably not preventable with earlier intervention. There are also individual cases
where a primary care professional is consulted in a timely manner and the child’s
condition nevertheless deteriorates necessitating emergency care. Since the
designation as potentially preventable is based upon category of complaint rather than
a medical diagnosis by individual case, it is likely that some records will be classified
differently than they might be by individual medical review. Nevertheless, given the
volume of data, it’s reasonable to assume that identification of patterns will not be
Preventable ED Utilization by Children
103
seriously hampered by the possible misclassification of a relatively small number of
records.
Finally, as is common in data mining applications, the data being analyzed
was collected for some other purpose rather than specifically for this project. Hence,
the analyst is restricted to utilization of available and derivable variables.

Preventable ED Utilization by Children
104
REFERENCES
Alessandrini, E., Shaw, K., Bilker, W., Perry, K., Baker, D., & Schwarz, D. (2001).
Effects of Medicaid managed care on health care use: infant emergency
department and ambulatory services. Pediatrics, 108, 103-110.
Alpert, J., Robertson, L., Kosa, J., Heagarty, M., & Haggerty, R. (1976). Delivery of
health care for children: report of an experiment. Pediatrics, 57, 917-930.
American Academy of Pediatrics. (1999). Recommendations for Preventative
Pediatric Health Care (RE9535). Retrieved September 14, 2006, from
American Academy of Pediatrics website. [link]
American Academy of Pediatrics (2003) Mapping Health Care Delivery for
America’s Children. Retrieved November 15, 2006, from American Academy
of Pediatrics website. [link]
American Academy of Pediatrics. (n.d.). Children’s Health Topics: MEDICAL
HOME. Retrieved October 30, 2006, from American Academy of Pediatrics
website. [link]
Agrawal, R., Srikant, R. (1994). Fast algorithms for mining association rules in large
databases. In J. Bocca, M. Jarke, and C. Zanieolo (Eds.), Proceedings of the
International Conference on Very Large Data Bases, Santiago, Chile. San
Francisco: Morgan Kaufmann, pp. 478-499.
Bethell, C., Read, D., & Brockwood, K. (2004, May). Using existing population-
based data sets to measure the American Academy of Pediatrics definition of
medical home for all children and children with special health care needs.
Pediatrics, 113(5), 1529-1537.

Preventable ED Utilization by Children
105
Breiman, L., Friedman, J., Olshen, R., Stone, C. (1984). Classification and
Regression Trees. Boca Raton, FL: Chapman & Hall/CRC Press.
Christakis, D., Wright, J., Koepsell, T., Emerson, S., & Connell, F. (1999). Is greater
continuity of care associated with less emergency department utilization?
Pediatrics, 103(4), 738-742.
Cunningham, P., Clancy, C., Cohen, J., & Wilets, M. (1995). The use of hospital
emergency departments for nonurgent health problems: a national perspective.
Medical Care Research and Review, 52(4), 453-474.
Dombkowski, K., Stanley, R., & Clark, S. (2004). Influence of Medicaid managed
care enrollment on emergency department utilization by children. Archives of
Pediatrics & Adolescent Medicine, 158, 17-21. [link]
Doobinin, K., Heidt-Davis, P., Gross, T., & Isaacman, D. (2003). Nonurgent pediatric
emergency department visits: care-seeking behavior and parental knowledge
of insurance. Pediatric Emergency Care, 19(1), 10-14.
Fredrickson, D., Molgaard, C., Dismuke, S., Schukman, J., & Walling, A. (2004).
Understanding frequent emergency room use by Medicaid-insured children
with asthma: a combined quantitative and qualitative study. Journal of the
American Board of Family Practice, 17, 96-100. [link]
Gill, J., Mainous, A., & Nsereko, M. (2000). The effect of continuity of care on
emergency department use. Archives of Family Medicine, 9, 333-339.

Preventable ED Utilization by Children
106
Health Resources and Services Administration Maternal and Child Health Bureau and
Centers for Disease control and Prevention National Center for Health
Statistics. (n.d.). National Survey of Children’s Health, 2003 State and Local
Area Integrated Telephone Survey. Retrieved August 25, 2006, from Centers
for Disease Control and Prevention website. [link]
Institute of Medicine of the National Academy of Sciences. (2006, June). Emergency
care for children: growing pains. In The future of emergency care in the
United States health system. Washington, DC: National Academies Press.
[link]
Johnson, W., & Rimsza, M. (2004). The effects of access to pediatric care and
insurance coverage on emergency department utilization. Pediatrics, 113(3),
483-487. [link]
Kotagal, U., Schoettker, P., Atherton, H., Hormung, R., Bush, D, Pomerantz, W., &
Schubert, C. (2002). Relationship between early primary care and emergency
department use in early infancy by the Medicaid Population. Archives of
Pediatrics & Adolescent Medicine, 156, 710-716.
Larose, D. (2005). Discovering Knowledge in Data: An Introduction to Data Mining.
Hoboken, New Jersey: John Wiley and Sons.
Luo, X., Liu, G., Frush, K., & Hey, L. (2003). Children’s health insurance status and
emergency department utilization in the United States. Pediatrics, 112(2),
314-319. [link]

Preventable ED Utilization by Children
107
McCraig, L., & Burt, C. (2005, May 26). National hospital ambulatory medical care
survey: 2003 emergency department summary (Advance Data from Vital and
Health Statistics Number 358). Hyattsville, MD: U.S. Department of Health
and Human Services Centers for Disease Control and Prevention National
Center for Health Statistics. [link]
National Survey of Children’s Health, 2003 [Data file]. Hyattsville, MD: Health
Resources and Services Administration Maternal and Child Health Bureau
and Centers for Disease control and Prevention National Center for Health
Statistics. [link]
Newcomb, Patricia. (2005). Predicting choice of health services for publicly insured
children with non-urgent illnesses. Southern Online Journal of Nursing
Research, 6(3). Retrieved September 26, 2006, from Southern Nursing
Research Society website. [link]
Phelps, K., Taylor, C., Kimmel, S., Nagel, R., Klein, W., & Puczynski, S. (2000).
Factors associated with emergency department utilization for nonurgent
pediatric problems. Archives of Family Medicine, 9, 1086-1092. [link]
Piehl, M., Clemens, C., Jones, J. (2000). “Narrowing the gap” Decreasing emergency
department use by children enrolled in the Medicaid program by improving
access to primary care. Archives of Pediatrics and Adolescent Medicine,
154(8), 791-795.

Preventable ED Utilization by Children
108
Pollack, H., Dombkowski, K., Zimmerman, J., Davis, M., Cowan, A., Wheeler, J.,
Hillemeier, A., & Freed, G. (2004, June). Emergency department use among
Michigan children with special health care needs: an introductory study.
Health Services Research. Retrieved September 20, 2006, from the
LookSmart® FindArticles database. [link]
Quinlan, R. (1993). C4.5: Programs for Machine Learning. San Mateo, CA: Morgan
Kaufmann Publishers.
Ryan, S., Riley, A., Kang, M. & Starfield, B. (2001). The effects of regular source of
care and health need on medical care use among rural adolescents. Archives of
Pediatrics & Adolescent Medicine, 155, 184-190.
SPSS Incorporated. (2005). Clementine® 10.0 Users Guide. Chicago: SPSS Inc.
State Health Statistics (n.d.). Retrieved November 30, 2006, from State Health
Statistics website. [link]
United States Census Bureau. (n.d.). Census Regions and Divisions of the United
States. Retrieved September 2, 2006, from United States Census Bureau
website. [link]
United States Census Bureau (n.d. ). State and County QuickFacts. Retrieved
November 15, 2006, from United States Census Bureau website. [link]
U.S. Department of Health and Human Services Centers for Disease Control and
Prevention National Center for Health Statistics. (2006). Design and
Operation of the National Survey of Children’s Health, 2003 (Vital and
Health Statistics, Series 1, Number 43). Washington, DC: U.S. Government
Printing Office. [link]

Preventable ED Utilization by Children
109
U.S. Department of Health and Human Services Centers for Disease Control and
Prevention National Center for Health Statistics. (2006, February). Summary
Health Statistics for U.S. Children: National Health Interview Survey, 2004
(Vital and Health Statistics, Series 10, Number 227). Washington, DC: U.S.
Government Printing Office. [link]
Walls, C., Rhodes, K., & Kennedy, J. (2002). The emergency department as usual
source of medical care: estimates from the 1998 National Health Interview
Survey. Academic Emergency Medicine 9(11), 1140-1145.
Weinick, R., Billings, J., & Burstin, H. (2002, January). What is the role of primary
care in emergency department overcrowding? Publications of the Council on
Health Care Economics and Policy. Retrieved September 20, 2006, from The
Council on Healthcare Economics and Policy website. [link]
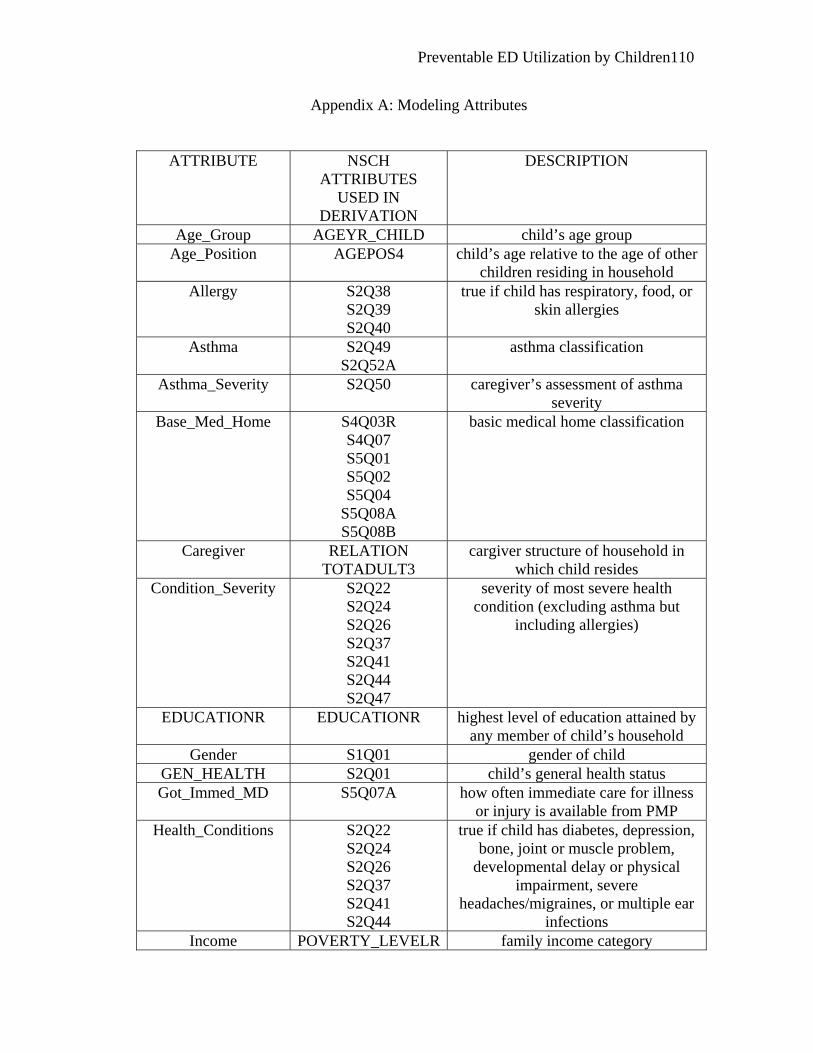
Preventable ED Utilization by Children
110
Appendix A: Modeling Attributes
ATTRIBUTE NSCH ATTRIBUTES
USED IN DERIVATION
DESCRIPTION
Age_Group AGEYR_CHILD child’s age group Age_Position AGEPOS4 child’s age relative to the age of other
children residing in household Allergy S2Q38
S2Q39 S2Q40
true if child has respiratory, food, or skin allergies
Asthma S2Q49 S2Q52A
asthma classification
Asthma_Severity S2Q50 caregiver’s assessment of asthma severity
Base_Med_Home S4Q03R S4Q07 S5Q01 S5Q02 S5Q04
S5Q08A S5Q08B
basic medical home classification
Caregiver RELATION TOTADULT3
cargiver structure of household in which child resides
Condition_Severity S2Q22 S2Q24 S2Q26 S2Q37 S2Q41 S2Q44 S2Q47
severity of most severe health condition (excluding asthma but
including allergies)
EDUCATIONR EDUCATIONR highest level of education attained by any member of child’s household
Gender S1Q01 gender of child GEN_HEALTH S2Q01 child’s general health status Got_Immed_MD S5Q07A how often immediate care for illness
or injury is available from PMP Health_Conditions S2Q22
S2Q24 S2Q26 S2Q37 S2Q41 S2Q44
true if child has diabetes, depression, bone, joint or muscle problem,
developmental delay or physical impairment, severe
headaches/migraines, or multiple ear infections
Income POVERTY_LEVELR family income category

Preventable ED Utilization by Children
111
Insurance S3Q01 S3Q02
type/existence of medical insurance coverage
MD_Phone_Help S5Q06A how often phone advice is available from personal medical professional
(PMP) Multiple Allergies S2Q38
S2Q39 S2Q40
true if child has multiple allergic conditions
NEED_INTERP NEED_INTERP true if child/caregiver requires an interpreter to communicate with
medical personnel No_Exercise S7Q21 true if school-age child engages in no
regular, vigorous exercise NonUS_Mom RELATION
S11Q03 S11Q04
true if primary caregiver is not a United States native
Obesity BMICLASS true when child is above the 95th percentile of BMI-for-age
PPA_Visits S4Q04A S4Q04R S4Q05R
Target: true if at least one potentially preventable ED visit
PREV_CARE AGEYR_CHILD S4Q03R S5Q01
S5Q08A S5Q08B
true if child receives all preventative care recommended by the American
Academy of Pediatrics
Race RACER Hispanic
race/ethnicity of child
Region STATE US Census Bureau Region Residence MSA_STAT
STATE urban/rural character of residence
Sick_Care S4Q06R number of visits to a health care professional outside of a hospital for
sick care Sick_Days S7Q02R number of days off school due to
illness SCare_PMD_Access S5Q10B true if PMP helps get specialized
equipment or care when needed SCare_PMD_Explain S5Q10C how often does PMP explain about
neede equipment or care Smoker S9Q11B true if any member of child’s
household smokes Spec_PMD_Access S5Q09B true if PMP helps patient get
specialist when needed Spec_PMD_Explain S5Q09C how often did PMP explain purpose
and process of specialist care

Preventable ED Utilization by Children
112
State STATE U.S. state of residence State Division STATE US Census Bureau State Division
State_Hosp_Density See Appendix C number of hospitals per square mile in state of residence
State_PMD_Density See Appendix C number of children per clinically active pediatrician in state of
residence

Preventable ED Utilization by Children
113
Appendix B: Percent of Children Associated with Potentially Preventable/Avoidable Emergency Department Visits by State
# STATE # PPA # RECORDS % PPA 1 VT 137 1894 7.23 2 UT 122 1475 8.27 3 CT 205 2129 9.62 4 NE 180 1863 9.66 5 CO 181 1846 9.80 6 HI 198 2006 9.87 7 NH 189 1914 9.87 8 ND 194 1947 9.96 9 PA 219 2185 10.02 10 KS 188 1837 10.23 11 NV 211 2041 10.34 12 MD 219 2114 10.36 13 MT 201 1932 10.40 14 VA 226 2164 10.44 15 CA 233 2195 10.62 16 WA 204 1920 10.63 17 SD 198 1859 10.65 18 OR 210 1954 10.75 19 MN 200 1852 10.80 20 WI 212 1955 10.84 21 IN 203 1859 10.92 22 NY 220 2003 10.98 23 IA 214 1941 11.03 24 ID 2.05 1848 11.09 25 MO 247 2205 11.20 26 NC 234 2061 11.35 27 NJ 238 2086 11.41 28 IL 245 2139 11.45 29 AK 219 1882 11.64 30 OH 264 2225 11.87 31 WY 226 1875 12.05 32 DE 258 2137 12.07 33 TN 232 1909 12.15 34 FL 258 2097 12.30 35 OK 237 1925 12.31 36 TX 265 2144 12.36 37 SC 268 2143 12.51 38 AL 270 2152 12.55 39 NM 230 18.30 12.57 40 AR 235 1868 12.58 41 MA 266 2101 12.66

Preventable ED Utilization by Children
114
42 GA 245 1842 13.30 43 MI 291 2173 13.39 44 AZ 258 1897 13.60 45 ME 260 1910 13.61 46 RI 279 2002 13.94 47 KY 275 1945 14.14 48 DC 289 2027 14.26 49 LA 324 2235 14.50 50 WV 310 2012 15.41 51 MS 325 2018 16.11

Preventable ED Utilization by Children
115
Appendix C: Sources and Derivation of State Characteristic Attributes
Number of Clinically Active Pediatricians
The American Academy of Pediatrics in collaboration with the Dartmouth
Medical School Center for Evaluative Medical Sciences developed a Web-based
database providing access to information concerning health care delivery to children
on a national, state, and Primary Care Service Area (PCSA) level. This database
provided the number of children per clinically active pediatrician for each state (AAP,
2003).
Hospitals per Square Mile
The number of hospitals in each state that participate in Medicare hospital
insurance program was obtained from the State Health Statistics website. Given the
great diversity in the size of states, a fair comparison of hospital availability requires
consideration of the geographic area served by each hospital. Hence, the number of
square miles in each state was obtained from the United States Census Bureau State
and County QuickFacts website and an approximation of the service area of the
hospital was then calculated by determining the number of hospitals per thousand
square miles in the state.
Poverty Level, Education
The State Health Statistics website provided the percentages of state
populations living below the federally determined poverty level as well as the
percentage who achieved high school and college degrees.

Preventable ED Utilization by Children
116
Race
The percentage of state population (per 2000 census figures) identified as
black persons was obtained from the United States Census Bureau State and County
QuickFacts website.

Preventable ED Utilization by Children
117
BIOGRAPHICAL STATEMENT
Kathleen Alber holds a Bachelor’s of Science degree in Mathematics from Sacred
Heart University as well as a Master’s of Engineering in Biomedical Engineering
from the University of Virginia at Charlottesville. She has been employed as a
software engineer and systems programmer by the International Business Machines
Corporation and served as a database consultant for the Catholic Diocese of
Bridgeport. In recent years, her primary focus has been parenting her four daughters.


