IDENTIFYING OPPORTUNITIES - AnnualReports.com · IdentIfyIng OppOrtunities ... housewares products...
87
IDENTIFYING OPPORTUNITIES Lifetime Brands Annual Report 2011
Transcript of IDENTIFYING OPPORTUNITIES - AnnualReports.com · IdentIfyIng OppOrtunities ... housewares products...

I D E N T I F Y I N G O P P O R T U N I T I E S
Lifetime Brands Annual Report 2011

lifetime Brands, inc.1000 stewart avenue, garden city, new York 11530

Year Ended December 31, (in thousands, except per share data)
2008 2009 2010 2011
NEt SalES $487,935 $415,040 $443,171 $444,417
NEt iNcomE (loSS) ($47,755) $2,715 $20,261 $14,066
DilutED iNcomE (loSS) pEr commoN SharE ($3.99) $0.22 $1.64 $1.12
DEBt $157,164 $95,128 $77,657 $97,625
Financial HigHligHts
NEt SalES IN MILLIONS
NEt iNcomE (loSS) IN MILLIONS
DilutED iNcomE (loSS) PER COMMON SHARE
DEBt IN MILLIONS
50
100
150
200
0.5
1.0
1.5
2.0
2.5
3.0
3.5
4.0
10
20
30
40
50
0
100000
200000
300000
400000
500000
$1.12$14
$444
$98
2008 2009 2010 2011 2008 2009 2010 2011 2008 2009 2010 2011 2008 2009 2010 2011
JEffrEY SiEgElChairman of the Board of DirectorsChief Executive Officer and President
roNalD ShiftaNVice Chairman of the Board of DirectorsChief Operating Officer
DaNiEl SiEgElExecutive Vice President
craig phillipS Senior Vice President – Distributionand Director
laurENcE WiNoKErSenior Vice President – FinanceTreasurer and Chief Financial Officer
Sara ShiNDElGeneral Counsel and Secretary
DaViD E. r. DaNgoorDirector
michaEl JEarYDirector
JohN KoEgElDirector
chErriE NaNNiNgaDirector
William u. WEStErfiElDDirector
corporate inFormation
corporatE couNSElSamuel B. Fortenbaugh IIINew York, NY 10111
iNDEpENDENt rEgiStErED puBlic accouNtiNg firmErnst & Young LLPJericho, NY 11753
traNSfEr agENt & rEgiStrarComputershare480 Washington BoulevardJersey City, NJ 07310
aNNual mEEtiNgThe Annual Meeting of Shareholders willbe held at 10:30 a.m. on Thursday, June 13, 2012,at the Corporate Headquarters.
corporatE hEaDQuartErS1000 Stewart AvenueGarden City, NY 11530(516) 683-6000
oFFicers and directors oFFices

IdentIfyIng OppOrtunities
Lifetime Brands, Inc. | 2011 Annual Report 1
We are one of the world’s
leading designers, developers,
and marketers of a broad
range of nationally branded
consumer products used in the
home. Our categories include
Kitchenware, Cutlery, Cutting
Boards, Bakeware, Cookware,
Dinnerware, Flatware,
Glassware, Pantryware, Spices
and Home Décor.
We are committed to delivering
five-star experiences to the
earth’s consumers through
innovative products, services
and solutions for the home.
In return, they reward us
with increased market share
and profitability, allowing our
associates, stakeholders and
shareholders to prosper.
Lifetime Brands, Inc.
Mission Statement

IdentIfyIng OppOrtunities
Dear Fellow Shareholders
In our Kitchenware categories, we recorded sales growth of 3.5%, all of which was organic, while our tabletop categories achieved actual sales growth of 14.5%, with 9.1% organic growth. these gains were accomplished in spite of weak consumer demand, reflecting the critical importance of our commitment to innovation and our successful effort to gain market share.
internatiOnal expansiOn five years ago, recognizing that the U.S. market for housewares products was mature, we embarked on a journey to transform our company into a global enterprise.
Lifetime’s initial step was to purchase a 30% equity interest in grupo Vasconia SAB, Mexico’s largest housewares company. the following year, we joined with Accent-fairchild group, Inc. to form Lifetime Brands Canada.In the few years since we made our initial investments, both grupo Vasconia and Lifetime Brands Canada have seen rapid growth, largely due to their access to Lifetime’s brands, product design groups and Asia sourcing infrastructure.In fact, both had record years in sales and profits in 2011.
We further broadened our geographic reach in 2011 by making investments in Brazil and China. these are two large and rapidly growing markets where consumer classes are expanding and enthusiastic about acquiring household goods with leading brands that were previously out of their reach.
Brazil In Brazil, we acquired a 40% equity interest in gS Internacional S/A, a leading wholesale distributor of branded housewares products. gSI markets dinnerware, glassware, home décor, kitchenware and barware to more than 7,000 customers, including major department stores, housewares retailers and independent shops. By combining gSI’s experience and market knowledge with access to Lifetime’s product lines, brands and sourcing, we expect gSI to emerge as a preeminent housewares company in the Mercosur Area, which encompasses Argentina, Brazil, Paraguay and Uruguay.
China In China, we established a joint venture to market Mikasa® dinnerware, glassware and giftware products. China’s rapidly growing middle class – which within a few years could equal the total population of the
US – is clearly the right place for us to establish our key brand, as the Mikasa® style of contemporary patterns and designs, which has proven very successful in the United States, also matches the shopping preferences of young, urban, middle-income Chinese families. King’s flair (group) development Company, Ltd., our joint venture partner and a company Lifetime has done business with for more than 25 years, has a solid infrastructure that is highly experienced in distributing better brands to the Chinese market.
to further accelerate our international growth, we also acquired Creative tops Holdings Limited, a leading provider of tableware and kitchenware products in the UK and its Hong Kong-based sourcing affiliate, Creative tops far east Limited. Our goal is to use Creative tops as a base for building a powerful housewares company in the UK, as well as a platform for expanding our tabletop businesses throughout europe. additiOnal internatiOnal Venturesearly in 2011, we formed Housewares Corporation of Asia Limited, a Hong Kong-based joint venture that supplies direct import kitchenware programs to retailers in north, Central and South America. Our partners in this venture are Accent-fairchild group, grupo Vasconia and fackelmann gmbH & Co., a german company with ownership interests in a number of Chinese factories. Our goal is to use HCA to offer retailers in the US that want to develop proprietary kitchenware programs sourced directly from Asia, access to well-established product design resources, factories and sourcing networks. Between our own company and the companies in which we have made a significant investment, we now have the infrastructure to reach customers on four continents. We expect a very significant part of our future sales and profits will come from outside of the United States.
new Brand initiatiVesIn the past, I have written that Lifetime’s success is based on its brands, its commitment to innovation and its sourcing capabilities. As we grow internationally, we need to rely on brands that we own and that we can use on a wide range of products globally. and that are portable - brands that we can use globally.
I am proud of Lifetime’s achievements in 2011.Our core U.S. wholesale businesses, Kitchenware and Tabletop, which account for approximately 80% of the Company’s revenue, performed well in 2011.
Lifetime Brands, Inc. | 2011 Annual Report1

IdentIfyIng OppOrtunities
Lifetime Brands, Inc. | 2011 Annual Report 2
to complement our company-owned Mikasa® brand, we have developed two new and very exciting brand concepts:
saVOra™ Savora™ is a new brand of high-end kitchen products we believe set a new standard in kitchenware. Our designers drew inspiration from every corner of modern lifestyles, including fashion, cosmetics and even luxury vehicles, to create Savora’s form and color palette. the result is a high-end line of kitchen tools as functional as they are beautiful. Savora™ products were first shown at the International Home + Housewares Show in March 2012 and will be available at selected retailers later this year.
KizmOs™ Kizmos™ is a line of whimsical kitchenware that
incorporates elements of personality, color and fun to everyday items. their distinctive bright colors and fun shapes are intended to add delight to any kitchen. the playful personality of each item appeals to the fun nature of cooking itself and every item in the collection cheerfully makes cooking and entertaining enjoyable for the whole family.
Creating lOng-term sharehOlder Value Lifetime’s Board of directors is committed to enhancing shareholder value through growth in revenues, net income and diluted earnings per share. Lifetime’s strategy for achieving these objectives is to introduce new products, to increase its penetration of existing distribution channels, to pursue strategic acquisitions in the United States and to expand internationally while maintaining a healthy financial position.
I hope you share our excitement and optimism about the future.
Jeffrey SiegelChairman of the Board, President and Chief executive Officer
Jeffrey SiegelChairman of the Board, President and Chief Executive Officer

IdentIfyIng OppOrtunities
Identifying Opportunities
to further accelerate growth outside of the U.S., Lifetime Brands acquired Creative tops group, a leading UK-based supplier of private label and branded tableware and kitchenware products. Creative tops supplies major supermarket groups, major department stores, housewares retailers and independent retailers throughout the UK. the company also has a growing customer base outside the UK, accounting for approximately 13% of its revenue. Additionally, their sourcing office in Hong Kong represents a significant complement to Lifetime Brands’ existing operations.
Lifetime Brands also expanded into South America by acquiring 40% of the equity capital of gS International S/A, a distributor of branded housewares products in Brazil. to position gSI for further profitable growth, Lifetime Brands plans to utilize the same strategies that have helped grupo Vasconia and Lifetime Brands Canada succeed:
+ We will give each of them access to Lifetime’s global sourcing infrastructure, brands and product design groups
+ We will expand and diversify each of them into new product categories
+ We will support sales and marketing efforts and related brand segmentation towards new customer channels
+ We will give each of them access to Lifetime Brands’ established B2B and B2C internet infrastructure
In the last five years, Lifetime Brands has become a truly global company. the market size of the housewares industry outside of the U.S. is estimated to be greater than $200 billion, compared to an estimate of $65 billion in the U.S. We started our international expansion with our investment in Vasconia, followed by the formation of Lifetime Brands Canada. In 2011 we accelerated the effort to tap into this revenue stream by forming Housewares Corporation of Asia Limited and embarking on a joint venture to introduce Mikasa® products in China.
Lifetime Brands has entered into a licensing agreement with internationally recognized food network® star and culinary icon guy fieri. this agreement positions guy to explode onto the kitchenware scene by having Lifetime Brands design, manufacture and market a sizzling new collection
of cookware, kitchen tools, gadgets and cutting boards. guy plugs his electrifying personality into each piece, fusing his creativity and signature style with quality and performance. His outrageous culinary passion is evident in every detail of the collection and his exciting personal touches deliver the celebrity experience to at-home chefs across America.
guy made a point of reflecting his celebrity persona and culinary rock-star status in the line. He channeled his trademark energy and enthusiasm into adding design details into each piece, creating a collection that is unique on the kitchenware landscape.
Celebrity chefs perform extremely well at retail and guy’s status as a culinary icon, author and television personality enhances his visibility across all media channels. He is the host of three of food network’s top-rated shows, a three-time New York Times bestselling cookbook author and host of nBC’s Minute to Win It.
Lifetime Brands is constantly exploring opportunities to increase our presence in the marketplace. In 2011, we capitalized on three such opportunities, including expanding our overseas operations, acquiring new companies, and partnering with an established culinary icon.
Lifetime Brands, Inc. | 2011 Annual Report3

IdentIfyIng OppOrtunities
Lifetime Brands, Inc. | 2011 Annual Report 4
UNITED STATES
MEXICO
BRAZIL
UK & EUROPE
CHINA
CANADA
+ united states Lifetime Brands, Inc.
+ Brazil GS International
+ Canada Lifetime Brands Canada
+ uK & eurOpe Creative Tops
+ mexiCO Vasconia
+ ChinaHousewares Corporation of Asia Limited & Mikasa Joint Venture
Global Presence

IdentIfyIng OppOrtunities
Innovation
that’s why we’ve developed and actively pursue an Open Innovation policy. We’re proud to have embraced external innovation by growing and fostering a robust inventor network. through these channels, we’ve brought numerous products from outside inventors to market. Our involvement with our independent inventor network is a valuable source of new perspectives, ideas and solutions and is a great addition to our internal staff.
Our in-house product design and development department of over 100 professionals is an additional resource for developing innovative products. they utilize forward-thinking concepts and advanced materials to produce innovative kitchenware items.
In 2011, this team was responsible for creating a sleek and sophisticated line of new kitchen gadgets called Savora™. Set to launch in the second half of 2012, Savora™ is a bold and dramatic entry into the realm of high-end consumer goods. each product in the line is intended to be displayed and admired for its artful, advanced design. Our designers drew inspiration from every corner of modern lifestyles, including fashion, cosmetics and even luxury vehicles, to create Savora’s form and color palette. the result is a high-end line of kitchen tools as functional as they are beautiful.
In cutlery, we are proud to be the leader in break-resistant ceramic technology. Our newest line of ceramic knives features a striking new black color, while still delivering the same chip-resistant technology on the sharpest cutting edge available today.
Our Kizmos™ line incorporates elements of personality, color and fun to everyday items. their distinctive bright colors and fun shapes are intended to add delight to any kitchen. the playful personality of each item appeals to the fun nature of cooking itself and every item in the collection cheerfully makes cooking and entertaining enjoyable for the whole family.
We also recently introduced two new and innovative products to market: the trap-door Colander and Mag-Lid™
containers. the trap-door Colander presents an extremely useful innovation to the long-standing design of the colander: dispensing doors on the bottom. this one-of-a-kind feature makes emptying food into a bowl easier than ever before. It allows you to simply lift levers under the handles and have the food drop into a bowl without upending the colander.
the Mag-Lid™ containers feature revolutionary technology that uses magnetic force to automatically turn lids closed for you. All you have to do is place the lid on the body of the container and the magnets take over, rotating the lid until it closes. In other words, the lid closes itself. this technology is especially helpful for anyone who has conditions affecting their grip, such as seniors with arthritis. It literally takes the job out of your hands.
We’ve also expanded our food storage category by offering consumers our innovative Perfect Seal™ collection. Made from eastman tritan™ copolyester – a virtually unbreakable material that resists odors and stains – Perfect Seal food storage features a patent-pending lid locking system that is easy to open and close. A dial on the lid is turned to lock the lid in place, creating a perfect seal.
Lifetime Brands also embraces innovation by utilizing new and emerging technologies in business. We are at the forefront of Quick Response – or QR – codes on packaging and other promotional materials. these small square bar codes provide additional information when scanned by smartphones. On packaging, our QR codes link to informative product videos.
We also relate to consumers through social media channels. We are connected to our consumers on facebook, providing us a platform to engage in dialogue with our fans. Our Mikasa®, Pfaltzgraff and Kizmos™ facebook pages are forums for product information and fun user-generated content, giving our consumers a direct channel to communicate and interact with us.
We also keep our consumers informed through the use of twitter. We send out – or “tweet” – promotional messages, topical tabletop advice and tips about our products to keep consumers connected with trends.
Lifetime Brands is also an active member on Pinterest, an online pinboard where users post and share photos. We actively seek out home décor and tabletop photos and even repost some on our Mikasa® facebook page for users to comment on them. In the realm of social media, this helps establish Mikasa® as an expert in entertaining.
Lifetime Brands believes a great idea can come from anywhere. We’re open to receiving inspiration not only from our internal resources, but from our external sources as well.
Lifetime Brands, Inc. | 2011 Annual Report5

IdentIfyIng OppOrtunities
Lifetime Brands, Inc. | 2011 Annual Report 6
R40
166
55.07
48.39
64
113.75
108.95
53.99
SET TO LAUNCH IN THE SECOND HALF OF 2012, SAVORA™ IS A BOLD AND DRAMATIC ENTRY INTO THE REALM OF HIGH-END CONSUMER GOODS. EXTENSIVE RESEARCH WAS CONDUCTED TO DETERMINE THE IDEAL FUNCTIONALITY FOR EACH ITEM.
Savora Rotary Grater
ANDBEYOND2012

IdentIfyIng OppOrtunities
share & Create demandIn today’s information age, consumers’ post-purchase feedback and online product ratings and reviews have become increasingly important. two-thirds of the economy is infl uenced by personal recommendations. When consumers share positive feedback about our products, it helps create demand for them.
retail partnersLifetime Brands is also committed to providing our retail partners with superlative service through every step of the ordering process. from placing to receiving an order, our goal is to ensure every retailer has a 5-Star experience.
that means providing a smooth and easy order process, maintaining in-stock levels and quick shipment and delivery for each order placed. With Lifetime Brands, each retailer will fi nd a large assortment of products at every price point to fi t its needs and have their orders arrive quickly and effi ciently.
Creating a 5-Star Experience
Lifetime Brands is committed to providing consumers with superlative service through every step of the purchase process. from pre-purchase research to post-purchase feedback, our goal is to ensure every consumer has a 5-Star experience.
We have studied how consumers go about buying a product and are being proactive in the process to enhance their experience. the overwhelming majority of today’s consumers go through 4 distinct actions when buying a product: Search, Study, Select and Share. In turn, these actions produce 4 distinct results: find, decide, experience and Create demand.
these actions and results combine to produce a cyclical buying pattern that the 5-Star experience affects at every turn.
searCh & Findthe cycle begins when consumers search for a product to buy. to ensure our products show up in their search, we have partnered with the best retailers in America to put as many of our products as possible on their Internet sites. We provide rich multimedia content and populate our product descriptions with search engine optimized – or SeO – copy so our products are displayed high up in search results.
studY & deCideIn today’s Internet-driven society, 70% of purchases are researched online before they’re bought1. We strive to have our products stand out among the competition with glowing, 5-star reviews. Additionally, our descriptive and compelling product copy entices consumers to buy. Research has shown consumers are 85% more likely to make a purchase after watching a video2; therefore, our informative videos engage, entertain and sell to the consumer. Our packaging is also designed to sell our products. We make them easy to understand, explaining the product perfectly.
seleCt & experienCeAfter the consumer selects a product to purchase, we want the experience to follow them home and exceed their expectations. We achieve this by delivering quality packaging that is attractive and also providing the consumer with extra features like recipes, décor tips and even alternative uses for the product. We include instructions that are easy to read and understand and even anticipate frequently asked questions – or fAQ – and answer them in advance.
At Lifetime Brands, we recognize the importance of the role the consumer plays in our continued success. We believe a thorough understanding of our consumers’ buying habits is vital to our company’s growth.
STUDY & DECIDE
SELECT & EXPERIENCE
SHARE & CREATE DEMAND
SEARCH & FIND
1 google Clickstream White Paper, 20112 Internet Retailer, April 2010
Lifetime Brands, Inc. | 2011 Annual Report7

IdentIfyIng OppOrtunities
Lifetime Brands, Inc. | 2011 Annual Report 8
OF PURCHASES ARE RESEARCHED ONLINE BEFORE THEY’RE BOUGHT.
70%

IdentIfyIng OppOrtunities
this page purposely left blank

UNITED STATES SECURITIES AND EXCHANGE COMMISSION
Washington, D.C. 20549
FORM 10-K
X ANNUAL REPORT PURSUANT TO SECTION 13 or 15 (d) OF THE SECURITIES
EXCHANGE ACT OF 1934
For the fiscal year ended December 31, 2011
or
_ TRANSITION REPORT PURSUANT TO SECTION 13 or 15 (d) OF THE SECURITIES EXCHANGE ACT OF 1934
For the transition period from ______ to ______
Commission file number: 0-19254
LIFETIME BRANDS, INC. (Exact name of registrant as specified in its charter)
Delaware 11-2682486
(State or other jurisdiction of incorporation or organization) (I.R.S. Employer Identification No.)
1000 Stewart Avenue, Garden City, New York 11530
(Address of principal executive offices, including Zip Code)
(516) 683-6000 (Registrant's telephone number, including area code)
Securities registered pursuant to Section 12(b) of the Act: Common Stock, $.01 par value The NASDAQ Stock Market LLC (Title of each class) (Name of each exchange on which registered) Securities registered pursuant to Section 12(g) of the Act: None
Indicate by check mark if the registrant is a well-known seasoned issuer, as defined in Rule 405 of the Securities Act.
Yes � No � Indicate by check mark if the registrant is not required to file reports pursuant to Section 13 or Section 15(d) of the Act.
Yes � No �

Indicate by check mark whether the registrant (1) has filed all reports required to be filed by Section 13 or 15(d) of the Securities Exchange Act of 1934 during the preceding 12 months (or for such shorter period that the registrant was required to file such reports), and (2) has been subject to such filing requirements for the past 90 days.
Yes � No �
Indicate by check mark whether the registrant has submitted electronically and posted on its corporate Web site, if any, every Interactive Data File required to be submitted and posted pursuant to Rule 405 of Regulation S-T (§ 232.405 of this chapter) during the preceding 12 months (or for such shorter period that the registrant was required to submit and post such files).
Yes � No �
Indicate by check mark if disclosure of delinquent filers pursuant to Item 405 of Regulation S-K (§ 229.405 of this chapter) is not contained herein, and will not be contained, to the best of registrant’s knowledge, in definitive proxy or information statements incorporated by reference in Part III of this Form 10-K or any amendment to this Form 10-K.
�
Indicate by check mark whether the registrant is a large accelerated filer, an accelerated filer, a non-accelerated filer, or a smaller reporting company. See the definitions of “large accelerated filer”, “accelerated filer” and “smaller reporting company” in Rule 12b-2 of the Exchange Act:
Large accelerated filer � Accelerated filer � Non-accelerated filer (do not check if a smaller reporting company) � Smaller reporting company �
Indicate by check mark whether the registrant is a shell company (as defined in Rule 12b-2 of the Act).
Yes � No �
The aggregate market value of 9,557,190 shares of the voting common equity held by non-affiliates of the registrant as of June 30, 2011 was approximately $112,201,411. Directors, executive officers, and trusts controlled by said individuals are considered affiliates for the purpose of this calculation and should not necessarily be considered affiliates for any other purpose. The number of shares of common stock, par value $.01 per share, outstanding as of March 9, 2012 was 12,430,893.
DOCUMENTS INCORPORATED BY REFERENCE
Parts of the registrant’s definitive proxy statement for the 2012 Annual Meeting of Stockholders to be filed pursuant to Regulation 14A under the Securities Exchange Act of 1934 are incorporated by reference in Part III of this Annual Report.

1
LIFETIME BRANDS, INC. FORM 10-K
TABLE OF CONTENTS
PART I 1. Business.............................................................................................................................................................3
1A. Risk Factors.......................................................................................................................................................6
1B. Unresolved Staff Comments .......................................................................................................................... 10
2. Properties........................................................................................................................................................ 10
3. Legal Proceedings .......................................................................................................................................... 10
4. Mine Safety Disclosure (Not Applicable) ...................................................................................................... 11 PART II 5. Market For Registrant’s Common Equity, Related Stockholder Matters and Issuer Purchases of Equity Securities ...........................................................................................................................................11
6. Selected Financial Data...................................................................................................................................13
7. Management’s Discussion and Analysis of Financial Condition and Results of Operations......................... 14
7A. Quantitative and Qualitative Disclosures About Market Risk.........................................................................25
8. Financial Statements and Supplementary Data ...............................................................................................26
9. Changes in and Disagreements with Accountants on Accounting and Financial Disclosure ........................27
9A. Controls and Procedures..................................................................................................................................27
9B. Other Information............................................................................................................................................29 PART III
10. Directors, Executive Officers and Corporate Governance ..............................................................................29
11. Executive Compensation.................................................................................................................................29
12. Security Ownership of Certain Beneficial Owners and Management and Related Stockholder Matters ......29
13. Certain Relationships and Related Transactions, and Director Independence................................................29
14. Principal Accounting Fees and Services ........................................................................................................29
PART IV 15. Exhibits and Financial Statement Schedules ..................................................................................................30
SIGNATURES ......................................................................................................................................................34

2
DISCLOSURE REGARDING FORWARD-LOOKING STATEMENTS
This Annual Report on Form 10-K contains “forward-looking statements” as defined by the Private Securities Litigation Reform Act of 1995. These forward-looking statements include information concerning Lifetime Brands, Inc. and its subsidiaries’ (the “Company’s”) plans, objectives, goals, strategies, future events, future revenues, performance, capital expenditures, financing needs and other information that is not historical information. Many of these statements appear, in particular, under the headings Business and Management’s Discussion and Analysis of
Financial Condition and Results of Operations included in Item 1 of Part I and Item 7 of Part II, respectively. When used in this Annual Report on Form 10-K, the words “estimates,” “expects,” “anticipates,” “projects,” “plans,” “intends,” “believes” and variations of such words or similar expressions are intended to identify forward-looking statements. All forward-looking statements, including, without limitation, the Company’s examination of historical operating trends, are based upon the Company’s current expectations and various assumptions. The Company believes there is a reasonable basis for its expectations and assumptions, but there can be no assurance that the Company will realize its expectations or that the Company’s assumptions will prove correct.
There are a number of risks and uncertainties that could cause the Company’s actual results to differ materially from the forward-looking statements contained in this Annual Report. Important factors that could cause the Company’s actual results to differ materially from those expressed as forward-looking statements are set forth in this Annual Report, including the risk factors discussed in Part I, Item 1A under the heading Risk Factors.
Except as may be required by law, the Company undertakes no obligation to publicly update or revise forward-looking statements which may be made to reflect events or circumstances after the date made or to reflect the occurrence of unanticipated events.
OTHER INFORMATION
The Company is required to file its annual reports on Forms 10-K and quarterly reports on Forms 10-Q, and other reports and documents as required from time to time with the United States Securities and Exchange Commission (the “SEC”). The public may read and copy any materials that the Company files with the SEC at the SEC’s Public Reference Room at 100 F Street, NE, Washington, DC 20549. Information may be obtained with respect to the operation of the Public Reference Room by calling the SEC at 1-800-SEC-0330. The SEC also maintains an Internet site that contains reports, proxy and information statements, and other information regarding the Company’s electronic filings with the SEC at http://www.sec.gov. The Company also maintains a website at http://www.lifetimebrands.com where users can access the Company’s electronic filings free of charge.

3
PART I
Item 1. Business
OVERVIEW
The Company designs, sources and sells branded kitchenware, tabletop and other products used in the home. The Company either owns or licenses its brands. The Company’s licenses generally only permit the Company to sell certain products using the licensed brand name. The Company sells its products to retailers and distributors and sells a limited selection of its products directly to consumers through its Internet websites. The Company markets its products under well-respected and widely-recognized brand names in the housewares industry. According to the Home Furnishing News Brand Survey issued in 2009, three of the Company’s brands, KitchenAid®, Cuisinart® and Farberware®, are among the four most recognized brands in the “Kitchen Tool, Cutlery and Gadgets” category. In addition, the Company also sells products under private-label brand names controlled by certain of its retailer customers. The Company primarily targets moderate to premium price points through every major level of trade and generally markets several lines within each of its product categories under more than one brand. At the heart of the Company is a culture of innovation. The Company brought over 4,200 new or redesigned products to market in 2011 and expects to introduce approximately 4,200 new or redesigned products in the U.S. and an additional 3,750 in the United Kingdom and other countries in 2012.
The Company’s product categories include two categories of products that people use to prepare, serve and consume foods, Kitchenware (kitchen tools and gadgets, cutlery, cutting boards, bakeware and cookware) and Tabletop (dinnerware, flatware and glassware); and one category, Home Solutions, which comprises other products used in the home (food storage, pantryware, spices and home décor).
The Company sources almost all of its products from suppliers located outside the United States, primarily in the People’s Republic of China. The Company manufactures its sterling silver products at a leased facility in San Germán, Puerto Rico and fills spices and assembles spice racks at its owned Winchendon, Massachusetts distribution facility.
The Company has expanded its presence in international markets through investments in various companies that operate outside of the United States. In 2007, the Company acquired a 30% equity interest in Grupo Vasconia, S.A.B. (“Vasconia”), a housewares company based in Mexico. In January 2008, the Company entered into a strategic alliance to distribute products in Canada. In January 2011, the Company, together with Vasconia and unaffiliated partners, formed Housewares Corporation of Asia Limited, a Hong Kong-based company that supplies direct import kitchenware products to retailers in North, Central and South America. In November 2011, the Company acquired 100% of the share capital of each of Creative Tops Holdings Limited and Creative Tops Far East Limited (collectively, “Creative Tops”). Creative Tops is a UK-based supplier of private label and branded tabletop and kitchenware products. In December 2011, the Company acquired a 40% equity interest in GS Internacional S/A (“GSI”). GSI is a wholesale distributor of branded housewares products in Brazil. GSI markets dinnerware, glassware, home décor, kitchenware and barware to customers, including major department stores, housewares retailers and independent shops throughout Brazil. In February 2012, the Company entered into a joint venture to distribute Mikasa® products in China.
In addition, the Company licenses certain of its brands to other companies in various foreign markets, including Vasconia in Mexico and through a strategic alliance in Canada. The Company will continue to seek opportunities to license certain brands in other foreign markets.
The Company continues to evaluate opportunities to expand the recognition of its brands and to invest in other companies that operate principally outside the United States. These opportunities involve risks as the industry and foreign markets may not evolve as anticipated and the Company’s objectives may not be achieved.

4
The Company’s top brands and their respective product categories are:
Brand Licensed/Owned Product Category Farberware® Licensed* Kitchenware and Tabletop Mikasa® Owned Tabletop and Home Solutions KitchenAid® Licensed Kitchenware Pfaltzgraff® Owned Tabletop and Home Solutions Cuisinart® Licensed Kitchenware and Tabletop Elements® Owned Home Solutions Melannco® Owned Home Solutions Wallace Silversmiths® Owned Tabletop and Home Solutions Kamenstein® Owned Kitchenware Pedrini® Licensed Kitchenware Towle® Owned Tabletop and Home Solutions V&A® Licensed Tabletop Royal Botanic Gardens Kew® Licensed Tabletop
* The Company has a 183 year royalty free license to utilize the Farberware® brand for kitchenware and tabletop products.
The Company’s wholesale customers include mass merchants, specialty stores, national chains, department stores, warehouse clubs, supermarkets, off-price retailers and Internet retailers.
BUSINESS SEGMENTS
The Company operates in two business segments: the Wholesale segment, which is the Company’s primary business that designs, markets and distributes its products to retailers and distributors, and the Retail Direct segment in which the Company markets and sells a limited selection of its products through its Pfaltzgraff®, Mikasa®, Lifetime SterlingTM and Housewares DealsTM Internet websites. The Company has segmented its operations to reflect the manner in which management reviews and evaluates the results of its operations.
Additional information regarding the Company’s reportable segments is included in Note J of the Notes to the Consolidated Financial Statements included in Item 15.
CUSTOMERS
The Company’s products are sold globally to a diverse customer base including mass merchants (such as Wal-Mart and Target), specialty stores (such as Bed Bath & Beyond and Dunelm), national chains (such as Kohl’s, JC Penney and Sears), department stores (such as Macy’s), warehouse clubs (such as Costco, BJ’s Wholesale Club and Sam’s Club), supermarkets (such as Stop & Shop, Kroger, Tesco and Sainsbury’s), off-price retailers (such as Marshalls, T.J. Maxx and Ross Stores), and Internet retailers (such as Amazon.com).
The Company also operates its own Internet sites that provide information about the Company’s products and offer consumers the opportunity to purchase a limited selection of the Company’s products directly from the Company.
During the years ended December 31, 2011, 2010 and 2009, Wal-Mart Stores, Inc. (including Sam’s Club and Asda Superstore) accounted for 15%, 15%, and 18% of net sales, respectively. No other customer accounted for 10% or more of the Company’s net sales during these periods.

5
DISTRIBUTION
The Company operates the following distribution centers:
Location Size
(square feet)
Fontana, California 830,690
Robbinsville, New Jersey 700,000
Winchendon, Massachusetts 175,000
Corby, United Kingdom 90,000
Medford, Massachusetts 5,590
SALES AND MARKETING
The Company’s sales and marketing staff coordinates directly with its wholesale customers to devise marketing strategies and merchandising concepts and to furnish advice on advertising and product promotion. The Company has developed many promotional programs for use in the ordinary course of business to promote sales throughout the year. The Company’s sales and marketing efforts are supported from its principal offices and showroom in Garden City, New York; as well as showrooms in New York, New York; Medford, Massachusetts; Atlanta, Georgia; Bentonville, Arkansas; Menomonee Falls, Wisconsin and Corby, United Kingdom. The Company generally collaborates with its largest wholesale customers and in many instances produces specific versions of the Company’s product lines with exclusive designs and/or packaging for their stores.
DESIGN AND INNOVATION
At the heart of the Company is a culture of innovation and new product development. The Company’s in-house design and development teams currently consist of 105 professional designers, artists and engineers. Utilizing the latest available design tools, technology and materials, these teams create new products, redesign products and create packaging and merchandising concepts.
SOURCES OF SUPPLY
The Company sources its products from over 400 suppliers. Most of the Company’s suppliers are located in the People’s Republic of China. The Company also sources products from suppliers in the United States, India, Japan, United Kingdom, Indonesia, Korea, Italy, Thailand, Germany, Slovakia, Vietnam, Czech Republic, Canada, Poland, Portugal, Switzerland, Malaysia, Slovenia, Mexico, Taiwan, and Singapore. The Company orders products substantially in advance of the anticipated time of their sale. The Company does not have any formal long-term arrangements with any of its suppliers and its arrangements with most manufacturers allow for flexibility in modifying the quantity, composition and delivery dates of orders. MANUFACTURING
The Company manufactures its sterling silver products at its leased manufacturing facility in San Germán, Puerto Rico and fills spices and assembles spice racks at its owned Winchendon, Massachusetts distribution facility. COMPETITION
The markets for kitchenware, tabletop and other products used in the home including home décor products are highly competitive and include numerous domestic and foreign competitors, some of which are larger than the Company. The primary competitive factors in selling such products to retailers are innovative products, brand, quality, aesthetic appeal to consumers, packaging, breadth of product line, distribution capability, prompt delivery and selling price.

6
PATENTS
The Company owns 138 design and utility patents. The Company believes that the expiration of any of its patents would not have a material adverse effect on the Company’s business. BACKLOG
Backlog is not material to the Company’s business because actual confirmed orders from the Company’s customers are typically not received until close to the required shipment dates. EMPLOYEES
At December 31, 2011, the Company had a total of 1,150 full-time employees, of whom 185 are located in Asia and 113 in Europe. In addition, the Company employed 59 people on a part-time basis, predominately in customer service. None of the Company’s employees are represented by a labor union. The Company considers its employee relations to be good.
REGULATORY MATTERS
The Company, its subsidiaries and affiliates are subject to significant regulation by various governmental, regulatory and other administrative authorities.
As a manufacturer and distributor of consumer products, the Company is subject to the Consumer Products Safety Act. Additionally, laws regulating certain consumer products exist in some cities and states, as well as in other countries in which the Company or its subsidiaries and affiliates sell products.
The Company’s spice container filling operation is regulated by the Food and Drug Administration.
The Company’s operations also are subject to federal, state and local environmental and health and safety laws and regulations, including those that impose workplace standards and regulate the discharge of pollutants into the environment and establish standards for the handling, generation, emission, release, discharge, treatment, storage and disposal of materials and substances including solid and hazardous wastes.
Item 1A. Risk Factors
The Company’s businesses, operations and financial condition are subject to various risks. The risks and uncertainties described below are those that the Company considers material.
General Economic Factors and Political Conditions
The Company’s performance is affected by general economic factors, strength of retail economies and political conditions that are beyond its control. Retail economies are impacted by factors such as consumer demand and the condition of the retail industry, which in turn, is effected by general economic factors. These general economic factors include, among other factors, recession, inflation, deflation, housing markets, consumer credit availability, consumer debt levels, fuel and energy costs, material input costs, foreign currency translation, labor cost inflation, interest rates, government policies including tax policies and social compliance standards, unemployment trends, the impact of natural disasters and terrorist activities, conditions affecting the retail environment for the home and other matters that influence consumer spending. Unfavorable economic conditions in the United States adversely affected the Company’s performance in 2008 and 2009 and global economic conditions could adversely affect the Company’s performance in the future. Unstable economic and political conditions, civil unrest and political activism, particularly in Asia, could adversely impact the Company’s businesses. Any substantial deterioration in general economic conditions could also adversely affect consumer spending patterns which tend to be highly correlated with the levels of disposable income of consumers. If the global economy experiences significant disruptions or a slowdown, the Company’s business could be negatively impacted by reduced demand for its products. The Company conducts business outside of the United States through subsidiaries, affiliates and joint ventures. These entities have operations in the United Kingdom, Mexico, Canada, Brazil, Hong Kong and China; therefore, the Company is subject to increases and decreases in its investments resulting from the impact of fluctuations in
7
foreign currency exchange rates. These entities also bear risks similar to those risks of the Company; however, there are specific additional risks related to these organizations such as the failure of the Company’s partners or other investors to meet their obligations and higher credit and liquidity risks related to thinly capitalized entities. Failure of these entities or the Company’s vendors to adhere to required regulatory or other standards, including social compliance standards, can impact the Company’s reputation and adversely impact the Company’s business.
The Company has achieved growth through investments and acquisitions. There can be no assurance that the Company will continue to be able to successfully integrate these businesses or identify and integrate future acquisitions into its existing business without substantial costs, delays or other operational or financial difficulties. Additionally, the failure of these businesses to achieve expected results, diversion of the Company’s management’s attention and failure to retain key personnel at these businesses could have a material adverse effect on the Company’s business, results of operations and financial condition.
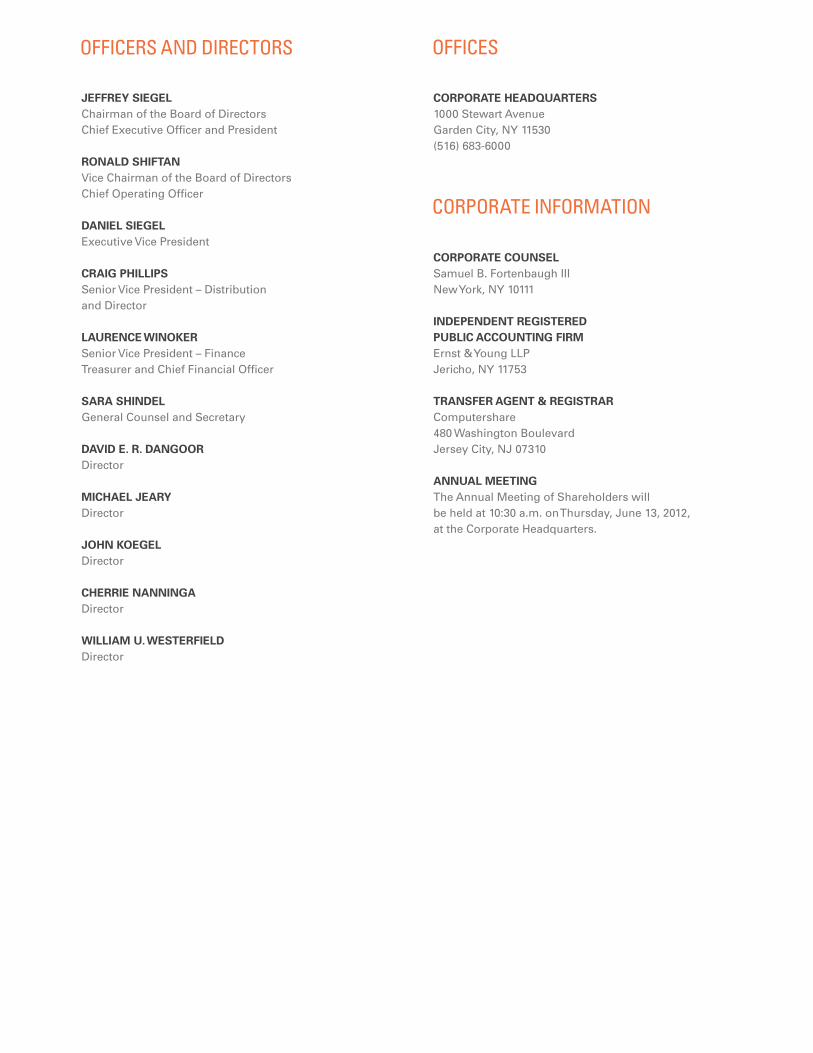
Liquidity
The Company has substantial indebtedness and depends upon its bank lenders to finance its liquidity needs. In October 2011, the Company entered into a new $150.0 million secured credit agreement (the “Revolving Credit Facility”) and amended its $40.0 million second lien credit agreement (the “Term Loan”). Amounts loaned under these agreements bear interest at floating rates. An increase in interest rates would adversely affect the Company’s profitability. To the extent that the Company’s access to credit was to be restricted because of its own performance, its bank lenders’ performances or conditions in the capital markets generally, the Company would not be able to operate normally.
Competition
The markets for the Company’s products are intensely competitive. The Company competes with many other suppliers, some of which are larger than the Company, have greater financial and other resources or employ brands that are more established, have greater consumer recognition or are more favorably perceived by consumers or retailers than the Company’s brands.
Customers
The Company’s wholesale customers include mass merchants, specialty stores, national chains, department stores, warehouse clubs, supermarkets, off-price retailers and Internet retailers. Unanticipated changes in purchasing and other practices by the Company’s customers, including a customer’s pricing and payment terms, inventory destocking, limitations on shelf space, use of private label brands and other practices, could adversely affect the Company’s profitability. In addition, as a result of the desire of retailers to more closely manage inventory levels, there is a growing trend among retailers to make purchases on a “just-in-time” basis. This requires the Company to shorten its lead time for production in certain cases and more closely anticipate demand, which could in the future require the Company to carry additional inventories. The Company’s annual earnings and cash flows also depend to a great extent on the results of operations in the latter half of the year due to the seasonality of its sales. The Company’s success and sales growth is also dependent on its evaluation of consumer preferences and changing trends. The Company also sells a limited quantity of the Company’s products to individual consumers and smaller retailers through its own Internet sites.
Many of the Company’s wholesale customers are significantly larger than the Company, have greater financial and other resources and also purchase goods directly from vendors in Asia and elsewhere. Decisions by large customers to increase their purchases directly from overseas vendors could have a materially adverse affect on the Company. Significant changes or financial difficulties, including consolidations of ownership, restructurings, bankruptcies, liquidations or other events that affect retailers, could result in fewer stores selling the Company’s products, the Company having to rely on a smaller group of customers, an increase in the risk of extending credit to these customers or limitations on the Company’s ability to collect amounts due from these customers. Although the Company has long-established relationships with many of its customers, the Company does not have any long-term supply or binding contracts or guarantees of minimum purchases. Purchases by the Company’s customers are generally made using individual purchase orders. As a result, these customers may cancel their orders, change purchase quantities from forecast volumes, delay purchases for a number of reasons beyond the Company’s control or change other terms of their business relationship with the Company. Significant or

8
numerous cancellations, reductions, delays in purchases or changes in business practices by customers could have a material adverse effect on the Company’s business.
In 2011, Wal-Mart Stores, Inc. (including Sam’s Club and Asda Superstore) accounted for 15% of the Company’s net sales. A material reduction in purchases by Wal-Mart Stores, Inc. could have a significant adverse effect on the Company’s business and operating results. In addition, pressures by Wal-Mart Stores, Inc. that would cause the Company to materially reduce the price of the Company’s products could result in reductions of the Company’s operating margin. The concentration of the Company’s business with Wal-Mart extends to its international businesses, including Vasconia in Mexico and its strategic alliance in Canada, due to the market presence of Wal-Mart in these foreign countries. Supply Chain
The Company sources its products from suppliers located in Asia, Europe and the United States. The Company’s Asia vendors are located primarily in the People’s Republic of China, which subjects the Company to various risks within the region including regulatory, political, economic and foreign currency changes. The Company’s ability to select and retain reliable vendors and suppliers who provide timely deliveries of quality parts and products efficiently will impact its success in meeting customer demand for timely delivery of quality products. The Company’s sourcing operations and its vendors are impacted by labor costs in China. Labor historically has been readily available at relatively low cost as compared to labor costs in North America. However, as China is experiencing rapid social, political and economic changes, labor costs have risen in some regions and there can be no assurance that labor will continue to be available to the Company in China at costs consistent with historical levels or that changes in labor or other laws will not be enacted which would have a material adverse effect on the Company’s operations in China. Interruption of supplies from any of the Company’s vendors, or the loss of one or more key vendors, could have a negative effect on the Company’s business and operating results. Changes in currency exchange rates might negatively affect the profitability and business prospects of the Company and its overseas vendors. The Company does not have access to its vendors’ financial information and is unable to assess its vendors’ financial conditions including their liquidity.
The Company is subject to risks and uncertainties associated with economic and political conditions in foreign countries, including but not limited to, foreign government regulations, taxes including value-added taxes, import and export duties and quotas, anti-dumping regulations, incidents and fears involving security, terrorism and wars, political unrest and other restrictions on trade and travel.
The Company imports its products for delivery to its distribution centers, as well as arranges for its customers to import goods to which title has passed overseas or at port of entry. For purchases that are to be delivered to its distribution centers, the Company arranges for transportation, primarily by sea, from ports in Asia and Europe to ports in the United States, principally New York/Newark/Elizabeth and Los Angeles/Long Beach. Accordingly, the Company is subject to risks incidental to such transportation. These risks include, but are not limited to, increases in fuel costs, the availability of ships, increased security restrictions, work stoppages and carriers’ ability to provide delivery services to meet the Company’s shipping needs. Transportation disruptions and increased transportation costs could adversely affect the Company’s business.
The Company delivers its products to its customers or makes such products available for customer pickup from its distribution centers. Prolonged domestic transportation disruptions, as well as workforce or systems issues related to the Company’s distribution centers, could have a negative effect on the Company’s ability to deliver goods to its customers.
Intellectual Property
Significant portions of the Company’s business are dependent on trade names, trademarks and patents, some of which are licensed from third-parties. Several of these license agreements are subject to termination by the licensor. The loss of certain licenses or a material increase in the royalty rates the Company pays under such licenses upon renewal could result in a reduction of the Company’s operating margin.

9
Regulatory
The Company is subject in the ordinary course of its business, in the United States and elsewhere, to many statutes, ordinances, rules and regulations that if violated by the Company or its affiliates, partners or vendors could have a material adverse effect on the Company’s business.
The marketing of certain of the Company’s consumer products involve an inherent risk of product liability claims or recalls or other regulatory or enforcement actions initiated by the U.S. Consumer Product Safety Commission, by other regulatory authorities or through private causes of action. Any defects in products the Company markets could harm the Company’s credibility, adversely affect its relationship with its customers and decrease market acceptance of the Company’s products and the strength of the brand names under which the Company markets such products. Potential product liability claims may exceed the amount of the Company’s insurance coverage and could materially damage the Company’s business and its financial condition.
The Company is subject to significant regulations, including the Dodd-Frank Wall Street Reform and Consumer Protection Act of 2010 and the Sarbanes-Oxley Act of 2002. The Company cannot assure strict adherence to these regulations nor that it will not find material weaknesses in the future or that the Company’s independent registered public accounting firm will conclude that the Company’s internal control over financial reporting is operating effectively.
The Company is subject to general business regulations and laws, as well as regulations and laws specifically governing the Internet and e-commerce. Such existing and future laws and regulations may impede the growth of the Internet or other online services. These regulations and laws may cover taxation, user privacy, data protection, pricing, content, copyrights, distribution, electronic contracts and other communications, consumer protection, the provision of online payment services, broadband residential Internet access and the characteristics and quality of products and services. It is not clear how existing laws governing issues such as property ownership, sales and other taxes and personal privacy apply to the Internet and e-commerce. Unfavorable resolutions of these issues would harm the Company’s business. This could, in turn, diminish the demand for the Company’s products on the Internet and increase the Company’s cost of doing business.
Technology
The Company relies on many information technology systems for the operation of its principal business functions, including the Company’s enterprise, warehouse management, inventory forecast and re-ordering and call center systems. In the case of the Company’s inventory forecast and re-ordering system, most of the Company’s orders are received directly through electronic connections with the Company’s largest customers. The failure of any of these systems could have a material adverse effect on the Company’s business and results of operations. To keep pace within a competitive retail environment, the Company uses and will continue to evaluate new technologies to improve the efficiency of designing new innovative products. The success of certain product categories can be dependent upon the creation and launch of new innovative products in a competitive marketplace.
Availability of information on the Internet and, in particular, on social media websites subjects the Company to reputational risks related to its brands and the perceived quality of its products.
The Company has made significant efforts to secure its computer network to mitigate the risk of possible cyber attacks. However, the Company’s computer network could be compromised and confidential information such as customer credit card information could be misappropriated. This could lead to adverse publicity, loss of sales and profits or cause the Company to incur significant costs to reimburse third-parties for damages which could adversely impact profits.
In addition, although the Company’s systems and procedures comply with Payment Card Industry (“PCI”) data security standards, failure by the Company to maintain compliance with the PCI requirements or rectify a security issue could result in fines and the imposition of restrictions on the Company’s ability to accept credit cards.
Personnel
The Company’s success depends on its ability to identify, hire and retain skilled personnel. The Company’s industry is characterized by a high level of employee mobility and aggressive recruiting among competitors for personnel with successful track records. The Company may not be able to attract and retain skilled personnel or may incur significant costs in order to do so.

10
Increases in the cost of employee benefits could impact the Company’s financial results and cash flows. The Company self insures a substantial portion of the costs of employee healthcare and workers compensation. This could result in higher volatility in the Company’s earnings and exposes the Company to higher financial risks. Healthcare costs in the United States and other countries have risen significantly over the past several years and increases may continue in the future.
Item 1B. Unresolved Staff Comments
None
Item 2. Properties
The following table lists the principal properties at which the Company operates its business at December 31, 2011:
Location
Description Size
(square feet) Owned/
Leased
Fontana, California Principal West Coast warehouse and distribution facility 830,690 Leased
Robbinsville, New Jersey Principal East Coast warehouse and distribution facility 700,000 Leased
Winchendon, Massachusetts Warehouse and distribution facility, and spice packing line 175,000 Owned
Garden City, New York Corporate headquarters/main showroom 146,000 Leased
Corby, United Kingdom Offices and distribution facility 100,000 Leased
Medford, Massachusetts Offices, showroom, warehouse and distribution facility 69,000 Leased
San Germán, Puerto Rico Sterling silver manufacturing facility 55,000 Leased
Guangzhou, China Offices 18,000 Leased
New York, New York Showrooms 17,000 Leased
York, Pennsylvania Offices 14,000 Leased
Atlanta, Georgia Showrooms 11,000 Leased
Shanghai, China Offices 11,000 Leased
Kowloon, Hong Kong Offices 4,000 Leased
Item 3. Legal Proceedings
Wallace Silversmiths de Puerto Rico, Ltd. (“Wallace de Puerto Rico”), a wholly-owned subsidiary of the Company, operates a manufacturing facility in San Germán, Puerto Rico that is leased from the Puerto Rico Industrial Development Company (“PRIDCO”). In March 2008, the United States Environmental Protection Agency (the “EPA”) announced that the San Germán Ground Water Contamination site in Puerto Rico (the “Site”) had been added to the Superfund National Priorities List due to contamination present in the local drinking water supply.
In May 2008, Wallace de Puerto Rico received from the EPA a Notice of Potential Liability and Request for Information Pursuant to 42 U.S.C. Sections 9607(a) and 9604(e) of the Comprehensive Environmental Response, Compensation, Liability Act. The Company responded to the EPA's Request for Information on behalf of Wallace de Puerto Rico. In July 2011, Wallace de Puerto Rico received a letter from the EPA requesting access to the property that it leases from PRIDCO, and the Company granted such access.
The Company is not aware of any determination by the EPA that any remedial action is warranted for the Site and, accordingly, is not able to estimate the extent of any possible liability.
The Company is, from time to time, involved in other legal proceedings. The Company believes that such other current litigation is routine in nature and incidental to the conduct of the Company’s business and that none of this litigation, individually or collectively, would have a material adverse effect on the Company’s consolidated financial position, results of operations or cash flows.

11
Item 4. Mine Safety Disclosure Not applicable PART II Item 5. Market For Registrant’s Common Equity, Related Stockholder Matters and Issuer Purchases of Equity Securities (a) The Company’s common stock is traded under the symbol “LCUT” on the NASDAQ Global Select
Market (“NASDAQ”).
The following table sets forth the quarterly high and low sales prices for the common stock of the Company for the fiscal periods indicated as reported by NASDAQ.
2011 2010 High Low High Low
First quarter $ 15.00 $ 11.46 $ 12.00 $ 6.61
Second quarter 15.99 10.52 15.86 11.87
Third quarter 11.81 9.23 15.68 13.53
Fourth quarter 13.03 8.67 15.23 12.70
At December 31, 2011, the Company estimates that there were approximately 2,675 beneficial holders of the Company’s common stock.
The Company is authorized to issue 100 shares of Series A Preferred stock and 2,000,000 shares of Series B Preferred stock, none of which were issued or outstanding at December 31, 2011.
In March 2011, the Company determined that it would resume paying cash dividends on its outstanding shares of common stock, which was suspended in February 2009. The Board of Directors declared a dividend of $0.025 per share payable on May 16, 2011, August 16, 2011, November 29, 2011, February 15, 2012 and May 15, 2012. The Board of Directors currently intends to continue paying cash dividends for the foreseeable future, although the Board of Directors may in its discretion determine to modify or eliminate such dividends at any time.
The following table summarizes the Company’s equity compensation plan as of December 31, 2011:
Plan category
Number of shares of
common stock to be issued
upon exercise of outstanding
options
Weighted- average exercise price of
outstanding options
Number of shares of common
stock remaining
available for future
issuance
Equity compensation plan approved by security holders 2,475,750 $12.62 332,476
Equity compensation plan not approved by security holders ― ― ―
Total 2,475,750 $12.62 332,476

12
PERFORMANCE GRAPH
The following chart compares the cumulative total return on the Company’s common stock with the NASDAQ Market Index and the Hemscott Group Index for Housewares & Accessories. The comparisons in this chart are required by the SEC and are not intended to forecast or be indicative of the possible future performance of the Company’s common stock.
Comparison of Year Cumulative Total Return
$0
$20
$40
$60
$80
$100
$120
2006 2007 2008 2009 2010 2011
Li fetime Brands , Inc. NASDAQ Market Index Hemscott Group Index
DO
LL
AR
S
ASSUMES $100 INVESTED ON JAN. 01, 2007
ASSUMES DIVIDEND REINVESTED
FISCAL YEAR ENDING DEC. 31, 2011
Note:
(1) The chart assumes $100 was invested on January 1, 2007 and dividends were reinvested. Measurement points are at the last trading day of each of the fiscal years ended December 31, 2007, 2008, 2009, 2010 and 2011. The material in this chart is not soliciting material, is not deemed filed with the Securities and Exchange Commission and is not incorporated by reference in any filing of the Company under the Securities Act of 1933, as amended, or the Securities Exchange Act of 1934, as amended, whether or not the chart is prepared before or after the date of this Annual Report on Form 10-K and irrespective of any general incorporation language in such filing. A list of the companies included in the Hemscott Group Index will be furnished by the Company to any stockholder upon written request to the Chief Financial Officer of the Company.
Date
Lifetime
Brands, Inc.
Hemscott
Group Index
NASDAQ Market Index
12/31/2006 $ 100.00 $ 100.00 $ 100.00
12/31/2007 80.05 86.45 110.66
12/31/2008 22.61 36.72 66.41 12/31/2009 45.67 65.61 96.54 12/31/2010 89.67 78.27 114.06 12/31/2011 78.00 73.26 113.16

13
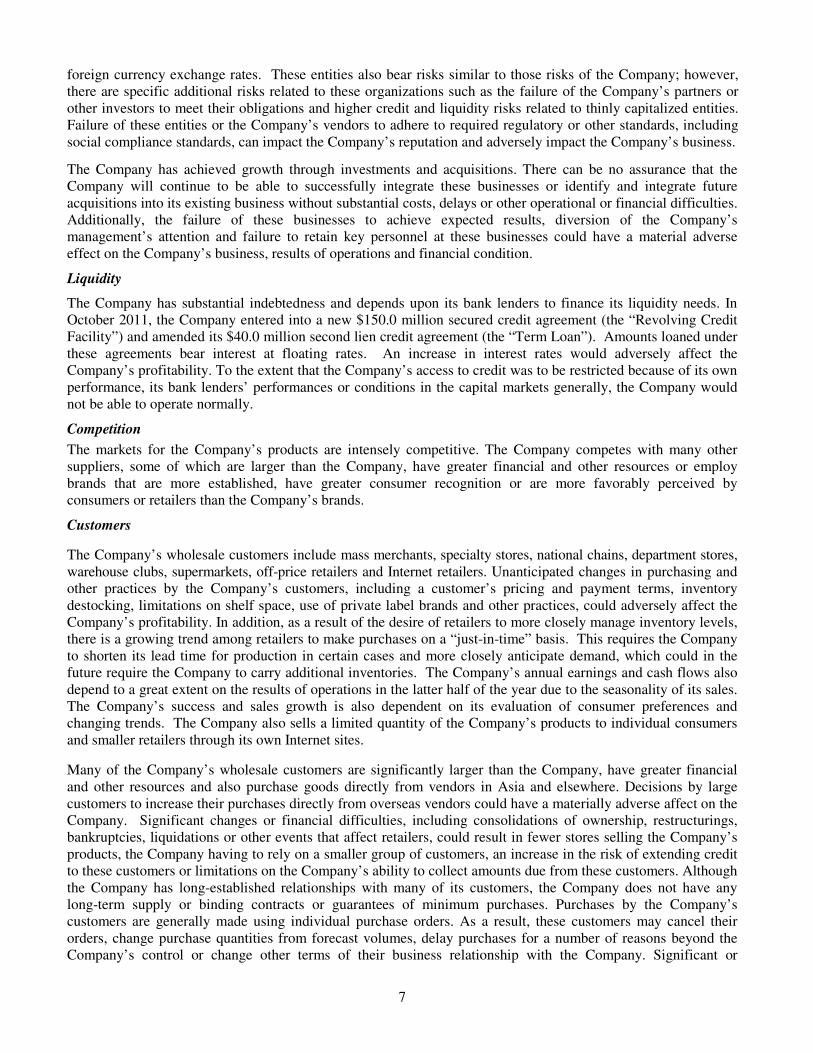
Item 6. Selected Financial Data
The selected consolidated statement of operations data for the years ended December 31, 2011, 2010 and 2009 and the selected consolidated balance sheet data as of December 31, 2011 and 2010 has been derived from the Company’s audited consolidated financial statements included elsewhere in this Annual Report on Form 10-K. The selected consolidated statement of operations data for the years ended December 31, 2008 and 2007 and the selected consolidated balance sheet data at December 31, 2009, 2008 and 2007 have been derived from the Company’s audited consolidated financial statements included in the Company’s Annual Reports on Form 10-K for those respective years, which are not included in this Annual Report on Form 10-K. This information should be read together with the discussion in Management’s Discussion and Analysis of Financial
Condition and Results of Operations and the Company’s consolidated financial statements and notes to those statements included elsewhere in this Annual Report on Form 10-K.
Year ended December 31, 2011 2010(2) 2009 2008(3) 2007(3) STATEMENT OF OPERATIONS DATA (1) (in thousands, except per share data)
Net sales $ 444,418 $ 443,171 $ 415,040 $ 487,935 $ 493,725
Cost of sales 282,058 273,774 257,839 303,535 288,997Distribution expenses 43,882 44,570 43,329 57,695 53,493Selling, general and administrative expenses 93,894 95,044 95,647 131,226 128,527Goodwill and intangible asset impairment ― ― ― 29,400 ―Restructuring expenses ― ― 2,616 17,992 1,924
Income (loss) from operations 24,584 29,783 15,609 (51,913) 20,784
Interest expense (7,758) (9,351) (13,185) (11,577) (10,623)
Loss on early retirement of debt ― (764) ― ― ―
Other income, net ― ― ― ― 3,935
Income (loss) before income taxes, equity in earnings and extraordinary item
16,826 19,668 2,424 (63,490) 14,096
Income tax benefit (provision) (6,122) (4,602) (1,880) 14,249 (6,567)
Equity in earnings, net of taxes 3,362 2,718 2,171 1,486 ―
Income (loss) before extraordinary item $ 14,066 $ 17,784 $ 2,715 $ (47,755) $ 7,529Extraordinary item, net of taxes ― 2,477 ― ― ―
Net income (loss) $ 14,066 $ 20,261 $ 2,715 $ (47,755) $ 7,529
Basic income (loss) per common share before extraordinary item $ 1.16 $ 1.48 $ 0.23 $ (3.99) $ 0.58
Basic income per common share of extraordinary item $ ― $ 0.20 $ ― $ ― $ ―
Basic income (loss) per common share $ 1.16 $ 1.68 $ 0.23 $ (3.99) $ 0.58
Weighted-average shares outstanding – basic 12,128 12,036 12,009 11,976 12,969Diluted income (loss) per common share
before extraordinary item $ 1.12 $ 1.44 $ 0.22 $ (3.99) $ 0.57Diluted income per common share of
extraordinary item $ ― $ 0.20 $ ― $ ― $ ―Diluted income (loss) per common share $ 1.12 $ 1.64 $ 0.22 $ (3.99) $ 0.57
Weighted-average shares outstanding – diluted 12,529 12,376 12,075 11,976 13,099
Cash dividends per common share $ 0.075 $ ― $ ― $ 0.25 $ 0.25

14
December 31,
2011 2010 2009 2008(3) 2007(3)
BALANCE SHEET DATA (1) (in thousands)
Current assets $ 198,797 $ 182,253 $ 173,850 $ 232,678 $ 228,078
Current liabilities 69,962 60,512 77,210 149,981 71,283
Working capital 128,835 121,741 96,640 82,697 156,795
Total assets 318,745 277,586 276,723 341,781 371,415
Short-term borrowings 15,000 4,100 24,601 89,300 13,500
Long-term debt 82,625 50,000 ― ― 55,200
Convertible senior notes ― 23,557 70,527 67,864 65,428
Stockholders’ equity 146,175 127,606 104,012 97,509 153,102
Notes:
(1) Investments and acquisitions of the following, in the respective years noted, which affect the comparability of the periods: a 30% equity investment
in Vasconia in December 2007, the acquisition of the business and certain assets of Mikasa® in June 2008, the acquisition of Creative Tops Holding
in November 2011 and a 40% equity investment in GSI in December 2011.
(2) In 2010, the Company recorded an extraordinary gain of $2.5 million as a result of the elimination of the negative goodwill recorded in conjunction
with the purchase of the business and certain assets of Mikasa, Inc.
(3) Certain amounts have been adjusted in these years to reflect the provisions of ASC Topic No. 470-20, Debt with Conversion and Other Options, on
a retrospective basis. See Note E of the Notes to the Consolidated Financial Statements included in Item 15 for further information regarding the
provisions of ASC Topic No. 470-20.
Item 7. Management’s Discussion and Analysis of Financial Condition and Results of Operations
The following discussion should be read in conjunction with the consolidated financial statements for the
Company and notes thereto set forth in Item 15. This discussion contains forward-looking statements relating to
future events and the future performance of the Company based on the Company’s current expectations,
assumptions, estimates and projections about it and the Company’s industry. These forward-looking statements
involve risks and uncertainties. The Company’s actual results and timing of various events could differ materially
from those anticipated in such forward-looking statements as a result of a variety of factors, as more fully
described in this section and elsewhere in this Annual Report. The Company undertakes no obligation to update
publicly any forward-looking statements for any reason, even if new information becomes available or other
events occur in the future.
ABOUT THE COMPANY
The Company designs, sources and sells branded kitchenware, tabletop and other products used in the home. The Company’s product categories include two categories of products that people use to prepare, serve and consume foods, Kitchenware (kitchen tools and gadgets, cutlery, cutting boards, bakeware and cookware) and Tabletop (dinnerware, flatware and glassware); and one category, Home Solutions, which comprises other products used in the home (food storage, pantryware, spices and home décor). Net sales of Kitchenware products and Tabletop products accounted for approximately 83% of the Company’s net wholesale sales and 79% of the Company’s consolidated net sales in 2011. Creative Tops, acquired in November 2011, is a UK-based company from which the Company will manage its European business. These product categories, which include a change to establish a Home Solutions product category and incorporate the additional revenue source from Creative Tops acquired in 2011, reflect a refined alignment of the Company’s products into the sources of revenue which the Company analyzes. The Company markets several product lines within each of its product categories and under most of the Company’s brands, primarily targeting moderate to premium price points through every major level of trade. The Company believes it possesses certain competitive advantages based on its brands, its emphasis on innovation and new product development and its sourcing capabilities. The Company owns or licenses a number of the leading brands in its industry including Farberware®, Mikasa®, KitchenAid®, Pfaltzgraff®, Elements®, Cuisinart®, Melannco® and V&A®. Historically, the Company’s sales growth has come from expanding product offerings within its product categories, by developing existing brands, acquiring new brands and establishing new product categories. Key factors in the Company’s growth strategy have been the selective use and management of the

15
Company’s brands and the Company’s ability to provide a stream of new products and designs. A significant element of this strategy is the Company’s in-house design and development teams that create new products, packaging and merchandising concepts.
BUSINESS SEGMENTS
The Company operates in two reportable business segments: the Wholesale segment, which is the Company’s primary business that designs, markets and distributes its products to retailers and distributors, and the Retail Direct segment, in which the Company markets and sells a limited selection of its products to consumers through its Pfaltzgraff®, Mikasa®, Housewares Deals™ and Lifetime Sterling™ Internet websites. The operating results of Creative Tops, which was acquired by the Company on November 4, 2011, for the post acquisition period are included within the Wholesale segment.
EQUITY INVESTMENTS
The Company owns approximately 30% of the outstanding capital stock of Vasconia, a leading Mexican housewares company. The Company accounts for its investment in Vasconia using the equity method of accounting and has recorded its proportionate share of Vasconia’s net income, net of taxes, as equity in earnings in the Company’s consolidated statements of operations. Pursuant to a Shares Subscription Agreement (the “Agreement”), the Company may designate four persons to be nominated as members of Vasconia’s Board of Directors. The Agreement also provides a mechanism whereby, through December 2012, the Company is able to acquire from certain shareholders of Vasconia a controlling interest in Vasconia; subject to such shareholders electing not to sell their interest and, instead, acquiring the Company’s shares or Vasconia repurchasing the Company’s shares. Shares of Vasconia’s capital stock are traded on the Bolsa Mexicana de Valores, the Mexican Stock Exchange (www.bmv.com.mx). The Quotation Key is VASCONI.
The Company has a 50% joint venture investment in World Alliance Enterprises Limited (“World Alliance”), a Hong-Kong based company that primarily sells kitchenware and cutlery products to retailers other than in North and South America. The Company accounts for its investment in World Alliance using the equity method of accounting and has recorded its proportionate share of World Alliance’s net income, net of taxes, as equity in earnings in the Company’s consolidated statements of operations.
In January 2011, the Company, together with Vasconia and unaffiliated partners, formed Housewares Corporation of Asia Limited, a Hong Kong-based company that supplies direct import kitchenware products to retailers in North, Central and South America. During 2011, the results of the operations were immaterial.
In December 2011, the Company acquired a 40% equity interest in GS Internacional S/A (“GSI”). GSI is a leading wholesale distributor of branded housewares products in Brazil. The company markets dinnerware, glassware, home décor, kitchenware and barware to customers including: major department stores, housewares retailers and independent shops throughout Brazil. The Company accounts for its investment in GSI using the equity method of accounting and has recorded its proportionate share of GSI’s net income, net of taxes, as equity in earnings in the Company’s consolidated statements of operations. Pursuant to a Shareholders’ Agreement, the Company has the right to designate three persons (including one independent person, as defined) to be nominated as members of GSI’s Board of Directors. GSI’s Board of Directors is comprised of seven members (including two independent members).
SEASONALITY
The Company’s business and working capital needs are highly seasonal, with a majority of sales occurring in the third and fourth quarters. In 2011, 2010 and 2009, net sales for the third and fourth quarters accounted for 59%, 60%, and 58% of total annual net sales, respectively. In anticipation of the pre-holiday shipping season, inventory levels increase primarily in the June through October time period.
EFFECT OF ADOPTION OF ACCOUNTING PRINCIPLE
In June 2011, the Financial Accounting Standards Board (“FASB”) issued Accounting Standard Update (“ASU”) No. 2011-05, Presentation of Comprehensive Income, which amends Accounting Standards Codification (“ASC”) Topic No. 220, Comprehensive Income. The updated guidance requires that all changes in stockholders’ equity be presented either as a single continuous statement of comprehensive income or in two separate but consecutive statements. In December 2011, the FASB issued Accounting Standards Update No. 2011-12 (“ASU 2011-12”) which defers certain reclassification requirements within ASU 2011-05. This guidance is effective for interim and
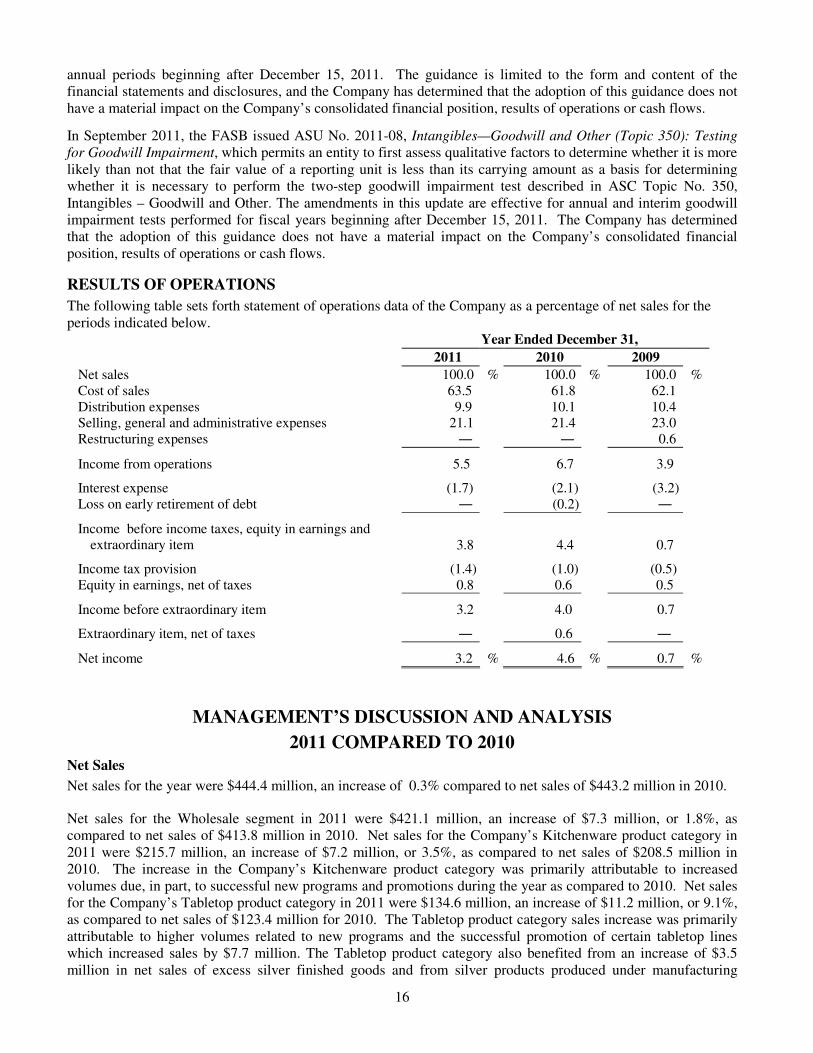
16
annual periods beginning after December 15, 2011. The guidance is limited to the form and content of the financial statements and disclosures, and the Company has determined that the adoption of this guidance does not have a material impact on the Company’s consolidated financial position, results of operations or cash flows.
In September 2011, the FASB issued ASU No. 2011-08, Intangibles—Goodwill and Other (Topic 350): Testing
for Goodwill Impairment, which permits an entity to first assess qualitative factors to determine whether it is more likely than not that the fair value of a reporting unit is less than its carrying amount as a basis for determining whether it is necessary to perform the two-step goodwill impairment test described in ASC Topic No. 350, Intangibles – Goodwill and Other. The amendments in this update are effective for annual and interim goodwill impairment tests performed for fiscal years beginning after December 15, 2011. The Company has determined that the adoption of this guidance does not have a material impact on the Company’s consolidated financial position, results of operations or cash flows.
RESULTS OF OPERATIONS
The following table sets forth statement of operations data of the Company as a percentage of net sales for the periods indicated below.
Year Ended December 31,
2011 2010 2009
Net sales 100.0 % 100.0 % 100.0 % Cost of sales 63.5 61.8 62.1 Distribution expenses 9.9 10.1 10.4 Selling, general and administrative expenses 21.1 21.4 23.0 Restructuring expenses ― ― 0.6
Income from operations 5.5 6.7 3.9
Interest expense (1.7) (2.1) (3.2)
Loss on early retirement of debt ― (0.2) ―
Income before income taxes, equity in earnings and extraordinary item 3.8 4.4 0.7
Income tax provision (1.4) (1.0) (0.5)
Equity in earnings, net of taxes 0.8 0.6 0.5
Income before extraordinary item 3.2 4.0 0.7
Extraordinary item, net of taxes ― 0.6 ―
Net income 3.2 % 4.6 % 0.7 %
MANAGEMENT’S DISCUSSION AND ANALYSIS
2011 COMPARED TO 2010 Net Sales
Net sales for the year were $444.4 million, an increase of 0.3% compared to net sales of $443.2 million in 2010.
Net sales for the Wholesale segment in 2011 were $421.1 million, an increase of $7.3 million, or 1.8%, as compared to net sales of $413.8 million in 2010. Net sales for the Company’s Kitchenware product category in 2011 were $215.7 million, an increase of $7.2 million, or 3.5%, as compared to net sales of $208.5 million in 2010. The increase in the Company’s Kitchenware product category was primarily attributable to increased volumes due, in part, to successful new programs and promotions during the year as compared to 2010. Net sales for the Company’s Tabletop product category in 2011 were $134.6 million, an increase of $11.2 million, or 9.1%, as compared to net sales of $123.4 million for 2010. The Tabletop product category sales increase was primarily attributable to higher volumes related to new programs and the successful promotion of certain tabletop lines which increased sales by $7.7 million. The Tabletop product category also benefited from an increase of $3.5 million in net sales of excess silver finished goods and from silver products produced under manufacturing

17
contracts. Net sales for the Company’s Home Solutions products category in 2011 were $64.1 million, a decrease of $17.8 million, or 21.7%, as compared to net sales of $81.9 million in 2010. The decrease in sales for the Company’s Home Solutions product category reflects lower volumes due, in part, to certain sales programs in 2010 not repeated in the 2011 period. Net sales for the Wholesale segment also include $6.7 million of net sales in 2011 from Creative Tops, which was acquired by the Company in November 2011.
Net sales for the Retail Direct segment in 2011 were $23.3 million, a decrease of $6.1 million, or 20.7%, as compared to $29.4 million for 2010. The decrease in net sales was primarily attributable to a reduction in promotional activities and the Company’s decision to terminate its print consumer catalog during the second quarter of 2011.
Cost of sales
Cost of sales for 2011 was $282.1 million as compared to $273.8 million for 2010. Cost of sales as a percentage of net sales was 63.5% for 2011 as compared to 61.8% for 2010.
Cost of sales as a percentage of net sales for the Wholesale segment was 65.1% for 2011 compared to 63.7% for 2010. The decrease in gross margin primarily reflected promotional allowances and changes in product mix. Wholesale gross profit declined by $3.5 million. This was primarily due to the weakness of our Home Solutions category for which net sales and gross margin declined in 2011. The decline was partially offset in other product categories and from the inclusion of Creative Tops, since its acquisition. Cost of sales as a percentage of net sales for the Retail Direct segment decreased to 33.1% in 2011 from 34.9% in 2010. The increase in gross margin primarily reflected reduced promotional activities which favorably affected margins during the 2011 period.
Distribution expenses
Distribution expenses for 2011 were $43.9 million as compared to $44.6 million for 2010. Distribution expenses as a percentage of net sales were 9.9% in 2011 and 10.1% for 2010.
Distribution expenses as a percentage of sales for the Wholesale segment shipped from the Company’s warehouses located in the United States were 9.4% as compared to 9.6% for the corresponding period in 2010. The decrease resulted from reduced labor costs in the 2011 period from efficiencies associated with an inventory management system upgrade put in place in the 2010 period.
Distribution expenses as a percentage of net sales for the Retail Direct segment were 29.8% for 2011 compared to 29.2% for 2010. A substantial portion of distribution expenses are fixed and, therefore, cannot be reduced to offset a reduction in sales volumes.
Selling, general and administrative expenses
Selling, general and administrative expenses (“SG&A”) for 2011 were $93.9 million, a decrease of 1.2% compared to $95.0 million for 2010.
SG&A for 2011 for the Wholesale segment were $71.4 million, an increase of $0.1 million or 0.1%, as compared to $71.3 million in 2010. As a percentage of net sales, SG&A expenses were 17.0% for 2011, as compared to 17.2 % for 2010. Excluding the expenses of Creative Tops, SG&A declined by $1.0 million. This decline in SG&A is the result of reductions of bad debt expense and certain office related expenses which substantially offset an increase in employee related and selling expenses.
SG&A expenses for 2011 for the Retail Direct segment were $9.2 million compared to $11.5 million for 2010. The decrease was primarily attributable to a decrease in employee, selling and office related expenses associated with the Company’s decision to terminate its print consumer catalog.
Unallocated corporate expenses for 2011 and 2010 were $13.3 million and $12.2 million, respectively. The increase was primarily attributable to acquisition related expenses of $2.0 million, which was partially offset by a reduction in other professional fees.

18
Interest expense
Interest expense for 2011 was $7.8 million as compared to $9.4 million for 2010. The decrease in interest expense was primarily attributable to lower average interest rates and lower average borrowings. The most significant factor in the rate reduction related to the retirement of the Notes.
Loss on early retirement of debt
During 2010, the Company entered into a new revolving credit facility and term loan and repurchased $50.9 million principal amount of its convertible senior notes. In connection with these activities, the Company incurred a non-cash pre-tax charge of approximately $764,000 consisting primarily of the write-off of deferred financing costs and unamortized debt discount related to the Company’s prior revolving credit facility and the Notes that were repurchased.
Income tax provision
The income tax provision was $6.1 million in 2011 and $4.6 million in 2010. The effective tax rates for the years ended December 31, 2011 and 2010 reflects taxes on income derived from U.S. sources and a reduction in valuation allowances related to the utilization of certain deferred tax assets during each year, for which a tax benefit was not previously recognized. The valuation allowance reversal in 2011 related to deferred tax assets for net operating losses which became realizable and deferred taxes for stock options, deferred rent and other temporary differences. The valuation allowance reversal reduced the effective tax rate by 8.2% and 19.8% in 2011 and 2010, respectively. The effective tax rates for 2011 and 2010 were 36.4% and 23.4% respectively.
Equity in earnings
Equity in earnings of Vasconia, net of taxes, was $2.9 million for 2011 and $2.7 million for 2010. Vasconia reported net income of $11.4 million in 2011 compared to $9.9 million in 2010. This increase in income from operations in 2011 compared to 2010 was primarily attributable to higher sales volumes in both the kitchenware products and aluminum products divisions.
Equity in earnings for 2011 also included equity income of $447,000 derived from the Company’s 50% joint venture investment in World Alliance Enterprises Limited and equity income of $20,000 earned since December 9, 2011, the date of the Company’s acquisition of a 40% equity interest in GSI.
2010 COMPARED TO 2009
Net Sales
Net sales for the year were $443.2 million, an increase of 6.8% compared to net sales of $415.0 million in 2009.
Net sales for the Wholesale segment in 2010 were $413.8 million, an increase of $24.8 million, or 6.4%, compared to net sales of $389.0 million in 2009. Net sales in 2009 included approximately $4.7 million of net sales in the going-out-of-business sales of a customer that was liquidated. Excluding the impact of the customer’s 2009 going-out-of business sales, net sales for the Wholesale segment in 2010 increased approximately $29.5 million, or 7.7%, compared to 2009. More specifically, excluding the impact of the customer’s 2009 going-out-of business sales, net sales in the Company’s Kitchenware product category were $208.5 million in 2010, an increase of $10.3 million, or 5.2%, as compared to $198.2 million of net sales in 2009, net sales for the Company’s Tabletop product category were $123.4 million in 2010, an increase of $12.6 million, or 11.4%, as compared to $110.8 million net sales in 2009, and net sales for the Company’s Home Solutions product category were $81.9 million in 2010, an increase of $6.6 million, or 8.8%, compared to $75.3 million net sales in 2009. Net sales to Wal-Mart Stores Inc. decreased $8.5 million in 2010 as compared to 2009, principally due to changes in Wal-Mart’s inventory management strategy, which have resulted in the maintenance of fewer product offerings in its stores during the first half of 2010. The decrease in net sales to Wal-Mart Stores Inc., within the Kitchenware, Tabletop and Home Solutions product categories, was substantially offset by an increase in sales to other retailers attributable to higher volume and the introduction of new products.
Net sales for the Retail Direct segment in 2010 were $29.4 million, an increase of $3.4 million, or 13.1%, compared to $26.0 million for 2009. The increase in net sales was primarily attributable to targeted sales promotions on the Company’s Pfaltzgraff® and Mikasa® websites and additional net sales from the Company’s

19
new Lifetime Sterling™ and Housewares Deals™ websites. The increase was partially offset by lower shipping income due to free shipping promotions.
Cost of sales
Cost of sales for 2010 was $273.8 million compared to $257.8 million for 2009. Cost of sales as a percentage of net sales was 61.8% for 2010 compared to 62.1% for 2009.
Cost of sales as a percentage of net sales for the Wholesale segment was 63.7% for 2010 compared to 64.3% for 2009. Gross margin in 2010 increased as a result of favorable product mix. Gross margin in 2009 was negatively affected by lower margin sales in the going-out-of-business sales of a customer that was liquidated. Cost of sales as a percentage of net sales for the Retail Direct segment increased to 34.9% in 2010 from 29.4% in 2009. The decrease in gross margin was principally due to an increase in free shipping promotions.
Distribution expenses
Distribution expenses for 2010 were $44.6 million compared to $43.3 million for 2009. Distribution expenses as a percentage of net sales were 10.1% in 2010 and 10.4% for 2009.
Distribution expenses as a percentage of net sales for the Wholesale segment was unchanged at 8.7% in both 2010 and 2009. Distribution expenses as a percentage of net sales for the Retail Direct segment were 29.2% for 2010 compared to 35.3% for 2009. The decrease is primarily attributable to improved labor efficiencies due to the Company’s exit from its York, Pennsylvania distribution center in July 2009.
Selling, general and administrative expenses
SG&A expenses for 2010 were $95.0 million, a decrease of 0.6% compared to $95.6 million for 2009.
SG&A expenses for 2010 for the Wholesale segment were $71.3 million, a decrease of $2.2 million or 3.0% compared to $73.5 million for 2009. As a percentage of net sales, SG&A expenses were 17.2% for 2010 compared to 18.9% for 2009. The decrease of 3.0% was attributable to the benefit of the 2009 restructuring activities and lower depreciation and amortization resulting from the write-off of fixed assets at exited facilities and a reduction of occupancy expenses primarily from consolidating showrooms and the Company’s continued expense reduction efforts. The decrease was offset by higher incentive compensation.
SG&A expenses for 2010 for the Retail Direct segment were $11.5 million compared to $10.8 million for 2009. The increase was in support of sales growth and was attributable to higher employee expenses and an increase in web related search expenses. This increase was partially offset by lower catalog related expenses.
Unallocated corporate expenses for 2010 and 2009 were $12.2 million and $11.3 million, respectively. The increase was primarily attributable to higher compensation expense, including incentive compensation and stock options.
Interest expense
Interest expense for 2010 was $9.4 million compared to $13.2 million for 2009. The decrease in interest expense was primarily attributable to lower average borrowings and lower interest rates resulting from the Company’s debt refinancing in 2010.
Loss on early retirement of debt
During 2010, the Company entered into a new revolving credit facility and term loan and repurchased $50.9 million principal amount of its Notes. In connection with these activities, the Company incurred a non-cash pre-tax charge of approximately $764,000 consisting primarily of the write-off of deferred financing costs and unamortized debt discount related to the Company’s prior revolving credit facility and the 4.75% convertible senior notes that were repurchased.

20
Income tax provision
The income tax provision for 2010 was $4.6 million compared to $1.9 million for 2009. The effective tax rates in 2010 and 2009 reflect a reduction in the valuation allowance related to certain deferred tax assets. The increase in the income tax provision resulted from higher income before income taxes offset by the effect of the valuation allowance reduction.
Equity in earnings of Vasconia
Equity in earnings of Vasconia, net of taxes, was $2.7 million for 2010 compared to $2.2 million for 2009. Vasconia reported net income of $9.9 million in 2010 compared to $8.3 million in 2009. The increase in net income in 2010 compared to 2009 was primarily attributable to the growth in sales of aluminum products during 2010. Increased margins from kitchenware sales during 2010 were offset by increases in selling and distribution expenses.
Extraordinary item
In 2010, the Company recorded an extraordinary gain of $2.5 million to eliminate the negative goodwill recorded in conjunction with the purchase of the business and certain assets of Mikasa, Inc.
CRITICAL ACCOUNTING POLICIES AND ESTIMATES
Management’s Discussion and Analysis of Financial Condition and Results of Operations discusses the Company’s consolidated financial statements which have been prepared in accordance with U.S. generally accepted accounting principles and with the instructions to Form 10-K and Article 10 of Regulation S-X. The preparation of these financial statements requires management to make estimates and assumptions that affect the reported amounts of assets and liabilities, the disclosure of contingent assets and liabilities at the date of the financial statements and the reported amounts of revenues and expenses during the reporting period. On an on-going basis, management evaluates its estimates and judgments based on historical experience and on various other factors that are believed to be reasonable under the circumstances, the results of which form the basis for making judgments about the carrying values of assets and liabilities that are not readily apparent from other sources. The Company evaluates these estimates including those related to revenue recognition, allowances for doubtful accounts, reserves for sales returns and allowances and customer chargebacks, inventory mark-down provisions, health insurance reserves, impairment of goodwill, tangible and intangible assets, stock option expense, accruals related to the Company’s tax positions and tax valuation allowances. Actual results may differ from these estimates using different assumptions and under different conditions. The Company’s significant accounting policies are more fully described in Note A of the Notes to the Consolidated Financial Statements included in Item 15. The Company believes that the following discussion addresses its most critical accounting policies, which are those that are most important to the portrayal of the Company’s consolidated financial condition and results of operations and require management’s most difficult, subjective and complex judgments.
Inventory
Inventory consists principally of finished goods sourced from third-party suppliers. Inventory also includes finished goods, work in process and raw materials related to the Company’s manufacture of sterling silver products. Inventory is priced using the lower of cost (first-in, first-out basis) or market method. The Company estimates the selling price of its inventory on a product by product basis based on the current selling environment. If the estimated selling price is lower than the inventory’s cost, the Company reduces the value of the inventory to its net realizable value.
Accounts Receivable
The Company periodically reviews the collectibility of its accounts receivable and establishes allowances for estimated losses that could result from the inability of its customers to make required payments. A considerable amount of judgment is required to assess the ultimate realization of these receivables including assessing the initial and on-going creditworthiness of the Company’s customers. The Company also maintains an allowance for anticipated customer deductions. The allowances for deductions are primarily based on contracts with customers. However, in certain cases the Company does not have a formal contract and, therefore, customer deductions are non-contractual. To evaluate the reasonableness of non-contractual customer deductions, the Company analyzes

21
currently available information and historical trends of deductions. If the financial conditions of the Company’s customers or general economic conditions were to deteriorate, resulting in an impairment of their ability to make payments or sell the Company’s products at reasonable sales prices, or the Company’s estimate of non-contractual deductions varied from actual deductions, revisions to allowances would be required, which could adversely affect the Company’s financial condition. Historically, the Company’s allowances have been appropriate and have not resulted in material unexpected charges.
Goodwill, intangible assets and long-lived assets
Goodwill and intangible assets deemed to have indefinite lives are not amortized but instead are subject to an annual impairment assessment.
Long-lived assets, including intangible assets deemed to have finite lives, are reviewed for impairment whenever events or changes in circumstances indicate that such assets may have been impaired. Impairment indicators include, among other conditions, cash flow deficits, historic or anticipated declines in revenue or operating profit or material adverse changes in the business climate that indicate that the carrying amount of an asset may be impaired. When impairment indicators are present, the Company compares the carrying value of the assets to the estimated discounted future cash flows expected to be generated by the assets. If the assets are considered to be impaired, the impairment to be recognized is measured by the amount by which the carrying amount of the assets exceeds the fair value of the assets. The Company considered indicators of impairment of its long-lived assets and determined that no such indicators were present at December 31, 2011.
Revenue recognition
The Company sells products wholesale, to retailers and distributors, and retail, directly to the consumer through the Company’s Retail Direct operations. Wholesale sales and Retail Direct sales are recognized when title passes to the customer, which is primarily at the shipping point for Wholesale sales and upon delivery to the customer for Retail Direct sales. Shipping and handling fees that are billed to customers in sales transactions are recorded in net sales. Net sales exclude taxes that are collected from customers and remitted to the taxing authorities. Allowances and accruals for various sales incentives and promotions, which include cooperative advertising, buydowns, volume rebates and discounts, are reflected as reductions in net sales.
Employee stock options
The Company accounts for its stock options through measurement of compensation expense for all share-based compensation granted to employees and non-employee directors at fair value on the date of grant and recognition of compensation expense over the related service period for awards expected to vest. The Company uses the Black-Scholes option valuation model to estimate the fair value of its stock options. The Black-Scholes option valuation model requires the input of highly subjective assumptions including the expected stock price volatility of the Company’s common stock and the risk-free interest rate. Changes in these subjective input assumptions can materially affect the fair value estimate of the Company’s stock options on the date of the option grant. The Company historically has not issued options which would be variable awards.
Employee healthcare
In 2011, the Company commenced self-insuring certain portions of its health insurance plan. The Company maintains an estimated accrual for unpaid claims and claims incurred but not yet reported (“IBNR”). Although management believes that it uses the best information available to estimate IBNR, actual claims may vary significantly from estimated claims.
Income taxes
The Company applies the required provisions for financial statement recognition, measurement and disclosure of uncertain tax positions recognized in the Company’s financial statements. Tax positions must meet a more-likely-than-not recognition threshold and measurement attribute for the financial statement recognition and measurement of a tax position taken. The valuation allowance is also calculated, established or maintained when it is “more likely than not” that all or a portion of deferred tax assets will not be realized.
22
Derivatives
The Company accounts for all derivative instruments on the balance sheet at fair value as either an asset or a liability. Changes in the fair value of derivatives that qualify as hedges and have been designated as part of a hedging relationship for accounting purposes have no net impact on earnings to the extent the derivative is considered perfectly effective in achieving offsetting changes in fair value or cash flows attributable to the risk being hedged, until the hedged item is recognized in earnings. For derivatives that do not qualify or are not designated as hedging instruments for accounting purposes, changes in fair value are recorded in operations.
LIQUIDITY AND CAPITAL RESOURCES
The Company’s principal sources of cash to fund liquidity needs are: (i) cash provided by operating activities and (ii) borrowings available under its revolving credit facility. The Company’s primary uses of funds consist of working capital requirements, capital expenditures and payments of principal and interest on its debt.
At December 31, 2011, the Company had cash and cash equivalents of $3.0 million as compared to $3.4 million at December 31, 2010, working capital was $128.8 million at December 31, 2011 compared to $121.7 million at December 31, 2010 and the current ratio was 2.84 to 1 at December 31, 2011 compared to 3.01 to 1 at December 31, 2010.
Borrowings under the Company’s revolving credit facility increased to $57.6 million at December 31, 2011 compared to $14.1 million at December 31, 2010. The increase in borrowings was primarily attributable to the acquisition of Creative Tops and the retirement of the Notes.
The Company believes that availability under the Revolving Credit Facility and cash flows from operations is sufficient to fund the Company’s operations for the next twelve months. However, if circumstances were to adversely change, the Company may seek alternative sources of liquidity including debt and equity financing. However, there can be no assurance that any such alternative sources would be available or sufficient. The Company closely monitors the creditworthiness of its customers. Based upon the evaluation of changes in customers’ creditworthiness, the Company may modify credit limits and/or terms of sale. However, notwithstanding the Company’s efforts to monitor its customers’ financial condition, the Company may be materially affected in the future.
In 2011, Wal-Mart Stores, Inc. (including Sam’s Club and Asda Superstore) accounted for 15% of the Company’s net sales. A material reduction of product orders by Wal-Mart Stores, Inc. could have significant adverse effects on the Company’s business and operating results and ultimately the Company’s liquidity, including the loss of predictability and volume production efficiencies associated with such a large customer.
Revolving Credit Facility
The Company had a $125.0 million secured credit agreement (the “Revolving Credit Facility”), which matured on June 9, 2015, with a bank group led by JPMorgan Chase Bank, N.A. On October 28, 2011, the Company amended the Revolving Credit Facility to increase the commitment of the lenders to $150.0 million and to, among other things, (i) increase the borrowing base limit for eligible trademarks to $25.0 million, (ii) revise the pricing grid margins for Alternative Base Rate loans to 1.0% to 1.75% and for Adjusted LIBO Rate and Overnight LIBO Rate loans to 2.0% to 2.75%, (iii) permit borrowings in multi-currencies, primarily U.S Dollars, Euros and Pounds Sterling, (iv) extend, subject to certain conditions, the maturity date to October 28, 2016, (v) increase the expansion option which permits the Company, subject to certain conditions including the consent of the Term Loan lender, to increase the maximum borrowing up to $200.0 million, (vi) revise EBITDA (as defined) to provide for the add back of acquisition related expenses, (vii) limit the domestic and foreign borrowing base, (viii) increase limitations on foreign debt and (ix) increase the limit for investments.
At December 31, 2011, borrowings outstanding under the Revolving Credit Facility were $57.6 million and open letters of credit were $1.4 million.
Borrowings under the Revolving Credit Facility bear interest, at the Company’s option, at one of the following rates: (i) the Alternate Base Rate, defined as the greater of the Prime Rate, Federal Funds Rate plus 0.5% or the Adjusted LIBOR rate plus 1.0%, plus a margin of 1.0% to 1.75%, or (ii) the Eurodollar Rate, defined as the Adjusted LIBOR Rate plus a margin of 2.0% to 2.75%. The respective margins are based upon availability. Interest rates on

23
outstanding borrowings at December 31, 2011 ranged from 2.5% to 4.5%. In addition, the Company pays a commitment fee of 0.375% on the unused portion of the Revolving Credit Facility. Availability under the Revolving Credit Facility was approximately $67.8 million, or 45%, of the total loan commitment at December 31, 2011. On July 15, 2011, the Company retired the outstanding $24.1 million aggregate principal amount of the Notes with borrowings from the Revolving Credit Facility.
The Company classified a portion of the Revolving Credit Facility as a current liability based on the Company’s intent and ability to repay the loan from cash flows from operations for which the payments are expected to occur within the year. Repayments and borrowings under the facility can vary significantly from planned levels based on cash flow needs and general economic conditions. The Company expects that it will continue to borrow and repay funds, subject to availability, under the facility based on working capital and other corporate needs.
Term Loan
The Company has a $40.0 million second lien credit agreement (the “Term Loan”), which matures on June 8, 2015, with Citibank, N.A.
The Term Loan bears interest, at the Company’s option, at one of the following rates: (i) the Alternate Base Rate, defined as the greater of the corporate rate published by the lender and the Federal Funds Rate plus 0.50% provided that such calculated rate is a minimum of 2.50%, plus a margin of 7.50%, or (ii) the Adjusted LIBOR rate which shall be a minimum of 1.50%, plus a margin of 8.50%. The interest rate on the outstanding borrowings at December 31, 2011 was 10.0%.
On October 28, 2011, the Company amended the Term Loan to, among other things, (i) revise Permitted Acquisitions (as defined), for which the lender gives prior written consent, to (a) allow Permitted Non-Control Acquisitions and (b) reduce the limit on Permitted Acquisitions, (ii) increase the minimum consolidated EBITDA covenant for the trailing twelve month periods ending March 31, 2012, June 30, 2012, September 30, 2012 and December 31, 2012 and thereafter to $31.0 million, $31.0 million, $33.0 million and $34.0 million, respectively, (iii) increase the limit for other investments, (iv) increase limitations on foreign subsidiary debt, (v) revise EBITDA (as defined) to provide for the add back of acquisition related expenses, and (vi) revise the limitation on indebtedness incurred to finance acquisitions.
The Term Loan requires the Company to have EBITDA, as defined, of not less than $30.0 million for the trailing four fiscal quarters through December 31, 2011 and limits capital expenditures to $7.5 million for the year ended December 31, 2011. The Company was in compliance with these financial covenants at December 31, 2011.
The Company’s Consolidated EBITDA for the four quarters ended December 31, 2011 was $38.1 million, as follows:
Consolidated EBITDA for the four quarters ended
December 31, 2011 (in thousands)
Three months ended December 31, 2011 $14,342 Three months ended September 30, 2011 13,524 Three months ended June 30, 2011 7,512 Three months ended March 31, 2011 2,720 Total for the four quarters $38,098
Capital expenditures for the year ended December 31, 2011 were $5.0 million.

24
Non-GAAP financial measure
Consolidated EBITDA is a non-GAAP financial measure within the meaning of Regulation G promulgated by the Securities and Exchange Commission. The following is a reconciliation of net income as reported to Consolidated EBITDA for the three and twelve months ended December 31, 2011 and 2010:
Three Months Ended
December 31, Year Ended
December 31,
2011 2010 2011 2010
(in thousands)
Net income as reported $ 5,419 $ 13,928 $ 14,066 $ 20,261 Subtract out: Undistributed equity earnings (925) (733) (2,896) (2,321)
Extraordinary item, net of taxes ― (2,477) ― (2,477)Add back:
Provision for income taxes 3,513 1,600 6,122 4,602 Interest expense 1,951 2,188 7,758 9,351 Depreciation and amortization 2,336 2,292 8,397 9,810 Stock compensation expense 690 746 2,795 2,928 Loss on early retirement of debt ― ― ― 764 Permitted acquisition related expenses 1,358 ― 1,856 ―
Consolidated EBITDA $14,342 $ 17,544 $38,098 $ 42,918
Convertible Notes
The Company had outstanding $24.1 million aggregate principal amount of 4.75% Convertible Senior Notes (“the Notes”) at December 31, 2010. The Company had classified the Notes as a long-term liability based on the Company’s intent and ability to refinance the Notes using proceeds from the Revolving Credit Facility.
In June 2010, the Company purchased $50.9 million principal amount of the Notes in privately negotiated transactions for $51.0 million, reducing the aggregate principal amount to $24.1 million. On July 15, 2011, the Company retired its convertible senior notes with borrowings from the Revolving Credit Facility.
Dividends
In March 2011, the Company determined that it would resume paying cash dividends on its outstanding shares of common stock which were suspended in February 2009. The Board of Directors declared a dividend of $0.025 per share payable on May 16, 2011, August 16, 2011, November 29, 2011, February 15, 2012 and May 15, 2012.
Operating activities
Net cash provided by operating activities was $12.2 million in 2011 as compared to net cash provided by operating activities of $30.1 million in 2010. The decrease was primarily attributable to an increase in inventory, payments of accounts payable and accrued expenses and a reduction in net income.
Investing activities
Net cash used in investing activities was $30.6 million in 2011 as compared to $2.8 million in 2010. The increase in cash used in investing activities related to: i) cash consideration of $20.6 million paid for the November 2011 acquisition of Creative Tops, ii) cash consideration of $5.0 million paid for the investment in GSI (does not include contingent consideration payable in 2012), iii) an investment in Housewares Corporation of Asia of $0.1 million and iv) purchase of computer software and hardware, as well as, equipment purchases for the Company’s distribution facilities.

25
Financing activities
Net cash provided by financing activities was $17.9 million in 2011 as compared to net cash used in financing activities of $24.6 million in 2010. The Company borrowed $43.5 million from its Revolving Credit Facility in 2011 as compared to net borrowings of $29.5 million in 2010. The proceeds from the 2011 borrowings were principally used to: i) finance the Creative Tops acquisition, ii) finance the Company’s investment in GSI, iii) retire the Notes and iv) pay acquisition related costs of $2.0 million. In the year ended December 31, 2010, the Company entered into the Revolving Credit Facility and Term Loan and utilized funds from these new facilities to repay amounts outstanding under the Company’s prior credit facility and repurchase $50.9 million principal amount of the Notes for $51.0 million.
Contractual obligations
As of December 31, 2011, the Company’s contractual obligations were as follows (in thousands):
Payment due by period
Total
Less than
1 year
1-3 years
3-5 years
More than
5 years Operating leases $ 98,916 $ 13,530 $ 26,113 $ 26,108 $ 33,165 Short-term debt 15,000 15,000 ― ― ― Interest on short-term debt 382 382 ― ― ― Long-term debt 82,625 ― ― 82,625 ― Interest on long-term debt 20,110 5,697 10,624 3,789 ― Purchase commitments 6,276 6,276 ― ― ― Minimum royalty payments 9,256 5,680 752 573 2,251 Post retirement benefits 3,391 144 262 321 2,664
Total $ 235,956 $ 46,709 $ 37,751 $ 113,416 $ 38,080
Item 7A. Quantitative and Qualitative Disclosures About Market Risk
Market risk represents the risk of loss that may impact the consolidated financial position, results of operations or cash flows of the Company. The Company is exposed to market risk associated with changes in interest rates and foreign currency exchange rates. The Company’s Revolving Credit Facility and Term Loan bear interest at variable rates; and, therefore, the Company is subject to increases and decreases in interest expense resulting from fluctuations in interest rates. The Company has foreign operations through its acquisitions, investments and strategic alliances which have operations in the United Kingdom, Mexico, Canada, Brazil, Hong Kong and China; therefore, the Company is subject to increases and decreases in its investments resulting from the impact of fluctuations in foreign currency exchange rates.

26
Item 8. Financial Statements and Supplementary Data
The Company’s Consolidated Financial Statements as of and for the year ended December 31, 2011 in Item 15 commencing on page F-1 are incorporated herein by reference.
The following tables set forth certain unaudited consolidated quarterly statement of operations data for the eight quarters ended December 31, 2011. This information is unaudited, but in the opinion of management, it has been prepared substantially on the same basis as the audited consolidated financial statements appearing elsewhere in this Annual Report on Form 10-K and all necessary adjustments, consisting only of normal recurring adjustments, have been included in the amounts stated below to present fairly the unaudited consolidated quarterly results of operations. The consolidated quarterly data should be read in conjunction with the Company’s audited consolidated financial statements and the notes to such statements appearing elsewhere in this Annual Report. The results of operations for any quarter are not necessarily indicative of the results of operations for any future period:
Year ended December 31, 2011
First quarter
Second quarter
Third quarter
Fourth quarter
(in thousands, except per share data) Net sales $ 91,773 $ 90,371 $ 124,663 $ 137,611
Gross profit 33,390 34,046 44,239 50,685
Income (loss) from operations (23) 4,351 10,298 9,958
Net income (loss) (949) 2,063 7,533 5,419
Basic income (loss) per common share (0.08) 0.17 0.62 0.45
Diluted income (loss) per common share (0.08) 0.17 0.60 0.43
Year ended December 31, 2010
First quarter
Second quarter (1)
Third quarter
Fourth quarter (2)
(in thousands, except per share data) Net sales $ 88,736 $ 86,889 $ 124,918 $ 142,628
Gross profit 34,784 33,947 46,156 54,510
Income from operations 2,527 2,522 10,229 14,505
Income (loss) before extraordinary item 729 (981) 6,585 11,451
Extraordinary item, net of taxes ― ― ― 2,477
Net income (loss) 729 (981) 6,585 13,928
Basic income (loss) per common share before extraordinary item 0.06 (0.08) 0.55 0.96
Basic income per common share of extraordinary item ― ― ― 0.20
Basic income (loss) per common share 0.06 (0.08) 0.55 1.16
Diluted income (loss) per common share before extraordinary item 0.06 (0.08) 0.52 0.87
Diluted income per common share of extraordinary item ― ― ― 0.20
Diluted income (loss) per common share 0.06 (0.08) 0.52 1.07
Notes:
(1) The Company recognized a loss on the early retirement of debt of $764,000 in the second quarter of 2010. (2) The Company recognized an extraordinary gain of $2.5 million during the fourth quarter of 2010.

27
Item 9. Changes in and Disagreements with Accountants on Accounting and Financial Disclosure
None
Item 9A. Controls and Procedures
(a) Evaluation of Disclosure Controls and Procedures
The Chief Executive Officer and the Chief Financial Officer of the Company (its principal executive officer and principal financial officer, respectively) have concluded, based on their evaluation as of December 31, 2011, that the Company’s controls and procedures are effective to ensure that information required to be disclosed by the Company in the reports filed by it under the Securities and Exchange Act of 1934, as amended, is recorded, processed, summarized and reported within the time periods specified in the Securities and Exchange Commission’s rules and forms, and include controls and procedures designed to ensure that information required to be disclosed by the Company in such reports is accumulated and communicated to the Company’s management, including the Chief Executive Officer and Chief Financial Officer of the Company, as appropriate to allow timely decisions regarding required disclosure.
(b) Changes in Internal Controls
There were no changes in the Company’s internal control over financial reporting that occurred during the Company’s most recent fiscal quarter that has materially affected, or is reasonably likely to materially affect, the Company’s internal control over financial reporting.
Management’s Report on Internal Control over Financial Reporting
Management of the Company is responsible for establishing and maintaining effective internal control over financial reporting and for performing an assessment of the effectiveness of internal control over financial reporting as of December 31, 2011. Internal control over financial reporting is defined in Rule 13a-15(f) or 15d-15(f) promulgated under the Exchange Act as a process designed by, or under the supervision of, the Company’s principle executive and principal financial officers and effected by the Company’s Board of Directors, management and other personnel, to provide reasonable assurance regarding the reliability of financial reporting and the preparation of financial statements for external purposes in accordance with U.S. generally accepted accounting principles.
Internal control over financial reporting includes those policies and procedures that (1) pertain to the maintenance of records that, in reasonable detail, accurately and fairly reflect the transactions and dispositions of the assets of the Company; (2) provide reasonable assurance that transactions are recorded as necessary to permit the preparation of financial statements in accordance with U.S. generally accepted accounting principles and that receipts and expenditures of the Company are being made only in accordance with authorizations of management and directors of the Company; and (3) provide reasonable assurance regarding prevention or timely detection of unauthorized acquisition, use or disposition of the Company’s assets that could have a material effect on the financial statements.
All internal control systems, no matter how well designed, have inherent limitations. Because of the inherent limitations, internal control over financial reporting may not prevent or detect misstatements. Projections of any evaluation of effectiveness to future periods are subject to the risk that controls may become inadequate because of changes in conditions or the degree of compliance with the policies or procedures may deteriorate. Accordingly, even those systems determined to be effective can provide only reasonable assurance with respect to financial statement preparation and presentation.
Management performed an assessment of the effectiveness of the Company’s internal control over financial reporting as of December 31, 2011 using the criteria set forth in the Internal Control-Integrated Framework issued by the Committee of Sponsoring Organizations of the Treadway Commission. Based on this assessment, management has determined that the Company’s internal control over financial reporting as of December 31, 2011 is effective.
The effectiveness of the Company’s internal control over financial reporting as of December 31, 2011 has been audited by Ernst & Young LLP, an independent registered public accounting firm, as stated in their report.

28
Report of Independent Registered Public Accounting Firm
To the Board of Directors and Stockholders of Lifetime Brands, Inc. We have audited Lifetime Brands Inc.’s internal control over financial reporting as of December 31, 2011, based on criteria established in Internal Control—Integrated Framework issued by the Committee of Sponsoring Organizations of the Treadway Commission (the COSO criteria). Lifetime Brands Inc.’s management is responsible for maintaining effective internal control over financial reporting, and for its assessment of the effectiveness of internal control over financial reporting included in the accompanying Management Report on Internal Control over Financial Reporting. Our responsibility is to express an opinion on the company’s internal control over financial reporting based on our audit. We conducted our audit in accordance with the standards of the Public Company Accounting Oversight Board (United States). Those standards require that we plan and perform the audit to obtain reasonable assurance about whether effective internal control over financial reporting was maintained in all material respects. Our audit included obtaining an understanding of internal control over financial reporting, assessing the risk that a material weakness exists, testing and evaluating the design and operating effectiveness of internal control based on the assessed risk, and performing such other procedures as we considered necessary in the circumstances. We believe that our audit provides a reasonable basis for our opinion. A company’s internal control over financial reporting is a process designed to provide reasonable assurance regarding the reliability of financial reporting and the preparation of financial statements for external purposes in accordance with generally accepted accounting principles. A company’s internal control over financial reporting includes those policies and procedures that (1) pertain to the maintenance of records that, in reasonable detail, accurately and fairly reflect the transactions and dispositions of the assets of the company; (2) provide reasonable assurance that transactions are recorded as necessary to permit preparation of financial statements in accordance with generally accepted accounting principles, and that receipts and expenditures of the company are being made only in accordance with authorizations of management and directors of the company; and (3) provide reasonable assurance regarding prevention or timely detection of unauthorized acquisition, use, or disposition of the company’s assets that could have a material effect on the financial statements. Because of its inherent limitations, internal control over financial reporting may not prevent or detect misstatements. Also, projections of any evaluation of effectiveness to future periods are subject to the risk that controls may become inadequate because of changes in conditions, or that the degree of compliance with the policies or procedures may deteriorate. In our opinion, Lifetime Brands, Inc. maintained, in all material respects, effective internal control over financial reporting as of December 31, 2011 based on the COSO criteria. We also have audited, in accordance with the standards of the Public Company Accounting Oversight Board (United States), the consolidated balance sheets of Lifetime Brands, Inc. as of December 31, 2011 and 2010, and the related consolidated statements of operations, stockholders’ equity, and cash flows for each of the three years in the period ended December 31, 2011 of Lifetime Brands, Inc. and our report dated March 9, 2012 expressed an unqualified opinion thereon.
/s/ ERNST & YOUNG LLP
Jericho, New York March 9, 2012

29
Item 9B. Other Information
Not applicable
PART III Items 10, 11, 12, 13 and 14
The information required under these items is contained in the Company’s 2012 Proxy Statement, which will be filed with the Securities and Exchange Commission within 120 days after the close of the Company’s fiscal year covered by this Annual Report on Form 10-K and is herein incorporated by reference.

30
PART IV
Item 15. Exhibits and Financial Statement Schedules
(a) See Financial Statements and Financial Statement Schedule on page F-1.
(b) Exhibits*:
Exhibit No. Description
3.1 Second Restated Certificate of Incorporation of the Company (incorporated by reference to the Registrant’s Annual Report on Form 10-K for the year ended December 31, 2005)**
3.2 Amended and Restated By-Laws of the Company (incorporated by reference to the Registrant’s Form 8-K dated November 5, 2007)**
4.1 Indenture dated as of June 27, 2006, Lifetime Brands, Inc. as issuer, and HSBC Bank USA, National Association as trustee, $75,000,000 4.75% Convertible Senior Notes due 2011 (incorporated by reference to the Registrant’s registration statement No. 333-137575 on Form S-3)**
10.1 License agreement dated December 14, 1989 between the Company and Farberware, Inc. (incorporated by reference to the Registrant’s registration statement No. 33-40154 on Form S-1)**
10.2 Evan Miller employment agreement dated July 1, 2003 (incorporated by reference to the Registrant’s Form 10-Q dated September 30, 2003)**
10.3 Employment agreement dated May 2, 2006 between Lifetime Brands, Inc. and Jeffrey Siegel (incorporated by reference to the Registrant’s Form 8-K dated May 8, 2006)**
10.4 Lease agreement dated as of May 10, 2006 between AG Metropolitan Endo, L.L.C and Lifetime Brands, Inc. for the property located at 1000 Stewart Avenue in Garden City, New York (incorporated by reference to the Registrant’s Form 8-K dated May 15, 2006)**
10.5 Amended 2000 Long-Term Incentive Plan (incorporated by reference to the Registrant’s Form 8-K dated June 9, 2006)**
10.6 Amended 2000 Incentive Bonus Compensation Plan (incorporated by reference to the Registrant’s Form 8-K dated June 9, 2006)**
10.7 First Amendment to the Lease Agreement dated as of May 10, 2006 between AG Metropolitan Endo, L.L.C and Lifetime Brands, Inc. for the property located at 1000 Stewart Avenue in Garden City, New York (incorporated by reference to the Registrant’s Form 10-Q dated September 30, 2006)**
10.8 Employment agreement dated June 28, 2007 between Lifetime Brands, Inc. and Laurence Winoker (incorporated by reference to the Registrant’s Form 8-K dated July 3, 2007)**
10.9 Shares Subscription Agreement by and among Lifetime Brands, Inc., Ekco, S.A.B. and Mr. José Ramón Elizondo Anaya and Mr. Miguel Ángel Huerta Pando, dated as of June 8, 2007 (incorporated by reference to the Registrant’s Form 8-K dated June 11, 2007)**

31
10.10 Lease Agreement between Granite Sierra Park LP and Lifetime Brands, Inc. dated June 29, 2007 (incorporated by reference to the Registrant’s Form 8-K dated July 6, 2007)**
10.11 Evan Miller Amendment of Employment Agreement dated June 29, 2007 (incorporated by reference to the Registrant’s Form 8-K dated July 3, 2007)**
10.12 Amendment No.1 dated September 5, 2007 to the Shares Subscription Agreement by and among Lifetime Brands, Inc., Ekco, S.A.B. and Mr. José Ramón Elizondo Anaya and Mr. Miguel Ángel Huerta Pando, dated as of June 8, 2007 (incorporated by reference to the Registrant’s Annual Report on Form 10-K for the year ended December 31, 2008)**
10.13 Amendment to the Lifetime Brands, Inc. 2000 Long-Term Incentive Plan dated November 1, 2007 (incorporated by reference to the Registrant’s Form 8-K dated November 5, 2007)**
10.14 Amendment No. 2 to Second Amended and Restated Credit Agreement by and among Lifetime Brands, Inc., Lenders party hereto, Citibank, N.A. and Wachovia Bank, National Association, as Co-Documentation Agents, JP Morgan Chase Bank, N.A., as Syndication Agent, and HSBC Bank USA, National Association, as Administrative Agent (incorporated by reference to the Registrant’s Form 8-K/A dated April 22, 2008)**
10.15 Asset Purchase Agreement between Mikasa, Inc. and Lifetime Brands, Inc. dated June, 6 2008 (incorporated by reference to the Registrant’s Form 10-Q dated June 30, 2008)**
10.16 Amendment No. 2 dated September 25, 2008 to the Shares Subscription Agreement by and among Lifetime Brands, Inc., Ekco, S.A.B. and Mr. José Ramón Elizondo Anaya and Mr. Miguel Ángel Huerta Pando, dated as of June 8, 2007 (incorporated by reference to the Registrant’s Annual Report on Form 10-K for the year ended December 31, 2008)**
10.17 Amendment to the Company’s Second Amended and Restated Credit Agreement, Amendment No. 3, dated September 29, 2008 (incorporated by reference to the Registrant’s Form 8-K dated September 30, 2008)**
10.18 Forbearance Agreement and Amendment No. 4, dated as of February 12, 2009, by and among Lifetime Brands, Inc., the several financial institutions parties thereto and HSBC Bank USA, National Association, as Administrative Agent for the Lenders (incorporated by reference to the Registrant’s Form 8-K dated February 19, 2009)**
10.19 Amendment to Forbearance Agreement and Amendment No. 4, dated as of March 6, 2009, by and among Lifetime Brands, Inc., the several financial institutions parties thereto and HSBC Bank USA, National Association, as Administrative Agent for the Lenders (incorporated by reference to the Registrant’s Form 8-K dated March 10, 2009)**
10.20 Waiver and Amendment No. 5 to Second Amended and Restated Credit Agreement, dated as of March 31, 2009, by and among Lifetime Brands, Inc., the several financial institutions parties thereto and HSBC Bank USA, National Association, as Administrative Agent for the Lenders (incorporated by reference to the Registrant’s Annual Report on Form 10-K for the year ended December 31, 2008)**
10.21 Amendment of the Lifetime Brands, Inc. 2000 Long-Term Incentive Plan dated June 11, 2009 (incorporated by reference to the Registrant’s Form 8-K dated June 12, 2009)**
10.22 Amended and Restated Employment Agreement, dated August 10, 2009 by and between Lifetime Brands, Inc. and Ronald Shiftan (incorporated by reference to the Registrant’s Form 8-K dated August 12, 2009)**
10.23 Amendment of Employment Agreement, dated August 10, 2009 by and between Lifetime Brands, Inc. and Jeffrey Siegel (incorporated by reference to the Registrant’s Form 8-K dated August 12, 2009)**
32
10.24 Waiver to the Second Amended and Restated Credit Agreement, dated as of October 13, 2009, by and among Lifetime Brands, Inc., the several financial institutions parties thereto and HSBC Bank USA, National Association, as Administrative Agent and Co-Collateral Agent for the Lenders (incorporated by reference to the Registrant’s Form 8-K dated October 16, 2009)**
10.25 Amendment No. 6 to Second Amended and Restated Credit Agreement, dated as of October 30, 2009, by and among Lifetime Brands, Inc., the several financial institutions parties thereto and HSBC Bank USA, National Association, as Administrative Agent for the Lenders (incorporated by reference to the Registrant’s Form 8-K dated November 2, 2009)**
10.26 Termination of Lease and Sublease Agreement dated December 1, 2009 by and between Crispus Attucks Association of York, Pennsylvania, Inc. and Lifetime Brands, Inc. (incorporated by reference to the Registrant’s Form 8-K dated December 2, 2009)**
10.27 Amendment No. 7 to Second Amended and Restated Credit Agreement by and among Lifetime Brands, Inc., Lenders party hereto, Citibank, N.A. and Wachovia Bank, National Association, as Co-Documentation Agents, JP Morgan Chase Bank, N.A., as Syndication Agent, and HSBC Bank USA, National Association, as Administrative Agent (incorporated by reference to the Registrant’s Form 8-K dated February 12, 2010)**
10.28 Amendment to Employment Agreement, dated March 8, 2010, between Lifetime Brands, Inc. and Laurence Winoker (incorporated by reference to the Registrant’s Form 8-K dated March 10, 2010)**
10.29 Amended and Restated Executive Employment Agreement, dated March 8, 2010, between Lifetime Brands, Inc. and Craig Phillips (incorporated by reference to the Registrant’s Form 8-K dated March 10, 2010)**
10.30 Credit Agreement, dated as of June 9, 2010, among Lifetime Brands, Inc., JPMorgan Chase Bank, N.A., as administrative agent and a co-collateral agent, and HSBC Business Credit (USA) Inc., as syndication agent and a co-collateral agent, with exhibits (incorporated by reference to the Registrant’s Form 8-K dated June 15, 2010)**
10.31 Second Lien Credit Agreement, dated as of June 9, 2010, among Lifetime Brands, Inc. and Citibank, N.A., as administrative agent and collateral agent, with exhibits (incorporated by reference to the Registrant’s Form 8-K dated June 15, 2010)**
10.32 Second Amendment of Employment Agreement, dated November 9, 2010, by and between Lifetime Brands, Inc. and Jeffrey Siegel (incorporated by reference to the Registrant’s Annual Report on Form 10-K for the year ended December 31, 2010)**
10.33 Amendment of Amended and Restated Employment Agreement, dated November 9, 2010, by and between Lifetime Brands, Inc. and Ronald Shiftan (incorporated by reference to the Registrant’s Annual Report on Form 10-K for the year ended December 31, 2010)**
10.34 Amendment No. 1 to the Second Lien Credit Agreement, dated as of March 9, 2011, among Lifetime Brands, Inc. and Citibank, N.A., as administrative agent and collateral agent (incorporated by reference to the Registrant’s Annual Report on Form 10-K for the year ended December 31, 2010)**
10.35 Employment Agreement, dated March 4, 2011, by and between Lifetime Brands, Inc. and Jeffrey Siegel (incorporated by reference to the Registrant’s Form 8-K dated March 8, 2011)**
10.36 Amended and Restated Credit Agreement, dated as of October 28, 2011, by and among Lifetime Brands, Inc., the Foreign Subsidiary Borrowers parties thereto, the Other Loan Parties hereto, the Lenders party hereto JP Morgan Chase Bank, N.A., as Administrative Agent and a Co-Collateral Agent, and HSBC Bank USA, National Association, as Syndication Agent and a Co-Collateral Agent (incorporated by reference to the Registrant’s Form 8-K dated November 3, 2011)**
10.37 Amendment No. 2 of the Second Lien Credit Agreement, dated as of October 28, 2011,by and among Lifetime Brands, Inc. and Citibank, N.A., as administrative agent and collateral agent, with exhibits (incorporated by reference to the Registrant’s Form 8-K dated November 3, 2011)**

33
10.38 Share Purchase Agreement, dated November 4, 2011, by and among Lifetime Brands, Inc. and Creative Tops Holding Limited and Creative Tops Far East Limited (incorporated by reference to the Registrant’s Form 8-K dated November 8, 2011)**
14.1 Code of Conduct dated March 25, 2004, as amended on June 7, 2007 (incorporated by reference to the Registrant’s Form 8-K dated June 7, 2007)**
18.1 Letter from Ernst & Young LLP stating an acceptable change in accounting method for the impairment of goodwill dated October 28, 2008 (incorporated by reference to the Registrant’s Form 10-Q dated September, 30 2008)**
21.1 Subsidiaries of the registrant***
23.1 Consent of Ernst & Young LLP***
31.1 Certification by Jeffrey Siegel, Chief Executive Officer and President, pursuant to Rule 13a-14(a) or Rule 15d-14(a) of the Securities and Exchange Act of 1934, as adopted pursuant to Section 302 of the Sarbanes-Oxley Act of 2002***
31.2 Certification by Laurence Winoker, Senior Vice President – Finance, Treasurer and Chief Financial Officer, pursuant to Rule 13a-14(a) or Rule 15d-14(a) of the Securities and Exchange Act of 1934, as adopted pursuant to Section 302 of the Sarbanes-Oxley Act of 2002***
32.1 Certification by Jeffrey Siegel, Chief Executive Officer and President, and Laurence Winoker, Senior Vice President – Finance, Treasurer and Chief Financial Officer, pursuant to 18 U.S.C. Section 1350, as adopted pursuant to Section 906 of the Sarbanes-Oxley Act of 2002****
99.1 Grupo Vasconia, S.A.B. (formerly Ekco, S.A.B.), Report of Independent Registered Accounting Firm ***
99.2 Grupo Vasconia, S.A.B. (formerly Ekco, S.A.B.), Report of Independent Registered Accounting Firm (incorporated by reference to the Registrant’s Annual Report on Form 10-K for the year ended December 31, 2010)
101 Interactive data files pursuant to Rule 405 of Regulation S-T. The following materials from Lifetime Brands, Inc.’s Annual Report on Form 10-K for the year ended December 31, 2011 formatted in XBRL (eXtensible Business Reporting Language): (i) the Consolidated Balance Sheets, (ii) the Consolidated Statements of Operations, (iii) the Consolidated Statements of Stockholders’ Equity, (iv) the Consolidated Statements of Cash Flows and (v) Notes to the Consolidated Financial Statements, tagged as blocks of text.
Notes to exhibits:
The Company will furnish a copy of any of the exhibits listed above upon payment of $5.00 per exhibit to cover the cost of the Company furnishing the exhibit.
** Incorporated by reference.
*** Filed herewith.
**** This exhibit is being “furnished” pursuant to Item 601(b)(32) of SEC Regulation S-K and is not deemed “filed” with the Securities and Exchange Commission and is not incorporated by reference in any filing of the Company under the Securities Act of 1933 or the Securities Exchange Act of 1934.
(c) Financial Statement Schedules — the response to this portion of Item 15 is submitted as a separate section
of this report.

34
SIGNATURES Pursuant to the requirements of Section 13 or 15(d) of the Securities Exchange Act of 1934, the registrant has duly caused this report to be signed on its behalf by the undersigned, thereunto duly authorized. Lifetime Brands, Inc.
/s/ Jeffrey Siegel Jeffrey Siegel
Chairman of the Board of Directors, Chief Executive Officer, President and Director
Pursuant to the requirements of the Securities Exchange Act of 1934, this report has been signed below by the following persons on behalf of the registrant and in the capacities and on the dates indicated. Signature Title Date /s/ Jeffrey Siegel Chairman of the Board of Directors, March 9, 2012 Jeffrey Siegel Chief Executive Officer, President and Director
/s/ Ronald Shiftan Vice Chairman of the Board of Directors, March 9, 2012 Ronald Shiftan Chief Operating Officer and Director
/s/ Laurence Winoker Senior Vice President – Finance, March 9, 2012 Laurence Winoker Treasurer and Chief Financial Officer (Principal Financial and Accounting Officer) /s/ Craig Phillips Senior Vice-President – Distribution March 9, 2012 Craig Phillips and Director /s/ David Dangoor Director March 9, 2012 David Dangoor /s/ Michael Jeary Director March 9, 2012 Michael Jeary /s/ John Koegel Director March 9, 2012 John Koegel /s/ Cherrie Nanninga Director March 9, 2012 Cherrie Nanninga /s/ William Westerfield Director March 9, 2012 William Westerfield

F-1
Item 15
LIFETIME BRANDS, INC.
LIST OF FINANCIAL STATEMENTS AND FINANCIAL STATEMENT SCHEDULE
The following consolidated financial statements of Lifetime Brands, Inc. are filed as part of this report under Item 8 – Financial Statements and Supplementary Data.
Report of Independent Registered Public Accounting Firm F-2
Consolidated Balance Sheets as of December 31, 2011 and 2010 F-3
Consolidated Statements of Operations for the Years ended December 31, 2011, 2010 and 2009 F-4
Consolidated Statements of Stockholders’ Equity for the Years ended December 31, 2011, 2010, and 2009 F-5
Consolidated Statements of Cash Flows for the Years ended December 31, 2011, 2010, and 2009 F-6
Notes to Consolidated Financial Statements F-7 The following consolidated financial statement schedule of Lifetime Brands, Inc. required pursuant to Item 15(a) is submitted herewith: Schedule II – Valuation and Qualifying Accounts S-1 All other financial schedules are not required under the related instructions or are inapplicable, and therefore have been omitted.
The unaudited supplementary data regarding quarterly results of operations are incorporated by reference to the information set forth in Item 8 – Financial Statements and Supplementary Data.

F-2
Report of Independent Registered Public Accounting Firm
To the Board of Directors and Stockholders of Lifetime Brands, Inc. We have audited the accompanying consolidated balance sheets of Lifetime Brands, Inc. (the “Company”) as of December 31, 2011 and 2010, and the related consolidated statements of operations, stockholders’ equity, and cash flows for each of the three years in the period ended December 31, 2011. Our audits also included the financial statement schedule listed in the Index at Item 15(a). These financial statements and schedule are the responsibility of the Company’s management. Our responsibility is to express an opinion on these financial statements and schedule based on our audits. We did not audit the financial statements of Grupo Vasconia, S.A.B. and Subsidiaries (a corporation in which the Company has a 30% interest), which statements have been audited by other auditors whose report has been furnished to us, and our opinion on the consolidated financial statements, insofar as it relates to the amounts included for Grupo Vasconia, S.A.B. and Subsidiaries, is based solely on the report of the other auditors. In the consolidated financial statements, the Company’s investment in Grupo Vasconia, S.A.B. and Subsidiaries is stated at $26.3 million and $24.1 million at December 31, 2011 and 2010, respectively, and the Company’s equity in the net income of Grupo Vasconia, S.A.B. and Subsidiaries is stated at $2.9 million for the year ended December 31, 2011, $2.7 million for the year ended December 31, 2010 and $2.2 million for the year ended December 31, 2009. We conducted our audits in accordance with the standards of the Public Company Accounting Oversight Board (United States). Those standards require that we plan and perform the audit to obtain reasonable assurance about whether the financial statements are free of material misstatement. An audit includes examining, on a test basis, evidence supporting the amounts and disclosures in the financial statements. An audit also includes assessing the accounting principles used and significant estimates made by management, as well as evaluating the overall financial statement presentation. We believe that our audits and the report of other auditors provide a reasonable basis for our opinion. In our opinion, based on our audits and the report of other auditors, the financial statements referred to above present fairly, in all material respects, the consolidated financial position of Lifetime Brands, Inc. at December 31, 2011 and 2010, and the consolidated results of its operations and its cash flows for each of the three years in the period ended December 31, 2011, in conformity with U.S. generally accepted accounting principles. Also, in our opinion, the related financial statement schedule, when considered in relation to the basic financial statements taken as a whole, presents fairly in all material respects the information set forth therein. We also have audited, in accordance with the standards of the Public Company Accounting Oversight Board (United States), Lifetime Brands, Inc.’s internal control over financial reporting as of December 31, 2011, based on criteria established in Internal Control – Integrated Framework issued by the Committee of Sponsoring Organizations of the Treadway Commission and our report dated March 9, 2012 expressed an unqualified opinion thereon. /s/ ERNST & YOUNG LLP Jericho, New York March 9, 2012

F-3
LIFETIME BRANDS, INC. CONSOLIDATED BALANCE SHEETS
(in thousands-except share data)
December 31,
2011 2010
ASSETS CURRENT ASSETS Cash and cash equivalents $ 2,972 $ 3,351 Accounts receivable, less allowances of $4,602 at 2011 and $12,611 at 2010 77,749
72,795
Inventory (Note N) 110,337 99,935 Prepaid expenses and other current assets 5,264 5,048
Deferred income taxes (Note I) 2,475 1,124 TOTAL CURRENT ASSETS 198,797 182,253 PROPERTY AND EQUIPMENT, net (Note N) 34,324 36,093 INTANGIBLE ASSETS, net (Note D) 46,937 30,818 EQUITY INVESTMENTS (Note C) 34,515 24,068 OTHER ASSETS 4,172 4,354 TOTAL ASSETS $ 318,745 $ 277,586 LIABILITIES AND STOCKHOLDERS’ EQUITY CURRENT LIABILITIES
Revolving Credit Facility (Note E) $ 15,000 $ 4,100 Accounts payable 18,985 19,414 Accrued expenses (Note N) 33,877 31,962 Income taxes payable (Note I) 2,100 5,036 TOTAL CURRENT LIABILITIES 69,962 60,512 DEFERRED RENT & OTHER LONG-TERM LIABILITIES (Note N) 14,598 14,482 DEFERRED INCOME TAXES (Note I) 5,385 1,429 REVOLVING CREDIT FACILITY (Note E) 42,625 10,000 TERM LOAN (Note E) 40,000 40,000 4.75% CONVERTIBLE SENIOR NOTES (Note E) ― 23,557 STOCKHOLDERS’ EQUITY
Preferred stock, $.01 par value, shares authorized: 100 shares of Series A and 2,000,000 shares of Series B; none issued and outstanding ― ―
Common stock, $.01 par value, shares authorized: 25,000,000; shares issued and outstanding: 12,430,893 in 2011 and 12,064,543 in 2010 124
121
Paid-in capital 137,467 131,350 Retained earnings 14,465 1,312 Accumulated other comprehensive loss (5,881) (5,177)
TOTAL STOCKHOLDERS’ EQUITY 146,175 127,606
TOTAL LIABILITIES AND STOCKHOLDERS’ EQUITY $ 318,745 $ 277,586
See notes to consolidated financial statements.

F-4
LIFETIME BRANDS, INC. CONSOLIDATED STATEMENTS OF OPERATIONS
(in thousands – except per share data)
Year ended December 31, 2011 2010 2009 Net sales $ 444,418 $ 443,171 $ 415,040 Cost of sales 282,058 273,774 257,839 Distribution expenses 43,882 44,570 43,329 Selling, general and administrative expenses 93,894 95,044 95,647 Restructuring expenses (Note M) ― ― 2,616 Income from operations 24,584 29,783 15,609 Interest expense (Note E & F) (7,758) (9,351) (13,185) Loss on early retirement of debt (Note E) ― (764) ― Income before income taxes, equity in earnings and extraordinary item 16,826 19,668 2,424 Income tax provision (Note I) (6,122) (4,602) (1,880)
Equity in earnings, net of taxes (Note C) 3,362 2,718 2,171 Income before extraordinary item 14,066 17,784 2,715
Extraordinary item, net of taxes (Note D) ― 2,477 ―
NET INCOME $ 14,066 $ 20,261 $ 2,715 Basic income per common share before extraordinary
item (Note H) $ 1.16 $ 1.48 $ 0.23 Basic income per common share of extraordinary item (Note H) ― 0.20 ―
BASIC INCOME PER COMMON SHARE (NOTE H) $ 1.16 $ 1.68 $ 0.23
Diluted income per common share before extraordinary
item (Note H) $ 1.12 $ 1.44 $ 0.22
Diluted income per common share of extraordinary item (Note H) ― 0.20 ―
DILUTED INCOME PER COMMON SHARE (NOTE H) $ 1.12 $ 1.64 $ 0.22
See notes to consolidated financial statements.

F-5
LIFETIME BRANDS, INC. CONSOLIDATED STATEMENTS OF STOCKHOLDERS’ EQUITY
(in thousands)
Common stock
Shares Amount Paid-in capital
Retained earnings
(accumulated deficit)
Accumulated other
comprehensive (loss) Total
BALANCE AT DECEMBER 31, 2008 11,990 $ 120 $ 127,497 $ (21,515) $ (8,593) $97,509
Comprehensive income: Net income 2,715 2,715 Grupo Vasconia, S.A.B. translation
adjustment (Note C) 456 456 Derivative hedge de-designation (Note F) 780 780 Derivative fair value adjustment (Note F) 543 543
Total comprehensive income 4,494 Stock option expense (Note G) 2,099 2,099 Exercise of stock options 46 59 59 Retirement of shares (Note G) (21) (149) (149)
BALANCE AT DECEMBER 31, 2009 12,015 120 129,655 (18,949) (6,814) 104,012
Comprehensive income: Net income 20,261 20,261 Grupo Vasconia, S.A.B. translation
adjustment (Note C) 1,088 1,088 Derivative hedge de-designation (Note F) 342 342 Derivative fair value adjustment (Note F) 57 57 Interest rate swap termination (Note F) 150 150
Total comprehensive income 21,898 Convertible Senior Note repurchase (Note E) (2,366) (2,366) Tax effect on Convertible Senior Note
repurchase
836
836 Shares issued to directors (Note G) 10 150 150 Stock compensation expense (Note G) 2,778 2,778 Tax benefit on exercise of stock options 124 124 Exercise of stock options 40 1 173 174
BALANCE AT DECEMBER 31, 2010 12,065 121 131,350 1,312 (5,177) 127,606
Comprehensive income: Net income 14,066 14,066 Translation adjustment (704) (704)
Total comprehensive income 13,362 Shares issued to directors (Note G) 21 183 183 Stock compensation expense (Note G) 2,612 2,612 Issuance of 255,908 shares of common stock
for acquisition of Creative Tops (Note B) 256 3 3,097 3,100 Exercise of stock options 89 225 225 Dividends (Note G) (913) (913)
BALANCE AT DECEMBER 31, 2011 12,431 $ 124 $ 137,467 $ 14,465 $ (5,881) $ 146,175
See notes to consolidated financial statements.

F-6
LIFETIME BRANDS, INC. CONSOLIDATED STATEMENTS OF CASH FLOWS
(in thousands)
Year ended December 31, 2011 2010 2009 OPERATING ACTIVITIES
Net income $ 14,066 $ 20,261 $ 2,715 Adjustments to reconcile net income to net cash provided by
operating activities: Extraordinary gain ― (2,477) ―
Provision for doubtful accounts (24) 376 (420) Depreciation and amortization 8,397 9,810 11,472 Amortization of debt discount 543 1,802 2,663 Deferred rent (133) 306 673 Deferred income taxes (1,218) (2,691) 734
Stock compensation expense 2,795 2,928 2,099 Undistributed equity earnings (2,896) (2,321) (1,953) Fixed asset impairment ― ― 789 Loss on early retirement of debt ― 764 ―
Changes in operating assets and liabilities (excluding the effects of business acquisitions)
Accounts receivable 3,297 (11,619) 6,430 Inventory (5,365) 3,996 37,680 Prepaid expenses, other current assets and other assets 1,120 3,981 (271) Accounts payable, accrued expenses and other liabilities (4,673) 628 (10,324) Income taxes receivable ― ― 11,263 Income taxes payable (3,722) 4,356 438
NET CASH PROVIDED BY OPERATING ACTIVITIES 12,187 30,100 63,988 INVESTING ACTIVITIES
Purchases of property and equipment (4,959) (2,864) (2,344) Equity investments (5,123) ― ― Acquisition of Creative Tops, net of cash acquired (20,584) ― ― Net proceeds from sale of property 31 70 408
NET CASH USED IN INVESTING ACTIVITIES (30,635) (2,794) (1,936) FINANCING ACTIVITIES
Repayments of prior credit facility, net (Note E) ― (24,601) (64,699) Proceeds from Revolving Credit Facility, net (Note E) 43,525 14,100 ― Proceeds from Term Loan (Note E) ― 40,000 ― Repurchase of 4.75% convertible senior notes (Note E) (24,100) (51,028) ― Financing Costs (761) (3,248) ― Cash dividends paid (913) ― ― Payment of capital lease obligations (78) (158) (225) Proceeds from the exercise of stock options 225 174 59 Excess tax benefits from exercise of stock options 124 17
NET CASH PROVIDED BY (USED IN) FINANCING ACTIVITIES 17,898 (24,637) (64,848)
Effect of foreign exchange on cash 171 ― ― INCREASE (DECREASE) IN CASH AND CASH EQUIVALENTS (379) 2,669 (2,796) Cash and cash equivalents at beginning of year 3,351 682 3,478
CASH AND CASH EQUIVALENTS AT END OF YEAR $ 2,972 $ 3,351 $ 682
See notes to consolidated financial statements.

F-7
LIFETIME BRANDS, INC. NOTES TO CONSOLIDATED FINANCIAL STATEMENTS
DECEMBER 31, 2011
NOTE A — SIGNIFICANT ACCOUNTING POLICIES
Organization and business
Lifetime Brands, Inc. (the “Company”) designs, sources and sells branded kitchenware, tabletop and other products used in the home and markets its products under a number of brand names and trademarks, which are either owned or licensed. The Company markets and sells its products principally on a wholesale basis to retailers. The Company also markets and sells a limited selection of its products directly to the consumer through its Pfaltzgraff®, Mikasa®, Lifetime Sterling™ and Housewares Deals™ Internet websites.
Principles of consolidation
The accompanying consolidated financial statements include the accounts of the Company and its subsidiaries. All intercompany accounts and transactions have been eliminated in consolidation.
Revenue recognition
Wholesale sales and Retail Direct sales are recognized when title passes to the customer, which is primarily at the shipping point for Wholesale sales and upon delivery to the customer for Retail Direct sales. Shipping and handling fees that are billed to customers in sales transactions are included in net sales and amounted to $1.4 million, $1.9 million and $3.5 million for the years ended December 31, 2011, 2010 and 2009, respectively. Net sales exclude taxes that are collected from customers and remitted to the taxing authorities.
The Company offers various sales incentives and promotional programs to its customers from time to time in the normal course of business. These incentives and promotions typically include arrangements such as cooperative advertising, buydowns, volume rebates and discounts. These arrangements and an estimate of sales returns are reflected as reductions in net sales in the Company’s consolidated statements of operations.
Distribution expenses
Distribution expenses consist primarily of warehousing expenses, handling costs of products sold and freight-out expenses.
Advertising expenses
Advertising expenses are expensed as incurred and are included in selling, general and administrative expenses. Advertising expenses were $702,000, $775,000 and $880,000 for the years ended December 31, 2011, 2010 and 2009, respectively.
Accounts receivable
The Company periodically reviews the collectibility of its accounts receivable and establishes allowances for estimated losses that could result from the inability of its customers to make required payments. A considerable amount of judgment is required to assess the ultimate realization of these receivables including assessing the initial and on-going creditworthiness of the Company’s customers. The Company also maintains an allowance for anticipated customer deductions. The allowances for deductions are primarily based on contracts with customers. However, in certain cases the Company does not have a formal contract and, therefore, customer deductions are non-contractual. To evaluate the reasonableness of non-contractual customer deductions, the Company analyzes currently available information and historical trends of deductions.
F-8
LIFETIME BRANDS, INC. NOTES TO CONSOLIDATED FINANCIAL STATEMENTS
DECEMBER 31, 2011
NOTE A — SIGNIFICANT ACCOUNTING POLICIES (continued)
Inventory
Inventory consists principally of finished goods sourced from third-party suppliers. Inventory also includes finished goods, work in process and raw materials related to the Company’s manufacture of sterling silver products. Inventory is priced using the lower of cost (first-in, first-out basis) or market method. The Company estimates the selling price of its inventory on a product by product basis based on the current selling environment. If the estimated selling price is lower than the inventory’s cost, the Company reduces the value of the inventory to its net realizable value.
Property and equipment
Property and equipment is stated at cost. Property and equipment, other than leasehold improvements, is depreciated using the straight-line method over the estimated useful lives of the assets. Building and improvements are being depreciated over 30 years and machinery, furniture and equipment over periods ranging from 3 to 10 years. Leasehold improvements are amortized over the term of the lease or the estimated useful lives of the improvements, whichever is shorter. Advances paid towards the acquisition of property and equipment and the cost of property and equipment not ready for use before the end of the period are classified as construction in progress.
Cash equivalents
The Company considers all highly liquid instruments with a maturity of three months or less when purchased to be cash equivalents.
Use of estimates
The preparation of financial statements in conformity with U.S. generally accepted accounting principles requires management to make estimates and assumptions that affect the amounts reported in the financial statements and accompanying notes. Actual results could differ from those estimates. Amounts subject to estimates include judgments related to revenue recognition, allowances for doubtful accounts, reserves for sales returns and allowances and customer chargebacks, inventory mark-down provisions, impairment of tangible and intangible assets, stock option expense, estimates for unpaid healthcare claims, derivative valuation, accruals related to the Company’s tax provision and tax valuation allowances.
Concentration of credit risk
The Company’s cash and cash equivalents are potentially subject to concentration of credit risk. The Company maintains cash with several financial institutions that, in some cases, is in excess of Federal Deposit Insurance Corporation insurance limits.
Concentrations of credit risk with respect to trade accounts receivable are limited due to the large number of entities comprising the Company’s customer base.
During the years ended December 31, 2011, 2010 and 2009, Wal-Mart Stores, Inc. (including Sam’s Club and Asda Superstore) accounted for 15%, 15%, and 18% of net sales, respectively. No other customer accounted for 10% or more of the Company’s sales during these periods.

F-9
LIFETIME BRANDS, INC. NOTES TO CONSOLIDATED FINANCIAL STATEMENTS
DECEMBER 31, 2011
NOTE A — SIGNIFICANT ACCOUNTING POLICIES (continued)
Fair value measurements
Financial Accounting Standards Board (“FASB”) Accounting Standards Codification (“ASC”) Topic No. 820, Fair Value Measurements and Disclosures, provides enhanced guidance for using fair value to measure assets and liabilities and establishes a common definition of fair value, provides a framework for measuring fair value under U.S. generally accepted accounting principles and expands disclosure requirements about fair value measurements. Fair value measurements included in the Company’s consolidated financial statements relate to the Company’s 4.75% convertible senior notes (the “Notes”), annual goodwill and other intangible asset impairment tests and derivatives, described in Notes A, D and F, respectively.
Fair value of financial instruments
The Company estimated that the carrying amounts of cash and cash equivalents, accounts receivable and accounts payable are a reasonable estimate of their fair value because of their short-term nature. The Company estimated that the carrying amounts of borrowings outstanding under its term loan and revolving credit facility approximate fair value since such borrowings bear interest at variable market rates. The fair value of the Notes was $24.0 million at December 31, 2010. The fair value was based on Level 2 observable inputs consisting of the most recent quoted price for the Notes obtained from the FINRA Trade Reporting and Compliance Engine™ system at December 31, 2010.
Derivatives
The Company accounts for derivative instruments in accordance with ASC Topic No. 815, Derivatives and
Hedging which requires that all derivative instruments be recognized on the balance sheet at fair value as either an asset or a liability. Changes in the fair value of derivatives that qualify as hedges and have been designated as part of a hedging relationship for accounting purposes have no net impact on earnings to the extent the derivative is considered perfectly effective in achieving offsetting changes in fair value or cash flows attributable to the risk being hedged, until the hedged item is recognized in earnings. For derivatives that do not qualify or are not designated as hedging instruments for accounting purposes, changes in fair value are recorded in operations.
Goodwill, intangible assets and long-lived assets
Goodwill and intangible assets deemed to have indefinite lives are not amortized but, instead, are subject to an annual impairment assessment.
Long-lived assets, including intangible assets deemed to have finite lives, are reviewed for impairment whenever events or changes in circumstances indicate that such amounts may have been impaired. Impairment indicators include, among other conditions, cash flow deficits, historic or anticipated declines in revenue or operating profit or material adverse changes in the business climate that indicate that the carrying amount of an asset may be impaired. When impairment indicators are present, the Company compares the carrying value of the asset to the estimated discounted future cash flows expected to be generated by the assets. If the assets are considered to be impaired, the impairment to be recognized is measured by the amount by which the carrying amount of the assets exceeds the fair value of the assets. The Company considered indicators of impairment of its goodwill and long-lived assets and determined that no such indicators were present at December 31, 2011.

F-10
LIFETIME BRANDS, INC. NOTES TO CONSOLIDATED FINANCIAL STATEMENTS
DECEMBER 31, 2011
NOTE A — SIGNIFICANT ACCOUNTING POLICIES (continued)
Income taxes
The Company accounts for income taxes using the asset and liability method. Under this method, deferred tax assets and liabilities are determined based on differences between financial reporting and tax bases of assets and liabilities and are measured using the enacted tax rates and laws that are expected to be in effect when the differences are expected to reverse.
The Company applies the authoritative guidance for the financial statement recognition, measurement and disclosure of uncertain tax positions recognized in the Company’s financial statements. In accordance with this guidance, tax positions must meet a more-likely-than-not recognition threshold and measurement attribute for the financial statement recognition and measurement of a tax position. A valuation allowance is required to be established or maintained when it is “more likely than not” that all or a portion of deferred tax assets will not be realized.
Stock options
The Company measures compensation expense for all share-based compensation granted to employees and non-employee directors at fair value on the date of grant and recognizes compensation expense over the related service period for awards expected to vest. The Company uses the Black-Scholes option valuation model to estimate the fair value of its stock options. The Black-Scholes option valuation model requires the input of highly subjective assumptions including the expected stock price volatility of the Company’s common stock and the risk free interest rate.
Employee Healthcare
In 2011, the Company commenced self insurance of certain portions of its health insurance plan. The Company maintains an estimated accrual for unpaid claims and claims incurred but not yet reported (“IBNR”). Although management believes that it uses the best information available to estimate IBNR, actual claims may vary significantly from estimated claims.
New Accounting Pronouncements
In June 2011, the Financial Accounting Standards Board (“FASB”) issued Accounting Standard Update (“ASU”) No. 2011-05, Presentation of Comprehensive Income, which amends Accounting Standards Codification (“ASC”) Topic No. 220, Comprehensive Income. The updated guidance requires that all changes in stockholders’ equity be presented either as a single continuous statement of comprehensive income or in two separate but consecutive statements. In December 2011, the FASB issued Accounting Standards Update No. 2011-12 (“ASU 2011-12”) which defers certain reclassification requirements within ASU 2011-05. This guidance is effective for interim and annual periods beginning after December 15, 2011. The guidance is limited to the form and content of the financial statements and disclosures, and the Company has determined that the adoption of this guidance is not expected to have a material impact on the Company’s consolidated financial position, results of operations or cash flows.
In September 2011, the FASB issued ASU No. 2011-08, Intangibles—Goodwill and Other (Topic 350): Testing for
Goodwill Impairment, which permits an entity to first assess qualitative factors to determine whether it is more likely than not that the fair value of a reporting unit is less than its carrying amount as a basis for determining whether it is necessary to perform the two-step goodwill impairment test described in ASC Topic No. 350, Intangibles – Goodwill and Other. The amendments in this update are effective for annual and interim goodwill impairment tests performed for fiscal years beginning after December 15, 2011. The Company has determined that the adoption of this guidance is not expected to have a material impact on the Company’s consolidated financial position, results of operations or cash flows.

F-11
LIFETIME BRANDS, INC. NOTES TO CONSOLIDATED FINANCIAL STATEMENTS
DECEMBER 31, 2011
NOTE B — CREATIVE TOPS ACQUISITION
On November 4, 2011, the Company acquired 100% of the share capital of each of Creative Tops Holdings Limited and Creative Tops Far East Limited (collectively, “Creative Tops”), for £14.8 million ($23.7 million) of consideration, comprised of cash in the amount of £12.9 million ($20.6 million) and 255,908 shares of common stock with a value of £1.9 million ($3.1 million). Creative Tops, which reported net sales of approximately £26.3 million ($42.3 million) for its fiscal year ended March 31, 2011, is a leading UK-based supplier of private label and branded tableware and kitchenware products. The purpose of this acquisition is to expand the Company’s sale of products into Europe including growth in the sales of the traditional products of Creative Tops and new branded product offerings. The assets, liabilities and operating results of Creative Tops are reflected in the Company’s consolidated financial statements in accordance with ASC Topic No. 805, Business Combinations, commencing from the acquisition date.
The purchase price has been determined as follows (in thousands):
Cash paid, net of cash acquired $ 20,584 Common stock issued 3,100 Total purchase price $ 23,684
The cash portion of the purchase price was funded by borrowings under the Company’s Credit Facility (“Revolving Credit Facility”). Cash paid is reflected net of cash acquired of £0.1 million ($0.2 million).
The purchase price has been allocated based on management’s estimate of the fair value of the assets acquired and liabilities assumed, as follows (in thousands):
Purchase Price
Allocation Accounts receivable $ 8,559 Inventory 5,228 Other current assets 508 Property and equipment 844 Goodwill and other intangibles 16,892 Accounts payable (1,250) Accrued expenses (2,351) Other liabilities (1,191) Deferred tax liability (3,555) Total allocated value $ 23,684
On the basis of estimated fair values, the excess of the purchase price over the net assets acquired of $13.3 million has been allocated as follows: $10.6 million for customer relationships, $3.6 million for trade names, $2.7 million for non-tax-deductible goodwill, net of a deferred tax liability related to amortizable intangibles of $3.6 million. Customer relationships and trade names are amortized on a straight-line basis over their estimated useful lives (see Note D).

F-12
LIFETIME BRANDS, INC. NOTES TO CONSOLIDATED FINANCIAL STATEMENTS
DECEMBER 31, 2011
NOTE C — EQUITY INVESTMENTS
The Company owns a 30% interest in Grupo Vasconia, S.A.B. (“Vasconia”). The investment is accounted for using the equity method of accounting. Accordingly, the Company has recorded its proportionate share of Vasconia’s net income (reduced for amortization expense related to the customer relationships acquired) for the years ended December 31, 2011, 2010 and 2009 in the accompanying consolidated statements of operations. The value of the Company’s investment balance has been translated from Mexican Pesos (“MXN”) to U.S. Dollars (“USD”) using the spot rate of MXN 13.95 and MXN 12.39 at December 31, 2011 and 2010, respectively. The Company’s proportionate share of Vasconia’s net income has been translated from MXN to USD using the average exchange rates of MXN 11.74 to 13.62, MXN 12.37 to 12.79 and MXN 13.05 to 14.32 during the years ended December 31, 2011, 2010 and 2009, respectively. The effect of the translation of the Company’s investment resulted in a decrease of the investment of $0.5 million during the year ended December 31, 2011 and an increase of the investment of $1.1 million and $0.5 million during the years ended December 31, 2010 and 2009, respectively. These translation effects are recorded in accumulated other comprehensive loss. The Company received cash dividends of $466,000 and $398,000 from Vasconia during the years ended December 31, 2011 and 2010, respectively. Included in prepaid expenses and other currents assets at December 31, 2011 and 2010 are amounts due from Vasconia of $216,000 and $102,000, respectively.
Summarized income statement information for the years ended December 31, 2011, 2010 and 2009, as well as summarized balance sheet information as of December 31, 2011 and 2010, for Vasconia in USD and MXN is as follows:
Year Ended December 31,
2011 2010 2009 (in thousands)
Income Statement USD MXN USD MXN USD MXN Net Sales $ 132,310 $ 1,647,479 $ 113,454 $ 1,430,528 $ 94,633 $ 1,276,126 Gross Profit 38,143 476,501 32,451 409,263 26,251 353,500 Income from operations 17,254 216,715 15,122 190,862 11,803 159,531 Net Income 11,395 142,698 9,910 125,115 8,306 111,709
December 31,
2011 2010 (in thousands)
Balance Sheet USD MXN USD MXN Current assets $ 54,262 $ 756,792 $ 55,944 $ 693,118
Non-current assets 42,904 598,382 32,506 402,733
Current liabilities 14,645 204,254 16,299 201,936
Non-current liabilities 7,310 101,953 5,516 68,340
The Company recorded equity in earnings of Vasconia, net of taxes, of $2.9 million, $2.7 million and $2.2 million for the years ended December 31, 2011, 2010 and 2009, respectively.
The Company also has a 50% joint venture investment in World Alliance Enterprises Limited, a Hong-Kong based company that primarily sells kitchenware and cutlery products to retailers other than in North and South America.

F-13
LIFETIME BRANDS, INC. NOTES TO CONSOLIDATED FINANCIAL STATEMENTS
DECEMBER 31, 2011
NOTE C — EQUITY INVESTMENTS (continued)
During the year ended December 31, 2011, the Company recorded equity in earnings of $447,000. This reflects the cumulative results of this investment through December 31, 2011.
In January 2011, the Company, together with Vasconia and unaffiliated partners, formed Housewares Corporation of Asia Limited (“HCA”), a Hong Kong-based company, to supply direct import kitchenware products to retailers in North, Central and South America. The Company paid $105,000 for a 40% equity interest in this entity during 2011. The operating results of HCA were not significant through December 31, 2011.
On December 9, 2011, the Company acquired a 40% equity interest in GS Internacional S/A (“GSI”), a leading wholesale distributor of branded housewares products in Brazil. The consideration for this equity investment amounted to $7.6 million, which consisted of cash consideration of $5.0 million and consideration payable of $2.6 million. During the period of December 9, 2011 through December 31, 2011, the Company’s equity in earnings of GSI were not significant.
In February 2012, the Company entered into a joint venture to distribute Mikasa® products in China, which will require an initial investment of $500,000 by the Company.
The Company incurred acquisition costs of $2.0 million in 2011, which have been recorded in Selling, General and Administrative Expenses in the consolidated statement of operations.
The Company evaluated the disclosure requirements of ASC Topic No. 860, Transfers and Servicing, and determined that at December 31, 2011, the Company did not have a controlling voting interest or variable interest in any of its investments and therefore continued accounting for the investments using the equity method of accounting.

F-14
LIFETIME BRANDS, INC. NOTES TO CONSOLIDATED FINANCIAL STATEMENTS
DECEMBER 31, 2011
NOTE D — GOODWILL AND INTANGIBLE ASSETS
The Company performed its 2011 annual impairment tests for its indefinite-lived intangible assets as of October 1, 2011. The test involved the assessment of the fair market value of the Company’s indefinite-lived intangible assets based on Level 2 observable inputs, using a discounted cash flow approach, assuming a discount rate of 13%-14% and an annual growth rate of 2%. The result of the assessment of the Company’s indefinite-lived intangibles indicated that their fair values exceeded their carrying amounts.
In December 2010, the Company paid $2.5 million to ARC International SA (“ARC”) for all outstanding consideration due or payable related to its 2008 acquisition of the business and certain assets of Mikasa, Inc. As a result of payment of all final consideration to ARC, the Company adjusted the remaining book value of the acquired Mikasa intangible assets, including the trade name and associated deferred tax liability, to zero and the negative goodwill balance to approximately $2.5 million. Concurrently, the remaining balance of negative goodwill was eliminated resulting in an extraordinary gain in the amount of $2.5 million in 2010.
The Company’s intangible assets, all of which are included in the Wholesale segment, consist of the following (in thousands):
Year Ended December 31, 2011 2010
Gross Accumulated Amortization Net Gross
Accumulated Amortization Net
Goodwill $ 2,673 $ ― $ 2,673 $ ― $ ― $ ―
Indefinite-lived intangible assets:
Trade names 19,433 ― 19,433 19,433 ― 19,433 Finite-lived
intangible assets:
Licenses 15,847 (6,641) 9,206 15,847 (6,186) 9,661 Trade names 6,116 (1,400) 4,716 2,477 (1,267) 1,210 Customer
relationships
11,166 (681) 10,485 586 (530) 56 Patents 584 (160) 424 584 (126) 458
Total $ 55,819 $ (8,882) $ 46,937 $ 38,927 $ (8,109) $ 30,818
A summary of the activities related to the Company’s intangible assets for the year ended December 31, 2011 consists of the following (in thousands):
Intangible Assets
Goodwill and Intangible Assets, December 31, 2010 $ 30,818
Goodwill 2,673
Acquisition of trade names 3,639 Acquisition of customer relationships 10,580 Amortization (773)
Goodwill and Intangible Assets, December 31, 2011 $ 46,937

F-15
LIFETIME BRANDS, INC. NOTES TO CONSOLIDATED FINANCIAL STATEMENTS
DECEMBER 31, 2011
NOTE D — GOODWILL AND INTANGIBLE ASSETS (continued)
The weighted-average amortization periods for the Company’s finite-lived intangible assets as of December 31, 2011 are as follows:
Years Trade names 19 Licenses 33 Customer relationships 15 Patents 17
Estimated amortization expense for each of the five succeeding fiscal years is as follows (in thousands):
Year ending December 31
2012 $ 1,587 2013 1,587 2014 1,587 2015 1,584 2016 1,580
Amortization expense for the years ended December 31, 2011, 2010 and 2009 was $773,000, $726,000 and $775,000, respectively.
NOTE E — DEBT
Revolving Credit Facility
The Company had a $125.0 million secured credit agreement (the “Revolving Credit Facility”), maturing on June 9, 2015, with a bank group led by JPMorgan Chase Bank, N.A. On October 28, 2011, the Company amended the Revolving Credit Facility to increase the commitment of the lenders to $150.0 million and to, among other things, (i) increase the borrowing base limit for eligible trademarks to $25.0 million, (ii) revise the pricing grid margins for Alternative Base Rate loans to 1.0% to 1.75% and for Adjusted LIBO Rate and Overnight LIBO Rate loans to 2.0% to 2.75%, (iii) permit borrowings in multi-currencies, primarily U.S Dollars, Euros and Pounds Sterling, (iv) extend, subject to certain conditions, the maturity date to October 28, 2016, (v) increase the expansion option which permits the Company, subject to certain conditions including the consent of the Term Loan lender, to increase the maximum borrowing up to $200.0 million, (vi) revise EBITDA (as defined) to provide for the add back of acquisition related expenses, (vii) limit the domestic and foreign borrowing base, (viii) increase limitations on foreign debt and (ix) increase the limit for investments.
Borrowings under the Revolving Credit Facility are secured by a first lien priority security interest in all of the assets of the Company and its domestic subsidiaries, including a pledge of the Company’s outstanding shares of stock in its subsidiaries (limited, in the case of its foreign subsidiaries, to 65.0% of the Company’s equity interests), except regarding the Company’s shares in its wholly-owned subsidiary LTB de Mexico, S.A. de C.V. (“LTB de Mexico”). Availability under the Revolving Credit Facility is subject to a borrowing base calculation equal to the sum of (i) 85.0% of eligible domestic accounts receivable, (ii) 85.0% of the net orderly liquidation value of eligible domestic inventory and (iii) the lesser of 50.0% of the orderly liquidation value of eligible trademarks and $25.0 million less reserves. The borrowing base is also subject to reserves that may be established by the administrative agent in its permitted discretion.

F-16
LIFETIME BRANDS, INC. NOTES TO CONSOLIDATED FINANCIAL STATEMENTS
DECEMBER 31, 2011
NOTE E — DEBT (continued)
Borrowings under the Revolving Credit Facility bear interest, at the Company’s option, at one of the following rates: (i) the Alternate Base Rate, defined as the greater of the Prime Rate, Federal Funds Rate plus 0.5% or the Adjusted LIBOR rate plus 1.0%, plus a margin of 1.0% (1.25% prior to amendment) to 1.75%, or (ii) the Eurodollar Rate, defined as the Adjusted LIBOR Rate plus a margin of 2.0% (2.25% prior to amendment) to 2.75%. The respective margins are based upon availability. Interest rates on outstanding borrowings at December 31, 2011 ranged from 2.75% to 4.50%. In addition, the Company pays a commitment fee of 0.375% to 0.50% (0.50% prior to amendment) on the unused portion of the Revolving Credit Facility.
The Revolving Credit Facility provides for customary restrictions and events of default. Restrictions include limitations on additional indebtedness, acquisitions, investments and payment of dividends, among others. Furthermore, if availability under the Revolving Credit Facility is less than $17.5 million, the Company will be required to maintain a minimum fixed charge coverage ratio of 1.10 to 1.00, which covenant would remain effective until availability is at least $20.0 million for a period of three consecutive months.
At December 31, 2011, the Company had $1.4 million of open letters of credit and $57.6 million of borrowings outstanding under the Revolving Credit Facility. Availability under the Revolving Credit Facility was approximately 45% of the total loan commitment at December 31, 2011. The interest rate on the outstanding borrowings at December 31, 2011 ranged from 2.5% to 4.5%.
Pursuant to the provisions of ASC Topic No. 470-10, Short-term Obligations Expected to be Refinanced, at December 31, 2011 and 2010, the Company classified a portion of the Revolving Credit Facility as a current liability based on the Company’s intent and ability to repay the loan from cash flows from operations which are expected to occur within the year. Repayments and borrowings under the facility can vary significantly from planned levels based on cash flow needs and general economic conditions. The Company expects that it will continue to borrow and repay funds, subject to availability, under the facility based on working capital needs.
The loss on early retirement of debt in the accompanying consolidated statement of operations includes approximately $408,000 in 2010 for the write-off of unamortized debt issuance costs related to the repayment of amounts under the prior credit agreement.
Term Loan
The Company has a $40.0 million second lien credit agreement (the “Term Loan”), which matures on June 8, 2015, with Citibank, N.A.
The Term Loan bears interest, at the Company’s option, at one of the following rates: (i) the Alternate Base Rate, defined as the greater of the corporate rate published by the lender and the Federal Funds Rate plus 0.50% provided that such calculated rate is a minimum of 2.50%, plus a margin of 7.50%, or (ii) the Adjusted LIBOR rate which shall be a minimum of 1.50%, plus a margin of 8.50%. The interest rate on the outstanding borrowings at December 31, 2011 was 10.0%.
On October 28, 2011, the Company amended the Term Loan to, among other things, (i) revise Permitted Acquisitions (as defined), for which the lender gives prior written consent, to (a) allow Permitted Non-Control Acquisitions and (b) reduce the limit on Permitted Acquisitions, (ii) increase the minimum consolidated EBITDA covenant for the trailing twelve month periods ending March 31, 2012, June 30, 2012, September 30, 2012 and December 31, 2012 and thereafter to $31.0 million, $31.0 million, $33.0 million and $34.0 million, respectively, (iii) increase the limit for other investments, (iv) increase limitations on foreign subsidiary debt, (v) revise EBITDA (as defined) to provide for the add back of acquisition related expenses, and (vi) revise the limitation on indebtedness incurred to finance acquisitions.
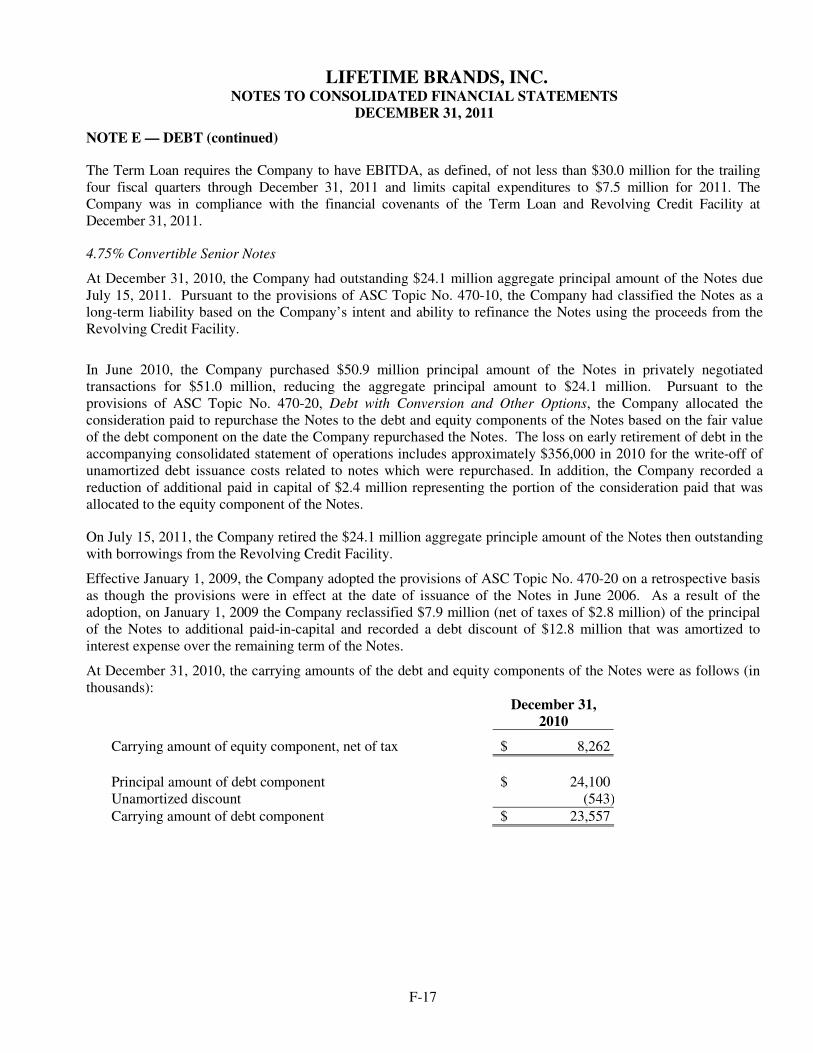
F-17
LIFETIME BRANDS, INC. NOTES TO CONSOLIDATED FINANCIAL STATEMENTS
DECEMBER 31, 2011
NOTE E — DEBT (continued)
The Term Loan requires the Company to have EBITDA, as defined, of not less than $30.0 million for the trailing four fiscal quarters through December 31, 2011 and limits capital expenditures to $7.5 million for 2011. The Company was in compliance with the financial covenants of the Term Loan and Revolving Credit Facility at December 31, 2011.
4.75% Convertible Senior Notes
At December 31, 2010, the Company had outstanding $24.1 million aggregate principal amount of the Notes due July 15, 2011. Pursuant to the provisions of ASC Topic No. 470-10, the Company had classified the Notes as a long-term liability based on the Company’s intent and ability to refinance the Notes using the proceeds from the Revolving Credit Facility.
In June 2010, the Company purchased $50.9 million principal amount of the Notes in privately negotiated transactions for $51.0 million, reducing the aggregate principal amount to $24.1 million. Pursuant to the provisions of ASC Topic No. 470-20, Debt with Conversion and Other Options, the Company allocated the consideration paid to repurchase the Notes to the debt and equity components of the Notes based on the fair value of the debt component on the date the Company repurchased the Notes. The loss on early retirement of debt in the accompanying consolidated statement of operations includes approximately $356,000 in 2010 for the write-off of unamortized debt issuance costs related to notes which were repurchased. In addition, the Company recorded a reduction of additional paid in capital of $2.4 million representing the portion of the consideration paid that was allocated to the equity component of the Notes.
On July 15, 2011, the Company retired the $24.1 million aggregate principle amount of the Notes then outstanding with borrowings from the Revolving Credit Facility.
Effective January 1, 2009, the Company adopted the provisions of ASC Topic No. 470-20 on a retrospective basis as though the provisions were in effect at the date of issuance of the Notes in June 2006. As a result of the adoption, on January 1, 2009 the Company reclassified $7.9 million (net of taxes of $2.8 million) of the principal of the Notes to additional paid-in-capital and recorded a debt discount of $12.8 million that was amortized to interest expense over the remaining term of the Notes.
At December 31, 2010, the carrying amounts of the debt and equity components of the Notes were as follows (in thousands):
December 31,
2010
Carrying amount of equity component, net of tax $ 8,262
Principal amount of debt component $ 24,100 Unamortized discount (543)Carrying amount of debt component $ 23,557

F-18
LIFETIME BRANDS, INC. NOTES TO CONSOLIDATED FINANCIAL STATEMENTS
DECEMBER 31, 2011
NOTE F — DERIVATIVES
The Company had interest rate swaps with an aggregate notional amount of $50.0 million, which decreased to $25.0 million in January 2010 and to $10.0 million in June 2010, and interest rate collars with an aggregate notional amount of $40.2 million that were utilized to manage interest rate exposure related to the Company’s variable interest rate borrowings. The interest rate collar agreements expired in November 2010 and the interest rate swap agreements expired in January 2011.
An interest rate swap with a notional amount of $15.0 million and the interest rate collars were originally designated as cash flow hedges at inception, with the effective portion of the fair value gains or losses on these derivative instruments recorded as a component of accumulated other comprehensive loss. In November 2009, the interest rate collars were de-designated as cash flow hedges as a result of reductions, and projected future reductions, in the Company’s borrowings hedged by the interest rate collar agreements. Accordingly, the Company reclassified a portion of the loss included in other comprehensive loss related to the interest rate collar agreements of $780,000, representing the ineffective portion of the hedge, to interest expense. The remaining portion of the loss of $382,000 included in other comprehensive loss related to these interest rate collar agreements was recognized in earnings using the effective interest method over the remaining term of the interest rate collar agreements. In June 2010, the Company terminated the $15.0 million interest rate swap agreement. In connection with the termination of the agreement, the Company made a payment of $403,000 to the counterparty of the agreement which was included in interest expense for the three months ended June 30, 2010. The effect of recording the Company’s cash flow hedges at fair value for the portion of the periods that the swaps and collars qualified for hedge accounting resulted in unrealized gains of $57,000 (net of taxes of $36,000) and $543,000 for the years ended December 31, 2010 and 2009, respectively. In conjunction with the expiration of the interest rate collar agreement in 2010, there were no remaining cumulative unrealized gains or losses recorded in accumulated other comprehensive loss as of December 31, 2011 and 2010.
Interest rate swap agreements with an aggregate notional amount of $10.0 million were not designated as hedges at inception and the fair value gains or losses from these swap agreements were recognized in interest expense. In November 2010, the Company terminated the $40.2 million interest rate collar agreements. In connection with the termination of the agreements, the Company made payments of $236,000 and $100,000 to the counterparties of the agreements, respectively, that was included in interest expense for the year ended December 31, 2010.
The fair value of the above derivatives were obtained from the counterparties to the agreements and were based on Level 2 observable inputs using proprietary models and estimates about relevant future market conditions. The aggregate fair value of the Company’s derivative instruments was a liability of $10,900 at December 31, 2010 and is included in accrued expenses and deferred rent & other long-term liabilities.
NOTE G — CAPITAL STOCK
Long-term incentive plan
In June 2009, the shareholders of the Company approved an amendment to the Company’s 2000 Long-Term Incentive Plan (the “Plan”) to increase the shares available for grant by 1,000,000 shares to 3,500,000 shares. These shares of the Company’s common stock may be subject to outstanding awards granted to directors, officers, employees, consultants and service providers and affiliates in the form of stock options or other equity-based awards. The Plan authorizes the Board of Directors of the Company, or a duly appointed committee thereof, to issue incentive stock options, non-qualified options and other stock-based awards. Options that have been granted under the Plan expire over a range of five to ten years from the date of grant and vest over a range of up to five years from the date of grant. As of December 31, 2011, there were 332,476 shares available for the grant of awards

F-19
LIFETIME BRANDS, INC. NOTES TO CONSOLIDATED FINANCIAL STATEMENTS
DECEMBER 31, 2011
NOTE G — CAPITAL STOCK (continued)
under the Plan. Through December 31, 2011, all stock options granted under the Plan have exercise prices equal to the market values of the Company’s common stock on the dates of grant.
Cash dividends
The Company did not pay cash dividends on its outstanding shares of common stock during the years ended December 31, 2010 and 2009.
In March 2011, the Company resumed the declaration of cash dividends on its outstanding shares of common stock. Dividends declared in 2011 are as follows:
Dividend per share Date declared Date of record Payment date
$0.025 March 4, 2011 May 2, 2011 May 16, 2011 $0.025 June 27, 2011 August 2, 2011 August 16, 2011 $0.025 November 4, 2011 November 18, 2011 November 29, 2011
On January 11, 2012, the Board of Directors declared a quarterly dividend of $0.025 per share payable on February 15, 2012 to shareholders of record on February 1, 2012, and on March 6, 2012, the Board of Directors declared a quarterly dividend of $0.025 per share payable on May 15, 2012 to shareholders on record on May 1, 2012.
Preferred stock
The Company is authorized to issue 100 shares of Series A Preferred Stock and 2,000,000 shares of Series B Preferred Stock, none of which is issued or outstanding at December 31, 2011.
Escrow shares
In 2009, the Company received back 20,436 shares of its common stock valued at $149,000 that previously had been held in escrow in connection with its 2006 acquisition of certain assets of Syratech Corporation.
Restricted stock
In 2011, 2010 and 2009, the Company issued an aggregate of 13,900, 10,020 and 33,335 restricted shares, respectively, of the Company’s common stock to its non-employee directors representing payment of a portion of their annual retainer. The total fair value of the restricted shares, based on the number of shares granted and the quoted market price of the Company’s common stock on the date of grant, was $150,000 in each of the years 2011, 2010 and 2009. In addition, on August 4, 2011, the Company granted an aggregate of 7,500 shares of restricted stock to its independent directors that vest one year from the date of grant, which had a fair value of $80,000 on the grant date. All of the restricted stock grants vest over a one year period from the date of grant and are expensed over the vesting period.

F-20
LIFETIME BRANDS, INC. NOTES TO CONSOLIDATED FINANCIAL STATEMENTS
DECEMBER 31, 2011
NOTE G — CAPITAL STOCK (continued)
Stock options
A summary of the Company’s stock option activity and related information for the three years ended December 31, 2011, is as follows:
Options
Weighted- average exercise
price
Weighted-average
remaining contractual life
(years)
Aggregate intrinsic
value
Options outstanding, December 31, 2008 2,036,650 $ 20.41
Grants 632,000 3.43 Exercises (12,650) 5.43 Cancellations (869,333) 25.28
Options outstanding, December 31, 2009 1,786,667 12.14
Grants 573,000 13.12
Exercises (39,250) 4.44
Cancellations (101,217) 13.65
Options outstanding, December 31, 2010 2,219,200 12.46
Grants 391,500 11.20
Exercises (123,500) 5.19
Cancellations (11,450) 13.29
Options outstanding, December 31, 2011 2,475,750 12.62
6.54
$ 7,317,203
Options exercisable, December 31, 2011 1,349,050 14.08 5.24
$ 4,730,578 The aggregate intrinsic value in the table above represents the total pre-tax intrinsic value that would have been received by the option holders had all option holders exercised their stock options on December 31, 2011. The intrinsic value is calculated for each in-the-money stock option as the difference between the closing price of the Company’s common stock on December 31, 2011 and the exercise price.
The total intrinsic value of stock options exercised for the years ended December 31, 2011, 2010 and 2009 was $830,400, $389,100, and $12,000 respectively. The intrinsic value of a stock option that is exercised is calculated at the date of exercise.
The Company recognized stock compensation expense of $2.8 million, $2.9 million, and $2.1 million for the years ended December 31, 2011, 2010 and 2009, respectively. Total unrecognized compensation cost related to unvested

F-21
LIFETIME BRANDS, INC. NOTES TO CONSOLIDATED FINANCIAL STATEMENTS
DECEMBER 31, 2011
NOTE G — CAPITAL STOCK (continued)
stock options at December 31, 2011, before the effect of income taxes, was $4.5 million and is expected to be recognized over a weighted-average period of 1.48 years.
The Company values stock options using the Black-Scholes option valuation model. The Black-Scholes option valuation model as well as other available models were developed for use in estimating the fair value of traded options, which have no vesting restrictions and are fully transferable. The Black-Scholes option valuation model requires the input of highly subjective assumptions including the expected stock price volatility and risk-free interest rate. Because the Company’s stock options have characteristics significantly different from those of traded options, changes in the subjective input assumptions can materially affect the fair value estimate of the Company’s stock options. The weighted-average per share grant date fair value of stock options granted during the years ended December 31, 2011, 2010 and 2009 was $5.69, $7.96, and $1.92, respectively.
The fair value for these stock options was estimated at the date of grant using the following weighted-average assumptions:
2011 2010 2009
Historical volatility 60% 73% 73% Expected term (years) 5.6 5.0 4.4 Risk-free interest rate 1.96% 2.18% 1.92%
Expected dividend yield 0.89% 0.00% 0.00%

F-22
LIFETIME BRANDS, INC. NOTES TO CONSOLIDATED FINANCIAL STATEMENTS
DECEMBER 31, 2011
NOTE H — INCOME PER COMMON SHARE
Basic income per common share has been computed by dividing net income by the weighted-average number of shares of the Company’s common stock outstanding. Diluted income per common share adjusts net income and basic income per common share for the effect of all potentially dilutive shares of the Company’s common stock. The calculations of basic and diluted income per common share for the years ended December 31, 2011, 2010 and 2009 are as follows:
2011 2010 2009 (in thousands - except per share amounts)
Income before extraordinary item
$ 14,066 $ 17,784 $ 2,715
Extraordinary item, net of taxes ― 2,477 ―
Net income – Basic
14,066 $ 20,261 $ 2,715
Net Interest expense, 4.75% Convertible Senior Notes ― ― ―
Net income – Diluted $ 14,066 $ 20,261 $ 2,715 Weighted-average shares outstanding – Basic 12,128 12,036 12,009 Effect of dilutive securities:
Stock options 401 340 66
4.75% Convertible Senior Notes ― ― ―
Weighted-average shares outstanding – Diluted 12,529 12,376 12,075 Basic income per common share before extraordinary item $1.16 $ 1.48 $ 0.23
Basic income per common share of extraordinary item ― 0.20 ―
Basic income per common share $1.16 $ 1.68 $ 0.23
Diluted income per common share before extraordinary item $1.12 $ 1.44 $ 0.22
Diluted income per common share of extraordinary item ― 0.20 ―
Diluted income per common share $1.12 $ 1.64 $ 0.22
The computations of diluted income per common share for the years ended December 31, 2011, 2010 and 2009 excludes options to purchase 1,600,413, 1,060,588, and 1,435,348 shares of the Company’s common stock, respectively. The computations of diluted income per common share for the years ended December 31, 2011, 2010 and 2009 also exclude options to purchase 462,192, 2,678,571, 2,678,571 shares, respectively, of the Company’s common stock that were issuable upon the conversion of the Company’s Notes and related interest expense, which were retired in July 2011. The above shares were excluded due to their antidilutive effect.

F-23
LIFETIME BRANDS, INC. NOTES TO CONSOLIDATED FINANCIAL STATEMENTS
DECEMBER 31, 2011
NOTE I — INCOME TAXES
The provision (benefit) for income taxes consists of:
Year Ended December 31, 2011 2010 2009
(in thousands) Current:
Federal $ 4,657 $ 4,269 $ 162 State and local 2,063 1,437 984 Foreign 618 565 ―
Deferred (1,216) (1,669) 734 Income tax provision $ 6,122 $ 4,602 $ 1,880
Deferred income taxes reflect the net tax effects of temporary differences between the carrying amounts of assets and liabilities for financial reporting purposes and the amounts used for income tax purposes. Significant components of the Company’s deferred income tax assets are as follows:
December 31, 2011 2010
(in thousands) Deferred income tax assets:
Deferred rent expense $ 3,038 $ 2,799Translation adjustment 2,205 1,981Stock options 2,743 1,619Inventory 1,624 1,296Operating loss carry-forward 2,120 2,618Accounts receivable allowances 270 ―
Accrued compensation 580 545Other 674 529
Total deferred income tax assets $ 13,254 $ 11,387
Significant components of the Company’s net deferred income tax liability are as follows:
December 31, 2011 2010
(in thousands) Deferred income tax liabilities: Depreciation and amortization $ (4,867) $ (4,035) Accounts receivable allowances ― (102) Intangibles (6,679) (2,450) Convertible Senior Notes ― (216) Equity in earnings (998) (657) Other (535) ―
Total deferred income tax liabilities (13,079) (7,460)
Net deferred income tax (liability) asset 175 3,927
Valuation allowance (3,085) (4,232)
Net deferred income tax liabilities $ (2,910) $ (305)

F-24
LIFETIME BRANDS, INC. NOTES TO CONSOLIDATED FINANCIAL STATEMENTS
DECEMBER 31, 2011
NOTE I — INCOME TAXES (continued)
As of December 31, 2010, the Company had fully utilized federal net operating loss and other credit carryforwards generated in previous years. The Company has generated various state net operating loss carryforwards of which $22.0 million remains at December 31, 2011 that begin to expire in 2014. The Company has net operating losses in foreign jurisdictions of $2.6 million at December 31, 2011 that begin to expire in 2016. The Company has offset its total deferred tax assets with certain deferred tax liabilities that are expected to reverse in the carryforward period. As of December 31, 2011, management had determined that it was “more likely than not” that its deferred tax assets would be realized and the corresponding valuation allowance had been released based on the Company’s ability to utilize deferred tax assets currently and the expected future use of temporary differences in the carryback periods. The valuation allowance which remains as of December 31, 2011 relates to certain state net operating losses and foreign currency translation adjustments.
The provision for income taxes differs from the amounts computed by applying the applicable federal statutory rates as follows:
Year Ended December 31, 2011 2010 2009
Provision for federal income taxes at the statutory rate 35.0 % 35.0% 35.0%
Increases (decreases): State and local income taxes, net of
Federal income tax benefit 6.4 5.6 37.9 Non-deductible stock options 0.1 1.2 11.5 Non-deductible expenses 3.4 0.1 6.4 Valuation allowance (8.2) (19.8) (19.3) Other (0.3) 1.3 6.1 Provision for income taxes 36.4% 23.4% 77.6%
The estimated values of the Company’s gross uncertain tax positions at December 31, 2011, 2010 and 2009 are liabilities of $134,000, $356,000 and $335,000, respectively, and consist of the following:
Year Ended December 31, 2011 2010 2009
(in thousands) Balance at January 1 $ 356 $ 335 $ 498
Additions based on tax positions related to the current year ― ― ― Additions for tax positions of prior years 76 200 28 Reductions for tax position of prior years ― ― ― Settlements (298) (179) (191)
Balance at December 31 $ 134 $ 356 $ 335
The Company had approximately $34,000 and $71,000, net of federal tax benefit, accrued at December 31, 2011 and 2010, respectively, for the payment of interest. The Company’s policy for recording interest and penalties is to record such items as a component of income taxes.

F-25
LIFETIME BRANDS, INC. NOTES TO CONSOLIDATED FINANCIAL STATEMENTS
DECEMBER 31, 2011
NOTE I — INCOME TAXES (continued)
If the Company’s tax positions are ultimately sustained, the Company’s liability, including interest, would be reduced by $134,000, all of which would impact the Company’s tax provision. On a quarterly basis, the Company evaluates its tax positions and revises its estimates accordingly. The Company believes that it is reasonably possible that $134,000 of its tax positions will be resolved within the next twelve months.
The Company has identified the following jurisdictions as “major” tax jurisdictions: U.S. Federal, California, Massachusetts, Pennsylvania, New York and New Jersey. The Company is no longer subject to U.S. Federal income tax examinations for the years prior to 2009. The periods subject to examination for the Company’s major state jurisdictions are the years ended 2007 through 2010.
NOTE J — BUSINESS SEGMENTS
Segment information
The Company operates in two reportable business segments: the Wholesale segment, the Company’s primary business segment, in which the Company designs, markets and distributes products to retailers and distributors, and the Retail Direct segment, in which the Company markets and sells a limited selection of its products directly to consumers through its Pfaltzgraff®, Mikasa®, Housewares™ Deals and Lifetime Sterling™ Internet websites. The operating results of Creative Tops since the date of acquisition are included within the Wholesale segment.
The Company has segmented its operations to reflect the manner in which management reviews and evaluates the results of its operations. While both segments distribute similar products, the segments have been distinct due to the different methods the Company uses to sell, market and distribute the products. Management evaluated the performance of the Wholesale and Retail Direct segments based on net sales and income (loss) from operations through December 31, 2011. Such measures give recognition to specifically identifiable operating costs such as cost of sales, distribution expenses and selling, general and administrative expenses. Certain general and administrative expenses, such as senior executive salaries and benefits, stock compensation, director fees and accounting, legal and consulting fees, are not allocated to the specific segments and are reflected as unallocated corporate expenses. Assets in each segment consist of assets used in its operations and acquired intangible assets. Assets in the unallocated corporate category consist of cash and tax related assets that are not allocated to the segments.
Year Ended December 31, 2011 2010 2009
(in thousands) Net sales:
Wholesale $ 421,119 $ 413,809 $ 389,078 Retail Direct 23,299 29,362 25,962
Total net sales $ 444,418 $ 443,171 $ 415,040 Income (loss) from operations:
Wholesale (1) $ 38,410 $ 42,997 $ 30,581 Retail Direct (2) (524) (1,018) (3,637) Unallocated corporate expenses (13,302) (12,196) (11,335)
Total income (loss) from operations $ 24,584 $ 29,783 $ 15,609
Depreciation and amortization: Wholesale $ 8,183 $ 9,719 $ 11,252 Retail Direct 214 91 220
Total depreciation and amortization $ 8,397 $ 9,810 $ 11,472

F-26
LIFETIME BRANDS, INC. NOTES TO CONSOLIDATED FINANCIAL STATEMENTS
DECEMBER 31, 2011
NOTE J — BUSINESS SEGMENTS (continued)
Segment information (continued)
Year Ended December 31,
2011 2010 2009 (in thousands) Assets:
Wholesale $ 317,435 $ 271,670 $ 273,589 Retail Direct 813 1,441 2,452 Unallocated/ corporate/ other 497 4,475 682
Total assets $ 318,745 $ 277,586 $ 276,723 Capital expenditures:
Wholesale $ 4,730 $ 2,541 $ 1,684 Retail Direct 229 323 660
Total capital expenditures $ 4,959 $ 2,864 $ 2,344
Notes:
(1) In 2009, income from operations for the Wholesale segment included $600,000 for restructuring and impairment expenses. See Note M.
(2) In 2009, loss from operations for the Retail Direct segment includes $2.0 million of restructuring and non-cash fixed asset impairment charges. See Note M.
Product category information – net sales
The following table sets forth net sales by the major product categories included within the Company’s Wholesale operating segment:
Year Ended December 31, 2011 2010 2009 Category: (in thousands)
Kitchenware $ 215,707 $ 208,491 $ 199,567Tabletop 134,652 123,432 113,479Home Solutions 64,099 81,886 76,032Creative Tops 6,661 ― ―
Total $ 421,119 $ 413,809 $ 389,078 The product categories, which incorporate a change to establish a Home Solutions products category and the additional revenue source from Creative Tops in 2011, reflect a refined alignment of the products into the sources of revenue which the Company analyzes. The revenue source categories disclosed in the prior years have been reclassified to conform to current year presentation for comparative purposes.

F-27
LIFETIME BRANDS, INC. NOTES TO CONSOLIDATED FINANCIAL STATEMENTS
DECEMBER 31, 2011
Geographical information
The following table sets forth net sales and long-lived assets by the major geographic locations (in thousands):
Year ended December 31,
2011 Net sales:
United States $ 426,405 International 18,013
Total $ 444,418 Long-lived assets at period-end:
United States $ 118,803 International 1,145
Total $ 119,948
NOTE K — COMMITMENTS AND CONTINGENCIES
Operating leases
The Company has lease agreements for its corporate headquarters, distribution centers, showrooms and sales offices that expire through 2025. These leases generally provide for, among other things, annual base rent escalations and additional rent for real estate taxes and other costs. Future minimum payments under non-cancelable operating leases are as follows (in thousands):
Year ending December 31
2012 $ 13,530 2013 13,138 2014 12,975 2015 13,130 2016 12,978 Thereafter 33,165
Total $ 98,916 Rent and related expenses under operating leases were $13.3 million, $13.3 million and $13.5 million for the years ended December 31, 2011, 2010 and 2009, respectively. Sublease rental income was $70,000 and $82,000 for the years ended December 31, 2011 and 2010, respectively. There was no sublease rental income during the year ended December 31, 2009.
Capital leases
The Company had various capital lease arrangements for the leasing of equipment that was primarily utilized in its distribution centers. These leases expired in 2011 and were included in accrued expenses at December 31, 2010.
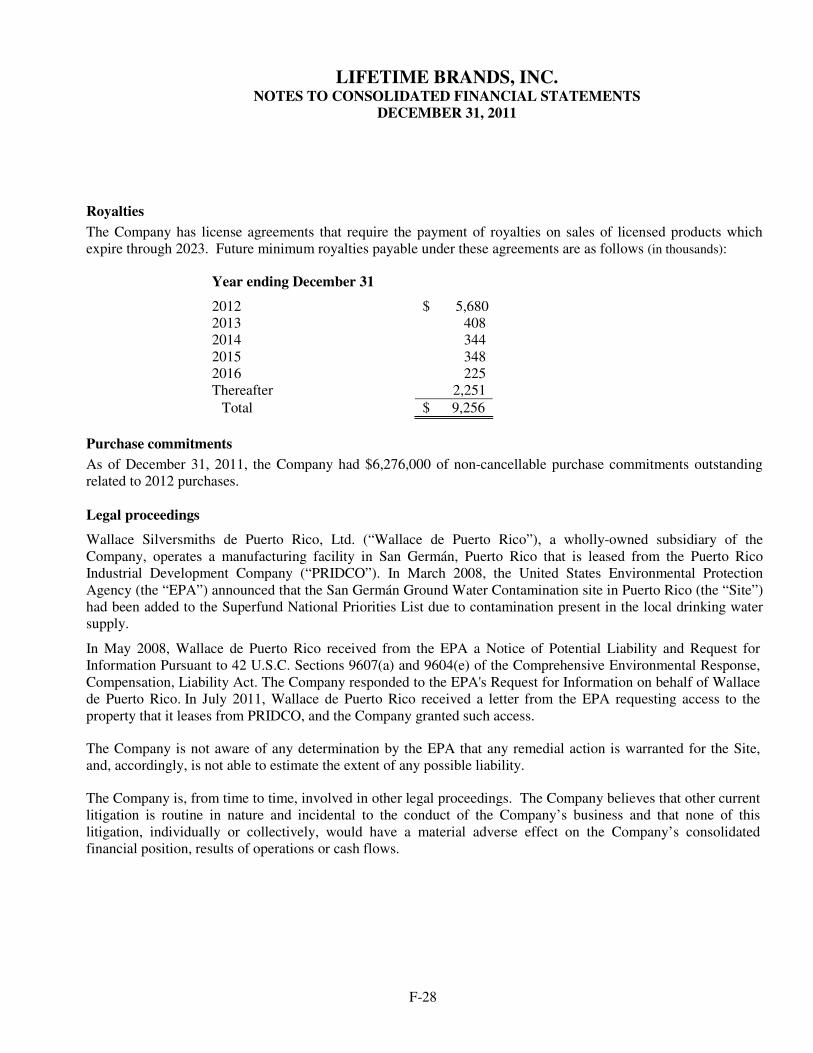
F-28
LIFETIME BRANDS, INC. NOTES TO CONSOLIDATED FINANCIAL STATEMENTS
DECEMBER 31, 2011
Royalties
The Company has license agreements that require the payment of royalties on sales of licensed products which expire through 2023. Future minimum royalties payable under these agreements are as follows (in thousands):
Year ending December 31
2012 $ 5,680 2013 408 2014 344 2015 348 2016 225 Thereafter 2,251
Total $ 9,256
Purchase commitments
As of December 31, 2011, the Company had $6,276,000 of non-cancellable purchase commitments outstanding related to 2012 purchases. Legal proceedings
Wallace Silversmiths de Puerto Rico, Ltd. (“Wallace de Puerto Rico”), a wholly-owned subsidiary of the Company, operates a manufacturing facility in San Germán, Puerto Rico that is leased from the Puerto Rico Industrial Development Company (“PRIDCO”). In March 2008, the United States Environmental Protection Agency (the “EPA”) announced that the San Germán Ground Water Contamination site in Puerto Rico (the “Site”) had been added to the Superfund National Priorities List due to contamination present in the local drinking water supply.
In May 2008, Wallace de Puerto Rico received from the EPA a Notice of Potential Liability and Request for Information Pursuant to 42 U.S.C. Sections 9607(a) and 9604(e) of the Comprehensive Environmental Response, Compensation, Liability Act. The Company responded to the EPA's Request for Information on behalf of Wallace de Puerto Rico. In July 2011, Wallace de Puerto Rico received a letter from the EPA requesting access to the property that it leases from PRIDCO, and the Company granted such access.
The Company is not aware of any determination by the EPA that any remedial action is warranted for the Site, and, accordingly, is not able to estimate the extent of any possible liability.
The Company is, from time to time, involved in other legal proceedings. The Company believes that other current litigation is routine in nature and incidental to the conduct of the Company’s business and that none of this litigation, individually or collectively, would have a material adverse effect on the Company’s consolidated financial position, results of operations or cash flows.

F-29
LIFETIME BRANDS, INC. NOTES TO CONSOLIDATED FINANCIAL STATEMENTS
DECEMBER 31, 2011
NOTE L — RETIREMENT PLANS
401(k) plan
The Company maintains a defined contribution retirement plan for eligible employees under Section 401(k) of the Internal Revenue Code. Participants can make voluntary contributions up to the Internal Revenue Service limit of $16,500 ($22,000 for employees 50 years or over) for 2011. Effective January 1, 2009, the Company suspended its matching contribution as an expense savings measure.
Retirement benefit obligations
The Company assumed retirement benefit obligations, which are paid to certain former executives of an acquired business. The obligations under these agreements are unfunded. At December 31, 2011 and 2010, the total unfunded retirement benefit obligation was $3.4 million and $3.3 million, respectively, and is included in accrued expenses and deferred rent & other long-term liabilities. During the years ended December 31, 2011 and 2010, the Company paid retirement benefits related to these obligations of $148,000 and $148,000, respectively. The Company expects to pay a total of $148,000 in retirement benefits related to these obligations during the year ending December 31, 2012.
NOTE M — RESTRUCTURING
No restructuring expenses were recognized and no remaining obligations existed relating to this restructuring initiative during the years ended December 31, 2010 and 2011.
During the year ended December 31, 2009, the Company recorded restructuring charges of $2.6 million which included store lease obligations and other costs of $1.5 million, non-cash asset impairment charges of $789,000 and employee related expenses of $363,000. The employee expenses were incurred in connection with a plan to realign the management structure of certain of its divisions and eliminate a portion of the workforce at its Puerto Rico sterling silver manufacturing facility.

F-30
LIFETIME BRANDS, INC. NOTES TO CONSOLIDATED FINANCIAL STATEMENTS
DECEMBER 31, 2011
NOTE N — OTHER
Inventory
The components of inventory are as follows: December 31, 2011 2010
(in thousands)
Finished goods $ 107,471 $ 96,375 Work in process 1,683 1,890 Raw materials 1,183 1,670 Total $ 110,337 $ 99,935
Property and equipment
Property and equipment consist of: December 31, 2011 2010
(in thousands)
Machinery, furniture and equipment $ 70,037 $ 66,450 Leasehold improvements 25,050 24,551 Building and improvements 1,604 1,604 Construction in progress 1,900 272 Land 100 100 98,691 92,977 Less: accumulated depreciation and amortization (64,367) (56,884) Total $ 34,324 $ 36,093
Depreciation and amortization expense on property and equipment for the years ended December 31, 2011, 2010 and 2009 was $7.5 million, $8.2 million and $9.4 million, respectively.
Included in machinery, furniture and equipment and accumulated depreciation at December 31, 2010 are $2.1 million and $1.8 million, respectively, related to assets recorded under capital leases.

F-31
LIFETIME BRANDS, INC. NOTES TO CONSOLIDATED FINANCIAL STATEMENTS
DECEMBER 31, 2011
Accrued expenses
Accrued expenses consist of: December 31,
2011 2010 (in thousands)
Customer allowances and rebates $ 10,422 $ 13,549 Compensation and benefits 7,950 8,287 Interest 441 985 Vendor invoices 1,984 2,020 Royalties 2,181 1,520 Derivative liability ― 11 Commissions 1,093 1,231 Freight 1,419 771 Contingent consideration related to GSI investment 2,622 ― Other 5,765 3,588 Total $ 33,877 $ 31,962
Deferred rent & other long-term liabilities Deferred rent & other long-term liabilities consist of:
December 31,
2011 2010
(in thousands) Deferred rent liability $ 11,354 $ 11,283Retirement benefit obligations 3,244 3,199 Total $ 14,598 $ 14,482
Supplemental cash flow information
Year Ended December 31, 2011 2010 2009 (in thousands)
Supplemental disclosure of cash flow information:
Cash paid for interest $ 6,877 $ 6,893 $ 8,804 Cash paid for taxes 10,331 1,198 380
Non-cash investing activities:
Translation adjustment $ (704) $ 1,088 $ 456

S-1
Item 15(a)
LIFETIME BRANDS, INC. SCHEDULE II - VALUATION AND QUALIFYING ACCOUNTS
(in thousands)
COL. A COL. B COL. C COL. D COL. E
Description
Balance at
beginning of period
Additions charged to costs and expenses Deductions
Balance at end of period
Year ended December 31, 2011 Deducted from asset accounts: Allowance for doubtful accounts $ 1,057 $ 63 $ (792) (a) $ 328 Reserve for sales returns and allowances 11,554 3,378 (c) (10,658) (b) 4,274 $ 12,611 $ 3,441 $ (11,450) $ 4,602 Year ended December 31, 2010 Deducted from asset accounts: Allowance for doubtful accounts $ 1,433 $ 1,456 $ (1,832) (a) $ 1,057 Reserve for sales returns and allowances 15,124 661 (c) (4,231) (b) 11,554 $ 16,557 $ 2,117 $ (6,063) $ 12,611 Year ended December 31, 2009 Deducted from asset accounts: Allowance for doubtful accounts $ 1,853 $ 1,204 $ (1,624) (a) $ 1,433 Reserve for sales returns and allowances 12,798 22,180 (c) (19,854) (b) 15,124 $ 14,651 $ 23,384 $ (21,478) $ 16,557 (a) Uncollectible accounts written off, net of recoveries.
(b) Allowances granted.
(c) Charged to net sales.
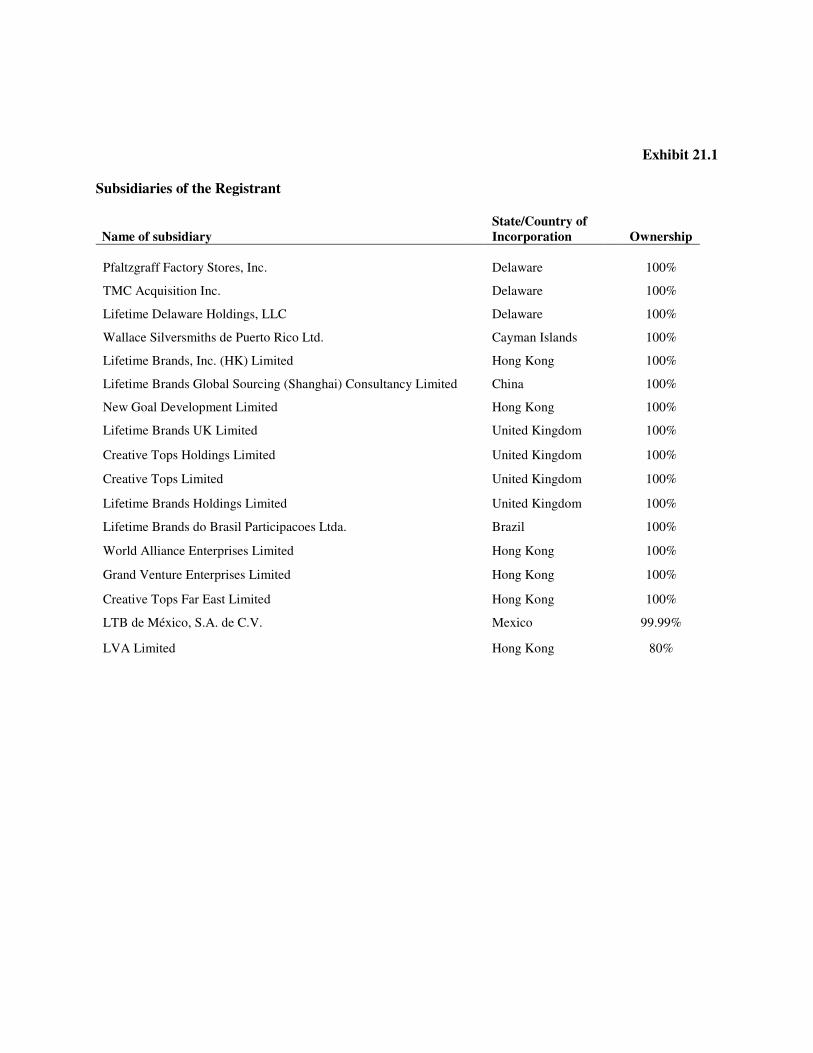
Exhibit 21.1 Subsidiaries of the Registrant
Name of subsidiary State/Country of Incorporation Ownership
Pfaltzgraff Factory Stores, Inc. Delaware 100%
TMC Acquisition Inc. Delaware 100%
Lifetime Delaware Holdings, LLC Delaware 100%
Wallace Silversmiths de Puerto Rico Ltd. Cayman Islands 100%
Lifetime Brands, Inc. (HK) Limited Hong Kong 100%
Lifetime Brands Global Sourcing (Shanghai) Consultancy Limited China 100%
New Goal Development Limited Hong Kong 100%
Lifetime Brands UK Limited United Kingdom 100%
Creative Tops Holdings Limited United Kingdom 100%
Creative Tops Limited United Kingdom 100%
Lifetime Brands Holdings Limited United Kingdom 100%
Lifetime Brands do Brasil Participacoes Ltda. Brazil 100%
World Alliance Enterprises Limited Hong Kong 100%
Grand Venture Enterprises Limited Hong Kong 100%
Creative Tops Far East Limited Hong Kong 100%
LTB de México, S.A. de C.V. Mexico 99.99%
LVA Limited Hong Kong 80%

Exhibit 23.1
CONSENT OF INDEPENDENT REGISTERED PUBLIC ACCOUNTING FIRM
We consent to the incorporation by reference in the Registration Statements on Form S-8 (Nos. 333-105382, 333-146017 and 333-162734) and the Registration Statement on Form S-3 (No. 333-137575) of Lifetime Brands, Inc. of our reports dated March 9, 2012, with respect to the consolidated financial statements and schedule of Lifetime Brands, Inc., and the effectiveness of internal control over financial reporting of Lifetime Brands, Inc. included in this Annual Report (Form 10-K) for the year ended December 31, 2011.
/s/ ERNST & YOUNG LLP Jericho, New York March 9, 2012

Exhibit 31.1
CERTIFICATION I, Jeffrey Siegel, certify that:
1. I have reviewed this Annual Report on Form 10-K of Lifetime Brands, Inc. (“the registrant”);
2. Based on my knowledge, this Annual Report does not contain any untrue statement of a material fact or omit to state a material fact necessary to make the statements made, in light of the circumstances under which such statements were made, not misleading with respect to the period covered by this Annual Report;
3. Based on my knowledge, the financial statements, and other financial information included in this Annual Report, fairly present in all material respects the financial condition, results of operations and cash flows of the registrant as of, and for, the periods presented in this Annual Report;
4. The registrant’s other certifying officers and I are responsible for establishing and maintaining disclosure controls and procedures (as defined in Exchange Act Rules 13a-15(e) and 15d-14 and internal control over financial reporting (as defined in Exchange Act Rules 13a-15(f) and 15d-15(f))) for the registrant and have:
a. designed such disclosure controls and procedures, or caused such disclosure controls and procedures to be designed under our supervision, to ensure that material information relating to the registrant, including its consolidated subsidiaries, is made known to us by others within those entities, particularly during the period in which this Annual Report is being prepared;
b. designed such internal control over financial reporting, or caused such internal control over financial reporting to be designed under our supervision, to provide reasonable assurance regarding the reliability of financial reporting and the preparation of financial statements for external purposes in accordance with generally accepted accounting principles;
c. evaluated the effectiveness of the registrant’s disclosure controls and procedures and presented in this report our conclusions about the effectiveness of the disclosure controls and procedures, as of the end of the period covered by this report based on such evaluation; and
d. disclosed in this report any change in the registrant’s internal control over financial reporting that occurred during the registrant’s most recent fiscal quarter that has materially affected or is reasonably likely to materially affect the registrant’s internal control over financial reporting; and
5. The registrant’s other certifying officers and I have disclosed, based on our most recent evaluation of
internal control over financial reporting, to the registrant’s auditors and the audit committee of registrant’s Board of Directors (or persons performing the equivalent functions):
a. all significant deficiencies in the design or operation of internal control over financial reporting which are reasonably likely to adversely affect the registrant’s ability to record, process, summarize and report financial information; and
b. any fraud, whether or not material, that involves management or other employees who have a significant role in the registrant’s internal control over financial reporting.
Date: March 9, 2012 /s/ Jeffrey Siegel Jeffrey Siegel Chief Executive Officer and President

Exhibit 31.2
CERTIFICATION I, Laurence Winoker, certify that:
1. I have reviewed this Annual Report on Form 10-K of Lifetime Brands, Inc. (“the registrant”);
2. Based on my knowledge, this Annual Report does not contain any untrue statement of a material fact or omit to state a material fact necessary to make the statements made, in light of the circumstances under which such statements were made, not misleading with respect to the period covered by this Annual Report;
3. Based on my knowledge, the financial statements, and other financial information included in this Annual Report, fairly present in all material respects the financial condition, results of operations and cash flows of the registrant as of, and for, the periods presented in this Annual Report;
4. The registrant’s other certifying officers and I are responsible for establishing and maintaining disclosure controls and procedures (as defined in Exchange Act Rules 13a-15(e) and 15d-14 and internal control over financial reporting (as defined in Exchange Act Rules 13a-15(f) and 15d-15(f))) for the registrant and have:
a. designed such disclosure controls and procedures, or caused such disclosure controls and procedures to be designed under our supervision, to ensure that material information relating to the registrant, including its consolidated subsidiaries, is made known to us by others within those entities, particularly during the period in which this Annual Report is being prepared;
b. designed such internal control over financial reporting, or caused such internal control over financial reporting to be designed under our supervision, to provide reasonable assurance regarding the reliability of financial reporting and the preparation of financial statements for external purposes in accordance with generally accepted accounting principles;
c. evaluated the effectiveness of the registrant’s disclosure controls and procedures and presented in this report our conclusions about the effectiveness of the disclosure controls and procedures, as of the end of the period covered by this report based on such evaluation; and
d. disclosed in this report any change in the registrant’s internal control over financial reporting that occurred during the registrant’s most recent fiscal quarter that has materially affected or is reasonably likely to materially affect the registrant’s internal control over financial reporting; and
5. The registrant’s other certifying officers and I have disclosed, based on our most recent evaluation of internal control over financial reporting, to the registrant’s auditors and the audit committee of registrant’s Board of Directors (or persons performing the equivalent functions):
a. all significant deficiencies in the design or operation of internal control over financial reporting which are reasonably likely to adversely affect the registrant’s ability to record, process, summarize and report financial information; and
b. any fraud, whether or not material, that involves management or other employees who have a significant role in the registrant’s internal control over financial reporting.
Date: March 9, 2012 /s/ Laurence Winoker Laurence Winoker Senior Vice President – Finance, Treasurer and Chief Financial Officer

Exhibit 32.1
Certification by Jeffrey Siegel, Chief Executive Officer and President, and Laurence Winoker, Senior Vice President – Finance, Treasurer and Chief Financial Officer, Pursuant to 18 U.S.C. Section 1350, as Adopted Pursuant to Section 906 of the Sarbanes-Oxley Act of 2002.
I, Jeffrey Siegel, Chief Executive Officer and President, and I, Laurence Winoker, Senior Vice President – Finance, Treasurer and Chief Financial Officer, of Lifetime Brands, Inc., a Delaware corporation (the “Company”), each hereby certifies that:
(1) The Company’s Annual report on Form 10-K for the year ended December 31, 2011
(the “Form 10-K”) fully complies with the requirements of Section 13(a) or 15(d) of the Securities Exchange Act of 1934, as amended; and
(2) The information contained in the Form 10-K fairly presents, in all material respects, the financial condition and results of operations of the Company.
/s/ Jeffrey Siegel /s/ Laurence Winoker Jeffrey Siegel Laurence Winoker
Chief Executive Officer and President Senior Vice President- Finance, Treasurer and Chief Financial Officer
Date: March 9, 2012 Date: March 9, 2012 A signed original of this written statement required by Section 1350 has been provided to Lifetime Brands, Inc. and will be retained by Lifetime Brands, Inc. and furnished to the Securities and Exchange Commission or its staff, upon request.