Identifying Modes of User Engagement with Online News and ... · reading of news articles before...
10
Identifying Modes of User Engagement with Online News and Their Relationship to Information Gain in Text Nir Grinberg Network Science Institute, Northeastern University Institute for Quantitative Social Science, Harvard University [email protected] ABSTRACT Prior work established the benefits of server-recorded user engage- ment measures (e.g. clickthrough rates) for improving the results of search engines and recommendation systems. Client-side measures of post-click behavior received relatively little attention despite the fact that publishers have now the ability to measure how mil- lions of people interact with their content at a fine resolution using client-side logging. In this study, we examine patterns of user engagement in a large, client-side log dataset of over 7.7 million page views (including both mobile and non-mobile devices) of 66,821 news articles from seven popular news publishers. For each page view we use three summary statistics: dwell time, the furthest position the user reached on the page, and the amount of interaction with the page through any form of input (touch, mouse move, etc.). We show that simple transformations on these summary statistics reveal six prototypical modes of reading that range from scanning to extensive reading and persist across sites. Furthermore, we develop a novel measure of information gain in text to capture the development of ideas within the body of articles and investigate how information gain relates to the engagement with articles. Finally, we show that our new measure of information gain is particularly useful for predicting reading of news articles before publication, and that the measure captures unique information not available otherwise. CCS CONCEPTS • Information systems → Information extraction; Multime- dia and multimodal retrieval; Content analysis and feature selection; Document structure; Data encoding and canonicalization; KEYWORDS User engagement, Online news, Information gain, Reading ACM Reference Format: Nir Grinberg. 2018. Identifying Modes of User Engagement with Online News and Their Relationship to Information Gain in Text. In WWW 2018: The 2018 Web Conference, April 23–27, 2018, Lyon, France. ACM, New York, NY, USA, 10 pages. https://doi.org/10.1145/3178876.3186180 This paper is published under the Creative Commons Attribution 4.0 International (CC BY 4.0) license. Authors reserve their rights to disseminate the work on their personal and corporate Web sites with the appropriate attribution. WWW 2018, April 23–27, 2018, Lyon, France © 2018 IW3C2 (International World Wide Web Conference Committee), published under Creative Commons CC BY 4.0 License. ACM ISBN 978-1-4503-5639-8/18/04. https://doi.org/10.1145/3178876.3186180 1 INTRODUCTION Over the past two decades, our reading habits have turned from physical media (books, magazines and newspapers) to their digital counterparts (e-readers, websites, and apps). Pew research esti- mated last year that 38% of Americans often got their news online, almost twice the number of people who read it in print [31]. Where previously news publishers had to rely on gross sales numbers or small-scale surveys that took weeks or months to collect, they now have near real time information about individual readers engaging with news content on their website. The shift to digital media creates new opportunities for publish- ers to better understand user engagement within an article page using client-side logging. Thus far, the dominant measure of post- click behavior has been dwell time, an estimate of the total time a user spent on the page. Dwell time is a useful measure for improving the results of search engines and recommendation systems [21, 42]. However, dwell time only provides partial information about the activity of a user on a page. Other client-side interactions such as cursor movement, scrolling, and highlighting provide additional information about the article relevance and the distribution of at- tention on a page [15, 23]. Although beneficial, these additional client-side measures incur substantial costs in terms of model com- plexity, network communication, and storage, thus making these measures difficult for news outlets to use in practice, especially at large scale. Furthermore, there is a disconnect between measures of user engagement and the structure of news articles. Reading is a process that involves a sequence of decisions about how to direct one’s attention to the text. Yet, existing engagement measures do not take into account how the development of ideas within the body of text may shape user engagement with it. Previous work linked measures of user engagement to visual and dynamic properties of a page such as layout, saliency of page elements, and presence of images or videos [14, 23, 24, 41, 42]. The relatively little work that examined user engagement and textual content concentrated on the general topic, sentiment and readability of the text [2, 21, 24]. Here, we are interested in exploring how the development of ideas within the text relates to user engagement. Practical and informative measures of post-click user engage- ment can improve recommendations of news content and enable more informed editorial decisions. Distinguishing between differ- ent modes of enagement with an article, such as scan, skim, or in-depth reading, can enable recommendation systems to better match articles with potential readers based on their engagement profile. In addition, accurate predictions about engagement with an article prior to publication can guide editorial decisions, help journalists write higher quality content, and set expectations for
Transcript of Identifying Modes of User Engagement with Online News and ... · reading of news articles before...
Identifying Modes of User Engagement with Online News andTheir Relationship to Information Gain in Text
Nir GrinbergNetwork Science Institute, Northeastern University
Institute for Quantitative Social Science, Harvard [email protected]
ABSTRACTPrior work established the benefits of server-recorded user engage-ment measures (e.g. clickthrough rates) for improving the results ofsearch engines and recommendation systems. Client-side measuresof post-click behavior received relatively little attention despitethe fact that publishers have now the ability to measure how mil-lions of people interact with their content at a fine resolution usingclient-side logging.
In this study, we examine patterns of user engagement in a large,client-side log dataset of over 7.7 million page views (including bothmobile and non-mobile devices) of 66,821 news articles from sevenpopular news publishers. For each page view we use three summarystatistics: dwell time, the furthest position the user reached on thepage, and the amount of interaction with the page through anyform of input (touch, mouse move, etc.). We show that simpletransformations on these summary statistics reveal six prototypicalmodes of reading that range from scanning to extensive reading andpersist across sites. Furthermore, we develop a novel measure ofinformation gain in text to capture the development of ideas withinthe body of articles and investigate how information gain relatesto the engagement with articles. Finally, we show that our newmeasure of information gain is particularly useful for predictingreading of news articles before publication, and that the measurecaptures unique information not available otherwise.
CCS CONCEPTS• Information systems → Information extraction; Multime-dia and multimodal retrieval; Content analysis and featureselection; Document structure; Data encoding and canonicalization;
KEYWORDSUser engagement, Online news, Information gain, Reading
ACM Reference Format:Nir Grinberg. 2018. Identifying Modes of User Engagement with OnlineNews and Their Relationship to Information Gain in Text. InWWW 2018:The 2018 Web Conference, April 23–27, 2018, Lyon, France. ACM, New York,NY, USA, 10 pages. https://doi.org/10.1145/3178876.3186180
This paper is published under the Creative Commons Attribution 4.0 International(CC BY 4.0) license. Authors reserve their rights to disseminate the work on theirpersonal and corporate Web sites with the appropriate attribution.WWW 2018, April 23–27, 2018, Lyon, France© 2018 IW3C2 (International World Wide Web Conference Committee), publishedunder Creative Commons CC BY 4.0 License.ACM ISBN 978-1-4503-5639-8/18/04.https://doi.org/10.1145/3178876.3186180
1 INTRODUCTIONOver the past two decades, our reading habits have turned fromphysical media (books, magazines and newspapers) to their digitalcounterparts (e-readers, websites, and apps). Pew research esti-mated last year that 38% of Americans often got their news online,almost twice the number of people who read it in print [31]. Wherepreviously news publishers had to rely on gross sales numbers orsmall-scale surveys that took weeks or months to collect, they nowhave near real time information about individual readers engagingwith news content on their website.
The shift to digital media creates new opportunities for publish-ers to better understand user engagement within an article pageusing client-side logging. Thus far, the dominant measure of post-click behavior has been dwell time, an estimate of the total time auser spent on the page. Dwell time is a useful measure for improvingthe results of search engines and recommendation systems [21, 42].However, dwell time only provides partial information about theactivity of a user on a page. Other client-side interactions such ascursor movement, scrolling, and highlighting provide additionalinformation about the article relevance and the distribution of at-tention on a page [15, 23]. Although beneficial, these additionalclient-side measures incur substantial costs in terms of model com-plexity, network communication, and storage, thus making thesemeasures difficult for news outlets to use in practice, especially atlarge scale.
Furthermore, there is a disconnect between measures of userengagement and the structure of news articles. Reading is a processthat involves a sequence of decisions about how to direct one’sattention to the text. Yet, existing engagement measures do nottake into account how the development of ideas within the bodyof text may shape user engagement with it. Previous work linkedmeasures of user engagement to visual and dynamic properties ofa page such as layout, saliency of page elements, and presence ofimages or videos [14, 23, 24, 41, 42]. The relatively little work thatexamined user engagement and textual content concentrated onthe general topic, sentiment and readability of the text [2, 21, 24].Here, we are interested in exploring how the development of ideaswithin the text relates to user engagement.
Practical and informative measures of post-click user engage-ment can improve recommendations of news content and enablemore informed editorial decisions. Distinguishing between differ-ent modes of enagement with an article, such as scan, skim, orin-depth reading, can enable recommendation systems to bettermatch articles with potential readers based on their engagementprofile. In addition, accurate predictions about engagement withan article prior to publication can guide editorial decisions, helpjournalists write higher quality content, and set expectations for
the reception of articles by their audience. Post-hoc examination ofthe extent to which readers engaged with articles can enable edi-tors to better understand their audience interests, and inform boththe coverage and writing style of future articles. The challenge wetackle in this work is to derive engagement measures that providemeaningful descriptions of post-click behavior in articles with aslittle storage and recording costs as possible. Moreover, we seek tobetter understand the relationship between articles’ text and theengagement of readers with it.
In this work, we use compact summaries of user interactionwith a news article to identify robust and interpretable modesof engagement. We propose a set of simple transformations thatcapture user engagement with news in relative terms: relative tothe article being viewed and context of viewing it. We show thatby using these measures we can identify prototypical modes ofengagement that persist across different sites and browsing devices,and alignwith previous findings about reading obtained usingmuchmore granular data. In addition, we develop a novel measure ofinformation gain within the text of news articles. We demonstratethat our measure of information gain is the single best predictor ofreading engagement with news articles, and that the new measurecaptures unique information not available otherwise.Therefore, our contributions are:• A compact metric of user interaction that carries valuable infor-mation about post-click user engagement with a news article.
• A novel measure of information gain within the text of newsarticles.
• Empirical evidence linking information gain in text to userengagement as observed in a diversity of news sites, at largescale, and outside lab settings.
2 BACKGROUND AND RELATED WORKIn this section, we describe three lines of related work: the use ofpost-click engagement measures in systems’ design, the relation-ship between content properties and user engagement, and thestudy of reading in Web settings.
Post-click user engagement has largely been studied in the con-text of information retrieval and recommendation systems. Earlyworks in this area established dwell time, scrolling, and other post-click behaviors as useful proxies for users’ subjective rating of webcontent [8, 32]. Based on these observations, numerous studies ex-amined the utility of implicit feedback measures, and dwell timein particular, for improving ranking of search results [1, 12] andcontent recommendations [42]. Perhaps central to the success ofdwell time is the simplicity of estimating it from server logs, and thefact that it is both a good proxy for user dissatisfaction (previouslyoperationalized as time spent of 30 seconds or less) and a reasonableapproximation for satisfaction [21]. Guo and Agichtein introduceda model that improves upon dwell time by using cursor movementand scrolling behaviors, demonstrating gains in both relevancejudgments and search results ranking [15]. Perhaps underlyingmany of these metrics are the fundamental concepts from classicalphysics that can describe a user’s navigation through a page usingthe position, speed, and acceleration over time. In practice, however,it is costly to store complete user sessions for the entire user popu-lation, even when sampled at a moderate rate over time. Therefore,
in this work we quantify user engagement using summary statisticscalculated over the entire user session and transformed to representuser behavior in more “natural” coordinates.
Several studies investigated the relationship between the contentof web pages and user engagement with them. At the most basiclevel, the time spent on a page was shown to depend on the time ittakes to load and render a page [28]. Then, the visual complexityand aesthetics of web pages demand different amounts of cognitiveprocessing of visual information [40, 41]. Another important aspectis the visual saliency of page elements, which affects the distribu-tion of attention on a page [6, 23]. In the context of online news,Yi et al. showed that total dwell time on a page is associated withlonger articles, having more images and videos [42]. The work ofArapakis et al. established that emotional dimensions of news arti-cles, such as sentiment and polarity, help predict user engagement,and that these emotional aspects vary considerably across differentgenres [2]. Kim et al. found similar dependency of dwell time onarticle length, and further demonstrated that dwell time also de-pends on the readability of the text and its general topic [21]. Morerecently, Lagun and Lalmas proposed a joint model for capturingthe relationship between latent topics in text and user engagement,demonstrating superior predictive ability for latent topics informedby past user engagement [24]. Our work directly builds on previousstudies by incorporating many of the content features associatedwith user engagement. Moreover, we extend this line of work bydeveloping content features that focus on the development of ideaswithin an article, studying how the density of information withinthe text is associated with the sustained attention of readers.
A third line of work concerns assessing reading on the Web.Evaluating people’s focus of attention and the extent to whichthey read content is a difficult task even in lab settings, let alonein Web settings. In fact, humans only master the metacognitiveskill of evaluating their own reading when they reach a certainintermediate level of reading [13]. Traditionally, reading has beenassessed in lab settings through comprehension tests, eye-tracking,and brain-imaging techniques (see [20, 37, 38] for representativeexamples). While reading rates generally vary from one personto another, the literature generally describes normal reading ratesin the range of 200-300 words per minutes for native speakers ofabout average level of education and intelligence [30, 35]. Often,particularly in Web settings, people only skim articles by movingrapidly through the text, reading in-depth certain parts and skippingothers [17, 29, 30]. According to Liao, people skim at a speed of up tothree or four times faster than their normal reading speeds [27]. Interms of detecting reading on web pages, the works of Biedert et al.and Campbell and Maglio used eye-tracking in well-controlled labsettings to identify patterns of reading [3, 7]. While the dependencyon eye-tracking can be alleviated to a degree through cursor-gazecorrelations [18, 33], this approximation does not apply to readingon mobile devices, which occupy smaller portion of the visual fieldand does not involve positioning a cursor on the screen. Informedby these findings, the current work seeks to identify modes ofengagement with news articles that correspond to reading, but notnecessarily mean reading in a strict sense. Assessing reading withstronger guarantees is currently only possible in well-controlledenvironments, which trade off accuracy for generalizability andrepresentativeness.
Closest to the current work is the work of Lagun and Lalmas [24],which similarly examined patterns of user engagement with news,and studied the relationship between the text and user engagement.The current work, however, seeks to learn post-click engagementpatterns using much more compact representations (i.e. summariesrather than the full time series), utilizing both mobile and non-mobile engagement information, and focusing specifically on therelationship between the development of ideas within the text anduser engagement with it. As the rest of the paper demonstrates,summaries of user interaction are able to retain substantial amountsof information about the underlying user behavior, and our newmeasure of information gain in text outperforms all previous mea-sures in predicting, prior to publication, the fraction of page visitsthat will involve reading.
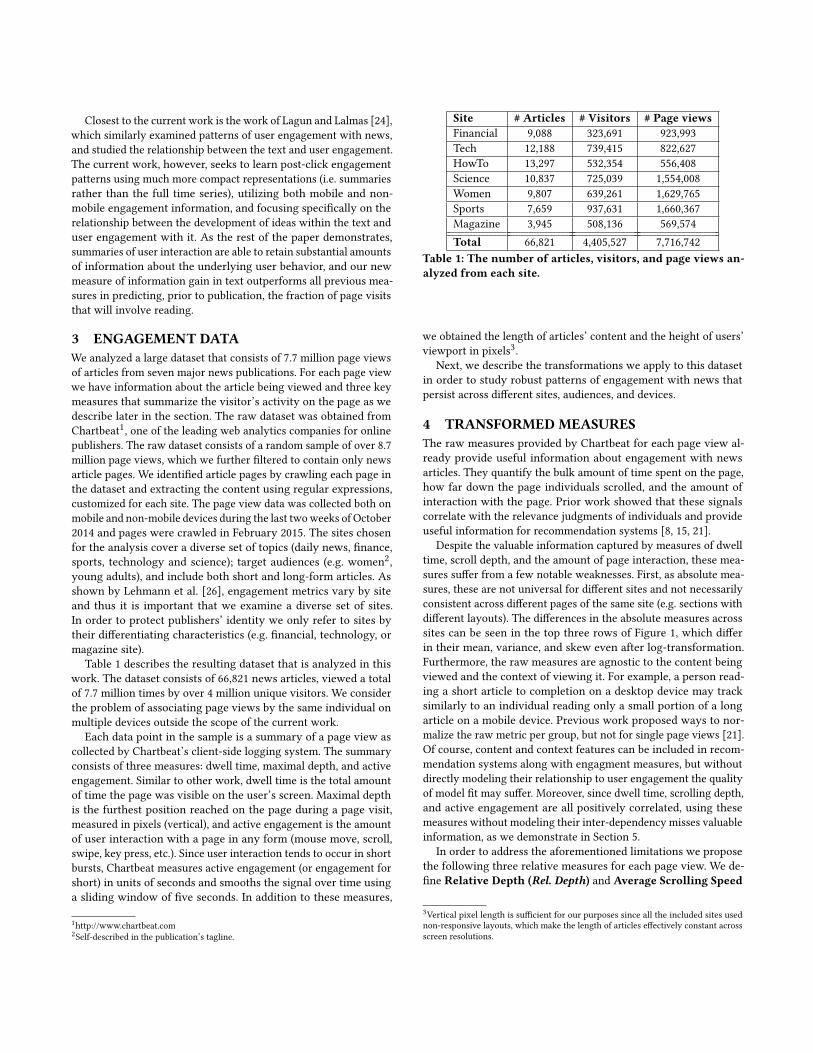
3 ENGAGEMENT DATAWe analyzed a large dataset that consists of 7.7 million page viewsof articles from seven major news publications. For each page viewwe have information about the article being viewed and three keymeasures that summarize the visitor’s activity on the page as wedescribe later in the section. The raw dataset was obtained fromChartbeat1, one of the leading web analytics companies for onlinepublishers. The raw dataset consists of a random sample of over 8.7million page views, which we further filtered to contain only newsarticle pages. We identified article pages by crawling each page inthe dataset and extracting the content using regular expressions,customized for each site. The page view data was collected both onmobile and non-mobile devices during the last twoweeks of October2014 and pages were crawled in February 2015. The sites chosenfor the analysis cover a diverse set of topics (daily news, finance,sports, technology and science); target audiences (e.g. women2,young adults), and include both short and long-form articles. Asshown by Lehmann et al. [26], engagement metrics vary by siteand thus it is important that we examine a diverse set of sites.In order to protect publishers’ identity we only refer to sites bytheir differentiating characteristics (e.g. financial, technology, ormagazine site).
Table 1 describes the resulting dataset that is analyzed in thiswork. The dataset consists of 66,821 news articles, viewed a totalof 7.7 million times by over 4 million unique visitors. We considerthe problem of associating page views by the same individual onmultiple devices outside the scope of the current work.
Each data point in the sample is a summary of a page view ascollected by Chartbeat’s client-side logging system. The summaryconsists of three measures: dwell time, maximal depth, and activeengagement. Similar to other work, dwell time is the total amountof time the page was visible on the user’s screen. Maximal depthis the furthest position reached on the page during a page visit,measured in pixels (vertical), and active engagement is the amountof user interaction with a page in any form (mouse move, scroll,swipe, key press, etc.). Since user interaction tends to occur in shortbursts, Chartbeat measures active engagement (or engagement forshort) in units of seconds and smooths the signal over time usinga sliding window of five seconds. In addition to these measures,
1http://www.chartbeat.com2Self-described in the publication’s tagline.
Site # Articles # Visitors # Page viewsFinancial 9,088 323,691 923,993Tech 12,188 739,415 822,627HowTo 13,297 532,354 556,408Science 10,837 725,039 1,554,008Women 9,807 639,261 1,629,765Sports 7,659 937,631 1,660,367Magazine 3,945 508,136 569,574Total 66,821 4,405,527 7,716,742
Table 1: The number of articles, visitors, and page views an-alyzed from each site.
we obtained the length of articles’ content and the height of users’viewport in pixels3.
Next, we describe the transformations we apply to this datasetin order to study robust patterns of engagement with news thatpersist across different sites, audiences, and devices.
4 TRANSFORMED MEASURESThe raw measures provided by Chartbeat for each page view al-ready provide useful information about engagement with newsarticles. They quantify the bulk amount of time spent on the page,how far down the page individuals scrolled, and the amount ofinteraction with the page. Prior work showed that these signalscorrelate with the relevance judgments of individuals and provideuseful information for recommendation systems [8, 15, 21].
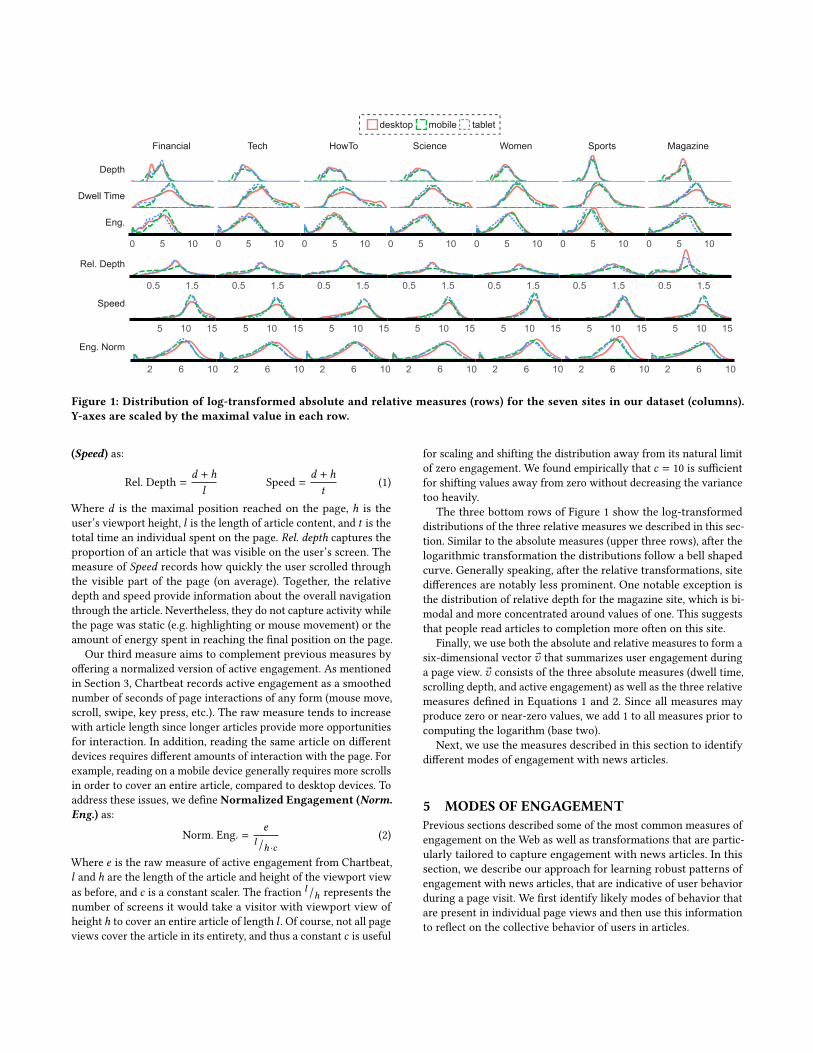
Despite the valuable information captured by measures of dwelltime, scroll depth, and the amount of page interaction, these mea-sures suffer from a few notable weaknesses. First, as absolute mea-sures, these are not universal for different sites and not necessarilyconsistent across different pages of the same site (e.g. sections withdifferent layouts). The differences in the absolute measures acrosssites can be seen in the top three rows of Figure 1, which differin their mean, variance, and skew even after log-transformation.Furthermore, the raw measures are agnostic to the content beingviewed and the context of viewing it. For example, a person read-ing a short article to completion on a desktop device may tracksimilarly to an individual reading only a small portion of a longarticle on a mobile device. Previous work proposed ways to nor-malize the raw metric per group, but not for single page views [21].Of course, content and context features can be included in recom-mendation systems along with engagment measures, but withoutdirectly modeling their relationship to user engagement the qualityof model fit may suffer. Moreover, since dwell time, scrolling depth,and active engagement are all positively correlated, using thesemeasures without modeling their inter-dependency misses valuableinformation, as we demonstrate in Section 5.
In order to address the aforementioned limitations we proposethe following three relative measures for each page view. We de-fine Relative Depth (Rel. Depth) and Average Scrolling Speed
3Vertical pixel length is sufficient for our purposes since all the included sites usednon-responsive layouts, which make the length of articles effectively constant acrossscreen resolutions.
Financial Tech HowTo Science Women Sports Magazine
Depth
Dwell Time
Eng.
0 5 10 0 5 10 0 5 10 0 5 10 0 5 10 0 5 10 0 5 10
desktop mobile tablet
0.5 1.5 0.5 1.5 0.5 1.5 0.5 1.5 0.5 1.5 0.5 1.5 0.5 1.5
Rel. Depth
5 10 15 5 10 15 5 10 15 5 10 15 5 10 15 5 10 15 5 10 15
Speed
2 6 10 2 6 10 2 6 10 2 6 10 2 6 10 2 6 10 2 6 10
Eng. Norm
Figure 1: Distribution of log-transformed absolute and relative measures (rows) for the seven sites in our dataset (columns).Y-axes are scaled by the maximal value in each row.
(Speed) as:
Rel. Depth =d + h
lSpeed =
d + h
t(1)
Where d is the maximal position reached on the page, h is theuser’s viewport height, l is the length of article content, and t is thetotal time an individual spent on the page. Rel. depth captures theproportion of an article that was visible on the user’s screen. Themeasure of Speed records how quickly the user scrolled throughthe visible part of the page (on average). Together, the relativedepth and speed provide information about the overall navigationthrough the article. Nevertheless, they do not capture activity whilethe page was static (e.g. highlighting or mouse movement) or theamount of energy spent in reaching the final position on the page.
Our third measure aims to complement previous measures byoffering a normalized version of active engagement. As mentionedin Section 3, Chartbeat records active engagement as a smoothednumber of seconds of page interactions of any form (mouse move,scroll, swipe, key press, etc.). The raw measure tends to increasewith article length since longer articles provide more opportunitiesfor interaction. In addition, reading the same article on differentdevices requires different amounts of interaction with the page. Forexample, reading on a mobile device generally requires more scrollsin order to cover an entire article, compared to desktop devices. Toaddress these issues, we define Normalized Engagement (Norm.Eng.) as:
Norm. Eng. = el /h ·c
(2)
Where e is the raw measure of active engagement from Chartbeat,l and h are the length of the article and height of the viewport viewas before, and c is a constant scaler. The fraction l /h represents thenumber of screens it would take a visitor with viewport view ofheight h to cover an entire article of length l . Of course, not all pageviews cover the article in its entirety, and thus a constant c is useful
for scaling and shifting the distribution away from its natural limitof zero engagement. We found empirically that c = 10 is sufficientfor shifting values away from zero without decreasing the variancetoo heavily.
The three bottom rows of Figure 1 show the log-transformeddistributions of the three relative measures we described in this sec-tion. Similar to the absolute measures (upper three rows), after thelogarithmic transformation the distributions follow a bell shapedcurve. Generally speaking, after the relative transformations, sitedifferences are notably less prominent. One notable exception isthe distribution of relative depth for the magazine site, which is bi-modal and more concentrated around values of one. This suggeststhat people read articles to completion more often on this site.
Finally, we use both the absolute and relative measures to form asix-dimensional vector �v that summarizes user engagement duringa page view. �v consists of the three absolute measures (dwell time,scrolling depth, and active engagement) as well as the three relativemeasures defined in Equations 1 and 2. Since all measures mayproduce zero or near-zero values, we add 1 to all measures prior tocomputing the logarithm (base two).
Next, we use the measures described in this section to identifydifferent modes of engagement with news articles.
5 MODES OF ENGAGEMENTPrevious sections described some of the most common measures ofengagement on the Web as well as transformations that are partic-ularly tailored to capture engagement with news articles. In thissection, we describe our approach for learning robust patterns ofengagement with news articles, that are indicative of user behaviorduring a page visit. We first identify likely modes of behavior thatare present in individual page views and then use this informationto reflect on the collective behavior of users in articles.
0.50
0.75
1.00
1.25
1 5 9 13 17
BIC
(mill
ion) spherical tied diag full
Figure 2: Baysian Information Criteria (BIC) for differentnumber of components K and covariance matrix structures.
5.1 Characterizing page viewsCentral to our approach is the idea that the use of multiple sum-maries of user engagement with a page can “triangulate” and re-cover valuable information about the central tendencies of userbehavior in the full time series. To test this idea, we model eachsummary vector ®v as the result of a probabilistic multivariate mix-ture model, and use the identified mixture modes to compare ourfindings to previous work, which had access to the full time se-ries. In order to learn a model that generalizes better across sitesand browsing devices, we train the model on a balanced datasetof 63,000 page views, where different sites and devices are equallyrepresented.
We use a multivariate normal (MVN) mixture model for severalreasons. First, a mixture of MVN model can capture multi-modaldistributions and provide a reasonable approximation for the bell-curve distributions observed in Figure 1. Second, the covariates ofthe MVN components are flexible enough to capture interdepen-dency between measures while keeping the model tractable andinterpretable as a whole. Third, the model is simple enough so thatpublishers could easily adopt it4. The posterior probability of anMVN mixture model is:
P(Θ|V ) =
K∑i=1
πkMVN(V |µk , Σk ) (3)
where V is the set of page view summaries ®v in our data andΘ = {π , µ, Σ} is the set of model parameters, which consist ofK multivariate normals, each parameterized by µk and Σk andweighted by πk . The covariance matrix Σk can be shared acrossdifferent components (tied), restricted to a diagonal matrix (diag) orsingle value variance matrix (spherical), or be independent for eachcomponent (full). We consider all four variants of the covariancematrix structure when optimizing model parameters.
Before fitting the model, we leave out page views that are merelyquick bounce backs. Similar to previous work [24], we considerbounce backs to be page visits where the page was visible for lessthan 10 seconds and/or had no user interaction (active engagementof zero). This enables the mixture model to focus on page visitswhere the user interacted with the content beyond just a quickglance (if any) of the first viewport view.
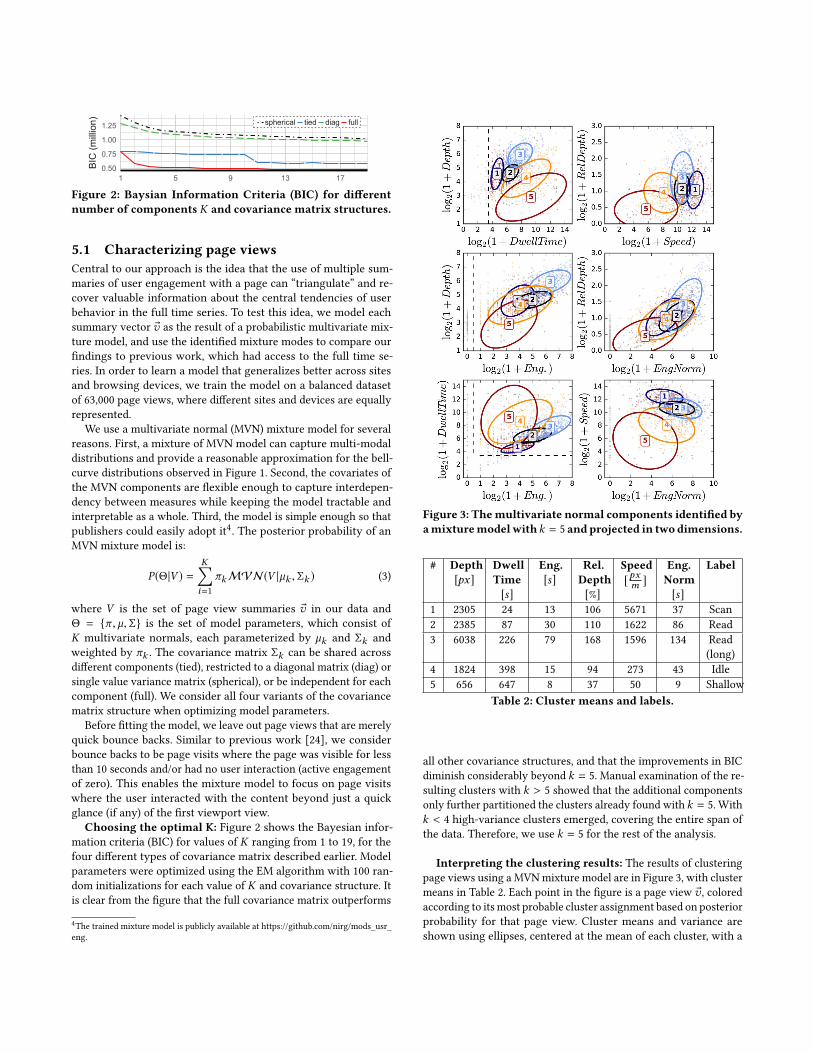
Choosing the optimal K: Figure 2 shows the Bayesian infor-mation criteria (BIC) for values of K ranging from 1 to 19, for thefour different types of covariance matrix described earlier. Modelparameters were optimized using the EM algorithm with 100 ran-dom initializations for each value of K and covariance structure. Itis clear from the figure that the full covariance matrix outperforms
4The trained mixture model is publicly available at https://github.com/nirg/mods_usr_eng.
Figure 3: Themultivariate normal components identified byamixturemodelwithk = 5 andprojected in two dimensions.
# Depth[px]
DwellTime[s]
Eng.[s]
Rel.Depth[%]
Speed[pxm ]
Eng.Norm[s]
Label
1 2305 24 13 106 5671 37 Scan2 2385 87 30 110 1622 86 Read3 6038 226 79 168 1596 134 Read
(long)4 1824 398 15 94 273 43 Idle5 656 647 8 37 50 9 Shallow
Table 2: Cluster means and labels.
all other covariance structures, and that the improvements in BICdiminish considerably beyond k = 5. Manual examination of the re-sulting clusters with k > 5 showed that the additional componentsonly further partitioned the clusters already found with k = 5. Withk < 4 high-variance clusters emerged, covering the entire span ofthe data. Therefore, we use k = 5 for the rest of the analysis.
Interpreting the clustering results: The results of clusteringpage views using a MVNmixture model are in Figure 3, with clustermeans in Table 2. Each point in the figure is a page view ®v , coloredaccording to its most probable cluster assignment based on posteriorprobability for that page view. Cluster means and variance areshown using ellipses, centered at the mean of each cluster, with a
95% confidence interval around it, as projected into two dimensions.For example, the top left panel shows how the five clusters varyin terms of scroll depth and dwell time (in logarithmic scale). Onecan see, for instance, that the light blue cluster (numbered “3”) hasthe highest average scrolling depth (top left panel) as well as thehighest average relative depth (top right panel). Table 2 confirmsthese observations, showing cluster 3 with an average scrollingdepth of 6038 pixels and average relative depth of 168%. The dashedlines on the left panels designate the thresholds used for delineatingquick bounce backs as described earlier.
Using the clustering results, we can label the different engage-ment modes identified in the data. The top right panel of Figure 3shows that the different components vary in their scrolling speedsand coverage of articles. Clusters 1, 2, and 4 cover roughly thesame portion of articles (same RelDepth), but at vastly differentspeeds. Table 2 shows that page views in clusters 1, 2, and 4 cov-ered around 100% of articles, but page views in cluster 1 did soin speeds 3-20 times faster. In order to compare these speeds tothe ones documented in the literature, in words per minute, wemultiply the number of words in an article by the relative portionviewed (Rel. Depth) and divide by Dwell Time (in minutes). Thecentral 50% of reading speeds in cluster 1 ranges from 1035 to 1823words/minute, which is well above in-depth or even skim readingspeeds documented in the literature [27, 30]. Therefore, we considercluster 1 as reflecting scanning behavior.
Clusters 2 and 3 have similar distributions of speed and nor-malized engagement distributions, but differ in all other aspects.While the absolute measures (left three panels) show cluster 3 asmostly distinct from other clusters, the relative measures (rightthree panels) show significant overlaps between the two clusters.This suggests that a similar underlying user behavior is presentin both of these clusters, one that we could not identify based onthe absolute measures alone. Page views in clusters 2 and 3 reachrelatively deeply into articles, have high levels of user interaction,and translate to reading speeds of 200 to 600 words/minute in thecentral 50%. Page views in cluster 3 often reach past the articlebody and involve slightly more user interactions, potentially in-teracting with user-generated comments after the main body ofarticles. Based on these characteristics, we believe that it is likelythat clusters 1 and 3 reflect reading behaviors. This interpretationis consistent with the literature, which describe in-depth readingat a speed of 200-300 words/minute and skimming at 3-4 timesfaster speed [27, 30]. Moreover, clusters 1 and 3 correspond to the“deep” (covering entire articles) and “complete” (reaching the con-tent) behaviors identified in Lagun and Lalmas’s work using thefull engagement time series [24]. Therefore, we use “read” and“read (long)” to distinguish between the two clusters, reflecting thatextended engagement in cluster 3.
Cluster 4 is characterized by relative depth that is similar to otherclusters, but at significantly slower speeds, with relatively little pageinteraction. Together with the fact that 75% of page views in thiscluster correspond to reading speeds below 100 words/minute itseems likely that the cluster includes a short period of user activitycoupled with a longer period of inactivity. We suspected that thiscluster might capture user engagement with videos, but a randomsample of articles in this cluster did not support this hypothesis.Hence, we refer to cluster 4 as involving some “idle” behavior.
Idle Read Read (long)
Bounce back Shallow Scan
Fina
ncia
lTe
chH
owTo
Sci
ence
Wom
enS
ports
Mag
azin
e
Fina
ncia
lTe
chH
owTo
Sci
ence
Wom
enS
ports
Mag
azin
e
Fina
ncia
lTe
chH
owTo
Sci
ence
Wom
enS
ports
Mag
azin
e
10%
20%
30%
10%20%30%40%
0%1%2%3%
10%
20%
30%
10%15%20%25%
10%15%20%25%30%
Page
vie
w p
roba
bilit
y
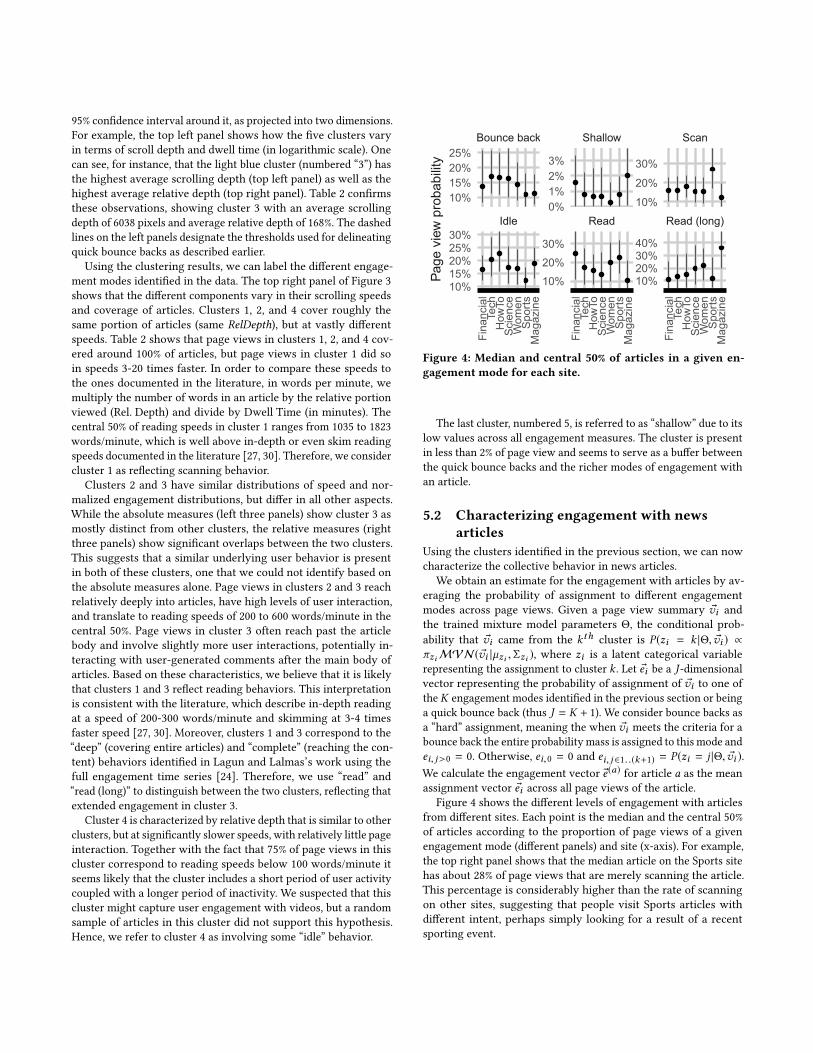
Figure 4: Median and central 50% of articles in a given en-gagement mode for each site.
The last cluster, numbered 5, is referred to as “shallow” due to itslow values across all engagement measures. The cluster is presentin less than 2% of page view and seems to serve as a buffer betweenthe quick bounce backs and the richer modes of engagement withan article.
5.2 Characterizing engagement with newsarticles
Using the clusters identified in the previous section, we can nowcharacterize the collective behavior in news articles.
We obtain an estimate for the engagement with articles by av-eraging the probability of assignment to different engagementmodes across page views. Given a page view summary ®vi andthe trained mixture model parameters Θ, the conditional prob-ability that ®vi came from the kth cluster is P(zi = k |Θ, ®vi ) ∝
πziMVN( ®vi |µzi , Σzi ), where zi is a latent categorical variablerepresenting the assignment to cluster k . Let ®ei be a J -dimensionalvector representing the probability of assignment of ®vi to one oftheK engagement modes identified in the previous section or beinga quick bounce back (thus J = K + 1). We consider bounce backs asa “hard” assignment, meaning the when ®vi meets the criteria for abounce back the entire probability mass is assigned to this mode andei, j>0 = 0. Otherwise, ei,0 = 0 and ei, j ∈1..(k+1) = P(zi = j |Θ, ®vi ).We calculate the engagement vector ®e(a) for article a as the meanassignment vector ®ei across all page views of the article.
Figure 4 shows the different levels of engagement with articlesfrom different sites. Each point is the median and the central 50%of articles according to the proportion of page views of a givenengagement mode (different panels) and site (x-axis). For example,the top right panel shows that the median article on the Sports sitehas about 28% of page views that are merely scanning the article.This percentage is considerably higher than the rate of scanningon other sites, suggesting that people visit Sports articles withdifferent intent, perhaps simply looking for a result of a recentsporting event.
A few interesting points emerge from Figure 4. The proportionof Read (long) (bottom right panel) shows that visitors to the Mag-azine articles are almost twice as likely to engage in longer readsthan visitors on any other site. This runs counter to the belief thatreading on digital devices, particularly of web pages content, dimin-ishes people’s ability to engage for long periods of time [4, 9, 29, 34].Another interesting point is the relatively high percent of Idle en-gagements in How To articles. The few articles we examined fromthis site gave instructions for fixing, making, or doing something inthe physical world. It is therefore plausible that people disengagefrom their digital devices to follow instructions in the physicalworld.
In summary, this section presented an approach for utilizing sim-ple summary statistics of page visits to news articles to characterizelikely user behaviors on the page. We identified modes that can en-able publishers and recommendation system to distinguish betweendifferent modes of reading, scanning and other lighter forms of en-gagement, and showed that distribution among different modes ofengagement varies across sites.
Next, we develop ameasure of information gainwithin the text ofarticles and examine how this measure relates to user engagement.
6 SEMANTIC INFORMATION GAINThe previous section characterized six prototypical modes of en-gagement with news articles. Of course, we expect individuals’ read-ing decisions to be influenced by the content they read. Previouswork explored the impact of non-textual elements (e.g. images, ads)and general properties of a text on users’ engagement [14, 24, 42].Our goal in this section is to develop a novel measure that capturesthe flow of information within the text of articles, and explainssome of the variability in the way people engage with articles.
Inspired by ideas from the theory of Information Foraging [10,11, 36], we develop a measure for semantic information gain witheach paragraph of a text5. Paragraphs serve as natural units ofanalysis, which according to newswriting guidelines should containa single idea [39]. We further assume that reading happens linearly,one paragraph at a time, in the order it appears in the text. Thisassumption is somewhat supported by studies of eye-movement [10,23], and is necessary in our case since we do not have the timeseries information about users navigating through pages.
We calculate the semantic information gain (SIG) of articles asfollows. We train a 48-dimensional Doc2Vec model [25] based onthe entire corpus of articles (N=66,821) with 20 iterations over thecorpus, excluding stopwords and removing tokens that appearedin less than 10 documents. A simple validity test shows that thevector embeddings capture a significant amount of informationabout the articles – the cosine self-similarity of train documents totheir inferred vector embedding after training is above 0.8 in 95%of articles. Let ®d(a) be the vector embedding for article a, and ®p
(a)1..l
be the vector embedding inferred for the text accumulated fromparagraphs 1 through l of the article. We define SIG(l) for eacharticle as the cosine similarity of ®d(a) and ®p
(a)1..l .
The SIG as a function of ordinal position of paragraphs has twomain drawbacks: it does not distinguish between paragraphs of5Our notion of information gain is different than the one commonly used in decisiontrees.
different length and it is not monotonically increasing, as one mightexpect when comparing the full text to increasing prefixes of itself.To address both of these issues, we convert the SIG to a function ofrelative pixel depth in an article (as defined in Section 4) by replacingthe ordinal indices of paragraphs with their relative pixel depthand interpolating the information gain between points. We fit asecond-degree polynomial to the SIG of each article using quadraticprogramming, with constraints that restrict the polynomial to bemostlymonotonic increasing, bounded from above by themaximumSIG value of one, and reach its peak within the bounds of the article.More formally, these constraints are a non-positive quadratic term(a <= 0), intercept c <= 1 and vertex = − b
2a <= 1. The quadraticapproximation achieved an R2 of 0.87, a 5% improvement over theunconstrained quadratic fit.
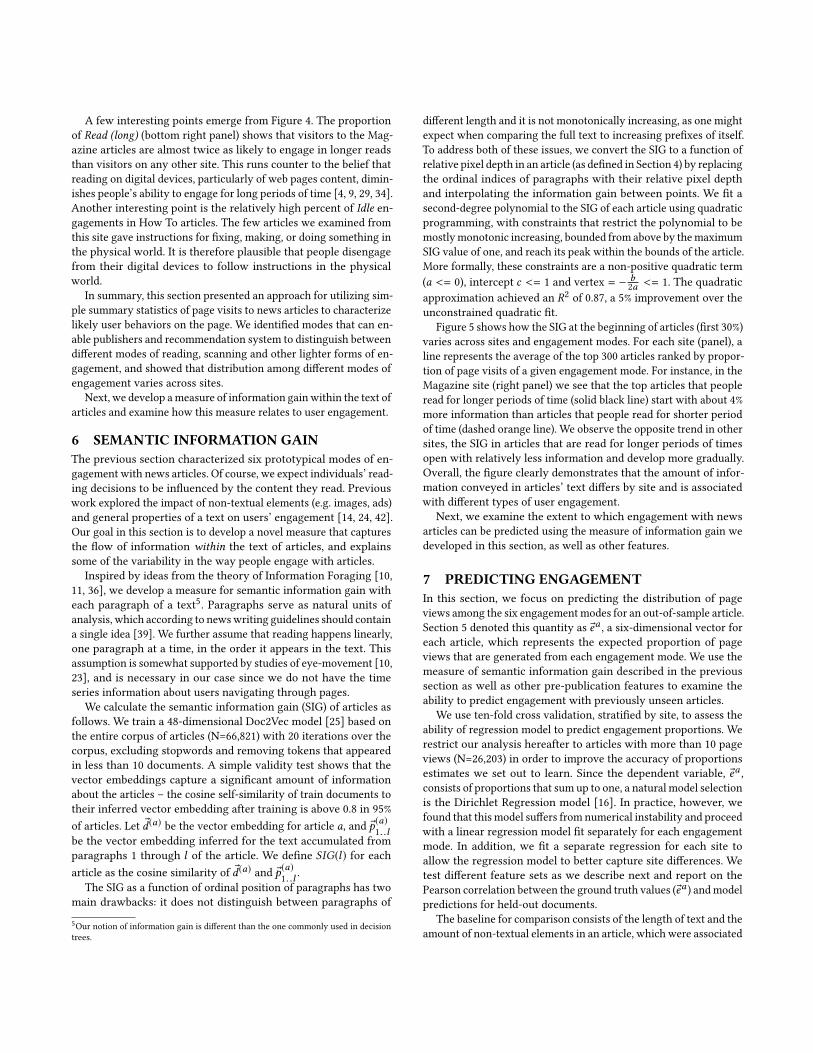
Figure 5 shows how the SIG at the beginning of articles (first 30%)varies across sites and engagement modes. For each site (panel), aline represents the average of the top 300 articles ranked by propor-tion of page visits of a given engagement mode. For instance, in theMagazine site (right panel) we see that the top articles that peopleread for longer periods of time (solid black line) start with about 4%more information than articles that people read for shorter periodof time (dashed orange line). We observe the opposite trend in othersites, the SIG in articles that are read for longer periods of timesopen with relatively less information and develop more gradually.Overall, the figure clearly demonstrates that the amount of infor-mation conveyed in articles’ text differs by site and is associatedwith different types of user engagement.
Next, we examine the extent to which engagement with newsarticles can be predicted using the measure of information gain wedeveloped in this section, as well as other features.
7 PREDICTING ENGAGEMENTIn this section, we focus on predicting the distribution of pageviews among the six engagement modes for an out-of-sample article.Section 5 denoted this quantity as ®ea , a six-dimensional vector foreach article, which represents the expected proportion of pageviews that are generated from each engagement mode. We use themeasure of semantic information gain described in the previoussection as well as other pre-publication features to examine theability to predict engagement with previously unseen articles.
We use ten-fold cross validation, stratified by site, to assess theability of regression model to predict engagement proportions. Werestrict our analysis hereafter to articles with more than 10 pageviews (N=26,203) in order to improve the accuracy of proportionsestimates we set out to learn. Since the dependent variable, ®ea ,consists of proportions that sum up to one, a natural model selectionis the Dirichlet Regression model [16]. In practice, however, wefound that this model suffers from numerical instability and proceedwith a linear regression model fit separately for each engagementmode. In addition, we fit a separate regression for each site toallow the regression model to better capture site differences. Wetest different feature sets as we describe next and report on thePearson correlation between the ground truth values (®ea ) andmodelpredictions for held-out documents.
The baseline for comparison consists of the length of text and theamount of non-textual elements in an article, which were associated
Financial Tech HowTo Science Women Sports Magazine
0% 10% 20% 0% 10% 20% 0% 10% 20% 0% 10% 20% 0% 10% 20% 0% 10% 20% 0% 10% 20%70%
75%
80%
85%
% Article
Info
. Gai
n
Bounce back Shallow Scan Idle Read Read (long)
Figure 5: Semantic information gain for the top articles in each site by engagement mode.
to user engagement in previous work [14, 24, 42]. We measure thetext length in number of words, excluding stopwords and infrequentwords as described in Section 6. The amount of non-textual contentis computed as the ratio of article visual length (i.e. in pixels) tonumber of words.
The next set of features includes the latent topics of the text.We run the standard LDA model [5] using Gibbs sampling on thesame train-test folds of our cross validation and include the topicproportion predictions from LDA (θd ) as features in the regres-sion. We implement the TUNE model6 proposed by Lagun andLalmas [24], which jointly models the text and the proportions ofengagement modes. From the TUNE model we extract the topicproportions of test documents and the predicted distribution amongthe engagement modes as features. Hyperparameters in both mod-els were assigned to α = 50/T and β = 0.1 following the commonlyused heuristic, and we experimented with the number of topicsT ∈ {10, 20, 30, 40, 50}. We closely monitored convergence in bothmodels using the log-likelihood. For brevity, we only report theresults of these models withT = 50, which outperformed the resultsobtained using all other configurations.
In addition to broad topics of the text, we include features thatdescribe the difficulty of the text, its sentiment, and of course thesemantic information gain (SIG).We use sentence length and Flesch-Kincaid grade-level score as proxy for difficulty [22]. We computethe difficulty for both article lede (first three sentences) and of theentire article. We use the empirically-validated sentiment analysistool VADER [19] to compute the average sentiment for the ledeand the entire article. Finally, we include the three quadratic terms(a, b, and c) approximating the SIG in each article. We also includethe raw SIG scores for the first three paragraphs (without anyapproximation) to better capture the information gained at thebeginning of articles.
Lastly, we examine the ability of post-publication features topredict the distribution among different engagement modes. Weuse audience composition features that describe percentages ofvisitors on mobile devices, visitors from different referral sources(search, social media, other news sites), and visits at different timesof the day. We compare the predictive power of post-publicationaveraged dwell time, which can be approximated on the server-side,with client-side averages of scrolling depth and active engagement.
6Our implementation of the TUNE algorithm is available at https://github.com/nirg/mods_usr_eng.
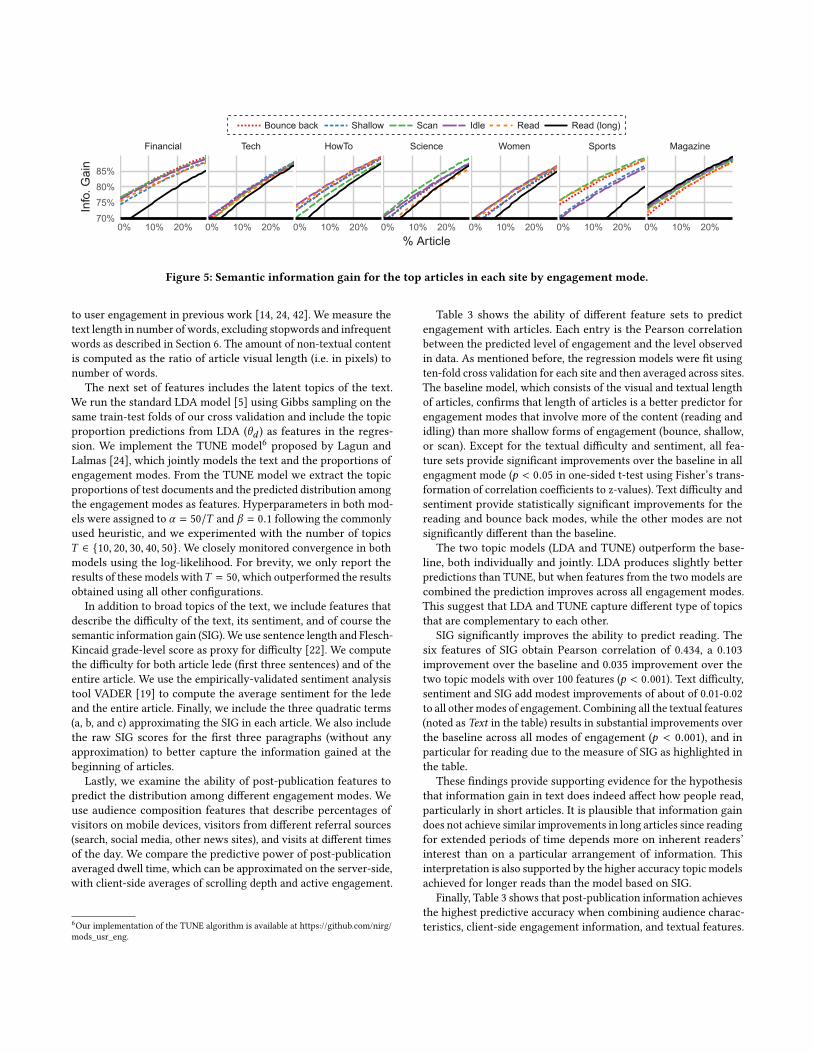
Table 3 shows the ability of different feature sets to predictengagement with articles. Each entry is the Pearson correlationbetween the predicted level of engagement and the level observedin data. As mentioned before, the regression models were fit usingten-fold cross validation for each site and then averaged across sites.The baseline model, which consists of the visual and textual lengthof articles, confirms that length of articles is a better predictor forengagement modes that involve more of the content (reading andidling) than more shallow forms of engagement (bounce, shallow,or scan). Except for the textual difficulty and sentiment, all fea-ture sets provide significant improvements over the baseline in allengagment mode (p < 0.05 in one-sided t-test using Fisher’s trans-formation of correlation coefficients to z-values). Text difficulty andsentiment provide statistically significant improvements for thereading and bounce back modes, while the other modes are notsignificantly different than the baseline.
The two topic models (LDA and TUNE) outperform the base-line, both individually and jointly. LDA produces slightly betterpredictions than TUNE, but when features from the two models arecombined the prediction improves across all engagement modes.This suggest that LDA and TUNE capture different type of topicsthat are complementary to each other.
SIG significantly improves the ability to predict reading. Thesix features of SIG obtain Pearson correlation of 0.434, a 0.103improvement over the baseline and 0.035 improvement over thetwo topic models with over 100 features (p < 0.001). Text difficulty,sentiment and SIG add modest improvements of about of 0.01-0.02to all othermodes of engagement. Combining all the textual features(noted as Text in the table) results in substantial improvements overthe baseline across all modes of engagement (p < 0.001), and inparticular for reading due to the measure of SIG as highlighted inthe table.
These findings provide supporting evidence for the hypothesisthat information gain in text does indeed affect how people read,particularly in short articles. It is plausible that information gaindoes not achieve similar improvements in long articles since readingfor extended periods of time depends more on inherent readers’interest than on a particular arrangement of information. Thisinterpretation is also supported by the higher accuracy topic modelsachieved for longer reads than the model based on SIG.
Finally, Table 3 shows that post-publication information achievesthe highest predictive accuracy when combining audience charac-teristics, client-side engagement information, and textual features.
)gnol(daeRdaeReldInacSwollahSecnuoBteserutaeF
976.033.073.082.080.632.enilesaB
Baseline+LDA(T=50) .302 .132 .355 .410 .393 .710Baseline+TUNE(T=50) .286 .137 .330 .390 .367 .698Baseline+LDA+TUNE(T=50) .311 .140 .362 .414 .399 .711
986.434.683.692.990.452.GIS+enilesaB.265 .105 .303 .388 .442 .696
Baseline+Text .321 .145 .366 .426 .476 .717
Baseline+Audience .373 .205 .383 .446 .367 .694Baseline+Avg. Dwell Time .562 .188 .472 .578 .397 .713Baseline+Avg. Engagement .848 .478 .585 .657 .580 .864Baseline+Audience+Avg.Eng+Text .858 .484 .608 .684 .634 .875
Table 3: Pearson correlation (averaged across sites) between predicted and observed article engagement. Brackets indicate keyprediction improvements described in the text.
The features that characterize the audience of an article predictbounce backs and shallow engagement better than the text-basedmodels. Article-averaged dwell time, which can be approximatedfrom server logs, is the single best predictor of non-reading engage-ment. It requires additional client-side information about the article,average scrolling depth and active interaction (indicated as Avg.Engagement), to obtain better estimates of reading. Combining allof these with the textual features provides further improvements,demonstrating that each feature category captures different andunique aspect of user engagement.
8 CONCLUSION AND FUTUREWORKIn this paper, we developed a scalable approach for capturing post-click user engagement with online news articles. We proposed ametric that enabled us to meaningfully compare summaries of userinteraction across different news articles, sites, and mobile and non-mobile devices. Despite being compact, we showed that our metricretains sufficient information in order to distinguish between differ-ent modalities of post-click behavior, which mapped to behaviorsidentified in previous work using much more granular data. Usinga multivariate normal mixture model we identified six prototypicalmodes of engagement that range from quick bounce backs to ex-tended reading. We showed that the engagement modes are present,to varying degrees, in all seven sites in our dataset. Furthermore,we introduced a novel measure of semantic information gain innews articles that captures the development of ideas within the textof articles. We found that our measure of information gain is thesingle best predictor of reading engagement prior to publication,and that the measure remains valuable even after publication inthe presence of information about the article audience and actualengagement averages.
The study highlighted several key findings. We observed thatcertain modes of engagement are more prominent in certain sites.In particular, we found substantially more scanning in Sports, more
idling in “How To”, and more extensive reading for long-form mag-azine content. Extensive reading of long online content is particu-larly interesting since it runs counter to popular claims that onlinereading hinders people’s ability to focus for extended periods oftime [4, 9, 29, 34]. Second, our findings suggest that the organizationof ideas within the body of articles affects how people engage withit. We found that our measure of information gain in text is a goodpredictor for reading of articles, but less so for extended readingof long articles. We believe that this finding reflects an importantlimitation of good writing – it needs to be coupled with strong userinterest in order to be read more fully, especially for long articles.
The overall approach laid out in this work provides a tangibleway for digital publishers to adopt informative and cost-effectivemeasures of user engagement with news articles. The summaries ofuser interaction we proposed are simple to track using client-sidelogging and compact enough to require only a minimal amount ofadditional storage per page view. Publishers can use the mixturemodel trained in this work to translate raw page views into moremeaningful concepts for describing user engagement with newscontent, such as the proportion of likely reading or skimming events.These new measures can inform editorial decisions, which in turncould help improve the experience of readers.
There are several avenues for future work to extend the currentstudy. The additional information extracted from page visits canbe integrated into recommendation systems, which could lead tosimilar improvements derived from the use of dwell time [21, 42].A more nuanced view of the behavior of visitors can enable bettertargeting of content to potential reader populations. In addition,combiningmeasures of user engagment with text could prove usefulin text summarization tasks. More generally, future work couldinvestigate the origins of the engagement differences we observedin the current work, distinguishing between individual differences,differences in user intent across different genres, and properties ofthe content itself.
9 ACKNOWLEDGMENTSThe author would like to thank Josh Schwartz, Chief Data Scientistat Chartbeat, for his continued support of this work and manyuseful discussions about tracking in real-world settings. The authorwould also like to thank Dan Valente for his instrumental helpin devising and optimizing the collection process of the raw data.Finally, the author is grateful to the anonymous reviewers for theirthoughtful and insightful comments, which helped improve thequality of the paper.
REFERENCES[1] Eugene Agichtein, Eric Brill, and Susan Dumais. 2006. Improving web search
ranking by incorporating user behavior information. In Proc. SIGIR 2006.[2] Ioannis Arapakis, Mounia Lalmas, B. Barla Cambazoglu, Mari-Carmen Marcos,
and Joemon M. Jose. 2014. User engagement in online news: Under the scope ofsentiment, interest, affect, and gaze. JASIST 65, 10 (2014), 1988–2005.
[3] Ralf Biedert, Jörn Hees, Andreas Dengel, and Georg Buscher. 2012. A robustrealtime reading-skimming classifier. In Proc. ETRA 2012.
[4] Sven Birkerts. 2006. The Gutenberg elegies: The fate of reading in an electronic age.Macmillan.
[5] David M. Blei, Andrew Y. Ng, and Michael I. Jordan. 2003. Latent dirichletallocation. JMLR 3, Jan (2003), 993–1022.
[6] Georg Buscher, Edward Cutrell, and Meredith R. Morris. 2009. What do you seewhen you’re surfing?: using eye tracking to predict salient regions of web pages.In Proc. CHI 2009.
[7] Christopher S. Campbell and Paul P. Maglio. 2001. A robust algorithm for readingdetection. In Proc. PUI 2001.
[8] Mark Claypool, Phong Le, Makoto Wased, and David Brown. 2001. ImplicitInterest Indicators. In Proc. of IUI 2001. 33–40.
[9] Microsoft Canada Consumer insights. 2015. Attention spans. (2015).https://advertising.microsoft.com/en/WWDocs/User/display/cl/researchreport/31966/en/microsoft-attention-spans-research-report.pdf.
[10] Geoffrey B. Duggan and Stephen J. Payne. 2009. Text skimming: the process andeffectiveness of foraging through text under time pressure. Journal of Experimen-tal Psychology: Applied 15, 3 (2009), 228.
[11] Geoffrey B. Duggan and Stephen J. Payne. 2011. Skim reading by satisficing:evidence from eye tracking. In Proc. of CHI’2011. ACM.
[12] Steve Fox, Kuldeep Karnawat, Mark Mydland, Susan Dumais, and Thomas White.2005. Evaluating implicit measures to improve web search. Transactions onInformation Systems (TOIS) 23, 2 (2005), 147–168.
[13] Ruth Garner. 1987. Metacognition and reading comprehension. Ablex Publishing.[14] Daniel G. Goldstein, Siddharth Suri, R. PrestonMcAfee, Matthew Ekstrand-Abueg,
and Fernando Diaz. 2014. The economic and cognitive costs of annoying displayadvertisements. Journal of Marketing Research 51, 6 (2014), 742–752.
[15] Qi Guo and Eugene Agichtein. 2012. Beyond dwell time: estimating documentrelevance from cursor movements and other post-click searcher behavior. In Proc.WWW 2012.
[16] Rafiq H. Hijazi and Robert W. Jernigan. 2009. Modelling compositional data usingDirichlet regression models. Applied Probability & Statistics 4, 1 (2009), 77–91.
[17] William Horton, Lee Taylor, Arthur Ignacio, and Nancy L. Hoft. 1996. The Webpage design cookbook: all the ingredients you need to create 5-star Web pages.New York: Wiley, 1996 (1996).
[18] Jeff Huang, Ryen W. White, Georg Buscher, and Kuansan Wang. 2012. Improvingsearcher models using mouse cursor activity. In Proc. SIGIR 2012.
[19] Clayton J. Hutto and Eric Gilbert. 2014. Vader: A parsimonious rule-based modelfor sentiment analysis of social media text. In Proc. ICWSM 2014.
[20] Peter H. Johnston. 1983. Reading comprehension assessment: A cognitive basis.ERIC.
[21] Youngho Kim, Ahmed Hassan, Ryen W. White, and Imed Zitouni. 2014. Modelingdwell time to predict click-level satisfaction. In Proc. WSDM 2014.
[22] J. Peter Kincaid, Robert P. Fishburne Jr., Richard L. Rogers, and Brad S. Chissom.1975. Derivation of new readability formulas (automated readability index, fogcount and flesch reading ease formula) for navy enlisted personnel. TechnicalReport. DTIC Document.
[23] Dmitry Lagun and Eugene Agichtein. 2015. Inferring searcher attention by jointlymodeling user interactions and content salience. In Proc. SIGIR 2015.
[24] Dmitry Lagun and Mounia Lalmas. 2016. Understanding User Attention andEngagement in Online News Reading. In Proc. of WSDM 2016.
[25] Quoc Le and Tomas Mikolov. 2014. Distributed representations of sentences anddocuments. In Proc. ICML 2014).
[26] Janette Lehmann, Mounia Lalmas, Elad Yom-Tov, and Georges Dupret. 2012.Models of user engagement. In Proc. UMAP 2012.
[27] Guoqiang Liao. 2011. On the Development of Reading Ability. Theory and Practicein Language Studies 1, 3 (2011), 302–305.
[28] Chao Liu, RyenW.White, and Susan Dumais. 2010. Understanding web browsingbehaviors through weibull analysis of dwell time. In Proc. SIGIR 2010.
[29] Ziming Liu. 2005. Reading behavior in the digital environment: Changes inreading behavior over the past ten years. Journal of documentation 61, 6 (2005),700–712.
[30] Michael E. Masson. 1982. Cognitive processes in skimming stories. Journal ofExperimental Psychology: Learning, Memory, and Cognition 8, 5 (1982).
[31] Amy Mitchell, Jeffrey Gottfried, Michael Barthel, and Elisa Shearer. 2016. TheModern News Consumer, News Attitudes and Practices in the Digital Era. (2016).
[32] Masahiro Morita and Yoichi Shinoda. 1994. Information filtering based on userbehavior analysis and best match text retrieval. In Proc. SIGIR 1994.
[33] Vidhya Navalpakkam, LaDawn Jentzsch, Rory Sayres, Sujith Ravi, Amr Ahmed,and Alex Smola. 2013. Measurement and modeling of eye-mouse behavior in thepresence of nonlinear page layouts. In Proc. WWW 2013.
[34] Jakob Nielsen. 2008. How Little Do Users Read. (2008). http://www.nngroup.com/articles/how-little-do-users-read/.
[35] Christine Nuttall. 1996. Teaching reading skills in a foreign language. ERIC.[36] Peter Pirolli and Stuart Card. 1999. Information foraging. Psychological review
106, 4 (1999), 643.[37] Kenneth R. Pugh, Bennett A. Shaywitz, Sally E. Shaywitz, R. Todd Constable,
Pawel Skudlarski, Robert K. Fulbright, Richard A. Bronen, Donald P. Shankweiler,Leonard Katz, Jack M. Fletcher, and John C. Gore. 1996. Cerebral organization ofcomponent processes in reading. Brain 119, 4 (1996), 1221–1238.
[38] Keith Rayner. 1998. Eye movements in reading and information processing: 20years of research. Psychological bulletin 124, 3 (1998), 372.
[39] Carole Rich. 2015. Writing and reporting news: A coaching method. CengageLearning. 259 pages.
[40] Alexandre N. Tuch, Javier A. Bargas-Avila, Klaus Opwis, and Frank H. Wilhelm.2009. Visual complexity of websites: Effects on users’ experience, physiology,performance, and memory. International Journal of Human-Computer Studies 67,9 (2009), 703 – 715.
[41] Ou Wu, Yunfei Chen, Bing Li, and Weiming Hu. 2011. Evaluating the visualquality of web pages using a computational aesthetic approach. In Proc. WSDM2011.
[42] Xing Yi, Liangjie Hong, Erheng Zhong, Nanthan N. Liu, and Suju Rajan. 2014.Beyond clicks: dwell time for personalization. In Proc. RecSys 2014.