Identifying Land Use/Cover Dynamics in the Koga Catchment
22
ISPRS Int. J. Geo-Inf. 2013, 2, 302-323; doi:10.3390/ijgi2020302 ISPRS International Journal of Geo-Information ISSN 2220-9964 www.mdpi.com/journal/ijgi/ Article Identifying Land Use/Cover Dynamics in the Koga Catchment, Ethiopia, from Multi-Scale Data, and Implications for Environmental Change Eleni Yeshaneh 1, *, Wolfgang Wagner 1 , Michael Exner-Kittridge 1 , Dagnachew Legesse 2 and Günter Blöschl 1 1 Center for Water Resources Systems, Vienna University of Technology, Karlsplatz 13, 1040 Vienna, Austria; E-Mails: [email protected] (W.W.); [email protected] (M.E.-K.); [email protected] (G.B.) 2 Department of Earth Sciences, Addis Ababa University, P.O. Box 1176, Addis Ababa, Ethiopia; E-Mail: [email protected] * Author to whom correspondence should be addressed; E-Mail: [email protected]; Tel.: +43-1-58801-406661; Fax: +43-1-58801-22399. Received: 24 January 2013; in revised form: 11 March 2013 / Accepted: 13 March 2013 / Published: 2 April 2013 Abstract: This study analyzed more than 50 years of land cover and land use changes in the 260 km 2 Koga catchment in North Western Ethiopia. The data used includes 1:50,000 scale aerial photographs, Landsat MSS, TM and ETM images, and ASTER images together with ground truth data collected through field surveys and community elders’ interviews. Aerial photographs have high spatial resolution but provide lower spectral resolution than satellite data. While most land use/cover change studies compare changes from different spatial scales, this study applied land use/cover classification techniques to bring the data to a relatively similar scale. The data revealed that woody vegetation decreased from 5,576 ha to 3,012 ha from the 1950s to 2010. Most of the deforestation took place between the 1970s and 1980s, but there is an increasing trend since then. No significant changes were observed in the area used for agriculture that comprises the pastures and crop fields since the 1950s, while there is an enormous increase in the area used for settlement, due to a tremendous increase in population from one point in time to another. The bare lands that used to exist in previous years were found to be totally covered with other land cover/use classes and no bare lands were observed in the study area in the year 2010. Population pressure and land use policies were found to be reasons for the changes in land use/cover while soil degradation, OPEN ACCESS
Transcript of Identifying Land Use/Cover Dynamics in the Koga Catchment
ISPRS Int. J. Geo-Inf. 2013, 2, 302-323; doi:10.3390/ijgi2020302
ISPRS International
Journal of
Geo-Information ISSN 2220-9964
www.mdpi.com/journal/ijgi/
Article
Identifying Land Use/Cover Dynamics in the Koga Catchment,
Ethiopia, from Multi-Scale Data, and Implications for
Environmental Change
Eleni Yeshaneh 1,
*, Wolfgang Wagner 1, Michael Exner-Kittridge
1, Dagnachew Legesse
2
and Günter Blöschl 1
1 Center for Water Resources Systems, Vienna University of Technology, Karlsplatz 13, 1040 Vienna,
Austria; E-Mails: [email protected] (W.W.); [email protected] (M.E.-K.);
[email protected] (G.B.) 2 Department of Earth Sciences, Addis Ababa University, P.O. Box 1176, Addis Ababa, Ethiopia;
E-Mail: [email protected]
* Author to whom correspondence should be addressed; E-Mail: [email protected];
Tel.: +43-1-58801-406661; Fax: +43-1-58801-22399.
Received: 24 January 2013; in revised form: 11 March 2013 / Accepted: 13 March 2013 /
Published: 2 April 2013
Abstract: This study analyzed more than 50 years of land cover and land use changes in the
260 km2 Koga catchment in North Western Ethiopia. The data used includes 1:50,000 scale
aerial photographs, Landsat MSS, TM and ETM images, and ASTER images together with
ground truth data collected through field surveys and community elders’ interviews. Aerial
photographs have high spatial resolution but provide lower spectral resolution than satellite
data. While most land use/cover change studies compare changes from different spatial
scales, this study applied land use/cover classification techniques to bring the data to a
relatively similar scale. The data revealed that woody vegetation decreased from 5,576 ha to
3,012 ha from the 1950s to 2010. Most of the deforestation took place between the 1970s and
1980s, but there is an increasing trend since then. No significant changes were observed in
the area used for agriculture that comprises the pastures and crop fields since the 1950s,
while there is an enormous increase in the area used for settlement, due to a tremendous
increase in population from one point in time to another. The bare lands that used to exist in
previous years were found to be totally covered with other land cover/use classes and no bare
lands were observed in the study area in the year 2010. Population pressure and land use
policies were found to be reasons for the changes in land use/cover while soil degradation,
OPEN ACCESS
ISPRS Int. J. Geo-Inf. 2013, 2 303
decrease in the indigenous woody vegetation and erosion were the observed consequences of
the land use/cover changes.
Key words: land use/land cover change; image fusion; and environmental change
1. Introduction
Land use change trends in many developing countries are both extremely rapid and the direction of
changes and rates are in flux [1]. Land use/cover changes are the primary source of soil degradation [2,3];
and by altering ecosystem services, affect the ability of biological systems to support human
needs [2,4–6]. Before remedial policies and programs can be effective, it is useful to understand in what
way land use has changed and what are the principal causes [1,7,8].
Africa is said to have the fastest rate of deforestation in the world as a result of overdependence on
primary resources [9]. Climate changes and rapid population growth cause increasing pressure on the
East African highlands. The results of the pressure are manifold: intensified agriculture, decreasing
amount of forest land, loss of biodiversity, intensified land degradation and soil erosion [10].
Deforestation rates in East Africa, including Ethiopia, were the second highest in Africa: 0.94% for
1990–2000 and 0.97% for 2000–2005 [11]. A study conducted in North Western Ethiopia indicated 99%
clearing of the forest cover of the 1950s until the year 1995 [12]. The population of Ethiopia, which is
currently 79 million people, increases by almost two million annually under highly unfavorable
economic and environmental conditions [11]. Population pressures in Ethiopia have decreased the size
of holdings, including both arable and pasture lands, leading to conversion of forested and marginal
areas into agricultural lands [13]. Farm sizes in Ethiopia have been declining over time, and roughly a
quarter of the agricultural households are virtually landless, controlling less than 0.1 ha per capita [14].
Awulachew et al. [15] also indicated high population pressure induced deforestation, overgrazing, land
degradation and declining agricultural productivity in the upstream part of the Blue Nile basin.
The combination of increased interest in environmental changes over large areas and improved data
and interpretation methodologies is leading to an increasing number of studies and projects using land
use change analysis [1]. Satellite data, appropriately calibrated and validated with ground data, provide
spatial information on the distribution of land cover types and changes over time [4,16]. Whereas such
information could previously only be obtained over small areas from ground surveys or aerial
photographs, satellite data extend the coverage over larger areas at more frequent time intervals [17,18].
On the other hand, historical aerial photographs have much longer temporal history than satellite images,
and are an important source of data for long term land cover change analysis [19]. In addition, aerial
photographs have generally higher spatial resolution and therefore offer the possibility of providing
more detailed local and regional vegetation information for landscape ecological assessments [20].
Remotely sensed data need to be supported and validated with ground truth data that is achieved
through either field surveys or documented data. Interviews with the local people can be an additional
option when either of the two previous ways is not possible. Conducting group or key informant
interviews is one way of gathering information on the past land use changes and the root causes. Critical
information may be obtained from interviews with local people from mainly community elders
ISPRS Int. J. Geo-Inf. 2013, 2 304
concerning their impressions of the patterns of land use change that have occurred, and the reasons
behind those changes [1].
One of the challenges of land use/cover research is to maintain continuous time series of data to
generate uninterrupted time series for analysis. This need is and will continue to be impeded by the
malfunction of Landsat 7 since 2003, given that the Landsat system, with its spatiotemporal resolution
(900 square meters, every 16 days) and relatively low costs, has been the ―workhorse‖ data base for so
much of the land cover classification [6]. The other challenge is when remotely sensed data come from
different sensors MSS with TM, different pixel size affects the classification as a given land cover is not
seen in the same way at different pixel sizes. The classifications differ because some elements are not
detected in the coarser resolution images, which do appear in the finer resolution images [21]. Similarly,
spectral reflectance properties of natural surfaces at a given moment often prevents consistent
identification and mapping of a large range of cover classes such as agricultural crops or detailed natural
vegetation communities [21], which is another challenge to the remotely sensed image using community.
The purpose of this paper is to quantify the land use/cover changes that have happened over the past
50 years on the Koga catchment, to identify the drivers of the land use/cover changes and assess
implications of the changes by the environment.
2. Materials and Methods
2.1. The Study Area
2.1.1. Location, Climate and Topography
The selected study area is the Koga catchment in northwestern Ethiopia, which is a typical catchment
for the Ethiopian Highlands. The Koga catchment is situated in the North Western Ethiopian Highlands
between latitudes of 11°9.7' and 11°30'N and Longitudes of 37°02' and 37°18'E. The catchment area is
260 km2; 72% of which is used for subsistence agriculture. The Koga River originates in the Wezem
mountain area and is a tributary of the Gilgel Abbay, which flows northwest in to Lake Tana, and lies in
the upper part of the Blue Nile (Abbay) watershed.
The climate of Koga catchment falls within the Woina Dega (cool semi-humid, 1,500 to 2,400 masl)
and Dega zones (cool, above 2,400 masl). The majority of the catchment area lies within the Woina
Dega zone and is characterized by distinct dry and wet seasons. The dry seasons occur between
November and April and the Wet season between May and October; small rains occur sporadically
during April and May. The mean daily temperature is 18.25 °C. The monthly mean maximum
temperature varies from 30.0 °C in March to 23.7 °C in August. The monthly mean minimum
temperature varies from 5.4 °C in December to 13.1 °C in May and June.
Figure 1 shows the air temperature and precipitation of the Bahirdar station located 35 km northeast
of the catchment. Apparent is high July and low January precipitation. It also appears that air
temperature has increased through years.

ISPRS Int. J. Geo-Inf. 2013, 2 305
Figure 1. Mean maximum temperature (in °C) and rainfall (in mm/month) for .the years
1961–2009 at .Bahirdar Station.
The land elevation of the Koga catchment varies from 1,875 masl at the mouth of the Koga River to
3,215 masl at its highest point on the watershed divide. The Koga River rises in the hills north of the
Wezem Mountains and flows a distance of some 49 km to where it joins the Gilgel Abbay, which
eventually flows in to Lake Tana. The total catchment area from source to mouth is 260 km2 and the
course of the main river is northerly up to the village of Rim then westerly to Wetet Abbay. The
catchment is generally elongated with a pronounced narrowing above Rim where the mean width of the
basin is only 3.8 km.
2.1.2. Geology and Soils
The regional geology of the Koga catchment comprises extensive flow type, volcanic (extrusive)
rocks of the Ashangi Group; these were deposited during the palaeocene-Oligocene-Miocene (Teritiary)
stages of geological time. The Ashangi group comprises the older volcanic rocks, which were formed by
lava and debris, ejected from fissural volcanic eruptions. It covers over 50 percent of the Koga river sub
basin and consists predominantly of alkaline basalts with interbedded pyroclastic and rare rhyolite. The
Koga catchment can be divided in to two major units based on slope gradient: the upper catchment and
the lower catchment. The upper catchment is a soil complex and consists of a number of different soil
ISPRS Int. J. Geo-Inf. 2013, 2 306
sub groups. The main soil types within the upper catchment are Luvic Phaeozems (Typic Argiustolls),
Chromic Cambisols (Fluventic and Typic Ustropepts) and Lithic Leptosols (Lithic Ustortents) on
shallow steep slopes. The lower catchment consists of three major soil groups; the reddish brown and
yellowish brown Haplic Alisols (Typic Paleustults) in the well-drained and moderately well drained
upland areas, Eutric Vertisols (Ustic Epiaquarts) in the convex poorly drained plains and Eutric Gleysols
(Typic Tropaquepts) in the poorly and very poorly drained concave flat flood plains of the Koga tributaries.
2.1.3. Population
The total population of the Mecha woreda, within which the Koga catchment is located, is 292,000
of which 269,404 live in the rural part while 22,677 live in the urban part [22]. The population density
in the lower catchment is extremely higher than the population density in the upper catchment.
Subsistence rain fed production of cereals comprising teff, maize, barley and millet, as well as pulses,
oilseeds and some legumes is dominant in the area while irrigated agriculture takes up a small
percentage of the cultivated area of the Koga catchment. Income from livestock also contributes to the
livelihood of the small scale poor farmers in the area.
2.2. Land Use Policy and Interview of Locals
In Ethiopia, land is a public property and has been administered by the government since 1975. Before
1775 was the imperial era in which land was controlled by the King and the ruling elites [23]. The emperor
of that time and his family, together with the barons and lords in both houses of parliament were owners of
vast tracts of land in the country [23]. Since 1975, all rural and urban land became under public ownership
and the possession of rural land plots has been conditional upon residence in a village [24].
Historical long time ground truth data is difficult to collect unless there is documented data or through
people that knew the area during the considered time period. Aerial photographs do sometimes serve as
an alternative way of collecting ground truth data whenever there is no other way of getting it. Getting
aerial photographs for all the years required is not possible. In addition, aerial photo interpretation itself
need to be supported by ground truth data from some other sources due to the difficulty in distinguishing
some of the land use/cover classes using normal aerial photo interpretation techniques. For this reason it
was important to discuss with selected local people in the study area. The key informants were selected
community elders that did and still reside in the catchment and who are older than 75 years. The
catchment lies within 18 kebeles (sub-division of district) of the Mecha Woreda (district) as shown on
Figure 2 and Figure 3 shows some parts of the catchment. Discussions were made in person with one key
informant from each Kebele about how the land use/covers in their vicinity evolved through time and
about their observations of the causes of the changes. The elders were mostly priests, and some of them
were farmers who have an in depth knowledge of the area while having lived there for a long time.
Finding the right elders for discussion from each kebele was a tough task due to some reasons. In the first
place there were not many elders in each kebele and secondly, a few of the existing elders were illiterate,
which made topographic map or aerial photo based discussions difficult in addition to their
unwillingness to walk a little distance away from their place to explain the land use/cover changes within
their kebeles. Some others were not fit to make dependable discussion due to the inconsistent
information they provided, which was believed to be associated with aging. Regardless of all these

ISPRS Int. J. Geo-Inf. 2013, 2 307
difficulties, sufficient data was collected through key informants, who were willing to walk for a
considerable distance within their kebeles in order to explain the land use/cover changes. As far as it
enabled collection of enough data, selection of location for ground truth data was mainly based on the
respondents’ choice due to accessibility and distance from their place.
Figure 2. Location Map of the Koga Catchment
Figure 3. Sediment laden runoff from ploughed fields in the Koga watershed during a
rainfall event (a), remaining natural woody vegetation along the Koga river (b), small crop
farm plots and homestead eucalyptus trees (c), pasture land and eucalyptus tree plantations (d).

ISPRS Int. J. Geo-Inf. 2013, 2 308
2.3. Remote Sensing Data Analysis
Aerial photographs of the scale 1:50,000 were acquired for the months of December 1957 and
January 1982 from the Ethiopian Mapping Agency. Landsat ETM image for the month December 1999,
Landsat TM for the months of December and September 1999, and Landsat MSS for the month of
December 1979 were downloaded from NASA’s GLOVIS website. The ASTER visible and near
infrared level 1A product data was obtained from NASA’S Land Processes Distributed Active Archive
Center (LP DAAC) website. Selection of the years for land use/cover classification was based on
availability of data and the relatively good gap between the years for assessing the land use/change
dynamics. Landsat Multispectral Scanner (MSS) images consist of four spectral bands with 80 m spatial
resolution. The approximate scene size is 170 km by 185 km. Landsat Thematic Mapper (TM) images
consist of seven spectral bands with a spatial resolution of 30 m for Bands 1 to 5 and 7. The spatial
resolution for Band 6 (thermal infrared) is 120 m, but is resampled to 30-m pixels. The approximate
scene size is 170 km by 183 km. Landsat Enhanced Thematic Mapper (ETM) images consist of eight
spectral bands with a spatial resolution of 30 m for Bands 1 to 7. The resolution for Band 8
(panchromatic) is 15 m. All the bands can collect one of two gain settings (high or low) for increased
radiometric sensitivity and dynamic range, while Band 6 collects both high and low gain for all scenes.
The approximate scene size is 170 km by 183 km. ASTER covers a wide spectral region with 14 bands
from the visible to the thermal infrared with high spatial, spectral and radiometric resolution. The spatial
resolution varies from 15 m in the visible and near-infrared (VNIR), 30 m in the short wave infrared
(SWIR), and 90 m in the thermal infrared (TIR) [25]. The scene size of ASTER images is 60 km by 60 km.
For the year 1957, stereo photo interpretation was done to generate the land use/cover classes.
Texture, pattern, tone of the aerial photos and data from key informants were used for stereo photo
interpretation. The stereo photo interpretation was made as detailed as possible. Individual patches of
woody vegetation as small as about 100 m2 were separately traced during the stereo interpretation of the
aerial photographs. The aerial photos were then scanned with a high resolution scanner and
ortho-rectified using ASTER derived DEM that has a resolution of 15 m. Though there is some data
production time gap between the aerial photos and the ASTER DEM, ASTER DEM was used for
ortho-rectification of the aerial photos due to its relatively better resolution over the data generated
topographic maps. In addition, there still is a time gap between the production of the aerial photos and
the local topographic map that made preference of using the ASTER DEM to the local topographic map.
The nearest neighborhood was used for resampling. This whole process was done using ENVI 4.7. The
stereo-interpreted data on transparent paper was then scanned and geo-referenced, and vector data was
generated through onscreen digitizing. This vector data was overlaid on the rectified aerial photos and
edited according to the 15 m photo resolution. The land use/cover description in Table 1 was used for
interpreting the aerial photos. This same land use/cover description was also used in classification of the
satellite images for the other years.

ISPRS Int. J. Geo-Inf. 2013, 2 309
Table 1. Definition of the land use/cover classes in the Koga catchment.
Land Use/Cover Class Description
Woody vegetation trees and shrubs with 20% or more crown cover that are taller than 2 m.
Crop field land used for production of food
Bare land areas characterized by bare rock, gravel, sand, silt, clay or other
earthen material, with little or no green vegetation present
Pasture areas used for cattle grazing including partially wet lands.
Settlement Residential areas
The Landsat MSS data for the year December 1979 has a spatial resolution of 60 m. Regardless of the
relatively lower spatial resolution of the 1979 Landsat MSS data as seen from Figure 4, an image with a
better spatial and spectral resolution was produced by pansharpening the Landsat MSS image using
large scale aerial photographs of January 1982. Pansharpening is an image fusion method in which high
resolution panchromatic data is fused with lower resolution multispectral data to create a colorized
high-resolution dataset. It is a pixel-level fusion technique that increases the spatial resolution while
simultaneously preserving the spectral information in the multispectral image, giving the best of both
worlds: high spectral resolution and high spatial resolution [26]. This enables to produce images with
improved interpretability. Though there is a one year difference in the time the MSS image and aerial
photographs were taken, both data sets were used for generating the land use/cover map of 1979. This is
due to the fact that there cannot be sudden significant changes in the land use/land cover classes within
one year as long as there is no change in the policy of the government at that time, as confirmed by key
informants and from personal observation of historical happening of such facts in the country. Principal
Component Spectral Sharpening technique was used to sharpen the false color composite of December
1979 Landsat MSS multispectral data with a mosaic of high spatial resolution scanned aerial
photographs of January 1982 that were ortho-rectified and resampled with a spatial resolution of 15 m.
Principal Component Spectral Sharpening assumes that the low spatial resolution spectral bands
correspond to the high resolution panchromatic band [27] and relies on the Principal Component
Analysis (PCA) mathematical transformation [26]. Ortho-rectification of the January 1982 aerial photos
was done in the same way as that of the 1957 aerial photographs. The output image had a relatively better
spectral and spatial resolution (see Figure 4). The ground truth data for some points of the study area at
that particular time was obtained from the key community elders accompanied by data from the aerial
photograph for supervised image classification. Supervised classification is the process of using samples of
known identity from training samples (spatially explicit field work data) or secondary data (maps, literature,
or knowledgeable informants) to classify areas of unknown identity [28]. The most commonly applied
supervised classification method is the maximum likelihood procedure because of its robustness [21]. In a
maximum likelihood supervised classification procedure, each pixel is evaluated for its statistical
probability of belonging in each category of the land use/cover classes and assigned to class with
maximum probability. Maximum likelihood classifiers, which are a widely used form of supervised
classification, assume the training data statistics for each class in each band are normally distributed and
calculates the probability that a given pixel belongs to a specific class. Maximum likelihood classifier
was used in ENVI 4.7 for supervised classification of the pansharpened 1979 image and the
classification had an overall accuracy of 96.17% with a kappa coefficient of 0.94. The kappa coefficient

ISPRS Int. J. Geo-Inf. 2013, 2 310
represents the level of agreement between the training samples and land use/cover values in the
classified image. The maximum value for kappa occurs when the observed level of agreement is 1. A
kappa coefficient of 0.60–0.80 represents good level of agreement while a kappa coefficient of greater
than 0.80 represents very good level of agreement. When the same ground truth data were used to do the
classification on 60 m spatial resolution false color composite of the 1979 Landsat MSS image, the
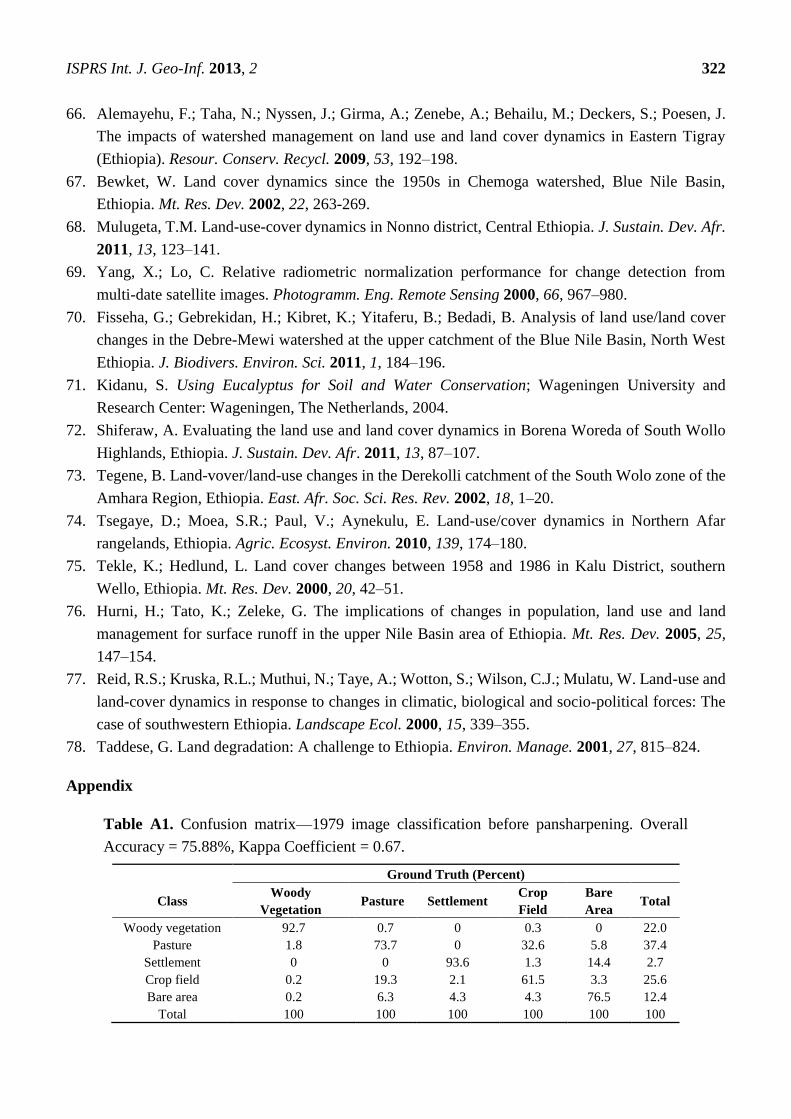
classification has an overall accuracy of 77.78% with a kappa coefficient of 0.67 (Appendix Table A1).
Pansharpening has improved the overall accuracy of the classification from 77.78% to 96.17%
(Appendix Table A2). In satellite based classifications using Landsat imagery, most authors have
claimed accuracy of between 60 to 90 percent [29].
A false color composite of the December 1986 LandSat TM has the spatial resolution of 30 m. No
pansharpening was done to this image, as there was no aerial photo of that area that time. Maximum
likelihood classifier was used for supervised image classification using ground truth data achieved
through the same techniques as that of the 1979 imagery. The classification has an overall accuracy of
87.97% with a kappa coefficient of 0.82.
Figure 4. 1979 Landsat MSS false color composite of small part of the area around the
.outlet of the Koga catchment before and after pansharpening.
ISPRS Int. J. Geo-Inf. 2013, 2 311
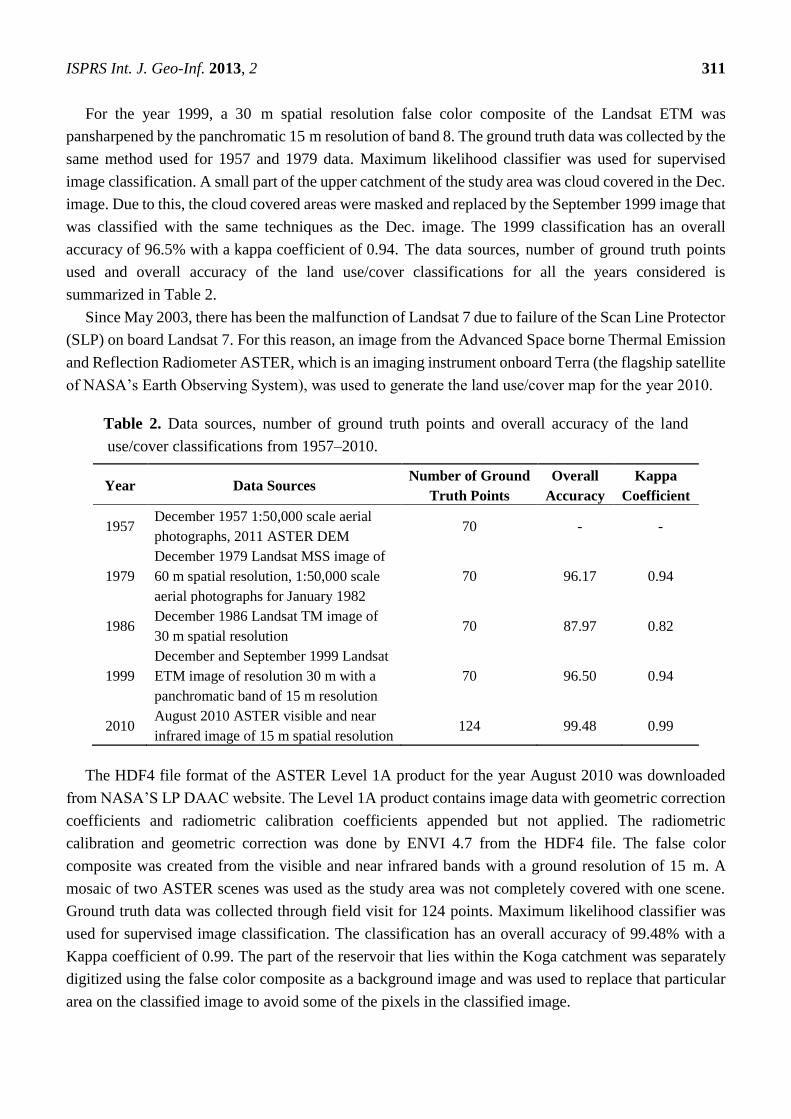
For the year 1999, a 30 m spatial resolution false color composite of the Landsat ETM was
pansharpened by the panchromatic 15 m resolution of band 8. The ground truth data was collected by the
same method used for 1957 and 1979 data. Maximum likelihood classifier was used for supervised
image classification. A small part of the upper catchment of the study area was cloud covered in the Dec.
image. Due to this, the cloud covered areas were masked and replaced by the September 1999 image that
was classified with the same techniques as the Dec. image. The 1999 classification has an overall
accuracy of 96.5% with a kappa coefficient of 0.94. The data sources, number of ground truth points
used and overall accuracy of the land use/cover classifications for all the years considered is
summarized in Table 2.
Since May 2003, there has been the malfunction of Landsat 7 due to failure of the Scan Line Protector
(SLP) on board Landsat 7. For this reason, an image from the Advanced Space borne Thermal Emission
and Reflection Radiometer ASTER, which is an imaging instrument onboard Terra (the flagship satellite
of NASA’s Earth Observing System), was used to generate the land use/cover map for the year 2010.
Table 2. Data sources, number of ground truth points and overall accuracy of the land
.use/cover classifications from 1957–2010.
Year Data Sources Number of Ground
Truth Points
Overall
Accuracy
Kappa
Coefficient
1957 December 1957 1:50,000 scale aerial
photographs, 2011 ASTER DEM 70 - -
1979
December 1979 Landsat MSS image of
60 m spatial resolution, 1:50,000 scale
aerial photographs for January 1982
70 96.17 0.94
1986 December 1986 Landsat TM image of
30 m spatial resolution 70 87.97 0.82
1999
December and September 1999 Landsat
ETM image of resolution 30 m with a
panchromatic band of 15 m resolution
70 96.50 0.94
2010 August 2010 ASTER visible and near
infrared image of 15 m spatial resolution 124 99.48 0.99
The HDF4 file format of the ASTER Level 1A product for the year August 2010 was downloaded
from NASA’S LP DAAC website. The Level 1A product contains image data with geometric correction
coefficients and radiometric calibration coefficients appended but not applied. The radiometric
calibration and geometric correction was done by ENVI 4.7 from the HDF4 file. The false color
composite was created from the visible and near infrared bands with a ground resolution of 15 m. A
mosaic of two ASTER scenes was used as the study area was not completely covered with one scene.
Ground truth data was collected through field visit for 124 points. Maximum likelihood classifier was
used for supervised image classification. The classification has an overall accuracy of 99.48% with a
Kappa coefficient of 0.99. The part of the reservoir that lies within the Koga catchment was separately
digitized using the false color composite as a background image and was used to replace that particular
area on the classified image to avoid some of the pixels in the classified image.
ISPRS Int. J. Geo-Inf. 2013, 2 312
Finally, the classified images for all the years considered were clipped using the Koga watershed
boundary for land use/land cover change analysis.
3. Results
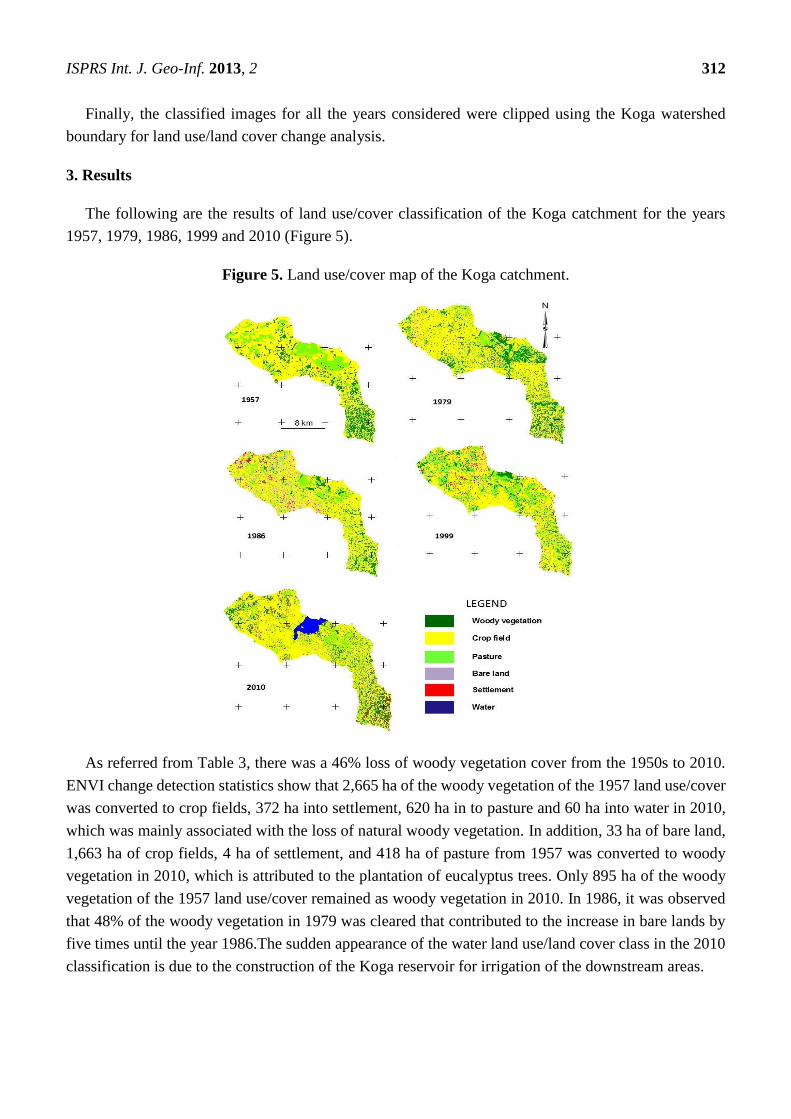
The following are the results of land use/cover classification of the Koga catchment for the years
1957, 1979, 1986, 1999 and 2010 (Figure 5).
Figure 5. Land use/cover map of the Koga catchment.
As referred from Table 3, there was a 46% loss of woody vegetation cover from the 1950s to 2010.
ENVI change detection statistics show that 2,665 ha of the woody vegetation of the 1957 land use/cover
was converted to crop fields, 372 ha into settlement, 620 ha in to pasture and 60 ha into water in 2010,
which was mainly associated with the loss of natural woody vegetation. In addition, 33 ha of bare land,
1,663 ha of crop fields, 4 ha of settlement, and 418 ha of pasture from 1957 was converted to woody
vegetation in 2010, which is attributed to the plantation of eucalyptus trees. Only 895 ha of the woody
vegetation of the 1957 land use/cover remained as woody vegetation in 2010. In 1986, it was observed
that 48% of the woody vegetation in 1979 was cleared that contributed to the increase in bare lands by
five times until the year 1986.The sudden appearance of the water land use/land cover class in the 2010
classification is due to the construction of the Koga reservoir for irrigation of the downstream areas.

ISPRS Int. J. Geo-Inf. 2013, 2 313
Table 3. Koga catchment land use/cover classes from 1957–2010 in hectares.
1957 (ha) 1979 (ha) 1986 (ha) 1999 (ha) 2010 (ha)
Change from
1957 to 2010
(ha)
Woody vegetation 5,576 4,587 2,388 2,738 3,012 ↓2,563
Pasture 4,221 2,817 3,869 6,232 4,728 ↑507
Crop field 16,080 17,521 16,122 15,022 15,683 ↓398
Bare land 139 571.7 2,865 1,088 0 ↓139
Settlement 36 566 832 984 1,535 ↑1,499
Water 0 0 0 0 1,108 ↑1,108
Agricultural land
(pasture + Crop field) 20,302 20,338 19,991 21,253 20,411 ↑109
Since all rural and urban land was under public ownership beginning from 1975, with the possession
of rural land plots conditional upon residence in a village, the lack of belongingness of the woody
vegetation resources by the individual communities in the transitional time was therefore the reason for
much of the deforestation as confirmed by the key informants. Most of the destruction of the natural
woody vegetation occurred between the 1970s and 1980s. From 1986, there is a gradual increase in
woody vegetation until the year 2010. During field work in the catchment in 2011 and 2012, it was observed
that farmers are increasingly planting trees, partly converting their crop fields into eucalyptus vegetation.
From the year 1986 to 1999, and from 1999 to 2010, 1,321 and 1,076 ha of crop fields were respectively
converted in to woody vegetation (Figure 6) where as the amount of woody vegetation that was converted to
crop fields was only 809 and 747 ha from 1986 to 1999 and from 1999 to 2010 respectively.
Figure 6. Map of crop fields converted to woody vegetation from 1986 to 1999 (a), from
1999 to 2010 (b), from 1986 to 2010 (c).
The loss of fertility of the crop land from time to time is making the land unproductive unless plenty
of fertilizers are used which sometimes is impossible for the low income farmers due to the unaffordable
price of the fertilizers. Farmers in the area have started to consider planting trees especially eucalyptus
trees that can be safely harvested at a relatively shorter time than other native woody vegetation types as
a good source of income. The farmers believe that this would significantly reduce the labor they incur in
farming their crop fields and avoid the cost of fertilizers they would have used for their crops. It is clearly
observed and has also been noted by the informants of the area that most of the indigenous vegetation is

ISPRS Int. J. Geo-Inf. 2013, 2 314
being dominated by eucalyptus trees since the last 20 years as these species matures in a relatively short
period of time, and because it can be sold before maturity as building material. The rational for the
increasing interest in planting may include the high market demand and price of tree products and the
need to earn more income with less labor. In general, there is an increasing trend in woody vegetation in
the catchment since the 1980s. Most of the remaining natural woody vegetation is located around
churches and along the Koga River.
When the overall area coverage is considered, there is no significant change observed in the number
of crop fields in the study catchment but there is a big change in the land holding per household due to
increase in population. In 1984, the total population of the Mecha Woreda (district) within which the
Koga catchment is located was 156,986 with 151,625 (97%) as the farming population. The number of
farming families totaled 33,694 with an average family size of 4.5 persons at that time. According to
the 1994 national census data, the total population for this woreda was 244,943 in 49,098 households,
out of which 232,696 (95%) were rural dwellers. As of the 2007 census data, the total population of
the Mecha woreda is 292,000 out of which 269,404 live in the rural part while 22,677 live in the urban
part [22]. The population of the woreda in which the catchment resides has increased by 1.5 times from
1984 to 1994 and 1.2 times from 1994 to 2007. The population has increased almost by double since the
1980s. This population has to share the same amount of crop field since the 1960s. Average land holding
per household for crop land in 1993 was 2.44 ha [30,31] where as in 2001, the crop land holding per
household decreased to 1.64 ha [32]. Increasing population in the rural areas was thus absorbed in
agriculture through leveling down of holdings, rather than through alternative forms of employment [24].
In 1996, land was given to landless youth and returnee ex-soldiers in Amhara Region by reducing the
holding of farmers who were reportedly associated with previous governments [24] where as in other
regions communal grazing lands and wood land was allocated to new claimants. Most parts of
the catchment have been continuously used for agricultural production for more than 50 years without
significant conservation measures. Farmers are complaining about the fact that the once fertile land
has been very much degraded and the productivity of the land is decreasing. Soil studies have
showed nutrient deficiencies [33]. Farming is practically impossible without use of fertilizers.
The livestock density in Mecha woreda is very high as compared to the national average [33]. Koga
catchment supports the largest cattle population density in the region [34]. Cattle play an increasingly
important role in household budgets and coping strategies during times of drought in the study area [31].
As per the 1993 Birr and Koga household survey data, the average livestock holding per household
(excluding poultry) in the Koga catchment was 7.17 [33]. From 1999–2001, the average livestock
holding (excluding poultry) per household in the woreda was 5.36 Tropical livestock Unit (TLU) [32],
which is equivalent to 9.3/household. This shows a 30% increase from 1993 to 2001. Mature cattle,
donkeys, horses and mules can be considered 1 TLU each while small ruminants like sheep and goats
can be taken as 0.2 TLU [35]. There has been an increasing trend in livestock in the area with the
increasing population. In 2007, the income of the Mecha woreda people generated from livestock was
almost half of the income generated from crops [36]. Agriculture is done with draught animals like oxen.
Transportation of crops to markets is done with donkeys, horses and mules. These facts reflect that
pasture is as equally important to the community as that of crop land. This is the likely reason why there
was no significant change in the amount of pasture since the 1950s. In addition to the communal pasture
ISPRS Int. J. Geo-Inf. 2013, 2 315
lands, farmers use part of their crop fields to grow fodder for their livestock for the dry season and this
same land is used to grow crops the next year.
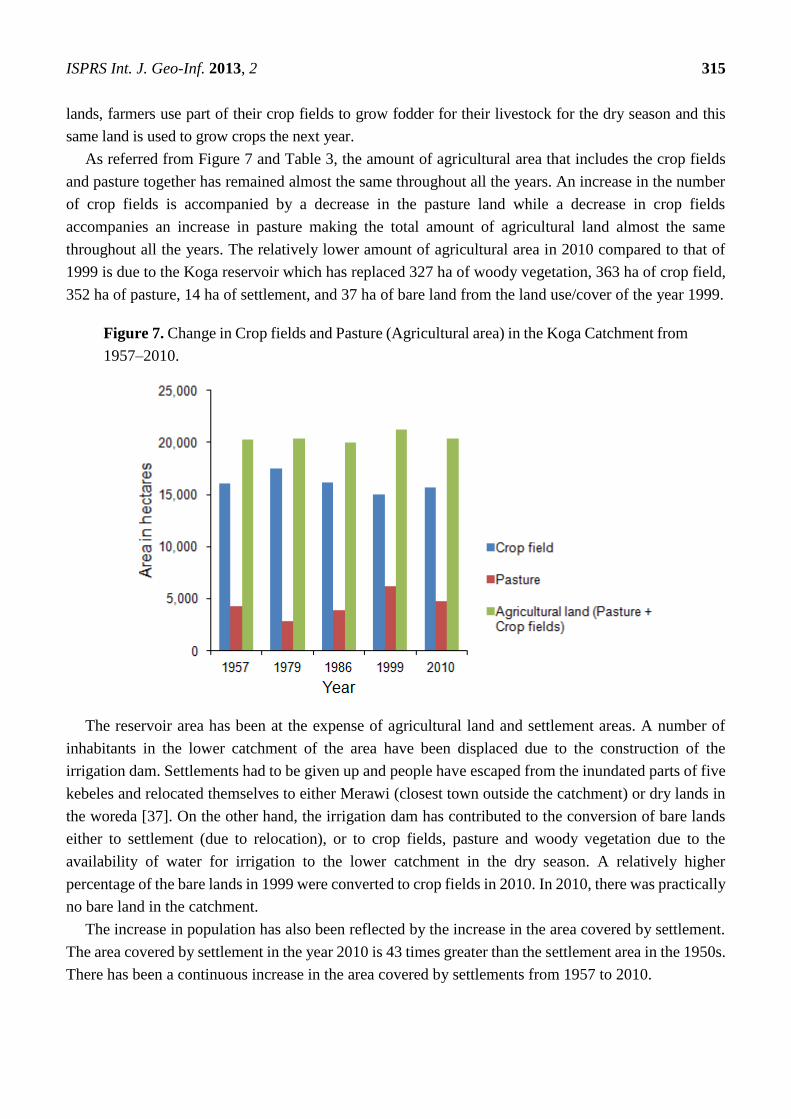
As referred from Figure 7 and Table 3, the amount of agricultural area that includes the crop fields
and pasture together has remained almost the same throughout all the years. An increase in the number
of crop fields is accompanied by a decrease in the pasture land while a decrease in crop fields
accompanies an increase in pasture making the total amount of agricultural land almost the same
throughout all the years. The relatively lower amount of agricultural area in 2010 compared to that of
1999 is due to the Koga reservoir which has replaced 327 ha of woody vegetation, 363 ha of crop field,
352 ha of pasture, 14 ha of settlement, and 37 ha of bare land from the land use/cover of the year 1999.
Figure 7. Change in Crop fields and Pasture (Agricultural area) in the Koga Catchment from
1957–2010.
The reservoir area has been at the expense of agricultural land and settlement areas. A number of
inhabitants in the lower catchment of the area have been displaced due to the construction of the
irrigation dam. Settlements had to be given up and people have escaped from the inundated parts of five
kebeles and relocated themselves to either Merawi (closest town outside the catchment) or dry lands in
the woreda [37]. On the other hand, the irrigation dam has contributed to the conversion of bare lands
either to settlement (due to relocation), or to crop fields, pasture and woody vegetation due to the
availability of water for irrigation to the lower catchment in the dry season. A relatively higher
percentage of the bare lands in 1999 were converted to crop fields in 2010. In 2010, there was practically
no bare land in the catchment.
The increase in population has also been reflected by the increase in the area covered by settlement.
The area covered by settlement in the year 2010 is 43 times greater than the settlement area in the 1950s.
There has been a continuous increase in the area covered by settlements from 1957 to 2010.
ISPRS Int. J. Geo-Inf. 2013, 2 316
4. Discussion
While a few land use/cover change studies used remotely sensed data from sources with a relatively
similar scale [38,39], differences in the scales of the input data were not taken into consideration by
many authors that have used satellite images, mainly Landsat images for land use/land cover studies in
different parts of the world like in Tanzania [40,41], in Uganda [42,43]; in Ghana [44], in Nepal [45,46], in
Kenya [47–49] in Nigeria [50–53], in Zimbabwe [54], in India [55–57], in Turkey [58–60], in Iran [61,62],
and in Bangladesh [63–65]. Similarly, differences in the scales of the remotely sensed input data were
not considered in most of the land use/cover studies that have been done in Ethiopia [12,66–68]. Though
all these studies have contributed a lot to land use/cover change studies, no reconciliation of the
differences in scales were made when using different data sources. The image fusion techniques, more
specifically pansharpening that was used in this particular study has enabled to bring the different data
sources in to relatively similar scale to produce reliable land use/cover maps for comparison of the changes.
The 1979 image was acquired by one of the early generation of Landsat (Landsat 2). The 1986 scenes
were acquired by the more advanced second generation of Landsat (Landsat 5) while the 1999 images
were acquired from Landsat 7 Enhanced Thematic Mapper (ETM). On the other hand, the 2010 images
are from the ASTER sensor. Regardless of the reconciliations for the differences in the scales of the
input data, differences in the numbers and spectral ranges of the spectral bands and radiometric
differences among images still affect the land use/cover change analysis. Radiometric differences
among images are caused by inconsistencies of acquisition conditions such as seasonal changes, sensor
variations, atmospheric properties, and sensor target- illumination geometry [69].
Different land use/land cover studies for some parts of Ethiopia indicate that croplands have
expanded at the expense of natural vegetation, including forests and shrublands [12,66,68,70–74] while
Tekle and Hedlund [75] reported increases in the size of open areas and settlements at the expense of
shrublands and forests. Unlike many of the findings in land use/cover studies in Ethiopia, there have
been almost no observed changes in the overall amount of area used for agriculture for about the last fifty
years with increasing human and livestock population in the Koga catchment resulting in soil
degradation due to over exploitation and erosion from the ploughed fields. Changes were observed only
in the amount of cultivated land holding per household, which has been decreasing over time. There has
been a significant change in the woody vegetation of the Koga catchment since the 1950s although there
also has been an increasing trend in the woody vegetation after the 1980s. At the same time, the natural
vegetation has increasingly been dominated by eucalyptus trees. This finding coincides with that of
Bewket [67] that indicated a decrease in woodlands and shrubland between 1957 and 1982 and in
increase after 1982 in a watershed in the upper Blue Nile basin.
Awulachew et al. [15] related deforestation, overgrazing, land degradation and declining agricultural
productivity in the upstream part of the Blue Nile basin to high population pressure, lack of alternative
livelihood opportunities and the slow pace of rural development. Shiferaw [72] stated the reasons for
changes in land use/cover were natural factors such as drought and climate change as well as human
driving factors such as population growth, over intensification of farm sizes [76], and land tenure
policies [77,78]. Zeleke et al. [12] indicated an age-old tradition of clearing increasingly steeper land for
cultivation and lack of appropriate land use policies, as reasons land use changes threatening soil
degradation in North western Ethiopian highlands. In the Koga catchment, the growing human and

ISPRS Int. J. Geo-Inf. 2013, 2 317
livestock population is exerting much pressure on the environment resulting in degradation of the land
that in turn is reflected by the increasing tendency of the farmers to shift to plantation of eucalyptus trees
on their crop farms, and deforestation and degradation of the natural woody vegetation cover as
confirmed by the key informants. Overuse of the agricultural land without appropriate conservation
measures is facilitating erosion, which is reflected in the sediment laden runoff (Figure 3(a)) from the
ploughed agricultural fields in the catchment. The Koga irrigation dam has also contributed to the
change in land use/cover by replacing 1,042 ha of woody vegetation and agricultural land into water.
5. Conclusions
The land use/cover classification techniques used in this study has enabled to reconcile the
differences in the scales of the different data sources for land use/cover change detection instead of the
traditionally used land use/cover classifications and comparisons that do not take into consideration the
differences in the scales of input images. However, it should be noted that the input data sets are different
not only in spatial scales but also in other observation parameters such as the numbers and spectral
ranges of the spectral bands and radiometric performances that still would affect the land use/land cover
change analysis.
Analysis of the land use/cover shows that changes have occurred in the form of deforestation of the
natural woody vegetation cover in the study area. There has been a significant change in the natural
woody vegetation of the Koga catchment since the 1950s although there also has been an increasing
trend of eucalyptus tree plantations after the 1980s. The deforestation of the indigenous woody
vegetation and the relatively increasing trend in eucalyptus plantations may have a negative impact on
the water balance of the catchment due to the high consumption of water by eucalyptus trees. While there
almost is no change in the amount of area used for agriculture, the long term continuous use the
agricultural area by the increasing human and livestock population has resulted in degradation of the land
that is increasingly forcing the farmers to convert their farm plots to eucalyptus plantations. There has been
a continuous increase in land used for settlement in the catchment with the increasing population.
The observed changes are associated with increasing human and livestock population and partly with
changes in policy. The relationship between the local climate change and the land use/cover changes
could be an important future research issue.
Acknowledgments
I would like to thank the Faculty for the Future Programme of the Schlumberger Foundation for
granting me scholarship to do my studies in the Vienna University of Technology. My thanks also
extend to the Vienna Doctoral Programme on Water Resources Systems (DK-plus W1219-N22) for the
support during my fieldwork in Ethiopia through the Austrian Science Funds (FWF) and for hosting me
in the programme. I would also like to acknowledge NASA’s LP DAAC for providing me the ASTER
Level 1A product.
ISPRS Int. J. Geo-Inf. 2013, 2 318
References
1. Olson, J.; Salome, M.; David, J.C.; Mbonile, M.; Mugisha, S. A Research Framework to Identifying
the Root Causes of Land Use Change Leading to Land Degradation and Changing Biodiversity.
LUCID Project Working Paper 48. Available online: http://www.lucideastafrica.org/publications/
Olson_LUCID_WP48.pdf (accessed on 22 August 2012).
2. Lambin, E.F.; Turner, B.L.; Geisa, H.J.; Agbola, S.B.; Angelsend, A.; Bruce, J.W.; Coomes, O.T.;
Dirzo, R.; Fischer, G.; Folke, C.; et al. The causes of land-use and land-cover change: Moving
beyond the myths. Glob. Environ. Chang. 2001, 11, 261–269.
3. The Scientific and Technical Advisors Panel (STAP) of the Global Environmental Facility (GEF).
Report of the STAP Expert Group Workshop on Land Degradation Inter Linkages. Available
online: http://www.thegef.org/gef/sites/thegef.org/files/documents/gef_c14-inf15.pdf (accessed on
22 August 2012).
4. Loveland, T.; Gutman, G.; Buford, M.; Chatterjee, K.; Justice, C.; Rogers, C.; Stokes, B.; Thomas, J.
Land-Use/Land Cover Change. In Strategic Plan for Climate Change Science Program; US
Climate Change Science Program: Washington, DC, USA, 2003; Chapter 6, pp. 118–134.
5. Rindfuss, R.R.; Walsh, S.J.; Turner, B.L., II; Fox, J.; Mishra, V. Developing a science of land
change: Challenges and methodological issues. Proc. Natl. Acad. Sci. USA 2004, 101,
13976–13981.
6. Turner, B.L., II; Lambin, E.F.; Reenberg, A. The emergence of land change science for global
environmental change and sustainability. Proc. Nat. Acad. Sci. USA 2007, 104, 20666–20671.
7. Anderson, J.R.; Hardy, E.E.; Roach, J.T.; Richard, E.W. Land Use Land Cover Classification for
Use with Remote Sensing Data. Available online: http://pubs.er.usgs.gov/publication/pp964
(accessed on 20 October 2012)
8. Dawn, C.P.; Thomas, B.; Steven, M.M.; William, J.M. Agent-Based Models of Land-Use and
Land-Cover Change. In Proceedings of an International Workshop, Irvine, CA, USA, 4–7
October 2001.
9. Ademiluyi, I.A.; Okude, A.S.; Adanni, C.O. An appraisal of landuse and landcover mapping in
Nigeria. Afr. J. Agr. Res. 2008, 3, 581–596
10. Pellikka, P.B.; Clark, P.; Hurskainen, A.; Keskinen, M.; Lanne, K.; Masalin, P.; Ghezelbash, N.;
Sirviö, T. Land Use Change Monitoring Applying Geographic Information Systems in the Taita
Hills, SE-Kenya. In Proceedings of the 5th African Association of Remote Sensing of Environment
Conference, Nairobi, Kenya, 17–22 October 2004.
11. Garedew, E.; Sandewall, M.; Soderberg, U.; Campbell, B.M. Land-use and land-cover dynamics in
the central rift valley of Ethiopia. Environ. Manage. 2009, 44, 683–694.
12. Zeleke, G.; Hurni, H. Implications of land use and land cover dynamics for mountain resource
degradation in the northwestern Ethiopian highlands. Mt. Res. Dev. 2001, 21, 184–191.
13. Bishaw, B. Deforestation and land degradation in the Ethiopian Highlands: A strategy for physical
recovery. Northeast Afr. Stud. 2001, 8, 7–25.
14. Jayne, T.S.; Yamano, T.; Weber, M.T.; Tschirley, D.; Benfica, R.; Chapoto, A.; Zulu, B.
Smallholder income and land distribution in Africa: Implications for poverty reduction strategies.
Food Policy 2003, 28, 253–275.

ISPRS Int. J. Geo-Inf. 2013, 2 319
15. Awulachew, S.B.; McCartney, M.; Steenhuis, T.S; Ahmed, A.A. A Review of Hydrology, Sediment
and Water Resource Use in the Blue Nile Basin; IWMI Working Paper 131; International Water
Management Institute: Colombo, Sri Lanka, 2008.
16. Hansen, M.; DeFries, R. Detecting long term global forest change using continuous fields of tree
cover maps from 8 km Advanced Very High Resolution Radiometer (AVHRR) data for the years
1982–1999. Ecosystems 2004, 7, 695–716.
17. DeFries, R.; Eshleman, K.N. Land-use change and hydrologic processes: A major focus for the
future. Hydrol. Process. 2004, 18, 2183–2186.
18. Lambin, E.F.; Geist, H.J.; Lepers, E. Dynamics of land-use and land cover change in tropical
regions. Annu. Rev. Environ. Resour. 2003, 28, 205–241.
19. Carmel, Y.; Kadmon, R. Computerized classification of Mediterranean vegetation using
panchromatic aerial photographs. J. Veg. Sci. 1998, 9, 445–454.
20. Zhang, Z.; Peterson, J.; Zhu, X.; Wright, W. Long Term Land Use and Land Cover Change and its
Impact on Cool Temperate Rainforest in the Strzelecki Ranges, Australia. In Proceedings of XXI
Congress of the International Society of Photogrammetry and Remote Sensing (ISPRS 2008),
Beijing, China, 3–11 July 2008.
21. Serra, P.; Pons, X.; Saurí, D. Post-classification change detection with data from different sensors:
Some accuracy considerations. Int. J. Remote Sens. 2003, 24, 3311–3340.
22. Central Statistical Agency (CSA). Population Census Data, 2007; Data Processing Department of
CSA: Addis Ababa, Ethiopia, 2007.
23. Ambaye, D. Land Rights in Ethiopia: Ownership, Equity, and Liberty in Land Use Rights, FIG
Working Week, 2012. Available online: http://www.fig.net/pub/fig2012/papers/ts02d/
TS02D_ambaye_5521.pdf (accessed on 20 October 2012).
24. Gebreselassie, S. Land, Land Policy and Smallholder Agriculture in Ethiopia: Options
and Scenarios. Available online: http://www.future-agricultures.org/pdf%20files/SG_paper_3.pdf
(accessed on 10 September 2012).
25. Abrams, M.; Hook, S.; Ramachandran, B. ASTER User Handbook, Version 2. Available online:
http://asterweb.jpl.nasa.gov/content/03_data/04_Documents/aster_user_guide_v2.pdf (accessed
on 22 August 2012).
26. Amro, I.; Mateos, J.; Vega, M.; Molina, R.; Katsaggelos, A. A survey of classical methods and new
trends in pansharpening of multispectral images. EURASIP J. Adv. Sig. Proc. 2011,
doi: 10.1186/1687-6180-2011-79.
27. ENVI User’s Guide; ITT Visual Information Solutions: Boulder, CO, USA, 2009.
28. Castro, F.; Silva-Forsberg, M.; Wilson, W.; Brondizio, E.; Moran, E. The use of remotely sensed
data in rapid rural assessment. Field Method. 2002, 14, 243–269.
29. Mango, L.M. Modeling the Effect of Land Use and Climate Change Scenarios on the Water Flux of
the Upper Mara River Flow, Kenya. Available online: http://digitalcommons.fiu.edu/etd/159
(accessed on 20 August 2012).
30. Acers International Ltd.; Shawel Consult International. Annexes J–L. In Birr and Koga Irrigation
Project—Koga Catchment and Irrigation Studies; Ministry of Water Resources: Addis Ababa,
Ethiopia, 1995; p. 9.
ISPRS Int. J. Geo-Inf. 2013, 2 320
31. Acers International Ltd.; Shawel Consult International. Annexes M–O. In Birr and Koga Irrigation
Project—Koga Catchment and Irrigation Studies; Ministry of Water Resources: Addis Ababa,
Ethiopia, 1995; pp. 3–15.
32. Gebremedhin, B.; Fernandez-Rivera, S.; Hassen, M.; Mwangi, W; Ahmed, S. Maize and Livestock:
Their Inter-Linked Roles in Meeting Human Needs in Ethiopia; Research Report 6; ILRI
(International Livestock Research Institute): Nairobi, Kenya, 2007.
33. Acers International Ltd.; Shawel Consult International. Koga Catchment Prefeasibility Study; Main
Report; Ministry of Water Resources: Addis Ababa, Ethiopia, 1995.
34. Ethiopian Ministry of Water Resources (MWOR). Koga Project EIA Report; Ministry of Water
Resources: Addis Ababa, Ethiopia, 2004.
35. Astatke, A.; Running, S.; Anderson, F. Building Ponds with Animal Power in the Ethiopian
Highlands, a Manual; International Livestock Center for Africa: Nairobi, Kenya, 1986.
36. Ethiopian Ministry of Agriculture and Rural Development (MOARD), Disaster Management and
Food Security Center. Mecha Woreda and Livelihood Zone Statistics. Available online:
http://www.feg-consulting.com/feg-shared-folder/liu/amhara/posters/west-gojjam/mecha.pdf
(accessed on 22 August 2012)
37. Irit, E.; Tesfai, W. Rebuilding Livelihoods after Dam Induced Relocation in Koga, Blue Nile Basin,
Ethiopia; ZEF Working Paper 83; Center for Development Research, University of Bonn: Bonn,
Germany, 2011.
38. Baris, K.; Esbah, H.; Deniy, B. Monitoring and analyzing land use/cover changes in a developing
coastal town: A case study of Kusadasi, Turkey. J. Coastal Res. 2013, in press.
39. Bolca, M.; Özen, F.; Günes, A. Land use changes in Gediz Delta (Turkey) and their negative impacts
on wetland habitats. J. Coastal Res. 2012, doi: 10.2112/JCOASTRES-D-12-00011.1.
40. Msoffe, F.; Said, M.; Ogutu, J.; Kifugo, S.; Leeuw, J.; Gardingen, P.; Reid, R. Spatial correlates of
land-use changes in the Maasai-Steppe of Tanzania: Implications for conservation and
environmental planning. Int. J. Biodivers. Conserv. 2011, 3, 280–290.
41. Nduwamungu, J.; Bloesch, U.; Munishi, P.; Hagedorn, F.; Lulu, K. Recent land cover and
use changes in Miombo woodlands of eastern Tanzania. Tanzan. J. For. Nat. Conserv. 2008, 78,
50–59.
42. Bernard, B.; Anthony, E.; Patrick, O.; Fridah, M. Dynamics of land use/cover trends in Kanungu
district, South-western Uganda. J. Appl. Sci. Environ. Manage. 2010, 14, 67–70
43. Egeru, A.; Majaliwa, M.G.J. Landuse/cover change trend in Soroti District Eastern Uganda.
J. Appl. Sci. Environ. Manage. 2009, 13, 77–79.
44. Braimoh, A. Seasonal migration and land-use change in Ghana. Land Degrad. Dev. 2004, 15,
37–47.
45. Gautam, A.; Webb, E.; Shivakoti, G.; Zoebisch, M. Land use dynamics and landscape change
pattern in a mountain watershed in Nepal. Agric. Ecosyst. Environ. 2003, 99, 83–96.
46. Rimal, B. Application of remote sensing and GIS, land use/land cover change in Kathamandu
metropolitan city, Nepal. J. Theor. Appl. Inf. Technol. 2005, 23, 80–86.
47. Campbell, D.; Lusch, D.; Smucker, T.; Wangui, E. Multiple methods in the study of driving forces
of land use and land cover change: A case study of SE Kajiado District, Kenya. Human Ecol. 2005,
33, 763–794.

ISPRS Int. J. Geo-Inf. 2013, 2 321
48. Mundia, C.; Aniya, M. Dynamics of land use/cover changes and degradation of Nairobi City,
Kenya. Land Degrad. Dev. 2006, 17, 97–108.
49. Serneels, S.; Lambin, E. Proximate causes of land-use change in Narok District, Kenya: A spatial
statistical model. Agric. Ecosyst. Environ. 2001, 85, 65–81.
50. Braimoh, A.; Onishi, T. Spatial determinants of urban land use change in Lagos, Nigeria. Land Use
Policy 2007, 24, 502–515.
51. Fanan, U.; Oluseyi, I.; Ndalai, A. Detecting changes in land use/cover of Umuahia, South-Eastern
Nigeria using remote sensing and GIS techniques. Confluence J. Environ. Stud. 2011, 6, 72–80.
52. Oyinloye, M.; Kufoniyi, O. Analysis of land use, land cover change and urban expansion in Akure,
Nigeria. J. Innov. Res. Eng. Sci. 2011, 2, 234–248.
53. Oyinloye, R.; Oloukoi, J. Spatio temporal assessment and mapping of the land use land cover
dynamics in the central forest belt of Southwestern Nigeria. Res. J. Environ. Earth Sci. 2012, 4,
720–730.
54. Kamusoko, C.; Aniya, M.; Adi, B.; Manjoro, M. Rural sustainability under threat in
Zimbabwe—Simulation of future land use/cover changes in the Bindura district based on the
Markov-cellular automata model. Appl. Geogr. 2009, 29, 435–447.
55. Jat, M.; Garg, P.; Khare, D. Monitoring and modeling of urban sprawl using remote sensing and
GIS techniques. Int. J. Appl. Earth Obs. Geoinf. 2008, 10, 26–43.
56. Prakasam, C. Land use/cover change detection through remote sensing approach: A case study of
Kodiakanal taluk, Tamil Nadu. Int. J. Geomati. Geosci. 2010, 1, 150–158.
57. Prakash, A.; Gupta, R. Land-use mapping and change detection in a coal mining area—A case
study in the Jharia coalfield, India. Int. J. Remote Sens. 1998, 19, 391–410.
58. Alphan, H. Land-use change and urbanization of Adana, Turkey. Land Degrade. Dev. 2003, 14,
575–586
59. Hepcan, C.; Turan, I.; Ozkan, M. Monitoring land use change in the Cesme coastal zone, Turkey
using aerial photographs and satellite imaging. Land Degrad. Dev. 2010, 22, 326–333.
60. Reis, S. Analyzing land use/land cover changes using remote sensing and GIS in Rize, North-East
Turkey. Sensors 2008, 8, 6188–6202.
61. Reveshty, M. The assessment and predicting of land use changes to urban area using multi-temporal
satellite imagery and GIS: A case study of Zanjan, Iran (1984–2011). J. Geogr. Inf. Syst. 2011, 3,
298–305.
62. Solaimani, K.; Arekhi, M.; Tamartash, R.; Miryaghobzadeh, M. Land use/cover change detection
based on remote sensing data (A case study; Neka Basin). Agric. Biol. J. N. Amer. 2010, 1,
1148–1157.
63. Dewan, A.; Yamaguchi, Y. Land use and land cover change in greater Dhaka, Bangladesh: Using
remote sensing to promote sustainable urbanization. Appl. Geogr. 2009, 29, 390–401.
64. Dewan, A.; Yamaguchi, Y. Using remote sensing and GIS to detect and monitor land use and land
cover change in Dhaka Metropolitan of Bangladesh during 1960–2005. Environ. Monit. Assess.
2009, 150, 237–249.
65. Dewan, A.; Yamaguchi, Y.; Rahman, M. Dynamics of land use/cover changes and the analysis of
landscape fragmentation in Dhaka Metropolitan, Bangladesh. GeoJournal 2012, 77, 315–330.
ISPRS Int. J. Geo-Inf. 2013, 2 322
66. Alemayehu, F.; Taha, N.; Nyssen, J.; Girma, A.; Zenebe, A.; Behailu, M.; Deckers, S.; Poesen, J.
The impacts of watershed management on land use and land cover dynamics in Eastern Tigray
(Ethiopia). Resour. Conserv. Recycl. 2009, 53, 192–198.
67. Bewket, W. Land cover dynamics since the 1950s in Chemoga watershed, Blue Nile Basin,
Ethiopia. Mt. Res. Dev. 2002, 22, 263-269.
68. Mulugeta, T.M. Land-use-cover dynamics in Nonno district, Central Ethiopia. J. Sustain. Dev. Afr.
2011, 13, 123–141.
69. Yang, X.; Lo, C. Relative radiometric normalization performance for change detection from
multi-date satellite images. Photogramm. Eng. Remote Sensing 2000, 66, 967–980.
70. Fisseha, G.; Gebrekidan, H.; Kibret, K.; Yitaferu, B.; Bedadi, B. Analysis of land use/land cover
changes in the Debre-Mewi watershed at the upper catchment of the Blue Nile Basin, North West
Ethiopia. J. Biodivers. Environ. Sci. 2011, 1, 184–196.
71. Kidanu, S. Using Eucalyptus for Soil and Water Conservation; Wageningen University and
Research Center: Wageningen, The Netherlands, 2004.
72. Shiferaw, A. Evaluating the land use and land cover dynamics in Borena Woreda of South Wollo
Highlands, Ethiopia. J. Sustain. Dev. Afr. 2011, 13, 87–107.
73. Tegene, B. Land-vover/land-use changes in the Derekolli catchment of the South Wolo zone of the
Amhara Region, Ethiopia. East. Afr. Soc. Sci. Res. Rev. 2002, 18, 1–20.
74. Tsegaye, D.; Moea, S.R.; Paul, V.; Aynekulu, E. Land-use/cover dynamics in Northern Afar
rangelands, Ethiopia. Agric. Ecosyst. Environ. 2010, 139, 174–180.
75. Tekle, K.; Hedlund, L. Land cover changes between 1958 and 1986 in Kalu District, southern
Wello, Ethiopia. Mt. Res. Dev. 2000, 20, 42–51.
76. Hurni, H.; Tato, K.; Zeleke, G. The implications of changes in population, land use and land
management for surface runoff in the upper Nile Basin area of Ethiopia. Mt. Res. Dev. 2005, 25,
147–154.
77. Reid, R.S.; Kruska, R.L.; Muthui, N.; Taye, A.; Wotton, S.; Wilson, C.J.; Mulatu, W. Land-use and
land-cover dynamics in response to changes in climatic, biological and socio-political forces: The
case of southwestern Ethiopia. Landscape Ecol. 2000, 15, 339–355.
78. Taddese, G. Land degradation: A challenge to Ethiopia. Environ. Manage. 2001, 27, 815–824.
Appendix
Table A1. Confusion matrix—1979 image classification before pansharpening. Overall
Accuracy = 75.88%, Kappa Coefficient = 0.67.
Ground Truth (Percent)
Class Woody
Vegetation Pasture Settlement
Crop
Field
Bare
Area Total
Woody vegetation 92.7 0.7 0 0.3 0 22.0
Pasture 1.8 73.7 0 32.6 5.8 37.4
Settlement 0 0 93.6 1.3 14.4 2.7
Crop field 0.2 19.3 2.1 61.5 3.3 25.6
Bare area 0.2 6.3 4.3 4.3 76.5 12.4
Total 100 100 100 100 100 100

ISPRS Int. J. Geo-Inf. 2013, 2 323
Table A2. Confusion matrix—1979 image classification after pansharpening. Overall
Accuracy = 96.17%, Kappa Coefficient = 0.94.
Ground Truth (Pixels)
Class Woody
Vegetation Pasture Settlement
Crop
Field
Bare
Area Total
Woody vegetation 99.6 0 0 0.3 0 18.8
Pasture 0 96.6 0 5.6 0 45.6
Settlement 0 0 91.2 0 32.4 0.2
Crop field 0.4 3.4 2.2 94.1 0 35.3
Bare area 0 0 6.6 0.0 67.6 0.2
Total 100 100 100 100 100 100
© 2013 by the authors; licensee MDPI, Basel, Switzerland. This article is an open access article
distributed under the terms and conditions of the Creative Commons Attribution license
(http://creativecommons.org/licenses/by/3.0/).