Identifying Ecologically and Biologically Significant ... · Identifying Ecologically and...
18
Identifying Ecologically and Biologically Significant Areas on Seamounts Workshop Report INTERNATIONAL UNION FOR CONSERVATION OF NATURE
-
Upload
truongxuyen -
Category
Documents
-
view
227 -
download
0
Transcript of Identifying Ecologically and Biologically Significant ... · Identifying Ecologically and...
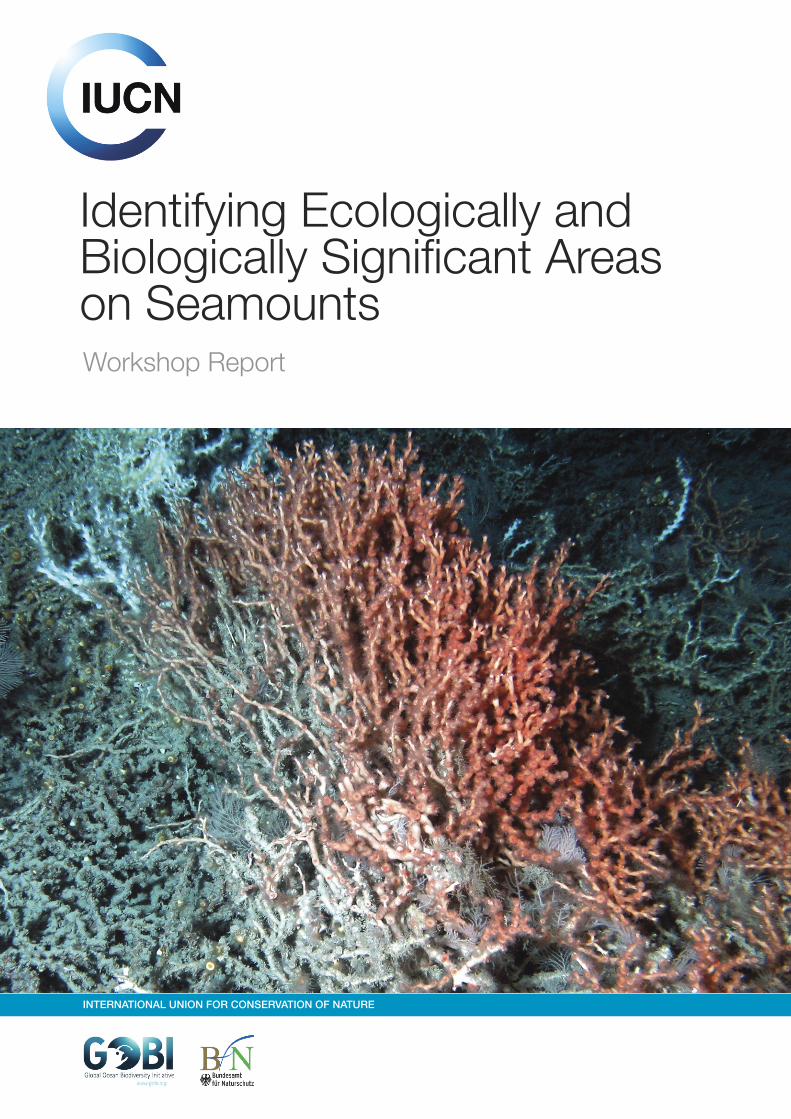
Identifying Ecologically andBiologically Significant Areas on SeamountsWorkshop Report
INTERNATIONAL UNION FOR CONSERVATION OF NATURE
The designation of geographical entities in this publication, and the presentation of the material, do not implythe expression of any opinion whatsoever on the part of IUCN concerning the legal status of any country,territory, or area, or of its authorities, or concerning the delimitation of its frontiers or boundaries.The views expressed in this publication do not necessarily reflect those of IUCN.
Published by: IUCN, Gland, Switzerland
Copyright: © 2011 International Union for Conservation of Nature and Natural Resources
Reproduction of this publication for educational or other non-commercial purposes isauthorized without prior written permission from the copyright holder provided thesource is fully acknowledged.
Reproduction of this publication for resale or other commercial purposes is prohibitedwithout prior written permission of the copyright holder.
Citation: Dunstan, P.K. Clark, M.R., Guinotte, J., O’Hara, T., Niklitschek, E., Rowden, A.A.,Schlacher, T., Tsuchida, S., Watling, L., Williams, A. (2011). Identifying Ecologically andBiologically Significant Areas on Seamounts. Gland, Switzerland: IUCN. 14pp.
ISBN: 978-2-8317-1430-1
Cover photo: Deep sea coral habitat © Brooke et. al., NOAA OE 2005/Marine Photobank
Layout by: Tim Davis, DJEnvironmental, UK
Printed by: UNI Global Union, Nyon, Switzerland
Available from: IUCN (International Union for Conservation of Nature)Publications ServicesRue Mauverney 281196 GlandSwitzerlandTel +41 22 999 0000Fax +41 22 999 [email protected]/publications
Identifying EBSAs on Seamounts 1
Identifying Ecologically andBiologically Significant Areason SeamountsPiers K Dunstan, Malcolm R Clark, John Guinotte, Tim O’Hara, Edwin Niklitschek, Ashley A Rowden,Thomas Schlacher, Shinji Tsuchida, Les Watling and Alan Williams
The workshop was organized by GOBI and CenSeam, a field programme and research network withinthe Census of Marine Life and supported by Sloan Foundation grant 2010-5-31 CML to the IUCN andGOBI. CenSeam provided support for several of the participants. Edward van den Berghe (OBIS), KarenStocks (SeamountsOnline; University of California, San Diego) and Derek Tittensor provided data setsand/or advice prior to and during the workshop.
ACKNOWLEDGEMENTS
Introduction .....................................................................................................................................4
1. Provisional process for identification of EBSAs ......................................................................51.1 Are all EBSA criteria created equal? ...............................................................................51.2 Provisional process........................................................................................................61.3 A global or regional approach? ......................................................................................61.4 Available data on EBSA criteria for seamounts ...............................................................7
2. An example from the South Pacific Ocean ...............................................................................92.1 The region .....................................................................................................................92.2 Evaluate the criteria for each seamount..........................................................................92.3 Evaluate a combination of criteria for seamounts .........................................................102.4 Identify candidate EBSAs.............................................................................................10
3. Conclusion ................................................................................................................................13
4. References................................................................................................................................14
Identifying EBSAs on Seamounts 3
TABLE OF CONTENTS
4 Identifying ESBAs on Seamounts
The Global Ocean Biodiversity Initiative (GOBI;www.gobi.org) is an international partnershipadvancing the scientific basis to identify marineareas outside national jurisdiction that are in needof protection. GOBI aims to help countries, as wellas regional and global organizations, to use anddevelop data, tools, and methodologies to identifyecologically and biologically significant areas(EBSAs) with a focus on the high seas and deepseabed beyond national jurisdiction. GOBI isidentifying regions and biomes in the high seaswhere there is sufficient information to begin theidentification of candidate EBSAs, and GOBI isassisting the CBD in the collection of data thatwould help the identification of candidate EBSAsto inform spatial management of the open oceanand deep seas by competent authorities.
In appendix II to Decision IX/20 that establishedthe EBSA criteria, the CBD specifically citesseamounts as an example of the first criterion,Uniqueness & rarity. To take advantage of thebreadth of knowledge about seamounts held byCENSEAM (the global census of marine life onseamounts (http://censeam.niwa.co.nz) whichwas a field programme within the Census ofMarine Life), GOBI and CENSEAM organized ajoint workshop that was held in December 2011to progress the identification of EBSAs forseamounts in the high seas.
The workshop had three primary goals:
l Determine suitable data for the identification ofEBSAs for seamounts
l Develop a process for the identification ofpriority EBSAs for seamounts
l Identify candidate EBSAs from existingseamount data and knowledge.
Seamounts are major topographic features onthe high seas and form distinctive habitats inareas that would otherwise be dominated bysedimentary plains (Clark et al. 2010). They aretypified by biota that is distinct from species insurrounding sedimentary areas and can beextremely vulnerable to disturbance (Clark et al.2010). They are a focus for conservation withinnational boundaries but are not specificallymanaged on the high seas. Seamountecosystems have been highlighted by the UnitedNations General Assembly as vulnerable tofishing (resolutions 61/105, and 59/25, UnitedNations 2006) and the Food and AgricultureOrganization of the UN has developedInternational Guidelines for the Management ofdeep-sea fisheries in the High Seas (FAO 2009).Conservation needs for seamounts have beenidentified in recent years (e.g., Probert et al.2007) including the need for a protected areasystem to protect seamount biodiversity, andecosystem structure and function (e.g., Johnston& Santillo 2004; George et al. 2007).
In 2008 the Conference of the Parties to theConvention on Biological Diversity (COP9, Bonn,Germany) adopted a set of seven scientificcriteria to identify ecologically and biologicallysignificant areas (EBSAs) in the global marinerealm (CBD 2009). These criteria had beendeveloped over several years, and consolidatedat a CBD Expert Workshop on Ecological Criteriaand Biogeographic Classification Systems forMarine Areas in Need of Protection held in theAzores in 2007. Using the CBD EBSA criteria toidentify specific ocean areas that requireenhanced management and protection can thushelp to achieve a variety of internationalmanagement and conservation objectives.
INTRODUCTION
Identifying EBSAs on Seamounts 5
1. PROVISIONAL PROCESS FOR IDENTIFICATION OF EBSAS
1.1 Are all EBSA criteria created equal?
The EBSA criteria, taken individually suggest thateach one is of equal value. However, due to thebroad definitions of the criteria and the sparsedata available for the high seas, many areaswould be labelled significant in some way withoutinformation to differentiate them. However, someof the criteria may be less relevant to particularbiomes. In the case of seamounts on the highseas, it is apparent that some of the criteria do nothave the same relevance. For example, criterion 7(Productivity) can, in general, only be weaklylinked to biodiversity on seamounts. In contrast,criteria 1 and 3 (Uniqueness or rarity, andImportance for threatened, endangered ordeclining species/habitats) are more clearlyidentified with seamount habitats which dopossess some endemic species and are asystem under threat. Criteria 1 and 3 are alsoclosely linked to FAO VME criteria (FAO 2009)although VMEs must be assessed relative to
threats, whereas EBSA criteria can be met withoutconsideration of human impact.
Thus, when considering seamounts, the EBSAcriteria fall into a natural ranking of relevance. Thisranking will be different for other habitats orbiomes, and there may be some situations whereall the criteria are considered of equal relevance.Five of the criteria were considered essentiallybiological in nature, criteria 1, 2, 3, 5 and 6. Theremaining criteria, 4 and 7 both contain elementsof human interaction and can be separated fromthe purely biological criteria. This separation is asimilar interpretation to the one suggested by theSubsidiary Body on Scientific, Technical andTechnological Advice (SBSTTA) working group(CBD 2009).
If criteria are considered to have a relevance rankand be of two types, then it follows that they mustbe combined in some way that reflects these
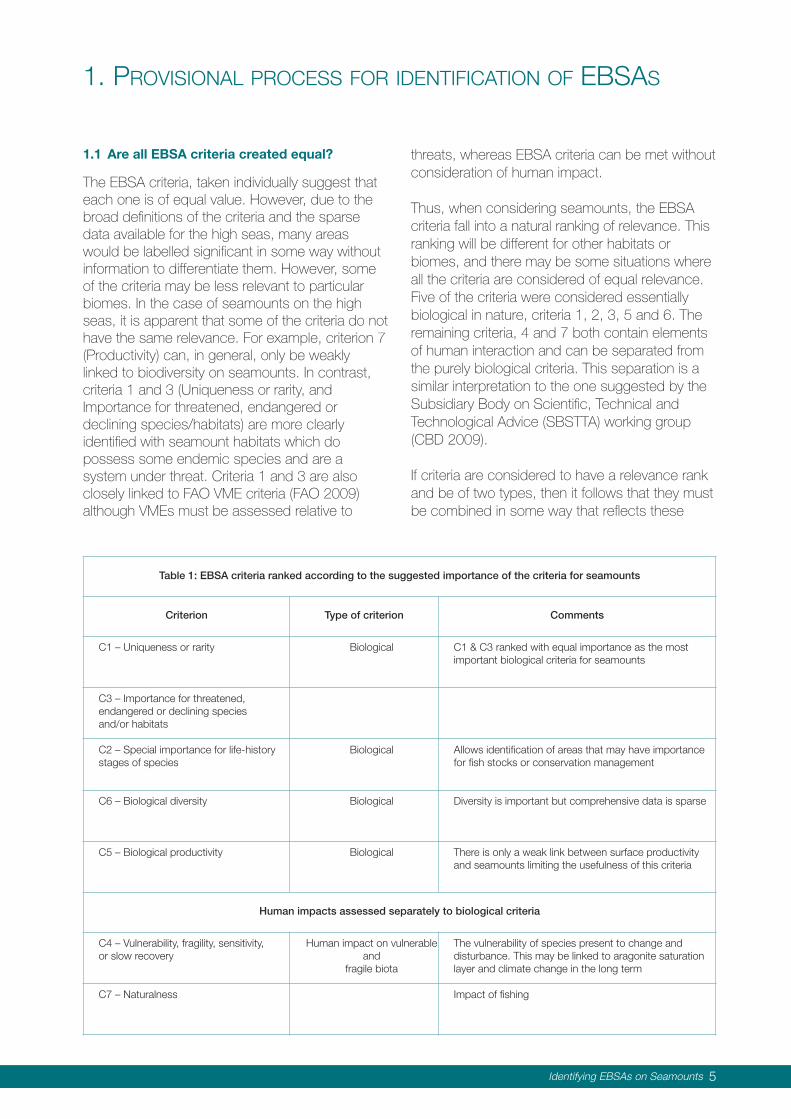
Table 1: EBSA criteria ranked according to the suggested importance of the criteria for seamounts
Criterion Type of criterion Comments
C1 – Uniqueness or rarity Biological C1 & C3 ranked with equal importance as the mostimportant biological criteria for seamounts
C3 – Importance for threatened,endangered or declining species and/or habitats
C2 – Special importance for life-historystages of species
Biological Allows identification of areas that may have importancefor fish stocks or conservation management
C6 – Biological diversity Biological Diversity is important but comprehensive data is sparse
C5 – Biological productivity Biological There is only a weak link between surface productivityand seamounts limiting the usefulness of this criteria
Human impacts assessed separately to biological criteria
C4 – Vulnerability, fragility, sensitivity, or slow recovery
Human impact on vulnerableand
fragile biota
The vulnerability of species present to change anddisturbance. This may be linked to aragonite saturationlayer and climate change in the long term
C7 – Naturalness Impact of fishing
differences. Several possibilities (e.g., multi-criteriadecision analysis) were discussed within theworkshop. It was felt that a tractable way toexplore methods for combining criteria was tomap the distributions of seamounts meeting eachcriterion, and compare potential EBSAs that arisefrom a number of different combinations of criteria.It would also be useful to quantify the degree ofcertainty associated with the data used to informeach criterion. For example, direct measurementswill have a higher level of confidence thanmodelled data, although modelled data willtypically be at a broader scale. However, amethod to assign confidence to the finalcombination of criteria was not explored anyfurther in the workshop.
1.2 Provisional process
Without prejudging the future development andrefinements of the process to identify EBSAsunder the CBD, the participants considered itappropriate to agree on an initial set of steps thatcould be practically addressed at this meeting asa Provisional Process to identify EBSAs onseamounts.
1. Identify the region to be examined – caninclude multiple biogeographic provinces.
2. Determine appropriate datasets to use for theevaluation, and where appropriate identifygaps.
3. Evaluate the data for each seamount against aset of agreed criteria.
4. Identify an area or areas in which seamountshave high scores (some composite of scoredcriteria) – taking an area assumes that afunctional EBSA is likely to be larger than anindividual seamount.
5. Following established procedures, makeavailable a draft submission for identifiedEBSAs through the CBD repository forconsideration by the appropriate regionalprocess, complete with supportingdocumentation and description of data used.
The workshop further tasked itself with:
l Evaluating the strengths and weaknesses ofthe provisional process and the GOBI’s onlinecandidate EBSA submission tool.
l Considering future data needs, analyses andenhancement of the process.
1.3 A global or regional approach?
A key decision to make at the outset of theprocess is the scale at which EBSA identificationis to be considered. Approaches and datasources differ from a global or regional viewpoint,and the interpretation of criteria may also differ.Global-scale data may be at a coarse resolution,whereas regional datasets may be much moredetailed. An important element in determining anappropriate scale is information onbiogeographical boundaries; within onebiogeographic region faunal communities areexpected to be generally similar. The most recentexample of a benthic-based biogeographicalclassification is the Global Open Oceans andDeep Seabed (GOODS) biogeographicalclassification (UNESCO 2009). This classificationpotentially provides a framework for identifyingregions that have similar biogeography and canbe used to partition the benthic realm to reducethe area that needs to be considered at any onetime. The classification also includes a depthcomponent, so that biogeographic regions areseparated spatially and by depth. However, anyuse of GOODS needs to acknowledge that whileit is currently the best available globalbiogeographic classification, as additional dataand information become available it will need tobe modified (e.g., O’Hara et al. 2011).
The definitions and interpretations of EBSA criteriahave been developed as part of the CBDtechnical workshop in 2009 (CBD 2009). Theintent of the EBSA criteria is global (CBD expertworkshop 2009). However, the decision ofCOP10 (X/29.26) places responsibility of EBSAidentification to States and competentinternational bodies. There is also a regionalprocess developing to identify potential EBSAs.
Adopting a biogeographic approach allows regionalexperts with access to the most spatially relevantdata and knowledge to make evaluations moreconfidently than a single global approach. Theworkshop identified a provisional process that canbe refined to identify seamounts/areas that meetEBSA criteria within any biogeographic region.
6 Identifying ESBAs on Seamounts
PROVISIONAL PROCESS FOR IDENTIFICATION OF EBSAS
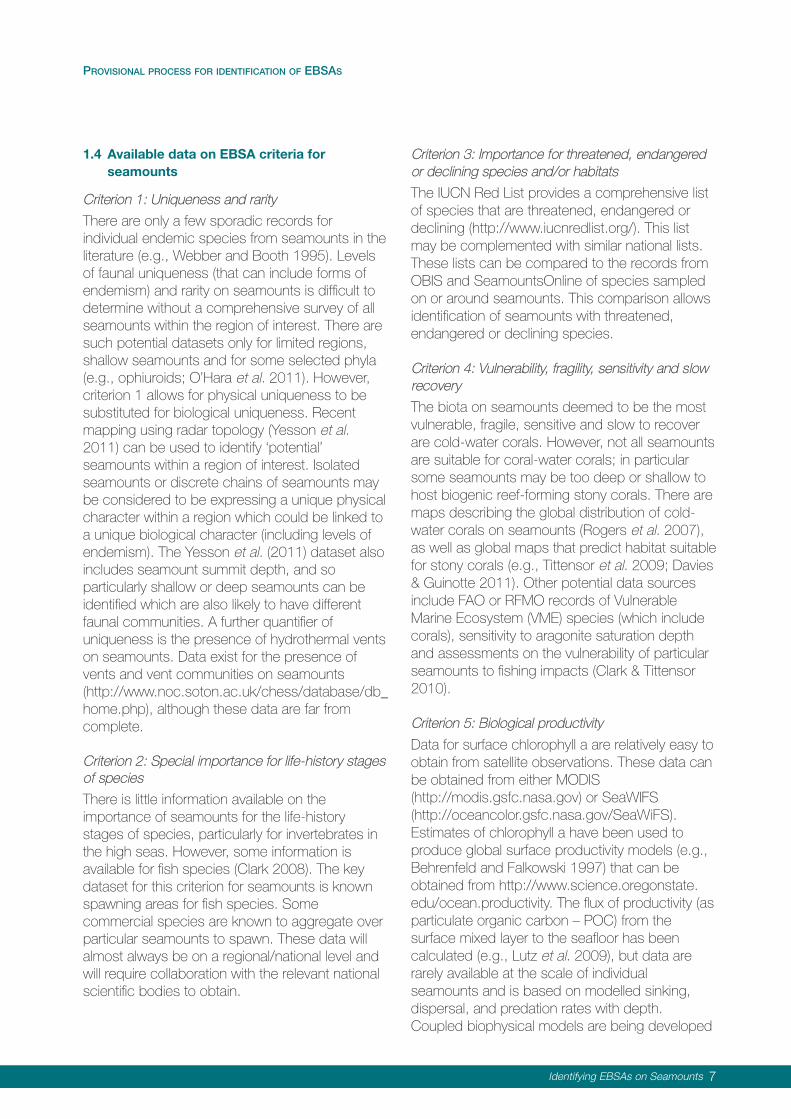
Criterion 3: Importance for threatened, endangeredor declining species and/or habitats
The IUCN Red List provides a comprehensive listof species that are threatened, endangered ordeclining (http://www.iucnredlist.org/). This listmay be complemented with similar national lists.These lists can be compared to the records fromOBIS and SeamountsOnline of species sampledon or around seamounts. This comparison allowsidentification of seamounts with threatened,endangered or declining species.
Criterion 4: Vulnerability, fragility, sensitivity and slowrecovery
The biota on seamounts deemed to be the mostvulnerable, fragile, sensitive and slow to recoverare cold-water corals. However, not all seamountsare suitable for coral-water corals; in particularsome seamounts may be too deep or shallow tohost biogenic reef-forming stony corals. There aremaps describing the global distribution of cold-water corals on seamounts (Rogers et al. 2007),as well as global maps that predict habitat suitablefor stony corals (e.g., Tittensor et al. 2009; Davies& Guinotte 2011). Other potential data sourcesinclude FAO or RFMO records of VulnerableMarine Ecosystem (VME) species (which includecorals), sensitivity to aragonite saturation depthand assessments on the vulnerability of particularseamounts to fishing impacts (Clark & Tittensor2010).
Criterion 5: Biological productivity
Data for surface chlorophyll a are relatively easy toobtain from satellite observations. These data canbe obtained from either MODIS(http://modis.gsfc.nasa.gov) or SeaWIFS(http://oceancolor.gsfc.nasa.gov/SeaWiFS).Estimates of chlorophyll a have been used toproduce global surface productivity models (e.g.,Behrenfeld and Falkowski 1997) that can beobtained from http://www.science.oregonstate.edu/ocean.productivity. The flux of productivity (asparticulate organic carbon – POC) from thesurface mixed layer to the seafloor has beencalculated (e.g., Lutz et al. 2009), but data arerarely available at the scale of individualseamounts and is based on modelled sinking,dispersal, and predation rates with depth.Coupled biophysical models are being developed
1.4 Available data on EBSA criteria forseamounts
Criterion 1: Uniqueness and rarity
There are only a few sporadic records forindividual endemic species from seamounts in theliterature (e.g., Webber and Booth 1995). Levelsof faunal uniqueness (that can include forms ofendemism) and rarity on seamounts is difficult todetermine without a comprehensive survey of allseamounts within the region of interest. There aresuch potential datasets only for limited regions,shallow seamounts and for some selected phyla(e.g., ophiuroids; O’Hara et al. 2011). However,criterion 1 allows for physical uniqueness to besubstituted for biological uniqueness. Recentmapping using radar topology (Yesson et al.2011) can be used to identify ‘potential’seamounts within a region of interest. Isolatedseamounts or discrete chains of seamounts maybe considered to be expressing a unique physicalcharacter within a region which could be linked toa unique biological character (including levels ofendemism). The Yesson et al. (2011) dataset alsoincludes seamount summit depth, and soparticularly shallow or deep seamounts can beidentified which are also likely to have differentfaunal communities. A further quantifier ofuniqueness is the presence of hydrothermal ventson seamounts. Data exist for the presence ofvents and vent communities on seamounts(http://www.noc.soton.ac.uk/chess/database/db_home.php), although these data are far fromcomplete.
Criterion 2: Special importance for life-history stagesof species
There is little information available on theimportance of seamounts for the life-historystages of species, particularly for invertebrates inthe high seas. However, some information isavailable for fish species (Clark 2008). The keydataset for this criterion for seamounts is knownspawning areas for fish species. Somecommercial species are known to aggregate overparticular seamounts to spawn. These data willalmost always be on a regional/national level andwill require collaboration with the relevant nationalscientific bodies to obtain.
Identifying EBSAs on Seamounts 7
PROVISIONAL PROCESS FOR IDENTIFICATION OF EBSAS
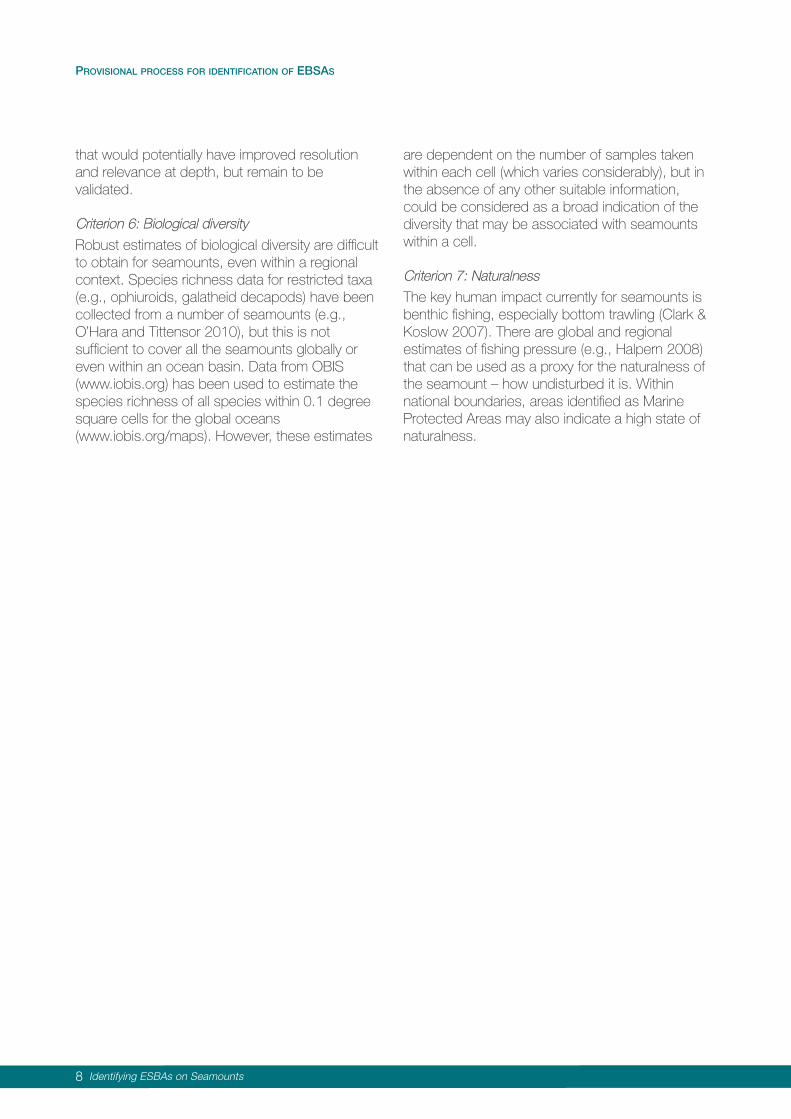
that would potentially have improved resolutionand relevance at depth, but remain to bevalidated.
Criterion 6: Biological diversity
Robust estimates of biological diversity are difficultto obtain for seamounts, even within a regionalcontext. Species richness data for restricted taxa(e.g., ophiuroids, galatheid decapods) have beencollected from a number of seamounts (e.g.,O’Hara and Tittensor 2010), but this is notsufficient to cover all the seamounts globally oreven within an ocean basin. Data from OBIS(www.iobis.org) has been used to estimate thespecies richness of all species within 0.1 degreesquare cells for the global oceans(www.iobis.org/maps). However, these estimates
are dependent on the number of samples takenwithin each cell (which varies considerably), but inthe absence of any other suitable information,could be considered as a broad indication of thediversity that may be associated with seamountswithin a cell.
Criterion 7: Naturalness
The key human impact currently for seamounts isbenthic fishing, especially bottom trawling (Clark &Koslow 2007). There are global and regionalestimates of fishing pressure (e.g., Halpern 2008)that can be used as a proxy for the naturalness ofthe seamount – how undisturbed it is. Withinnational boundaries, areas identified as MarineProtected Areas may also indicate a high state ofnaturalness.
8 Identifying ESBAs on Seamounts
PROVISIONAL PROCESS FOR IDENTIFICATION OF EBSAS
provinces and seafloor at water depths from50–4,000m. Yesson et al. (2011) predict a total of3,451 seamounts within this region.
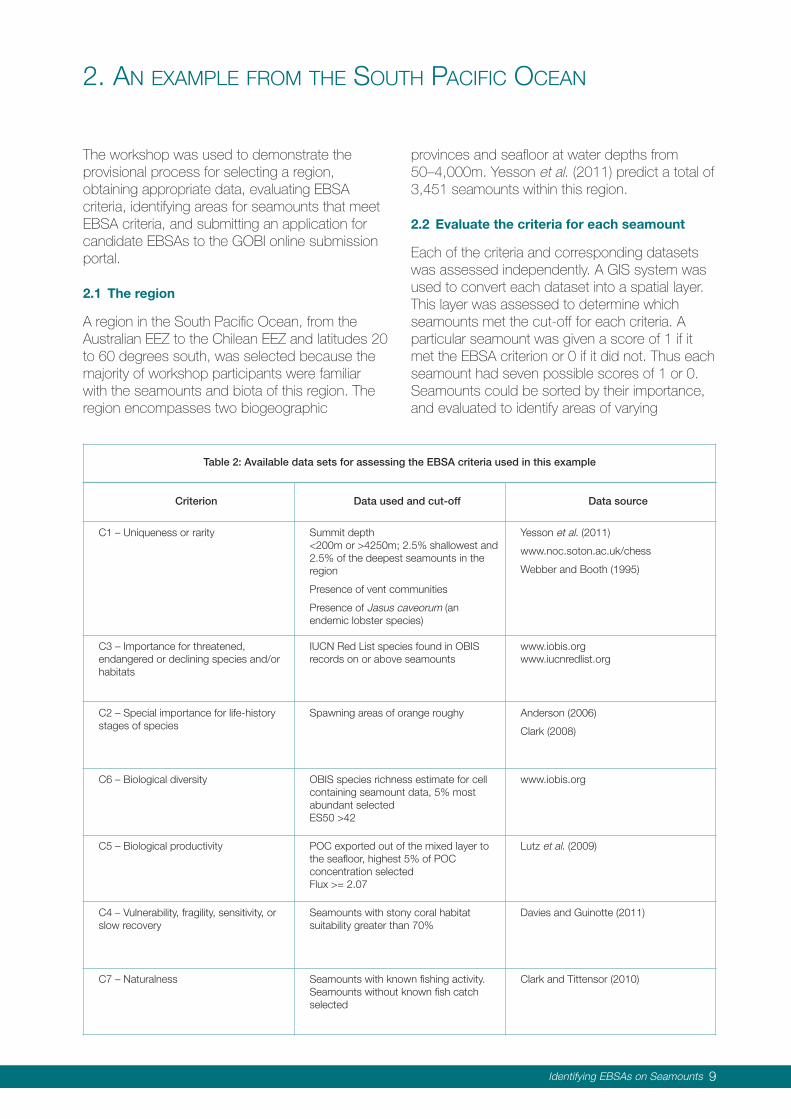
2.2 Evaluate the criteria for each seamount
Each of the criteria and corresponding datasetswas assessed independently. A GIS system wasused to convert each dataset into a spatial layer.This layer was assessed to determine whichseamounts met the cut-off for each criteria. Aparticular seamount was given a score of 1 if itmet the EBSA criterion or 0 if it did not. Thus eachseamount had seven possible scores of 1 or 0.Seamounts could be sorted by their importance,and evaluated to identify areas of varying
The workshop was used to demonstrate theprovisional process for selecting a region,obtaining appropriate data, evaluating EBSAcriteria, identifying areas for seamounts that meetEBSA criteria, and submitting an application forcandidate EBSAs to the GOBI online submissionportal.
2.1 The region
A region in the South Pacific Ocean, from theAustralian EEZ to the Chilean EEZ and latitudes 20to 60 degrees south, was selected because themajority of workshop participants were familiarwith the seamounts and biota of this region. Theregion encompasses two biogeographic
Identifying EBSAs on Seamounts 9
2. AN EXAMPLE FROM THE SOUTH PACIFIC OCEAN
Table 2: Available data sets for assessing the EBSA criteria used in this example
Criterion Data used and cut-off Data source
C1 – Uniqueness or rarity Summit depth <200m or >4250m; 2.5% shallowest and2.5% of the deepest seamounts in theregion
Presence of vent communities
Presence of Jasus caveorum (an endemic lobster species)
Yesson et al. (2011)
www.noc.soton.ac.uk/chess
Webber and Booth (1995)
C3 – Importance for threatened,endangered or declining species and/orhabitats
IUCN Red List species found in OBISrecords on or above seamounts
www.iobis.orgwww.iucnredlist.org
C2 – Special importance for life-historystages of species
Spawning areas of orange roughy Anderson (2006)
Clark (2008)
C6 – Biological diversity OBIS species richness estimate for cellcontaining seamount data, 5% mostabundant selectedES50 >42
www.iobis.org
C5 – Biological productivity POC exported out of the mixed layer tothe seafloor, highest 5% of POCconcentration selectedFlux >= 2.07
Lutz et al. (2009)
C4 – Vulnerability, fragility, sensitivity, orslow recovery
Seamounts with stony coral habitatsuitability greater than 70%
Davies and Guinotte (2011)
C7 – Naturalness Seamounts with known fishing activity.Seamounts without known fish catchselected
Clark and Tittensor (2010)
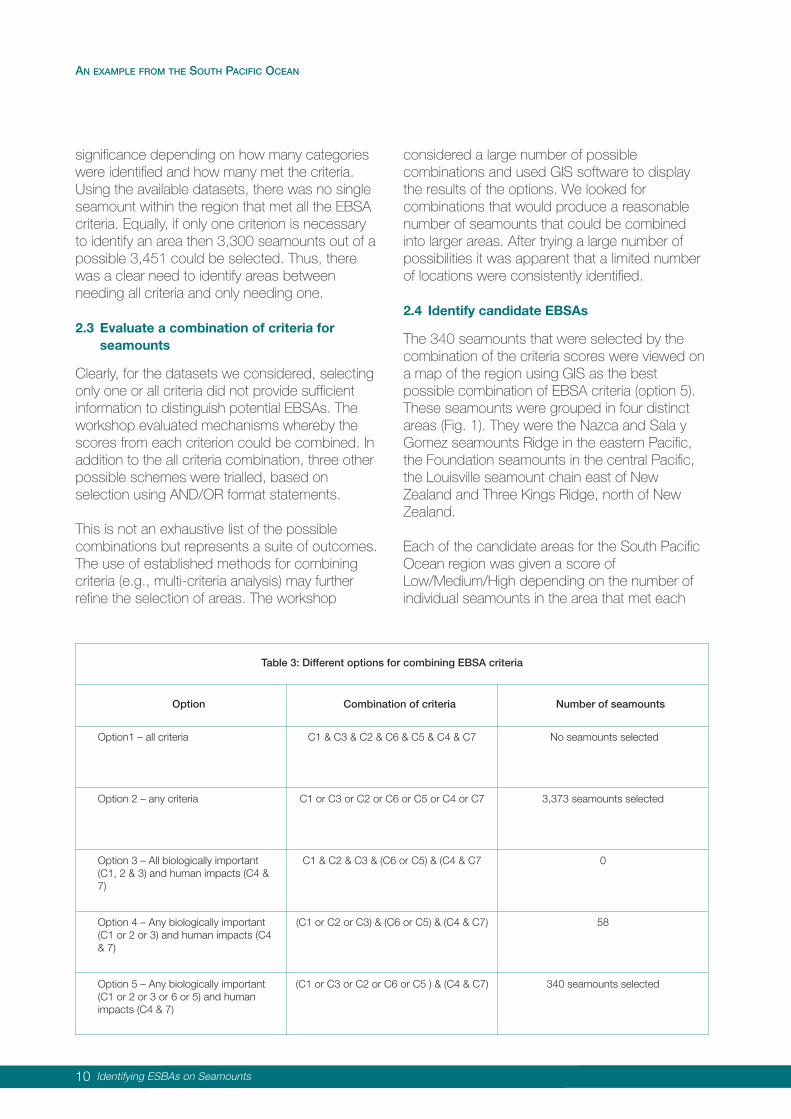
significance depending on how many categorieswere identified and how many met the criteria.Using the available datasets, there was no singleseamount within the region that met all the EBSAcriteria. Equally, if only one criterion is necessaryto identify an area then 3,300 seamounts out of apossible 3,451 could be selected. Thus, therewas a clear need to identify areas betweenneeding all criteria and only needing one.
2.3 Evaluate a combination of criteria forseamounts
Clearly, for the datasets we considered, selectingonly one or all criteria did not provide sufficientinformation to distinguish potential EBSAs. Theworkshop evaluated mechanisms whereby thescores from each criterion could be combined. Inaddition to the all criteria combination, three otherpossible schemes were trialled, based onselection using AND/OR format statements.
This is not an exhaustive list of the possiblecombinations but represents a suite of outcomes.The use of established methods for combiningcriteria (e.g., multi-criteria analysis) may furtherrefine the selection of areas. The workshop
considered a large number of possiblecombinations and used GIS software to displaythe results of the options. We looked forcombinations that would produce a reasonablenumber of seamounts that could be combinedinto larger areas. After trying a large number ofpossibilities it was apparent that a limited numberof locations were consistently identified.
2.4 Identify candidate EBSAs
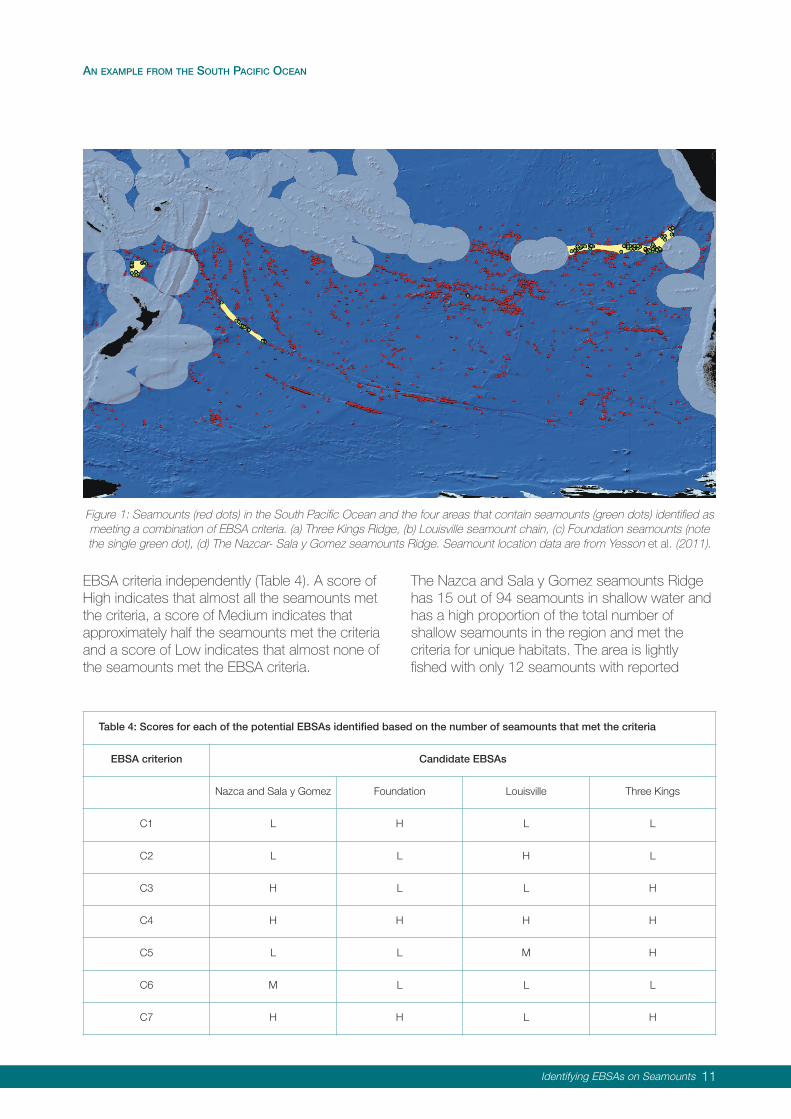
The 340 seamounts that were selected by thecombination of the criteria scores were viewed ona map of the region using GIS as the bestpossible combination of EBSA criteria (option 5).These seamounts were grouped in four distinctareas (Fig. 1). They were the Nazca and Sala yGomez seamounts Ridge in the eastern Pacific,the Foundation seamounts in the central Pacific,the Louisville seamount chain east of NewZealand and Three Kings Ridge, north of NewZealand.
Each of the candidate areas for the South PacificOcean region was given a score ofLow/Medium/High depending on the number ofindividual seamounts in the area that met each
10 Identifying ESBAs on Seamounts
AN EXAMPLE FROM THE SOUTH PACIFIC OCEAN
Table 3: Different options for combining EBSA criteria
Option Combination of criteria Number of seamounts
Option1 – all criteria C1 & C3 & C2 & C6 & C5 & C4 & C7 No seamounts selected
Option 2 – any criteria C1 or C3 or C2 or C6 or C5 or C4 or C7 3,373 seamounts selected
Option 3 – All biologically important(C1, 2 & 3) and human impacts (C4 &7)
C1 & C2 & C3 & (C6 or C5) & (C4 & C7 0
Option 4 – Any biologically important(C1 or 2 or 3) and human impacts (C4& 7)
(C1 or C2 or C3) & (C6 or C5) & (C4 & C7) 58
Option 5 – Any biologically important(C1 or 2 or 3 or 6 or 5) and humanimpacts (C4 & 7)
(C1 or C3 or C2 or C6 or C5 ) & (C4 & C7) 340 seamounts selected
The Nazca and Sala y Gomez seamounts Ridgehas 15 out of 94 seamounts in shallow water andhas a high proportion of the total number ofshallow seamounts in the region and met thecriteria for unique habitats. The area is lightlyfished with only 12 seamounts with reported
EBSA criteria independently (Table 4). A score ofHigh indicates that almost all the seamounts metthe criteria, a score of Medium indicates thatapproximately half the seamounts met the criteriaand a score of Low indicates that almost none ofthe seamounts met the EBSA criteria.
Identifying EBSAs on Seamounts 11
AN EXAMPLE FROM THE SOUTH PACIFIC OCEAN
Table 4: Scores for each of the potential EBSAs identified based on the number of seamounts that met the criteria
EBSA criterion Candidate EBSAs
Nazca and Sala y Gomez Foundation Louisville Three Kings
C1 L H L L
C2 L L H L
C3 H L L H
C4 H H H H
C5 L L M H
C6 M L L L
C7 H H L H
Figure 1: Seamounts (red dots) in the South Pacific Ocean and the four areas that contain seamounts (green dots) identified asmeeting a combination of EBSA criteria. (a) Three Kings Ridge, (b) Louisville seamount chain, (c) Foundation seamounts (notethe single green dot), (d) The Nazcar- Sala y Gomez seamounts Ridge. Seamount location data are from Yesson et al. (2011).
fishing activity, so naturalness is reasonably high.Sixteen seamounts have high productivity and 26high diversity.
The Louisville seamount chain east of NewZealand is a known orange roughy spawningarea. Eight of the 31 seamounts within the chainhave identified threatened species and 19 havehigh productivity. However, most of theseamounts (27) of the seamount chain have beenfished, so naturalness is probably low.
The Foundation seamounts are all in shallowwater (i.e., <200m) and met the criteria for a
unique habitat based on their physical attributes.There are no threatened species recorded andproductivity is low. However, it is the location ofthe only known record of the endemic lobsterJasus caveoriun (Webber and Booth 1995). Thereis no recorded fishing activity on theseseamounts, so their naturalness level is high.
The Three Kings seamounts have highproductivity (22 of 23 seamounts) and have littlerecorded fishing so have high naturalness. Theseseamounts have a high proportion of vulnerablestony coral habitat and a large number ofrecorded Red List species.
12 Identifying ESBAs on Seamounts
AN EXAMPLE FROM THE SOUTH PACIFIC OCEAN
changes in the identification of EBSAs that mayoccur, and therefore the sensitivity of theidentification process to variation in data input.Improved information on the composition ofbiological communities (especially endemic orhighly vulnerable species) and the extent ofhuman impact from fishing or mining is necessaryto make the evaluation of the criteria more robust.The provisional process should also be tested inother regions with different data sets.
The approach taken here differs from many otherexpert-driven approaches. We did not identify theareas prior to obtaining data, in fact given thespatial domain we had no pre-existing areas thatwere identified. This process may provide a moreinclusive and objective approach to identifyingEBSAs than a process where areas are firstidentified and then data used as justification fortheir identification as EBSAs. Consequently, it isimportant to note that the outcomes of thisworkshop depended on a large body of pre-existing work. In the absence of this, there wouldneed to be considerable effort expended prior tothe assessment of criteria to ensure the mostrobust outcome. It is also desirable to have anongoing process of engagement with scienceproviders to deliver ongoing critical advice, toensure that they are aware of the opportunitiesand to support future efforts to identify EBSAs.The identification of the four EBSAs for seamountsin the South Pacific Ocean is a result of our trailingthe provisional process – and without furtheranalyses, these areas should not be consideredas formal candidate EBSAs for consideration bythe CBD or regional parties.
Application of the EBSA criteria is relativelyuntried. The absence of a clear process by whichto apply the criteria may limit the usefulness anduptake of the criteria. Thus, there is a need toestablish a process that can be used acrossmultiple regions to identify EBSAs in a comparableand robust manner. The workshop wassuccessful in devising a provisional process thatcan be used to identify candidate EBSAs, as wellas identifying the types of data that can be usedin the process. The provisional process wasdeveloped for seamounts and potentially otherbenthic systems globally. With modification itshould be applicable to pelagic systems.
The provisional process used a combined criteriaapproach which enabled “high priority” EBSAs tobe identified out of a large number of individualseamounts that may qualify for EBSA statusbased on meeting one or a few of the criteria. Theprocess is transparent and can be modified byregional knowledge on smaller spatial scales thanconsidered here. We believe it can make animportant contribution to the CBD objectives inthat it can be used to generate a robust selectionof candidate EBSAs. To begin to identify networkswe would also have to consider the criteriaoutlined in Annex II of Decision IX/20; they canindicate how to structure networks of protectedareas across large ocean-basin scales.
The process was intentionally limited to using dataimmediately to hand, and using sample datarather than model data where possible. If, andwhen, new data become available it would bepossible to re-run the process and evaluate any
Identifying EBSAs on Seamounts 13
3. CONCLUSION
Anderson, O.F. 2006. A summary of biologicalinformation on the New Zealand fisheries fororange roughy (Hoplostethus atlanticus) for the2003–04 fishing year. New Zealand FisheriesAssessment Report No. 2006/16. 25 pp.
Behrenfeld, M.J. and Falkowski, P.G. 1997. Aconsumer's guide to phytoplankton primaryproductivity models. Limnology andOceanography 42:1479–1491.
CBD. 2009. Expert Workshop on Scientific andTechnical Guidance on the Use of BiogeographicClassification Systems and Identification of MarineAreas Beyond National Jurisdiction in Need ofProtection. Ottawa, Canada.
Clark, M.R. 2008. Descriptive analysis of orangeroughy fisheries in the region outside the EEZ:Lord Howe Rise, Northwest Challenger Plateau,West Norfolk Ridge, and Louisville Ridge to theend of the 2005–06 fishing year. FisheriesAssessment Report No. 2008/12. 45 pp.
Clark, M.R. and Tittensor, D.P. 2010. An index toassess the risk to stony corals from bottomtrawling on seamounts. Marine Ecology 31(S1):200–211. (doi:10.1111/j.1439–0485.2010.00392.x)
Davies, A.J. and Guinotte, J.M. 2011. Globalhabitat suitability for framework-forming cold-watercorals. PLoS One 6(4): e18483.(doi:10.1371/journal. pone.0018483)
FAO. 2009. International Guidelines for theManagement of Deep-Sea Fisheries in the HighSeas. Directives internationales sur la gestion dela pêche profonde en haute mer. DirectricesInternacionales para la Ordenacíon de lasPesquerías de Aguas Profundas en Alta Mar.Rome/Roma, FAO 2009. 73pp.
Halpern, B.S. et al. 2008. A Global Map ofHuman Impact on Marine Ecosystems. Science319(5865):948–952.
O’Hara, T., Rowden, A., Bax, N.J. 2011. ASouthern Hemisphere bathyal fauna is distributedin latitudinal bands. Current Biology21(3):226–230.
Rogers, A.D., Baco, A., Griffiths, H., Hart, T., Hall-Spencer, J.M. 2007. ‘Corals on seamounts’,pp. 141–69 in: Pitcher, T.J., Morato, T., Hart,P.J.B., Clark, M.R., Haggan, N. and Santos R.S.(eds), Seamounts: Ecology, Fisheries, andConservation, Vol. 12, p. 527. Oxford, UK:Blackwell.
Tittensor, D.P., Baco-Taylor, A.R., Brewin, P.,Clark, M.R., Consalvey, M., Hall-Spencer, J.,Rowden, A.A., Schlacher, T., Stocks, K., Rogers, A.D. 2009. Predicting global habitatsuitability for stony corals on seamounts. Journalof Biogeography 36:1111–1128.
UNESCO. 2009. Global Oceans and DeepSeabed – Biogeographic Classification. Paris.UNESCO-IOC; IOC Technical Series 84. 87 pp.
Webber, W.R. and Booth, J.D. 1995. A newspecies of Jasus (Crustacea: Decpoda:Palinuridae) from the eastern South Pacific Ocean.NZ Journal of Marine & Freshwater Research29:613–622.
Yesson, C., Clark, M.R., Taylor, M.L., Rogers,A.D. 2011. The global distribution of seamountsbased on 30-second bathymetry data. Deep SeaResearch Part I: Oceanographic ResearchPapers. (doi:10.1016/j.dsr.2011.02.004)
14 Identifying ESBAs on Seamounts
4. REFERENCES
About IUCN
IUCN, International Union for Conservation of Nature, helps the world find pragmatic
solutions to our most pressing environment and development challenges.
IUCN works on biodiversity, climate change, energy, human livelihoods and greening
the world economy by supporting scientific research, managing field projects all over
the world, and bringing governments, NGOs, the UN and companies together to
develop policy, laws and best practice.
IUCN is the world’s oldest and largest global environmental organization, with more
than 1,000 government and NGO members and almost 11,000 volunteer experts in
some 160 countries. IUCN’s work is supported by over 1,000 staff in 60 offices and
hundreds of partners in public, NGO and private sectors around the world.
www.iucn.org

INTERNATIONAL UNION FOR CONSERVATION OF NATURE
WORLD HEADQUARTERSRue Mauverney 281196 Gland, [email protected] +4122 999 0000Fax +41 22 999 0002www.iucn.org/waterwww.waterandnature.org