Research Priorities for the Conservation and Sustainable ...
Upload
truonglienCategory
view
216download
1
2011
IDENTIFYING CONSERVATION PRIORITIES IN THE FACE OF FUTURE DEVELOPMENT:APPLYING DEVELOPMENT BY DESIGN IN THE GRASSLANDS OF MONGOLIA

Identi fying Conservati on Prioriti es in the Face of Future Development:ii

Identi fying Conservati on Prioriti es in the Face of Future Development i
Identi fying Conservati on Prioriti es in the Face of Future Development:
Applying Development by Design in the Grasslands of Mongolia
Authors: Michael Heiner, Galbadrakh Davaa, Joseph Kiesecker, Bruce McKenney, Jeff rey Evans, Tuguldur Enkhtsetseg, Zumburelmaa Dash, Ulziisaikhan Vanchindorj, Oyungerel Baast, Sanjmyatav Dolgorjav, Gankhuyag Radnaabazar, Enkhbat Donchinbuu, Ochirhuyag Lhamjav, Sergelen Gongor, Evan Girvetz and Rob McDonald
Acknowledgements: This study is the product of input and advice from a large group of contributors from Non-governmental organizati ons, Universiti es, Nati onal government agencies and Aimag governments, including:
The Nature Conservancy (TNC)World Wildlife Fund (WWF)Wildlife Conservati on Society (WCS)
Bird Study Laboratory, Mongolian Academy of Sciences (MAS)Insti tute of Botany, Mongolian Academy of Sciences (MAS)Insti tute of Geoecology, Mongolian Academy of Sciences (MAS)Insti tute of Geography, Mongolian Academy of Sciences (MAS)Nati onal University of Mongolia (NUM)Pedagogical University of Mongolia
Ministry of Nature, Environment and Tourism (MNET)Ministry of Mining Resources and Energy (MMRE)Administrati on of Land Aff airs, Geodesy and Cartography (ALAGAC)Eastern Mongolian Protected Areas Administrati onEastern Mongolian Community Conservati on Associati on Sukhbaatar Aimag: Citi zens Representati ve Khural, The Governor’s Offi ce, Environmental
Protecti on Agency, Land Use Agency.Dornod Aimag: Citi zens Representati ve Khural, The Governor’s Offi ce, Environmental Protecti on
Agency, Land Use Agency, Khenti i Aimag: Citi zens Representati ve Khural, The Governor’s Offi ce, Environmental Protecti on
Agency, Land Use Agency.
The products of this assessment, including this report, GIS datasets and a web-based GIS applicati on, are available online at htt p://50.18.62.210/DevByDesign/.
April 2011
Identi fying Conservati on Prioriti es in the Face of Future Development:ii
Contents
FOREWORD .........................................................................................................................iii
List of Tables ........................................................................................................................iv
List of Figures.......................................................................................................................iv
SUMMARY ...........................................................................................................................1
1.0 INTRODUCTION ...........................................................................................................2
2.0 METHODS & RESULTS
2.1 Overview ..............................................................................................................9
2.2 Biodiversity Targets: Terrestrial Habitat Classifi cati on .........................................11
2.3 Representati on Goals ...........................................................................................21
2.4 Disturbance/Conditi on Index ...............................................................................22
2.5 Analysis framework ..............................................................................................22
2.6 Site Selecti on ........................................................................................................25
2.7 Measures of biological value ................................................................................26
2.8 Portf olio design ....................................................................................................28
3.0 DISCUSSION
3.1 Applicati ons to Conservati on and Miti gati on .......................................................32
3.2 Portf olio Improvement: An Adapti ve Process ......................................................34
4.0 CONCLUSION ...............................................................................................................35
REFERENCES ........................................................................................................................36
APPENDICES
Appendix 1: Ecological descripti ons of steppe ecosystem types ................................41
Appendix 2: Biodiversity targets, representati on goals and portf olio compositi on ....45
Appendix 3: Next steps in progress .............................................................................50
Appendix 4: Limitati ons of this study and recommendati ons for improvement ........51

Identi fying Conservati on Prioriti es in the Face of Future Development iii
FOREWORD
I am pleased to present the fi nal report of the Ecoregional Assessment of the Grasslands of Eastern Mongolia. The working group that completed this study was established by Order # 312 of the Minister of Nature, Environment and Tourism on October 28, 2009 to ensure coordinati on of stakeholders, exchange informati on and data, as well as oversee implementati on of Development by Design.
For thousands of years, Mongolian grasslands have provided habitat for many species of grassland animals and plants, and forage for livestock of Mongolian herders. In recent years, mineral and oil development, and the constructi on of associated infrastructure, have increased in the region. Pastoral livestock husbandry is recovering from the collapse during transiti on, and livestock numbers have increased dramati cally. While it is pleasant to note these positi ve growths in the economy, it is important to balance the rapid economic development with conservati on of wildlife habitat and pastoral rangelands. Human-induced impacts, in combinati on with climate change, are causing declines and exti ncti ons of fl ora and fauna, and may cause irreversible disrupti on of ecological functi ons and ecosystem services such as forage producti on, freshwater
supplies and soil ferti lity. This report contributes to meeti ng the abovementi oned challenges by building capacity in conservati on planning to expand the network of protected areas, miti gate impacts of mining development, and adapt to climate change.
The Mongolian Nati onal Security Concept urges increased protecti on of grasslands, and Mongolia made a commitment to increase protecti on of grasslands at COP-10. Important policy papers, including Mongolia’s Master Plan for Protected Areas and Mongolia Biodiversity Conservati on Acti on Plan, aim to designate 30% of country’s land as protected areas. Mongolia is progressing toward this goal with roughly 14% of the land area designated as protected areas. Recent studies indicate that protecti on of the Mongolian Daurian Forest Steppe and Grassland Ecoregions is lower than the nati onal average. In order to achieve the goal, it is important to identi fy priority conservati on sites with ecological and biological signifi cance based on sound science across the grassland ecoregions. I believe that this report will contribute to the expansion of the protected areas network and miti gate impacts of mineral development in the grasslands of Mongolia.
L.GansukhMinister of Nature, Environment and Tourism

Identi fying Conservati on Prioriti es in the Face of Future Development:iv
LIST OF TABLES
Table 1: Planning Team members Table 2: Ecosystem types: source data and mapping methodTable 3: Ecosystem types: distributi on by biogeoraphic zonesTable 4: Calculati on of the disturbance index: variables and source data
LIST OF FIGURES
Figure 1: Major Habitat Types and Terrestrial Ecoregions of Mongolia Figure 2: Study Area: Central and Eastern Grasslands of Mongolia Figure 3: Process for designing a portf olio of conservati on areas Figure 4: Selecti ng focal biodiversity targets: Spati al scales and Biodiversity targets Figure 5: Terrestrial Ecosystems Figure 6: Floodplains, riparian areas and other depressional wetlands Figure 7: Lakes & small water bodies Figure 8: Landform classifi cati on based on elevati on and topography Figure 9: Species / Area Curve: Relati onship between species numbers and habitat area Figure 10: Disturbance index Figure 11: Disturbance index summarized by hexagon PU Figure 12: Initi al portf olio of priority conservati on areas Figure 13: Rarity: PUs ranked according to the maximum rarity value of consti tuent ecosystem types Figure 14: Index of combined conservati on value: sum of opti macity + rarity Figure 15: Opti macity: relati ve contributi on to opti mal MARXAN site selecti on Figure 16: Initi al portf olio and existi ng mineral and petroleum leases Figure 17: Areas of potenti al confl ict with mineral and petroleum developmentFigure 18: Initi al portf olio re-designed to minimize confl ict with mineral and petroleum development Figure 19: Portf olio re-designed to minimize confl ict with mineral and petroleum development Figure 20: Portf olio and remaining areas of confl ict with mineral and petroleum development. Figure 21: Illustrati on of off set planning
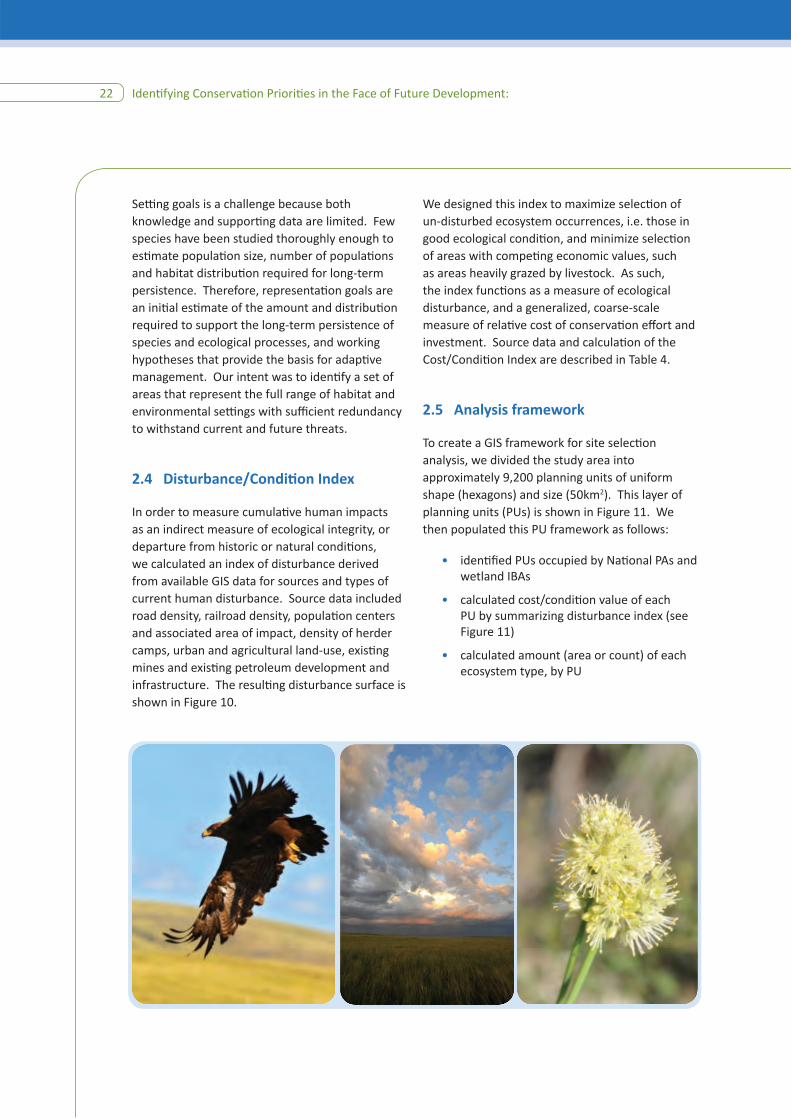
PHOTO CREDITSCover: Joseph Kiesecker; Page 22: J Joseph Kiesecker, Joseph Kiesecker, Michael Heiner; page 25: Michael Heiner, Joseph Kiesecker; page 34: Michael Heiner, David Kenny, Joseph Kiesecker; page 35: Chris Pague; page 40: Joseph Kiesecker; page 44: Joseph Kiesecker; page 53: Chris Pague, Joseph Kiesecker; page 54: Joseph Kiesecker; page 55: Joseph Kiesecker.

Identi fying Conservati on Prioriti es in the Face of Future Development 1
SUMMARY 1. The Central and Eastern Grasslands of Mongolia span an area of 458,000 km2 that is bounded by the Gobi Desert to the south, the Khyangan Mountains to the west, the Chinese border to the East and the Russian border to the North. Globally, the Temperate Grasslands biome is the most converted and least protected (Hoekstra 2005). The temperate grasslands in Mongolian are largely unconverted, support a full assemblage of nati ve wildlife and the pastoral livelihood of half of Mongolia’s populati on. However, the wildlife and indigenous livelihoods of this area are threatened by overgrazing and rapid growth in mining and oil development.
2. We identi fi ed a set of areas that could maintain the biodiversity and ecological processes representati ve of the region, given adequate protecti on and management as high quality core habitat within a larger landscape matrix that supports habitat use and movement. This set of priority conservati on areas is referred to as a portf olio. The methods that we used were developed to address the scope and scale of conservati on planning across the study area using available data. Focal biodiversity targets are defi ned by a mapped ecosystem classifi cati on that consists of three levels: biogeographic zones, ecosystems based on vegetati on, and landforms. We designed the portf olio to a) meet representati on goals for the amount and distributi on of each ecosystem type and b) opti mize for ecological conditi on based on a GIS index of disturbance and cumulati ve anthropogenic impacts. To ensure long-term viability of biodiversity, additi onal considerati on should be given to the maintenance of connecti vity between sites
3. The portf olio includes a) areas already designated within the Nati onal Protected Area system, b) a set of wetland complexes that have been designated as Important Bird Area and c) sites selected with the conservati on planning soft ware MARXAN to meet representati on goals for ecosystems and opti mize ecological conditi on. The portf olio covers 147,000 km2, or 32 % of the study area, and consists of 45 sites that range in size from 100 km2 to 18,000 km2. Nati onal Protected Areas are 29% of the portf olio area. To evaluate the signifi cance to conservati on of all planning units across the study area, we developed an index of the relati ve conservati on value of ecosystem occurrences that is based on rarity and relati ve contributi on to the MARXAN opti mizati on.
4. We identi fi ed areas of potenti al confl ict between the conservati on portf olio and areas leased for mining or petroleum development. Within these confl ict areas, the areas with relati ve conservati on value in the highest 30th percenti le were designated as areas to avoid development. The remaining confl ict areas were removed from the portf olio, and replaced with sites of similar compositi on and conditi on outside existi ng leases.
5. We also illustrate how the conservati on portf olio can be used to off set impacts associated with mining, oil and gas as well as other types of development. For development outside the portf olio, we demonstrate how to determine potenti al impacts of development projects and identi fy a portf olio of best off set opportuniti es.

Identi fying Conservati on Prioriti es in the Face of Future Development:2
1.0 INTRODUCTION
Purpose of this study
The purpose of this study is to support sustainable development for the Eastern Steppe grasslands by providing a sound basis for land-use planning that balances the needs of mineral and energy development, pastoral livelihoods, and wildlife habitat conservati on. We believe the study can inform decision-making in several ways:
• Support protected areas design and management
• Provide “early warning” of potenti al confl icts between development and conservati on goals
• Provide basis for applying the “miti gati on hierarchy” (i.e., impact avoidance versus off sets), supporti ng decision-making about appropriate impact miti gati on practi ces
• Inform off set design to maximize their conservati on values
The Mongolian Steppe is one of the last remaining intact temperate grasslands in the world. Globally, the Temperate Grasslands biome is the most converted and least protected (Hoekstra 2005). The temperate grasslands in Mongolia support a large assemblage of nati ve wildlife including Grey wolf, Red fox, Corsac fox, Pallas cat, Great bustard, Saker Falcon, Lesser Kestrel, Siberian marmot and over one million Mongolian gazelle (Olson 2008). Lakes, ponds, and wetlands provide stopovers and nesti ng sites for globally-endangered waterbirds including Swan goose, Relict gull, and several species of cranes (Nyambayar & Tsveenmyadag 2009). The Mongolian Steppe has a relati vely low populati on density with less than 0.5-1 person per square kilometer (Insti tute of Geography, 2009). For recorded history, the steppe has been grazed to support livelihoods of nomadic herders (Dashnyam 1974).
However, threats and pressures on grassland have increased dramati cally following the transiti on to a market economy in 1990. The number of livestock has nearly doubled over the last two decades reaching approximately 40 million animals
(Nati onal Stati sti cal Offi ce of Mongolia, 2008). This has lead to overgrazing, parti cularly in areas near rural populati on centers and water sources.
Mineral resources explorati on and exploitati on has also increased dramati cally. To date, surface rights for mineral and petroleum explorati on have been leased across approximately 27% of the country, with 47% available for lease (MMRE 2010). Expansion of the railroad is underway to connect the mineral rich southern dessert region to the Trans-Siberian railroad network. Development plans for the central and eastern grasslands parallel the nati onal trend; 25% of the grasslands study area has been leased for explorati on and 46% is available for lease (MMRE 2010).
The transiti on in Mongolia’s politi cal and economic landscape over the past two decades is forcing diffi cult decisions to balance rapid development of natural resources with conservati on of rare and remarkable natural landscapes. Mining and oil operati ons and related transportati on infrastructure have the potenti al to fragment the landscape and endanger wildlife. Large quanti ti es of water used in the mining and oil processes can disrupt the hydrology of this arid landscape, impacti ng pastoral livelihoods and wildlife habitat. Disturbing vegetati on cover leaves soil vulnerable to erosion and deserti fi cati on. However, most of the planned development has not yet begun. The window of opportunity for Mongolia to harness land use planning for sustainable development is now, to manage its vast natural wealth to achieve lasti ng benefi ts for people and nature.
Development by Design
In partnership with the Government of Mongolia, The Nature Conservancy is working to balance mineral and energy development with pastoral livelihoods and the conservati on of habitat through a science-based approach called “Development by Design” (Kiesecker et al. 2009, Kiesecker et al. 2010, McKenney and Kiesecker 2010, Kiesecker et al 2011). Development by Design (DbyD) blends landscape conservati on

Identi fying Conservati on Prioriti es in the Face of Future Development 3
planning with the miti gati on hierarchy – avoid, minimize, restore, or off set – to identi fy situati ons where development plans and conservati on outcomes may be in confl ict, and to identi fy which step of the miti gati on hierarchy is consistent with conservati on goals. For development impacts that are consistent with conservati on goals, DbyD seeks to maximize the return to conservati on provided by compensatory miti gati on, or biodiversity off sets. The four-step DbyD framework supports sound land use planning, helping decision-makers avoid and miti gate confl icts between development impacts and conservati on prioriti es, and supporti ng the use of compensati ng conservati on acti ons (off sets) to achieve bett er outcomes for people and nature.
DbyD is applied for two disti nct spati al scales. First, DbyD focuses at a landscape level (see Study Area below) to evaluate conservati on prioriti es, assess cumulati ve impacts in the region, identi fy potenti al confl icts between development and conservati on goals, and inform decision-making about where avoidance and minimizati on of impacts should be a priority considerati on (Steps 1 &2). Second, DbyD is applied at a project or site level (mining or energy site) to assess project impacts and their suitability for off sets, and where appropriate support design of an off sets strategy for miti gati ng these impacts (Steps 3 & 4).
Landscape Level:
1. Develop a landscape conservati on plan (or use an existi ng conservati on plan such as an Ecoregional Assessment)
2. Blend landscape planning with the miti gati on hierarchy to evaluate confl icts based on vulnerability and irreplaceability
Project Level:
3. Determine residual impacts associated with development and select opti mal off set portf olio.
4. Esti mate off set contributi on to conservati on goals
This study focuses on providing a landscape-level analysis, as this is essenti al for addressing the fi rst criti cal questi on concerning the applicati on of miti gati on: when should impacts from planned developments (mining, energy) be avoided altogether, minimized onsite, or off set? (Kiesecker et al. 2010, Thorne et al. 2006). Conservati on planning, in parti cular the ecoregional assessment (e.g. Groves 2003) carried out for this study, provides the structure to ensure miti gati on is consistent with conservati on goals, maintaining large and resilient ecosystems to support human communiti es and healthy wildlife habitat. Blending the miti gati on hierarchy with landscape planning off ers disti nct advantages over the traditi onal project-by-project approach because it: 1) considers the cumulati ve impacts of both current and projected development; 2) provides regional context to bett er guide which step of the miti gati on hierarchy should be applied (i.e. avoidance versus off sets); and 3) off ers increased fl exibility for choosing off sets that can maximize conservati on return by focusing eff orts towards the most threatened ecosystems or species.

Identi fying Conservati on Prioriti es in the Face of Future Development:4

Identi fying Conservati on Prioriti es in the Face of Future Development 5
Identi fying Conservati on Prioriti es in the Face of Future Development:6
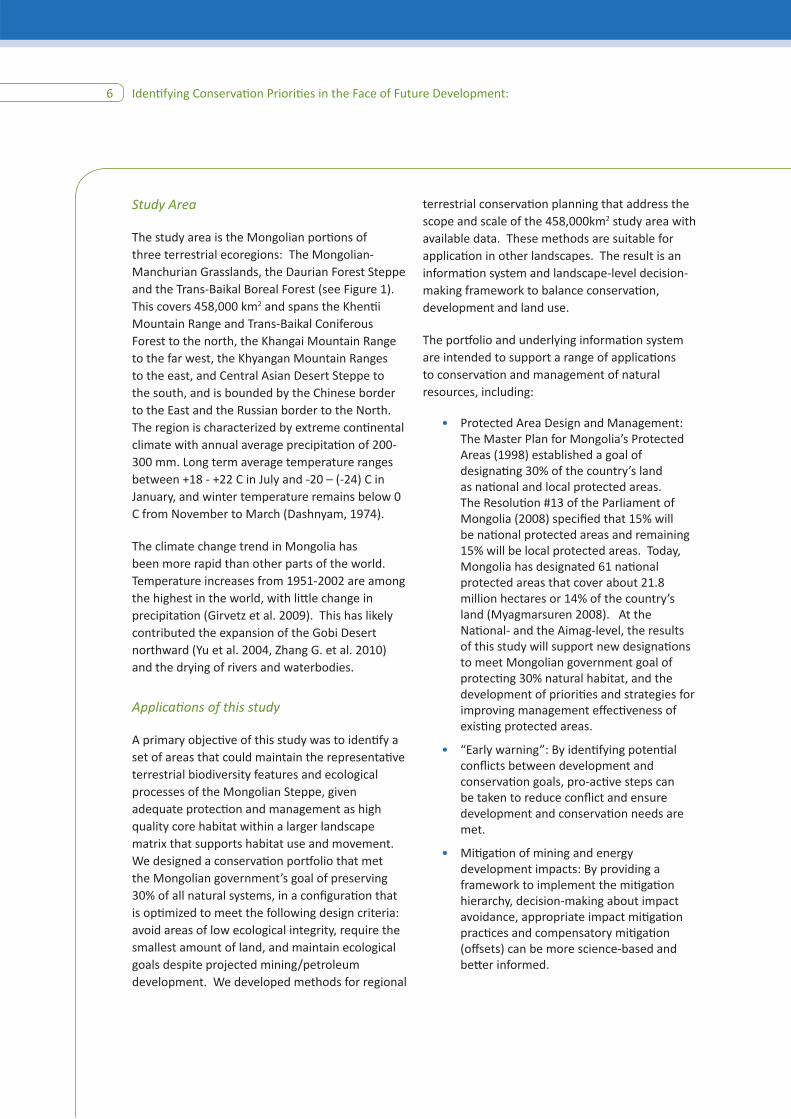
Study Area
The study area is the Mongolian porti ons of three terrestrial ecoregions: The Mongolian-Manchurian Grasslands, the Daurian Forest Steppe and the Trans-Baikal Boreal Forest (see Figure 1). This covers 458,000 km2 and spans the Khenti i Mountain Range and Trans-Baikal Coniferous Forest to the north, the Khangai Mountain Range to the far west, the Khyangan Mountain Ranges to the east, and Central Asian Desert Steppe to the south, and is bounded by the Chinese border to the East and the Russian border to the North. The region is characterized by extreme conti nental climate with annual average precipitati on of 200-300 mm. Long term average temperature ranges between +18 - +22 C in July and -20 – (-24) C in January, and winter temperature remains below 0 C from November to March (Dashnyam, 1974).
The climate change trend in Mongolia has been more rapid than other parts of the world. Temperature increases from 1951-2002 are among the highest in the world, with litt le change in precipitati on (Girvetz et al. 2009). This has likely contributed the expansion of the Gobi Desert northward (Yu et al. 2004, Zhang G. et al. 2010) and the drying of rivers and waterbodies.
Applicati ons of this study
A primary objecti ve of this study was to identi fy a set of areas that could maintain the representati ve terrestrial biodiversity features and ecological processes of the Mongolian Steppe, given adequate protecti on and management as high quality core habitat within a larger landscape matrix that supports habitat use and movement. We designed a conservati on portf olio that met the Mongolian government’s goal of preserving 30% of all natural systems, in a confi gurati on that is opti mized to meet the following design criteria: avoid areas of low ecological integrity, require the smallest amount of land, and maintain ecological goals despite projected mining/petroleum development. We developed methods for regional
terrestrial conservati on planning that address the scope and scale of the 458,000km2 study area with available data. These methods are suitable for applicati on in other landscapes. The result is an informati on system and landscape-level decision-making framework to balance conservati on, development and land use.
The portf olio and underlying informati on system are intended to support a range of applicati ons to conservati on and management of natural resources, including:
• Protected Area Design and Management: The Master Plan for Mongolia’s Protected Areas (1998) established a goal of designati ng 30% of the country’s land as nati onal and local protected areas. The Resoluti on #13 of the Parliament of Mongolia (2008) specifi ed that 15% will be nati onal protected areas and remaining 15% will be local protected areas. Today, Mongolia has designated 61 nati onal protected areas that cover about 21.8 million hectares or 14% of the country’s land (Myagmarsuren 2008). At the Nati onal- and the Aimag-level, the results of this study will support new designati ons to meet Mongolian government goal of protecti ng 30% natural habitat, and the development of prioriti es and strategies for improving management eff ecti veness of existi ng protected areas.
• “Early warning”: By identi fying potenti al confl icts between development and conservati on goals, pro-acti ve steps can be taken to reduce confl ict and ensure development and conservati on needs are met.
• Miti gati on of mining and energy development impacts: By providing a framework to implement the miti gati on hierarchy, decision-making about impact avoidance, appropriate impact miti gati on practi ces and compensatory miti gati on (off sets) can be more science-based and bett er informed.

Identi fying Conservati on Prioriti es in the Face of Future Development 7
• Off set design: An understanding of conservati on values in the context of existi ng and potenti al cumulati ve impacts provides the necessary foundati on for designing off sets that can contribute eff ecti vely to landscape conservati on goals in the face of development.
Conservati on Planning
Systemati c conservati on planning is a methodical and comprehensive process for identi fying a set of places or areas that, together, represent the majority of species, natural communiti es, and ecological systems found within a planning area. Landscape-level planning and acti on is rapidly emerging as a necessary strategy for achieving conservati on results (Olson et al. 2001). A conservati on portf olio of priority sites, the end product of conservati on planning, is a set of areas selected to represent the full distributi on and diversity of these systems (e.g. Noss et al. 2002). Oft en systemati c conservati on plans uti lize an opti mizati on approach automated with spati al analysis tools such as Marxan (Ball and Possingham 2000), where the design of the portf olio is meant to meet the minimum viability needs of each biological target in a confi gurati on that minimizes the amount of area selected (Pressey et al. 1997, Ball 2000, Ball and Possingham 2000).
This approach is based on ecoregional assessment practi ces and standards described by Groves et al. (2002), Groves (2003) and Higgins & Esselman (2006). The basic components of these approaches are: (1) defi ne and map a suite of biodiversity targets including species, ecosystems or other features that collecti vely represent the biological diversity of the study area; (2) set quanti tati ve goals for the esti mated abundance
and distributi on of biodiversity targets necessary to maintain ecological and evoluti onary potenti al over ti me; (3) evaluate the relati ve viability and ecological integrity of, and threats to, occurrences (populati ons and examples of communiti es and ecosystems) of the suite of biodiversity targets; (4) use this informati on to identi fy the occurrences of biodiversity targets that collecti vely meet representati on goals and are the most likely to persist, i.e. are viable, with highest relati ve ecological integrity and minimal risk from future threats. A diagram illustrati ng this process is shown in Figure 3.
Previous regional conservati on plans and priority-setti ng eff orts
Mongolia established one of the world’s earliest known nature reserves, Bogd Khan, in 1778. In 1996, the Mongolian Ministry of Nature and Environment published the Biodiversity Conservati on Acti on Plan for Mongolia. (MNE 1997). This report recommended designati on of eight strictly protected areas, 40 nati onal parks and 37 heritage areas. As of 2008, approximately 40% of the recommended areas have been designated as Nati onal Protected Areas (WWF 2010). The Master Plan for Mongolia’s Protected Areas (1998) established a goal of designati ng 30% of the country’s land as nati onal and local protected areas. The Resoluti on #13 of the Parliament of Mongolia specifi ed that 15% will be nati onal protected areas and remaining 15% will be local protected areas.
Today, Mongolia has designated 61 nati onal protected areas covering about 21.8 million hectares or 14% of the country’s land (Myagmarsuren 2008). Mongolia also contains six Biosphere Reserves

Identi fying Conservati on Prioriti es in the Face of Future Development:8
(UNESCO 2011a), two World Heritage Sites (UNESCO 2011b) and 11 Ramsar sites (Ramsar 2011). Bird Life Internati onal has identi fi ed 70 Important Bird Areas in Mongolia (Nyambayar & Tsveenmyadag 2009).
Within the study area, the Nati onal Protected Areas cover 42,000 km2 (9%) of the study area.
These 24 PAs include include three Biosphere Reserves (UNESCO 2011a), two World Heritage Sites (UNESCO 2011b), and fi ve Ramsar Sites (see Figure 2). The study area contains 21 Important Bird Areas, eight of which are Nati onal Protected Areas. These sites are the foundati on, or starti ng point on which the conservati on portf olio was built.

Identi fying Conservati on Prioriti es in the Face of Future Development 9
2.0 METHODS & RESULTS
2.1 Overview
Our objecti ve was to identi fy a portf olio of sites that support the nati ve biodiversity and ecological processes representati ve of the Mongolian Steppe. To defi ne biodiversity targets, we developed a terrestrial ecosystem classifi cati on that maps 216 ecosystem types. We designed the portf olio to meet the following criteria:
Representati on: meet goals for a specifi ed number or amount of each biodiversity target needed to maintain their ecological and evoluti onary potenti al over ti me. We defi ned biodiversity targets with the terrestrial ecosystem classifi cati on and set representati on goals as a fracti on of the geographic distributi on of each ecosystem type across the study area.
Ecological Conditi on: within limits of knowledge and available data, ensure that the selected areas contain biodiversity targets that have the highest relati ve viability or ecological integrity, as measured by an index of disturbance from human impacts.
Effi ciency: The portf olio contains the least area and number of sites that meet biodiversity goals.
Connecti vity: where there is a choice, select adjacent planning units in conti guous groups, following the general principle that a portf olio consisti ng of fewer, larger conti guous sites is preferable to one consisti ng of many, smaller sites. This does not consider landscape connecti vity beyond adjacent fi rst-order neighbors. Evaluati ng the functi onal landscape connecti vity of the portf olio, to support movement across the study area, is a criti cal next step.
We designed the portf olio through several steps or components:
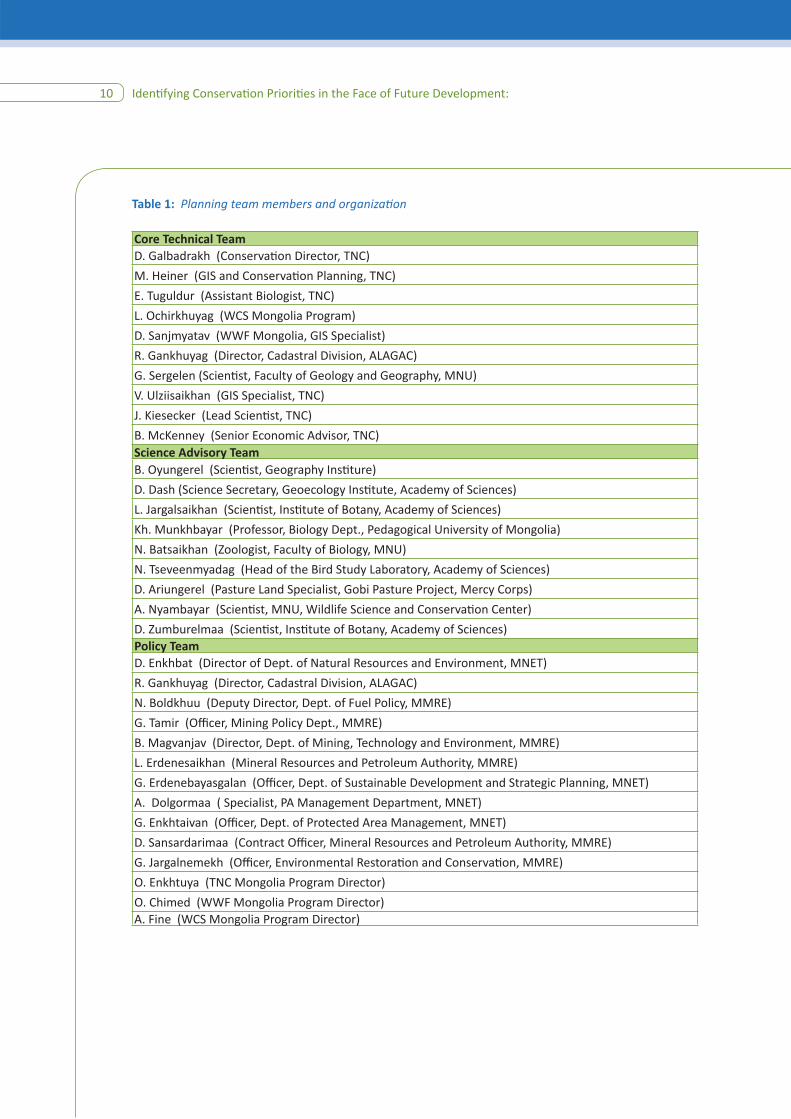
1. Assemble the working group. We convened a group of experts and stakeholders to advise and review the planning process. The working group was organized as follows; members and affi liati ons are listed in Table 1.
a. Core technical team: technical and science staff responsible for analysis and reporti ng.
b. Science Advisory team: biologists and geographers with expert knowledge of the study area and available data; responsible for advising data development and reviewing results.
c. Policy team: Senior managers with knowledge and experti se regarding implementati on strategy.
The Science Advisory team reviewed the data development and analysis at several intervals during the course of the study, which included three team meeti ngs and many informal interviews. We held two government workshops, in April and August of 2010, to review results and discuss implementati on strategies. These workshops were att ended by the full working group and other representati ves from Nati onal and Aimag government and NGOs.
2. Nati onal Protected Areas. We delineated the boundaries of all Nati onal-level protected areas within the study area including strictly-protected areas, nati onal parks, nati onal monuments and nature reserves, and excluding buff er zones. These areas served as the foundati on, or starti ng point, for portf olio design.
Identi fying Conservati on Prioriti es in the Face of Future Development:10
Table 1: Planning team members and organizati on
Core Technical TeamD. Galbadrakh (Conservati on Director, TNC)
M. Heiner (GIS and Conservati on Planning, TNC)
E. Tuguldur (Assistant Biologist, TNC)
L. Ochirkhuyag (WCS Mongolia Program)
D. Sanjmyatav (WWF Mongolia, GIS Specialist)
R. Gankhuyag (Director, Cadastral Division, ALAGAC)
G. Sergelen (Scienti st, Faculty of Geology and Geography, MNU)
V. Ulziisaikhan (GIS Specialist, TNC)
J. Kiesecker (Lead Scienti st, TNC)
B. McKenney (Senior Economic Advisor, TNC)Science Advisory TeamB. Oyungerel (Scienti st, Geography Insti ture)
D. Dash (Science Secretary, Geoecology Insti tute, Academy of Sciences)
L. Jargalsaikhan (Scienti st, Insti tute of Botany, Academy of Sciences)
Kh. Munkhbayar (Professor, Biology Dept., Pedagogical University of Mongolia)
N. Batsaikhan (Zoologist, Faculty of Biology, MNU)
N. Tseveenmyadag (Head of the Bird Study Laboratory, Academy of Sciences)
D. Ariungerel (Pasture Land Specialist, Gobi Pasture Project, Mercy Corps)
A. Nyambayar (Scienti st, MNU, Wildlife Science and Conservati on Center)
D. Zumburelmaa (Scienti st, Insti tute of Botany, Academy of Sciences)Policy TeamD. Enkhbat (Director of Dept. of Natural Resources and Environment, MNET)
R. Gankhuyag (Director, Cadastral Division, ALAGAC)
N. Boldkhuu (Deputy Director, Dept. of Fuel Policy, MMRE)
G. Tamir (Offi cer, Mining Policy Dept., MMRE)
B. Magvanjav (Director, Dept. of Mining, Technology and Environment, MMRE)
L. Erdenesaikhan (Mineral Resources and Petroleum Authority, MMRE)
G. Erdenebayasgalan (Offi cer, Dept. of Sustainable Development and Strategic Planning, MNET)
A. Dolgormaa ( Specialist, PA Management Department, MNET)
G. Enkhtaivan (Offi cer, Dept. of Protected Area Management, MNET)
D. Sansardarimaa (Contract Offi cer, Mineral Resources and Petroleum Authority, MMRE)
G. Jargalnemekh (Offi cer, Environmental Restorati on and Conservati on, MMRE)
O. Enkhtuya (TNC Mongolia Program Director)
O. Chimed (WWF Mongolia Program Director)A. Fine (WCS Mongolia Program Director)
Identi fying Conservati on Prioriti es in the Face of Future Development 11
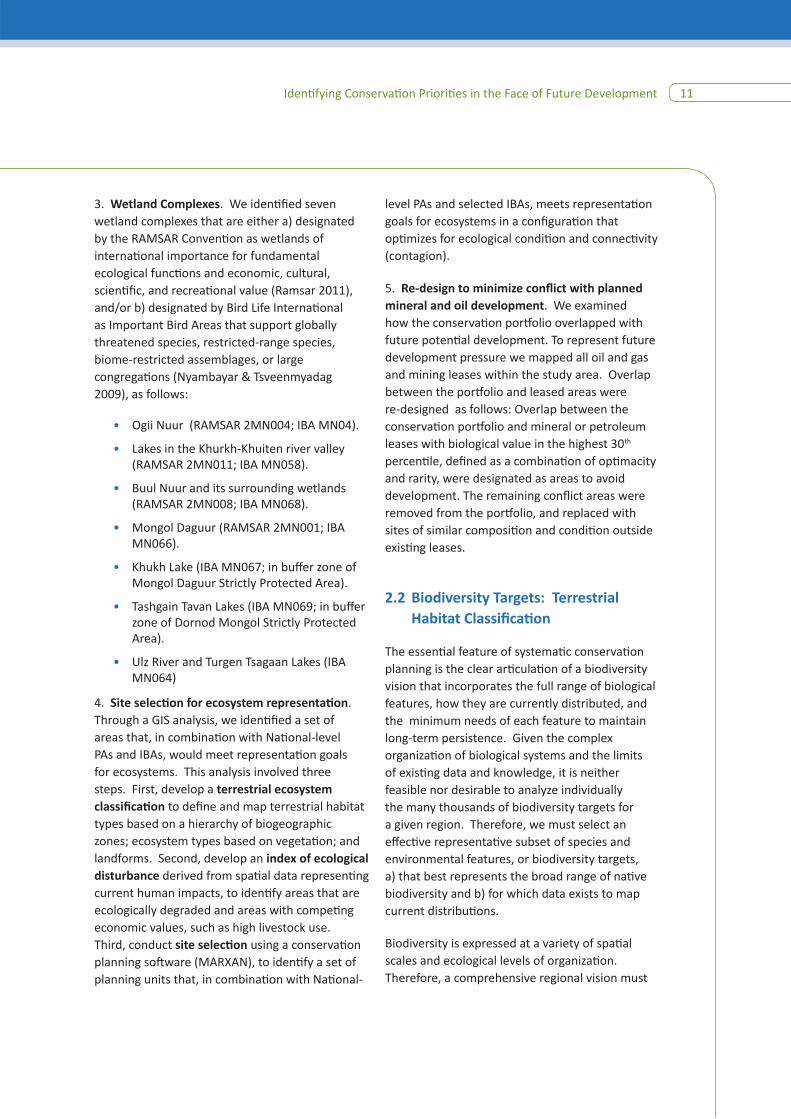
3. Wetland Complexes. We identi fi ed seven wetland complexes that are either a) designated by the RAMSAR Conventi on as wetlands of internati onal importance for fundamental ecological functi ons and economic, cultural, scienti fi c, and recreati onal value (Ramsar 2011), and/or b) designated by Bird Life Internati onal as Important Bird Areas that support globally threatened species, restricted-range species, biome-restricted assemblages, or large congregati ons (Nyambayar & Tsveenmyadag 2009), as follows:
• Ogii Nuur (RAMSAR 2MN004; IBA MN04).
• Lakes in the Khurkh-Khuiten river valley (RAMSAR 2MN011; IBA MN058).
• Buul Nuur and its surrounding wetlands (RAMSAR 2MN008; IBA MN068).
• Mongol Daguur (RAMSAR 2MN001; IBA MN066).
• Khukh Lake (IBA MN067; in buff er zone of Mongol Daguur Strictly Protected Area).
• Tashgain Tavan Lakes (IBA MN069; in buff er zone of Dornod Mongol Strictly Protected Area).
• Ulz River and Turgen Tsagaan Lakes (IBA MN064)
4. Site selecti on for ecosystem representati on. Through a GIS analysis, we identi fi ed a set of areas that, in combinati on with Nati onal-level PAs and IBAs, would meet representati on goals for ecosystems. This analysis involved three steps. First, develop a terrestrial ecosystem classifi cati on to defi ne and map terrestrial habitat types based on a hierarchy of biogeographic zones; ecosystem types based on vegetati on; and landforms. Second, develop an index of ecological disturbance derived from spati al data representi ng current human impacts, to identi fy areas that are ecologically degraded and areas with competi ng economic values, such as high livestock use. Third, conduct site selecti on using a conservati on planning soft ware (MARXAN), to identi fy a set of planning units that, in combinati on with Nati onal-
level PAs and selected IBAs, meets representati on goals for ecosystems in a confi gurati on that opti mizes for ecological conditi on and connecti vity (contagion).
5. Re-design to minimize confl ict with planned mineral and oil development. We examined how the conservati on portf olio overlapped with future potenti al development. To represent future development pressure we mapped all oil and gas and mining leases within the study area. Overlap between the portf olio and leased areas were re-designed as follows: Overlap between the conservati on portf olio and mineral or petroleum leases with biological value in the highest 30th percenti le, defi ned as a combinati on of opti macity and rarity, were designated as areas to avoid development. The remaining confl ict areas were removed from the portf olio, and replaced with sites of similar compositi on and conditi on outside existi ng leases.
2.2 Biodiversity Targets: Terrestrial Habitat Classifi cati on
The essenti al feature of systemati c conservati on planning is the clear arti culati on of a biodiversity vision that incorporates the full range of biological features, how they are currently distributed, and the minimum needs of each feature to maintain long-term persistence. Given the complex organizati on of biological systems and the limits of existi ng data and knowledge, it is neither feasible nor desirable to analyze individually the many thousands of biodiversity targets for a given region. Therefore, we must select an eff ecti ve representati ve subset of species and environmental features, or biodiversity targets, a) that best represents the broad range of nati ve biodiversity and b) for which data exists to map current distributi ons.
Biodiversity is expressed at a variety of spati al scales and ecological levels of organizati on. Therefore, a comprehensive regional vision must

Identi fying Conservati on Prioriti es in the Face of Future Development:12
consider spati al scales and levels of organizati on from species to ecosystems (Noss 1996, Margules and Pressey 2003, Groves 2003). Biodiversity targets can be organized by spati al scale in a
framework created by Poiani et al (2000) that defi nes local, intermediate, coarse and regional scales (Figure 4).
Regional conservati on plans oft en apply a ‘coarse fi lter / fi ne fi lter approach’ to defi ne biodiversity targets. This includes treatment of all ecosystem types (the coarse-fi lter) and a sub-set of natural communiti es and species which will not be well represented by ecosystems alone (the fi ne fi lter), such as those that are rare, with highly specifi c habitat requirements, or are migratory over long distances (Groves et al 2002; Groves 2003). The coarse-fi lter premise is that conserving representati ve ecosystems conserves many common species and communiti es, species that are unknown or poorly sampled, and the environments in which they evolve (Jenkins et al 1976, Hunter 1991). A sole focus on species is not adequate because species sampling data does not represent the environmental matrix and broad-scale processes necessary to maintain habitat.
This coarse fi lter/fi ne fi lter approach has ecological advantages in that it considers multi ple scales
of organizati on, environmental patt erns and processes that infl uence habitat structure and functi on. Choosing targets that represent the range of environmental gradients and setti ngs is a way to address the dynamic nature of ecosystems and the uncertain impacts of climate change (Hunter 1988, Halpin 1998, Groves 2003, Beier & Brost 2010, Anderson & Ferree 2010).
This approach also has practi cal advantages in that it makes best use of available data to represent the full range of representati ve biodiversity with a practi cal number of targets. Our knowledge regarding species ranges and habitat needs will always be incomplete. As coarse fi lter targets, ecosystems can oft en be mapped with available GIS data. This alone provides a basis for conservati on planning and fi lls a signifi cant informati on gap. Fine-fi lter species and natural community data are typically more limited and dependent on survey eff ort, and therefore vary
Identi fying Conservati on Prioriti es in the Face of Future Development 13
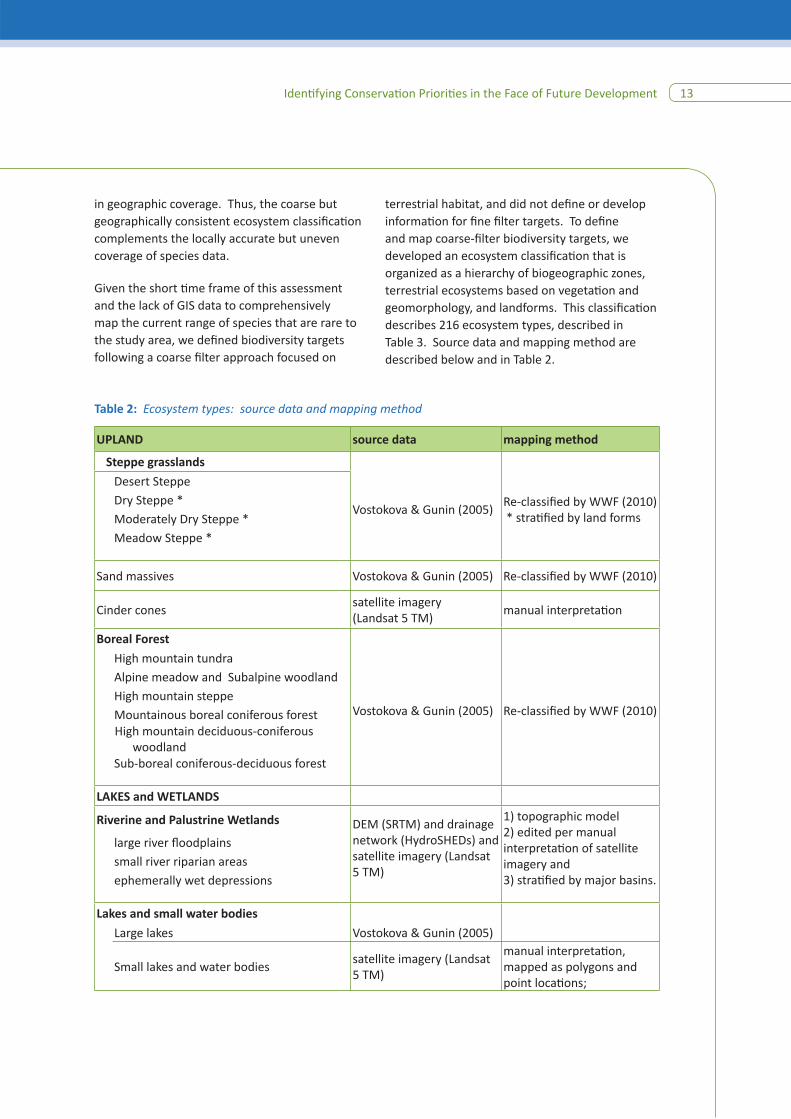
in geographic coverage. Thus, the coarse but geographically consistent ecosystem classifi cati on complements the locally accurate but uneven coverage of species data.
Given the short ti me frame of this assessment and the lack of GIS data to comprehensively map the current range of species that are rare to the study area, we defi ned biodiversity targets following a coarse fi lter approach focused on
terrestrial habitat, and did not defi ne or develop informati on for fi ne fi lter targets. To defi ne and map coarse-fi lter biodiversity targets, we developed an ecosystem classifi cati on that is organized as a hierarchy of biogeographic zones, terrestrial ecosystems based on vegetati on and geomorphology, and landforms. This classifi cati on describes 216 ecosystem types, described in Table 3. Source data and mapping method are described below and in Table 2.
Table 2: Ecosystem types: source data and mapping method
UPLAND source data mapping method
Steppe grasslands
Desert Steppe
Vostokova & Gunin (2005) Re-classifi ed by WWF (2010) * strati fi ed by land forms
Dry Steppe *Moderately Dry Steppe *Meadow Steppe *
Sand massives Vostokova & Gunin (2005) Re-classifi ed by WWF (2010)
Cinder conessatellite imagery (Landsat 5 TM)
manual interpretati on
Boreal Forest
High mountain tundra
Vostokova & Gunin (2005) Re-classifi ed by WWF (2010)
Alpine meadow and Subalpine woodlandHigh mountain steppeMountainous boreal coniferous forestHigh mountain deciduous-coniferous
woodlandSub-boreal coniferous-deciduous forest
LAKES and WETLANDS
Riverine and Palustrine Wetlands DEM (SRTM) and drainage network (HydroSHEDs) and satellite imagery (Landsat 5 TM)
1) topographic model 2) edited per manual interpretati on of satellite imagery and 3) strati fi ed by major basins.
large river fl oodplainssmall river riparian areasephemerally wet depressions
Lakes and small water bodies
Large lakes Vostokova & Gunin (2005)
Small lakes and water bodiessatellite imagery (Landsat 5 TM)
manual interpretati on, mapped as polygons and point locati ons;

Identi fying Conservati on Prioriti es in the Face of Future Development:14
Tabl
e 3:
Eco
syst
em ty
pes:
dis
trib
uti o
n by
bio
geor
aphi
c zo
ne (
page
1 o
f 2)
Biog
eogr
aphi
c Zo
nes
Terr
estr
ial E
core
gion
s 2
Mon
golia
n-M
anch
uria
n G
rass
land
Dau
rian
For
est S
tepp
eTr
ans-
Baik
al
Bore
al F
ores
t
Ecol
ogic
al z
ones
1O
rkho
nM
anda
l-G
obi
Pre-
Kh
inga
nM
enen
giin
Ta
lM
iddl
e Kh
erle
nTo
la-
Ono
nD
hark
han
Uld
zin
UPLAND
Tota
l
mat
rix-
form
ing
step
pe
Des
ert S
tepp
e9,
651
km2
7,36
02,
290
Dry
Ste
ppe
*12
9,50
5km
230
,430
1,99
846
,343
48,6
722,
063
Mod
erat
ely
Dry
Ste
ppe
*11
2,37
8km
28,
223
22,8
603,
499
30,4
1719
,836
3,77
213
,679
10,0
90M
eado
w S
tepp
e89
,359
km2
12,9
5410
,955
6,63
94,
510
2,54
520
,077
8,22
119
,516
3,94
2
Sand
mas
sive
s3,
246
km2
288
1,71
010
098
516
3Ci
nder
con
es13
5km
2--
----
----
----
----
Bore
al F
ores
t
Hig
h m
ount
ain
tund
ra1,
076
km2
----
----
----
----
--A
lpin
e m
eado
w a
nd S
ubal
pine
w
oodl
and
2,89
1km
2--
----
----
----
----
Hig
h m
ount
ain
step
pe45
8km
2--
----
----
----
----
Mou
ntai
niou
s bo
real
co
nife
rous
fore
st15
,759
km2
----
----
----
----
--
Hig
h m
ount
ain
deci
duou
s-co
nife
rous
woo
dlan
d38
0km
2--
----
----
----
----
Sub-
bore
al c
onife
rous
-de
cidu
ous
fore
st25
,521
km2
333
847
8,49
64,
441
563
10,8
42
* s
trati
fi ed
by
land
form
s 1
Voro
stok
ova
& G
unin
(20
05)
2 O
lson
et a
l. (2
001)

Identi fying Conservati on Prioriti es in the Face of Future Development 15Ta
ble
3: E
cosy
stem
type
s: d
istr
ibuti
on
by b
ioge
orap
hic
zone
(co
nti n
ued
from
pre
viou
s pa
ge)
LAKE
S an
d WETLA
NDS
Tota
l
Rive
rine
and
Pal
ustr
ine
Wet
land
sSe
linge
Ono
n Kh
erle
n U
ldz
Khal
khG
al
Tuul
Mat
ad
east
endo
rhei
c
larg
e ri
ver fl o
odpl
ains
10,0
21km
24,
019
1,38
43,
014
721
792
smal
l riv
er r
ipar
ian
area
s10
,267
km2
2,20
091
92,
775
1,51
81,
878
977
ephe
mer
ally
wet
dep
ress
ions
6,56
6km
22,
866
3,70
1
Lake
s an
d sm
all w
ater
bodi
esSe
linge
Ono
nKh
erle
nU
ldz
Buul
N
uur
Gal
Tu
ulM
atad
ea
stKh
alkh
aM
iddl
e Kk
alkh
aM
atad
no
rth
NE
Dor
nod
Lake
s1,
579
km2
4910
7310
769
118
655
5656
3626
0
smal
l wat
er b
odie
s **
1,29
196
4116
911
270
8168
268
146
9914
1
** u
nits
= c
ount
Identi fying Conservati on Prioriti es in the Face of Future Development:16
Tier I: Biogeographic Zones
Biogeographic Zones represent broad, regional patt erns of climate, physiography and related variati on in species and geneti cs. For widespread ecosystem types such as Dry Steppe, strati fi cati on by biogeographic zone captures regional diff erences in species compositi on and environmental patt erns, and ensures that site selecti on will include multi ple occurrences that are geographically distributed across the study area. This geographic redundancy provides some insurance against local exti ncti ons caused by disturbance events such as climate extremes, disease and/or invasive species.
For upland ecosystem types, we delineated biogeographic zones based on the combinati on of ecological zones mapped by Vostokova and Gunin (2005) and WWF terrestrial ecoregions (Olson et al. 2001), as shown in Figure 5. For Lakes and wetlands, we defi ned biogeographic zones according to the boundaries of major river basins, derived from HydroSHEDs (Lehner, Verdin & Jarvis, 2006) as shown in Figures 6 and 7.
Tier II: Terrestrial Ecosystems
Ecosystems are generally defi ned as a bioti c component (vegetati on) and abioti c component (physical environmental features and processes). Table 2 lists each ecosystem type, source data and mapping method. Ecological defi niti ons of the ecosystems types are listed in Appendix 1. Table 3 lists the distributi on of each ecosystem type by biogeographic zone, and Figure 5 is a map of ecosystem types and biogeographic zones.
For upland ecosystems, our primary data source was a map developed by Vostokova and Gunin (2005). This map was was re-classifi ed by WWF to produce a nati onal mapped ecosystem classifi cati on (WWF 2010). This was also the source for mapping large lakes.
To map fl oodplains and riparian wetlands, we used a GIS topographic model that delineates potenti al riverine wetlands based on topography of the stream channel, as derived from a digital elevati on model (Lehner, Verdin & Jarvis, 2006) at 3-second (77m) resoluti on. We edited the model results based on manual interpretati on of the satellite imagery described previously, and classifi ed the resulti ng features as large river fl oodplains and riparian areas associated with smaller tributaries and ephemeral streams. We further classifi ed the fl oodplains and wet riparian areas according to major river basin. In endorheic basins, we classifi ed the wet lowland features as ephemerally wet valley bott oms, which typically form salty depressions, and divided these into two bio-geographic zones, as shown in Figure 6 and described in Table 3.
To map small lakes and waterbodies, we digiti zed the boundaries and point locati ons of water bodies through manual interpretati on of satellite imagery. We compiled 34 Landsat TM5 satellite scenes to cover the study area (NASA 2009). The date of acquisiti on for 31 of the scenes was between June 30 to September 28, 2009. For 3 scenes, the best available image was acquired in September 2007. Pre-processing included an atmospheric correcti on algorithm and tasseled cap transformati on (ERDAS 1999). The tasseled cap transformati on produces a 3-band image that improves the contrast between bare ground, water, and vegetati on. The resulti ng image is very useful for classifi cati on and manual interpretati on of landscape features. Using the transformed images, we digiti zed waterbodies on-screen at 1:250,000. Through this process, we added 210 polygon lake features for waterbodies larger than 0.3 km2 and 1,565 point features for small water bodies smaller than 0.3 km2. Finally, we classifi ed lakes and water bodies by river basin or biogeographic zone, as shown in Figure 7.

Identi fying Conservati on Prioriti es in the Face of Future Development 17

Identi fying Conservati on Prioriti es in the Face of Future Development:18

Identi fying Conservati on Prioriti es in the Face of Future Development 19

Identi fying Conservati on Prioriti es in the Face of Future Development:20

Identi fying Conservati on Prioriti es in the Face of Future Development 21
Tier III: Landforms:
Three steppe ecosystem types - Dry Steppe, Moderately Dry Steppe and Meadow Steppe – occupy almost 80% of the study area, but are a heterogeneous, patchy matrix of plant communiti es formed by topography, disturbance regimes and successional cycles. Patt erns of plant species compositi on within these matrix-forming ecosystems generally follow topographic environmental gradients. To capture this ecological, environmental and geneti c diversity, we strati fi ed these widespread steppe ecosystem types by landforms. We defi ned and mapped landforms according to a cluster analysis of elevati on, insolati on (Rich et al. 1995) and a topographic index (Moore et al. 1991), as shown in Figure 8.
2.3 Representati on Goals
Choosing a preliminary set of quanti tati ve representati on goals is an elementary step in any portf olio design, and necessary for opti mized
site selecti on. Quanti tati ve goals provide transparent, fl exible measures of representati on and progress that are essenti al to the iterati ve, adapti ve process of portf olio design, review, data collecti on, analysis and revision (Carwardine et al., 2009). The representati on goals that we chose for ecosystems are based on the goal set by the Mongolia government to protect 30% of natural habitat (Master Plan for Mongolia’s Protected Areas, 1998).
Many regional conservati on plans have also set coarse fi lter goals as 30% of historic areal extent, based loosely on the species-area relati onships derived from studies of island biogeography and “habitat islands” (MacArthur & Wilson, 1967; Dobson, 1996; Groves 2003). Loss of habitat tends, over ti me, to result in the loss of species within an approximate range. The species/area relati onship depicted in Figure 9, adapted from Dobson (1996), suggests that coarse fi lter representati on within the range of 10%-30% of historic extent of each ecosystem type would retain approximately 55%-85% of nati ve species.
Identi fying Conservati on Prioriti es in the Face of Future Development:22
Setti ng goals is a challenge because both knowledge and supporti ng data are limited. Few species have been studied thoroughly enough to esti mate populati on size, number of populati ons and habitat distributi on required for long-term persistence. Therefore, representati on goals are an initi al esti mate of the amount and distributi on required to support the long-term persistence of species and ecological processes, and working hypotheses that provide the basis for adapti ve management. Our intent was to identi fy a set of areas that represent the full range of habitat and environmental setti ngs with suffi cient redundancy to withstand current and future threats.
2.4 Disturbance/Conditi on Index
In order to measure cumulati ve human impacts as an indirect measure of ecological integrity, or departure from historic or natural conditi ons, we calculated an index of disturbance derived from available GIS data for sources and types of current human disturbance. Source data included road density, railroad density, populati on centers and associated area of impact, density of herder camps, urban and agricultural land-use, existi ng mines and existi ng petroleum development and infrastructure. The resulti ng disturbance surface is shown in Figure 10.
We designed this index to maximize selecti on of un-disturbed ecosystem occurrences, i.e. those in good ecological conditi on, and minimize selecti on of areas with competi ng economic values, such as areas heavily grazed by livestock. As such, the index functi ons as a measure of ecological disturbance, and a generalized, coarse-scale measure of relati ve cost of conservati on eff ort and investment. Source data and calculati on of the Cost/Conditi on Index are described in Table 4.
2.5 Analysis framework
To create a GIS framework for site selecti on analysis, we divided the study area into approximately 9,200 planning units of uniform shape (hexagons) and size (50km2). This layer of planning units (PUs) is shown in Figure 11. We then populated this PU framework as follows:
• identi fi ed PUs occupied by Nati onal PAs and wetland IBAs
• calculated cost/conditi on value of each PU by summarizing disturbance index (see Figure 11)
• calculated amount (area or count) of each ecosystem type, by PU

Identi fying Conservati on Prioriti es in the Face of Future Development 23Ta
ble
4: C
alcu
lati o
n of
the
dist
urba
nce
inde
x: v
aria
bles
and
sou
rce
data
Dis
turb
ance
cat
egor
yCa
lcul
ati o
n of
dis
turb
ance
inde
xSO
URC
E DATA
: Ori
gin
and D
ate
M
ap fe
atur
es
tran
spor
tati
on c
orri
dors
nati o
nal r
oads
road
den
sity
: mov
ing
win
dow
, 1 k
m ra
dius
digi
tzed
from
topo
grap
hic
map
s (1
:1 m
illio
n)20
01
M
atad
Sou
m p
etro
luem
de
velo
pmen
tro
ad d
ensi
ty: m
ovin
g w
indo
w, 1
km
radi
usdi
gitz
ed fr
om s
atel
lite
imag
ery
(Lan
dsat
5 T
M)
at 1
:250
,000
sca
leJu
ly 2
009
ra
ilway
sra
ilway
den
sity
: mov
ing
win
dow
, 1 k
m ra
dius
digi
tzed
from
topo
grap
hic
map
s (1
:1 m
illio
n)20
01
popu
lati
on c
ente
rs a
nd a
rea
of im
pact
U
laan
baat
ar +
20
km b
uff e
rar
ea w
ithin
mov
ing
win
dow
, 1 k
m ra
dius
urba
n fo
otpr
int d
igitz
ed fr
om s
atel
lite
imag
ery
(Lan
dsat
5 T
M) a
t 1:2
50,0
00 s
cale
1989
- 19
99
A
imag
s +
10 k
m b
uff e
rar
ea w
ithin
mov
ing
win
dow
, 1 k
m ra
dius
urba
n fo
otpr
int d
igitz
ed fr
om s
atel
lite
imag
ery
(Lan
dsat
5 T
M) a
t 1:2
50,0
00 s
cale
1989
- 19
99
So
um c
ente
rs +
5 k
m b
uff e
rar
ea w
ithin
mov
ing
win
dow
, 1 k
m ra
dius
MM
RE M
ay 2
010
May
201
0
conv
erte
d la
nd c
over
ur
ban
urba
n la
nd a
rea
with
in m
ovin
g w
indo
w,
1 km
radi
usEc
osys
tem
s of
Mon
golia
(V
osto
kova
& G
unin
200
5)19
89 -
1999
ag
ricu
lture
agri
cultu
ral l
and
area
with
in m
ovin
g w
indo
w,
1 km
radi
usEc
osys
tem
s of
Mon
golia
(V
osto
kova
& G
unin
200
5)19
89 -
1999
acti
ve m
ines
and
pet
role
um d
evel
opm
ent
acti v
e m
ines
acti v
e m
ine
area
with
in m
ovin
g w
indo
w, 1
km
radi
usM
MRE
May
201
0M
ay 2
010
pe
trol
eum
wel
l pad
sw
ell p
ad a
rea
with
in m
ovin
g w
indo
w, 1
km
radi
usdi
gitz
ed fr
om s
atel
lite
imag
ery
(Lan
dsat
5 T
M)
at 1
:250
,000
sca
le (2
009)
July
200
9
liv
esto
ck g
razi
ng
he
rder
cam
ps
(sum
mer
& w
inte
r)ca
mp
dens
ity: m
ovin
g w
indo
w, 1
0 km
radi
usPo
licy
Rese
arch
Insti
tut
e of
Mon
golia
(20
09)
date
?

Identi fying Conservati on Prioriti es in the Face of Future Development:24

Identi fying Conservati on Prioriti es in the Face of Future Development 25
2.6 Site Selecti on
MARXAN is a soft ware package developed for conservati on planning that opti mizes site selecti on to meet user-defi ned representati on goals for biodiversity targets while opti mizing for minimal user-defi ned planning unit cost (Ball & Possingham, 2000; Possingham, Ball & Andelman, 2000). The MARXAN cost functi on includes an opti onal connecti vity component that provides a cost savings for sites that share a boundary. This has the eff ect of driving site selecti on towards confi gurati ons that include more connected sites and fewer isolated sites. The MARXAN cost functi on is explained in Ball & Possingham (2000) and Game & Grantham (2008).
In this analysis, the 9,200 hexagons form the planning unit framework. The biodiversity targets are the 216 combinati ons of biogeographic zones, ecosystem types and landforms defi ned and mapped by the ecosystem classifi cati on. Planning unit cost was derived from the cost/conditi on index by summarizing disturbance index (see Figure 11). The Nati onal protected areas and wetland IBAs were the initi al set locked into the site selecti on opti mizati on, which added planning units to meet ecosystem representati on goals. Through MARXAN analysis, we designed a portf olio of sites that includes the Nati onal Protected Areas and the IBA wetland complexes and meets the ecosystem representati on goals while opti mizing for effi ciency and conditi on (based on the cost/conditi on index) and a
confi gurati on that maximizes adjacency or contagion among PUs. This initi al portf olio is shown in Figure 12.
For a given set of input parameters (biodiversity targets, goals, cost index, boundary lengths and weighti ng coeffi cients), a MARXAN analysis will generate multi ple possible soluti ons, and report the results as a ‘best soluti on’ and a ‘sum of soluti ons.’ Each individual soluti on is a set of sites identi fi ed by the MARXAN algorithm to opti mize for the lowest combinati on of planning unit cost (based on disturbance index), target shortf all and boundary length. The ‘best’ soluti on is the soluti on with the lowest combined score relati ve to the other individual soluti ons that were evaluated. The ‘sum of soluti ons’ is the frequency with which each planning unit was selected. These two results are both useful and serve complementary purposes. The best soluti on identi fi es one opti mal, effi cient confi gurati on of planning units that collecti vely meets representati on goals, while the sum of soluti ons is a measure of the relati ve contributi on of any planning units towards an opti mal soluti on. Because data representi ng biodiversity targets and ecological conditi on are always limited and incomplete, and because portf olio design must conti nually adapt to new data and changing land uses, the sum of soluti ons is a useful measure of the relati ve conservati on value of any part of the study area, and useful for visualizing alternati ve portf olio designs.

Identi fying Conservati on Prioriti es in the Face of Future Development:26
2.7 Measures of biological value
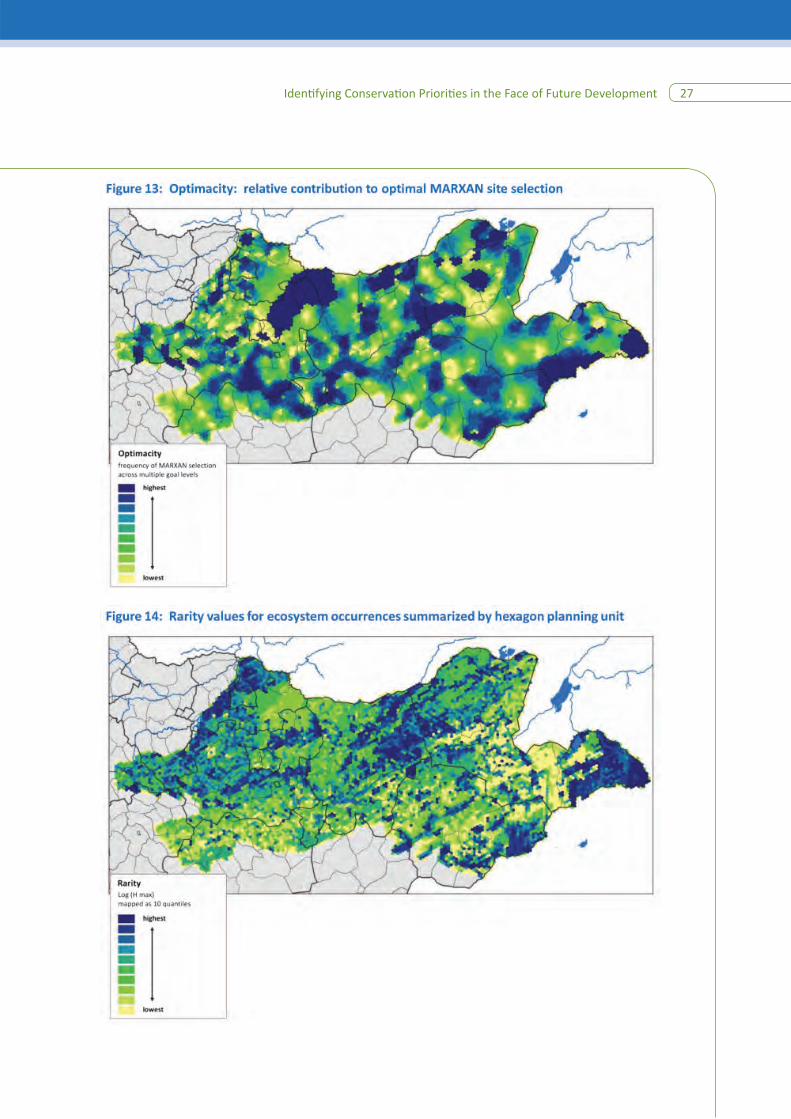
The sum of soluti ons is derived from a single set of MARXAN parameters, and a single set of representati on goals. Wilhere et al. (2008) designed an index for site prioriti zati on using MARXAN that is a measure of relati ve contributi on to an opti mal soluti on, but is independent of a single set of goals. This measure, called opti macity, is calculated as the sum of soluti ons across the full range of goals, from zero to 100%. Therefore, opti macity is a measure of the relati ve value of any part of the study area towards an opti mal soluti on regardless of the representati on goal. We calculated opti macity as the sum of the sum of soluti ons at nine goals levels: 10%, 20%, 30%, 40%, 50%, 60%, 70%, 80% and 90%. The result is shown in Figure 13.
Because the opti macity calculati on is largely a functi on of the cost/conditi on index and MARXAN parameters, and does not measure rarity directly,
we developed a second metric of the conservati on value of each PU in terms of the rarity of the biodiversity targets that occur within it. This rarity calculati on is based on the relati ve abundance of a given ecosystem type in a given PU compared to its abundance across the study area. This is a modifi cati on of the Relati ve Biodiversity Index, or RBI (Schill and Raber 2009), that removes the infl uence of the size of the planning units. The Rarity value is calculated for each ecosystem occurrence within each PU, and these values are summarized by PU. We chose to rank PUs by the maximum Rarity value occurring in each PU. The result is shown in Figure 14.
To calculate a combined biological value for each PU, we standardized the values for opti macity and maximum rarity from 0 to 1 , and added the two values. The result is shown in Figure 15. This index of combined biological value is a component of portf olio design and the basis for identi fying areas to avoid development.
Identi fying Conservati on Prioriti es in the Face of Future Development 27

Identi fying Conservati on Prioriti es in the Face of Future Development:28
2.8 Portf olio design
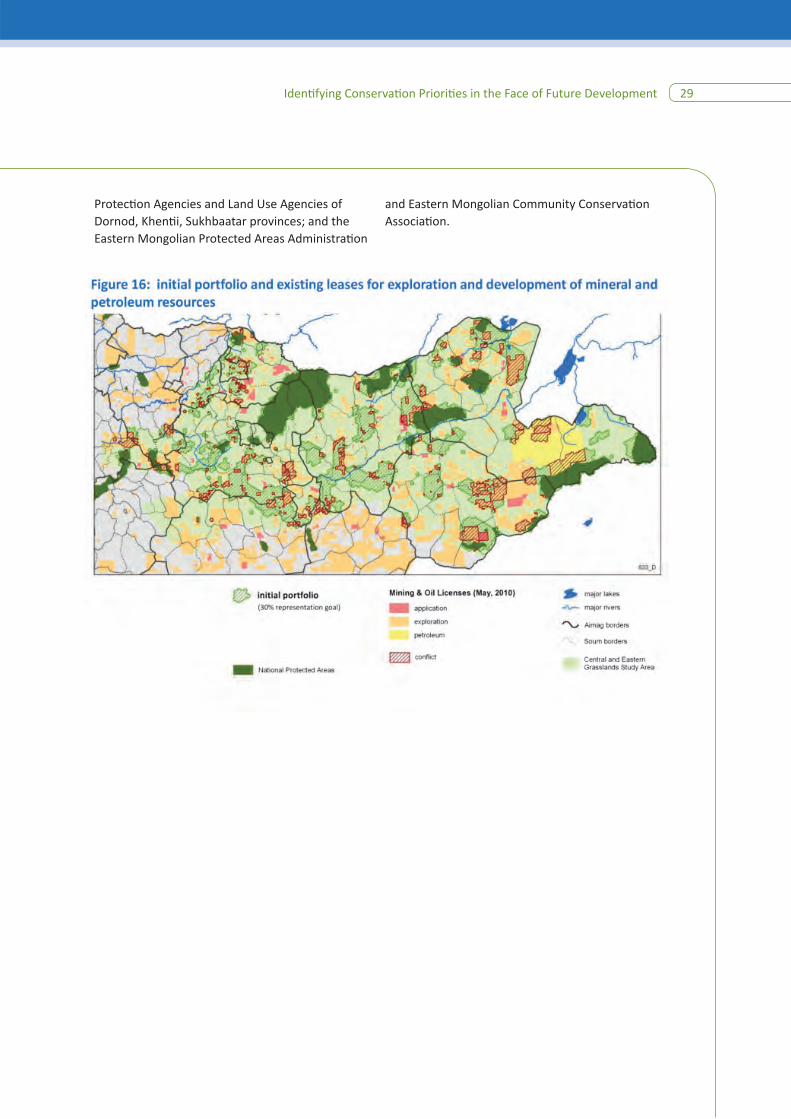
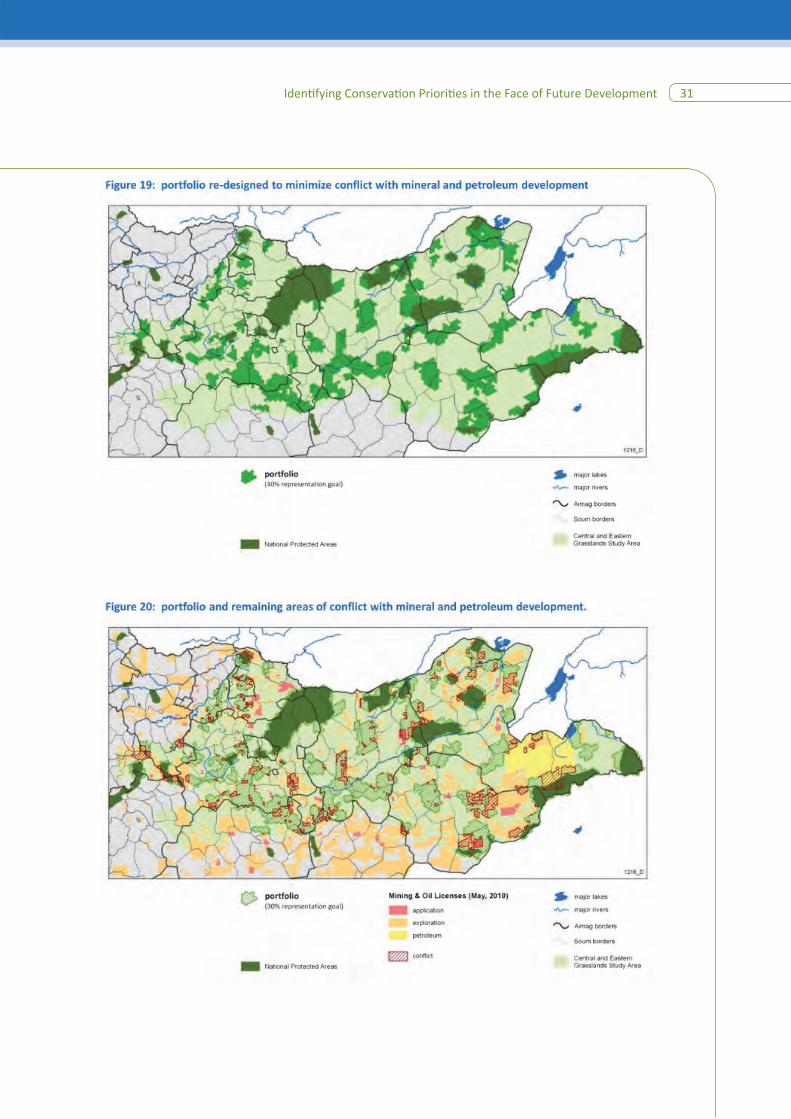
To minimize confl ict with planned mineral and oil development, we re-designed the initi al portf olio as follows. First, we identi fi ed the porti ons of conservati on priority areas that have been leased for explorati on or development (see Figure 16). The combined area of these confl ict areas was 29,800 km2, or 21% of the portf olio and 7% of the study area. Within this set of confl ict areas, we identi fi ed the PUs with conservati on value in the upper 30th percenti le, (22,000 km2or 74% of the confl ict areas) and designated these as areas of high biological value where development should be avoided (see Figure 17). The remaining PUs in confl ict areas occupied an area of 7,800 km2, or 6% of the portf olio and 2% of the study area. We replaced these remaining PUs with sites of similar compositi on and conditi on outside existi ng leases (see Figure 18).
The result is a re-designed portf olio that avoids mining and oil leases except in areas of high biological value (see Figures 19 and 20). The portf olio covers 147,000 km2, or 32 % of the study area, and consists of 45 sites that range in size from 100 km2 to 18,000 km2. Current Nati onal Protected Areas are 29% of the portf olio area.
To confi rm the accuracy of the portf olio analysis and source data, we conducted a fi eld survey to visit and review portf olio sites in August 2010. The route covered porti ons of Khenti i, Sukbaatar and Dornod Aimags, including Bayan Tsagaan Tal, Matad Uul, Meningiin Tal, Lower Kherlen Floodplain, Yahi Nuur, Mongol Daguur Strictly Protected Area (SPA), Tsav Jargalant Tal, Toson Hulstai Nature Reserve and the Upper Onon River. In Baruun Urt, Choibalsan, Mongol Daguur SPA and Toson Hulstai, we met and reviewed the portf olio design with offi cials from the Environmental
Identi fying Conservati on Prioriti es in the Face of Future Development 29
Protecti on Agencies and Land Use Agencies of Dornod, Khenti i, Sukhbaatar provinces; and the Eastern Mongolian Protected Areas Administrati on
and Eastern Mongolian Community Conservati on Associati on.

Identi fying Conservati on Prioriti es in the Face of Future Development:30
Identi fying Conservati on Prioriti es in the Face of Future Development 31
Identi fying Conservati on Prioriti es in the Face of Future Development:32
3.0 DISCUSSION
3.1 Applicati ons to Conservati on and Miti gati on
This study can support sustainable development for the Eastern Steppe grasslands by providing a sound basis for land-use planning, balancing the needs of mineral and energy development, pastoral livelihoods, and wildlife habitat conservati on. We believe the study can inform decision-making for Protected Areas design and management and support improvements in miti gati on policy and practi ce.
3.1.1. Protected Area Designati on and Management
The results of this study can inform new protected area designati ons to meet the Mongolian government’s goal of protecti ng 30% natural habitat, and support the development of prioriti es and strategies for improving management eff ecti veness of existi ng protected areas. The Resoluti on #13 of the Parliament of Mongolia specifi es that half of the 30% protecti on goals will be met by local protected areas, at the Aimag level. Aimag land use agencies are primarily responsible for designing land management plans at intervals of 12-16 years and are responsible for implementati on (Law of Mongolia on Land, 2002). At the Aimag level, this study can inform designati on and management of local protected areas, including pastoral land use planning.
3.1.2. Miti gati on of Mining and Energy Development
This study can support more eff ecti ve miti gati on decision-making for mining and oil and gas leases in the Mongolian grasslands. First, by identi fying conservati on prioriti es in the face of future development, the study provides an “early warning” of potenti al confl icts between development and conservati on goals. Second, the Development by Design framework and the results of this study provide a basis for applying the “miti gati on hierarchy” to support informed decision-making about appropriate impact
miti gati on practi ces (i.e., impact avoidance versus off sets). Areas of confl ict between the conservati on portf olio and proposed development may result in a “re-drawing” of the portf olio to re-capture habitat needed to meet biodiversity goals (Figure 19, Figure 20). However, if conservati on goals cannot be met elsewhere within the study area, development should be avoided, or must minimize impacts to the degree that maintains biodiversity values. This provides a way to avoid confl ict between potenti al development and areas criti cal for biodiversity, and provides the structure to guide decisions regarding the appropriate step in the miti gati on hierarchy in response to proposed development.
It is clear that not all development will impact all biological targets, and a simple overlap between development and target occurrence does not equate with impact. Thus, translati ng development into impact will need to be done on a target by target basis. This typically involves a fi ner scale assessment of target distributi on and development impacts. This landscape scale assessment is meant to provide a starti ng point to identi fy potenti al confl ict and to guide where additi onal analyses will be required.
3.1.3. Designing Off sets
For development projects that proceed, the next step in the Development by Design framework is to determine project-level impacts and identi fy best off set opportuniti es. Where development impacts occur, impacts should be minimized and areas restored in accordance with best management practi ces per internati onal regulatory standards. In additi on, to support a balance of development and conservati on for Mongolia’s grasslands, impacts remaining aft er avoidance, minimizati on and restorati on should be quanti fi ed and off set (Figure 21). Applying a goal of no-net-loss to these development areas would also provide a mechanism to achieve conservati on goals by translati ng impacts in areas outside the portf olio to conservati on in portf olio sites.

Identifying Conservation Priorities in the Face of Future Development 33
Offsets should deliver values ecologically equivalent to those lost, be located at an acceptable proximity from the impact site, and contribute to landscape conservation goals. Using the existing portfolio sites, development areas can be matched for ecological equivalency and proximity to impacts sites to ensure that offset accrue to similar ecological systems and in close proximity to where
impacts will occur. Because the portfolio was designed to meet landscape conservation goals, offsets directed towards areas within the portfolio would be consistent with landscape-level goals. Conservation actions for an offset should be evaluated based on potential conservation benefits, as well as risk and cost. (McKenney and Kiesecker 2010, Kiesecker et al. in press).
Figure 21: Illustration of offset planning
Development footprint
Ecosystem Type AREA (km2)
small water bodies 5 0.1%
Dry steppe | low elev. flat 3,187 74.5%
Dry steppe | low elev. hills 507 11.8%
Dry steppe | valley bottom 164 3.8%
wet salty depressions 413 9.7%
4,276 100.0%
Composition of potential offset sites
Ecosystem Type AREA (km2)
small water bodies 14 0.4%
Dry steppe | low elev. flat 1,853 50.2%
Dry steppe | low elev. hills 1,105 29.9%
Dry steppe | valley bottom 144 3.9%
wet salty depressions 117 3.2%
Meadow steppe | low elev. flat 39 1.0%
Mod. dry steppe | low elev. flat 210 5.7%
Mod. dry steppe | low elev. hills 190 5.2%
Mod. dry steppe | valley bottom 20 0.5%
3,692 100.0%
Ecosystem Type AREA (km2)
small water bodies 2 0.3%
Dry steppe | low elev. flat 530 72.9%
Dry steppe | low elev. hills 80 11.0%
Dry steppe | valley bottom 25 3.5%
wet salty depressions 86 11.9%
Meadow steppe | low elev. flat 2 0.3%
Meadow steppe | low elev. hills 1 0.2%
727 100.0%
Identi fying Conservati on Prioriti es in the Face of Future Development:34
3.2 Portf olio Improvement: An Adapti ve Process
In a landscape that is sti ll largely un-disturbed and un-fragmented, with impending changes in the form of rapid mineral and energy development and climate change, it is important for portf olio design to be fl exible, and regularly reviewed and revised, to adapt to new threats and changes in land use, and adapt to new informati on. The results of this study include both a) a portf olio and b) the underlying geographic informati on system (GIS), which contains data describing the portf olio sites and the whole study area. The portf olio is the result of a broad, landscape-level analysis, so it is important to adjust the site boundaries at the local level based on local knowledge and fi eld surveys. For example, work is underway to delineate proposed PA boundaries around 2 portf olio sites, Tsav Jargalant Tal and Bayan Tsagaan Tal, based on local fi eld survey.
Portf olio design is sensiti ve to the accuracy of the source data, and sensiti ve to decisions re: targets, goals, and conditi on index. As new data becomes available, and land use decisions change, we can and should update the portf olio, and the underlying informati on describing the portf olio sites. Regular review and revision is essenti al
to the iterati ve, adapti ve process of portf olio design. We recommend several important areas for portf olio improvement in Appendix 4. These include improving representati on of species, evaluati ng cultural and historic sites for inclusion in the portf olio, freshwater conservati on planning and incorporati ng functi onal landscape connecti vity in portf olio design.
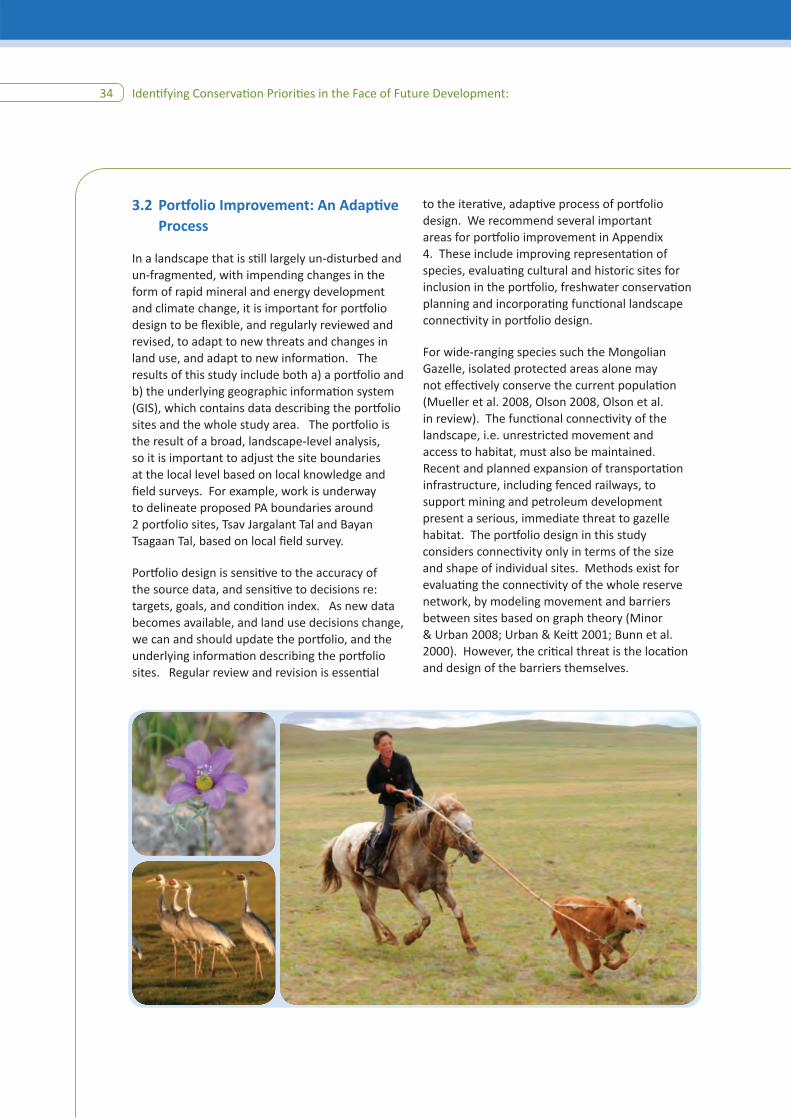
For wide-ranging species such the Mongolian Gazelle, isolated protected areas alone may not eff ecti vely conserve the current populati on (Mueller et al. 2008, Olson 2008, Olson et al. in review). The functi onal connecti vity of the landscape, i.e. unrestricted movement and access to habitat, must also be maintained. Recent and planned expansion of transportati on infrastructure, including fenced railways, to support mining and petroleum development present a serious, immediate threat to gazelle habitat. The portf olio design in this study considers connecti vity only in terms of the size and shape of individual sites. Methods exist for evaluati ng the connecti vity of the whole reserve network, by modeling movement and barriers between sites based on graph theory (Minor & Urban 2008; Urban & Keitt 2001; Bunn et al. 2000). However, the criti cal threat is the locati on and design of the barriers themselves.

Identi fying Conservati on Prioriti es in the Face of Future Development 35
Predicti ons suggest elevated pressure will be placed on natural resources as human populati ons grow. Forecasts predict massive increases in investment in infrastructure, most of which will occur in developing countries (World Bank 2007). Energy development alone will result in 22 trillion USD invested in projects by 2030, again mostly in developing countries (Internati onal Energy Agency 2006). These global patt erns mirror projecti ons in Mongolia, where approximately 27%, of the surface rights for mineral and petroleum explorati on have been leased and 47% is available for lease. In order to balance these growing demands with biodiversity conservati on, a shift from business-as-usual is clearly in order. By blending a landscape vision with the miti gati on hierarchy we move away from the traditi onal project-by-project land use planning approach. By avoiding or minimizing impacts to irreplaceable occurrences of biological targets, using the best internati onal standards to ensure that impacts
are restored on site, and fi nally off setti ng any remaining residual impacts, we can provide a framework truly consistent with sustainable development (Bartelmus 1997, Pritchard 1993).
A biodiversity vision is essenti al because it serves as a touchstone to ensure that biologically and ecologically important features remain the core conservati on targets over ti me. Without a vision, we lose sight of the overarching conservati on goals, we have diffi culty establishing prioriti es, and we waste scarce resources. Determining appropriate areas to preserve as habitat as part of a conservati on vision is a challenging exercise; but, in reality, this is the easy part. The real challenge is fi nding funding mechanisms to underwrite the conservati on of these areas. By adopti ng the framework outlined here not only do we balance development with conservati on but provide the structure to fund conservati on commensurate with impacts from development.
4.0 CONCLUSION

Identi fying Conservati on Prioriti es in the Face of Future Development:36
Abell R (2002) Conservati on biology for the biodiversity crisis: a freshwater follow-up. Conservati on Biology, 16, 1435-1437.
Abell R, Allan JD & Lehner B (2007) Unlocking the potenti al of protected areas for freshwaters. Biological Conservati on, 134, 48–63.
Anderson MG, Ferree CE (2010) Conserving the Stage: Climate Change and the Geophysical Underpinnings of Species Diversity. PLoS One 5.
Ball IR. (2000) Mathemati cal applicati ons for conservati on ecology: the dynamics of tree hollows and the design of nature reserves. PhD Thesis, The University of Adelaide.
Ball IR & Possingham HP (2000) MARXAN (V1.8.2): Marine Reserve Design Using Spati ally Explicit Annealing, a Manual. Available online at htt p://www.ecology.uq.edu.au/index.html?page=27710
Bartelmus P (1997) Measuring sustainability: data linkage and integrati on, pp110-118 in Moldan and Billharz Sustainability Indicators: Report of the Project on Indicators of Sustainable Development, Countryside Commission, Cheltenham.
Beier P & Brost B (2010) Use of Land Facets to Plan for Climate Change: Conserving the Arenas, Not the Actors. Conservati on Biology, DOI: 10.1111/j.1523-1739.2009.01422.x
Berger J. (2004) The last mile: how to sustain long-distance migrati ons in mammals. Conservati on Biology, 18, 320–331.
Bunn AG, Urban DL, and Keitt TH (2000) Landscape connecti vity: a conservati on applicati on of graph theory. Journal of Environmental Management 59:265–278.
Carwardine J, Klein CJ, Wilson KA, Pressey RL & Possingham HP (2009) Hitti ng the target and missing the point: target-based conservati on planning in context. Conservati on Lett ers, 2, 3–10.
Clark EL, Munkhbat J, Dulamtseren S, Baillie JEM, Batsaikhan N, Samiya R & Stubbe M. (compilers and editors) (2006) Mongolian Red List of Mammals. Regional Red List Series Vol. 1. Zoological Society of London, London. (In English and Mongolian)
Dashnyam L (1974) Vegetati on and Flora of Eastern Mongolia. Ulaanbaatar. In Mongolian.
Dobson A (1996) Conservati on and Biodiversity. Scienti fi c American Library, New York. page 66.
ERDAS (1999) ERDAS Field Guide, 5th ed. Atlanta, GA
Fekete, B. M., C. J. Vorosmarty, W. Grabs. 2002. High-resoluti on fi elds of global runoff combining observed river discharge and simulated water balances, Global Biogeochemical Cycles, 16 (3): 15-1 to 15-10. Available online at htt p://wwdrii.sr.unh.edu/download.html
Game ET & Grantham HS (2008) Marxan User Manual: For Marxan version 1.8.10. University of Queensland, St. Lucia, Queensland, Australia, and Pacifi c Marine Analysis and Research Associati on, Vancouver, Briti sh Columbia, Canada.
Girvetz EH, Zganjar C, Raber GT, Maurer EP, Kareiva P, Lawler JJ. (2009) Applied Climate-Change Analysis: The Climate Wizard Tool. PLoS One 4.
Grand J, Cummings MP, Rebelo TG, Rickett s TH & Neel MC (2007) Biased data reduce effi ciency and eff ecti veness of conservati on reserve networks. Ecology Lett ers, 10, 364-374.
Groves C, Jensen D, Valuti s L, Redford K, Shaff er M, Scott J, Baumgartner J, Higgins J, Beck M & Anderson M (2002) Planning for biodiversity conservati on: Putti ng conservati on science into practi ce. BioScience, 52, 499-512.
Groves C (2003) Draft ing a Conservati on Blueprint: A Practi ti oner's Guide to Planning for Biodiversity. Island Press, Washington.
REFERENCES

Identi fying Conservati on Prioriti es in the Face of Future Development 37
Halpin PN (1997) “Global climate change and natural-area protecti on: Management responses and research directi ons.” Ecological Applicati ons 7(3): 828-843.
Hess S, Boucher T, Dabrovskyy A, Ter Hoorn E, & Van Beukering P (2010) Evaluati ng the eff ecti veness of community-based conservati on in Mongolia’s Gobi Desert. A report to the Nature Conservancy. Arlington, VA, USA.
Heiner M, Higgins J, Li X & Baker B (2011) Identi fying freshwater conservati on prioriti es in the Upper Yangtze River Basin. Freshwater Biology 56: 89-105.
Higgins J, Bryer M, Khoury M & Fitzhugh T (2005) A freshwater classifi cati on approach for biodiversity conservati on planning. Conservati on Biology, 19, 432-445.
Higgins J & Esselman R (2006) Ecoregional Assessment Toolbox. The Nature Conservancy, Arlington, VA. Available online at htt p://conservati ongateway.org/era.
Hoekstra JM, Boucher TM, Rickett s TH, Roberts C. 2005. Confronti ng a biome crisis: global dispariti es of habitat loss and protecti on. Ecology Lett ers 8: 23-29.
Hunter ML, Jacobson Jr. GL & Webb T (1988) Paleoecology and the coarse fi lter approach to maintaining biological diversity. Conservati on Biology, 2, 375-385.
Hunter ML (1991) Coping with ignorance: The coarse fi lter strategy for maintaining biodiversity. In: Balancing on the Brink of Exti ncti on (Ed. K.A. Kohm), pp. 266-281. Island Press, Washington.
Insti tute of Geography, Mongolian Academy of Sciences. 2009. Mongolian Nati onal Atlas
Internati onal Energy Agency (2007) World Energy Outlook 2007. Paris, France.
Jenkins RE (1976) Maintenance of natural diversity: approach and recommendati ons. In: K. Sabol (ed.) Transacti ons–Forty-fi rst North American Wildlife and Natural Resources Conference. Washington, D. C. March 21-25, 1976. Pp. 441-451.
Khoury M, Higgins J, Weitzell R (2011) A freshwater conservati on assessment of the Upper Mississippi River basin using a coarse- and fi ne-fi lter approach. Freshwater Biology 56: 162-179.
Kiesecker JM, Copeland H, Pocewicz A, Nibbellink N & McKenney B (2009) A framework for implementi ng biodiversity off sets: selecti ng sites and determining scale. Bioscience 59: 77-84.
Kiesecker JM, Copeland H, Pocewicz A & McKenney B (2010) Development by design: blending landscape-level planning with the miti gati on hierarchy. Fronti ers in Ecology and the Environment 8: 261-266.
Kiesecker JM, Copeland H, McKenney B, Pocewicz A, and K Doherty (In Press) Energy by Design: Making miti gati on work for conservati on and development. Chapter in: Energy development and wildlife conservati on in Western North America (Edited by DE Naugle)
Law of Mongolia on Land (2002) Arti cle 123. Ulaanbaatar, Mongolia.
Lehner C, Verdin K & Jarvis A (2006) HydroSHEDS Technical Documentati on. World Wildlife Fund US, Washington, DC. Available online at www.worldwildlife.org/hydrosheds.
MacArthur RH & Wilson EO (1967) The Theory of Island Biogeography. Princeton University Press, Princeton, NJ.
Margules CR & Pressey RL (2000) Systemati c conservati on planning. Nature, 405, 243-253.
Master Plan for Mongolia’s Protected Areas (1998) Ulaanbaatar, Mongolia.

Identi fying Conservati on Prioriti es in the Face of Future Development:38
Mazancourt CD, Loreau M & Abbadie L (1998) Grazing opti mizati on and nutrient cycling: When do herbivores enhance plant producti on? Ecology 79, 2242-2252.
McKenney B, & Kiesecker JM (2010) Policy Development for Biodiversity Off sets: A Review of Off set Frameworks. Environmental Management 45:165–176.
Minor E & Urban DL (2008) A Graph-Theory Framework for Evaluati ng Landscape Connecti vity and Conservati on Planning. Conservati on Biology, Volume 22, No. 2, 297–307.
Ministry of Mineral Resources and Energy (2010) GIS lease data - May 2010.
Ministry of Nature and Environment (MNE). (1996) Biodiversity conservati on acti on plan for Mongolia. Ulaanbaatar, Mongolia.
MODIS Land Subsets (2010) MODIS Global Subsets: Data Subsetti ng and Visualizati on. Oak Ridge Nati onal Laboratory DAAC. Available online at htt p://daac.ornl.gov/cgi-bin/MODIS/GLBVIZ_1_Glb/modis_subset_order_global_col5.pl
Moore ID, Grayson RB & Ladson AR (1991) Digital Terrain Modelling: A Review of Hydrological, Geomorphological, and Biological Applicati ons. Hydrological Processes, 5:3-30.
Moore JS, Antenen S, Davaa G, Ferree C, Batbold D, Dephilip M, Pague C, Onon Y, Sanjmyatav D, McCready R (in prep) Biodiversity GAP Analysis for Mongolia’s Eastern Steppe: Setti ng the stage for establishment of an ecologically representati ve protected areas network for Mongolia.
Mueller T, Olson KA, Fuller TK, Schaller GB, Murray MG & Leimgruber P (2008) In search of forage: predicti ng dynamic habitats of Mongolian gazelles using satellite-based esti mates of vegetati on producti vity. Journal of Applied Ecology, 45: 649-658.
Myagmarsuren D (2008) Mongolia’s Protected Areas. Ulaanbaatar. (In Mongolian)
Nibbelink N (2006) The EDM (Element Distributi on Modeling) Tools for ArcGIS Tutorial: Version 1.1, Warnell School of Forestry & Natural Resources, University of Georgia, Athens, GA, USA.
NASA Landsat Program (2009) Landsat TM. USGS. Sioux Falls.
Nati onal Stati sti cal Offi ce of Mongolia (2008) Mongolian Stati sti cal Yearbook. Ulaanbaatar, Mongolia.
Nel JL, Roux DJ, Maree G, Kleynhans CJ, Moolman J, Reyers B, Rouget M & Cowling RM (2007) Rivers in peril inside and outside protected areas: a systemati c approach to conservati on assessment of river ecosystems. Diversity and Distributi ons, 13, 341–352.
Noss RF (1996) “Ecosystems as Conservati on Targets.” Trends in Ecology and Evoluti on 11: 351.
Nyambayar B. & Tsveenmyadag N. eds. (2009) Directory of Important Bird Areas in Mongolia: Key Sites for Conservati on. Ulaanbaatar: Wildlife Science and Conservati on Center, Insti ute of Biology and BirdLife Internati onal. 103 pp.
Olson DM, Dinerstein E, Wikramanayake ED, Burgess ND, Powell GVN, Underwood EC, D'Amico JA, Itoua I, Strand HE, Morrison JC, Loucks CJ, Allnutt TF, Rickett s TH, Kura Y, Lamoreux JF, Wett engel WW, Hedao P, & Kassem KR. Terrestrial Ecoregions of the World: A New Map of Life on Earth. BioScience 51:933-938.
Olson K A (2008) Distributi on and ecology of Mongolian gazelles (Procapra gutt urosa Pallas 1777) in Mongolia’s eastern steppe [dissertati on]. Amherst, Massachusett s, USA: University of Massachusett s, Amherst. 140 p.
Olson KO, Mueller T, Kerby J, Bolortsetseg S, Leimgruber P, Nicolson C, Fuller T (in review).

Identi fying Conservati on Prioriti es in the Face of Future Development 39
Death by A Thousand Huts: Eff ects of Household Presence on Density and Distributi on of Mongolian Gazelles. Conservati on Lett ers.
Parliament of Mongolia (2008) Parliament Resoluti on #13 on the Approval of the Millennium Development Goals of Mongolia. Ulaanbaatar, Mongolia.
Poiani K, Richter B, Anderson M, & Richter H (2000) Biodiversity Conservati on at Multi ple Scales. Bioscience 50 (2). 133-146.
Policy Research Insti tute of Mongolia (2009) unpublished data. Ulaanbaatar, Mongolia.
Possingham HP, Ball IR & Andelman S (2000) Mathemati cal methods for identi fying representati ve reserve networks. In: Quanti tati ve Methods for Conservati on Biology (Eds S. Ferson & M. Burgman), pp. 291-305. Springer-Verlag, New York.
Pressey RL, and Bott rill MC (2008) Opportunism, threats, and the evoluti on of systemati c conservati on planning. Conserv. Biol. 22: 1340-1345.
Pressey RL, Possingham HP, and Day JR (1997) Eff ecti veness of alternati ve heuristi c algorithms for identi fying indicati ve minimum requirements for conservati on reserves. Biol Conserv 80 :207-19.
Pritchard D (1993) Towards sustainability in the planning process: the role of EIA. ECOS: A Rev of Conserv 14:3-15.
Ramsar Conventi on on Wetlands (2011) The List of Wetlands of Internati onal Importance. Gland, Switzerland. Available online at htt p://www.ramsar.org/pdf/sitelist.pdf.
Schill S & Raber G (2009) Ecosystem Assessment and Reporti ng (EAR) Tool for ArcGIS 9.3TM Version 1.0. available online at htt p://gg.usm.edu/EAR/fi les/EAR_v1_User_Manual.pdf
Rich PM, Hetrick WA & Savings SC (1995) Modelling topographical infl uences on solar radiati on: manual for the SOLARFLUX model. LA-12989-M, Los Alamos Nati onal Laboratories, Los Alamos.
Smith RK, Freeman PL, Higgins JV, Wheaton KS, FitzHugh TW, Ernstrom KJ & Das AA (2002) Freshwater Biodiversity Conservati on Assessment of the Southeastern United States. The Nature Conservancy, Arlington.
Sowa SP, Annis G, Morey ME & Diamond DD (2007) A gap analysis and comprehensive conservati on strategy for riverine ecosystems of Missouri. Ecological Monographs, 77, 301-334.
Tear TH, Karieva P, Angermeir PL, Comer P, Czech B, Kautz R, Landon L, Mehlman D, Murphy K, Ruckleshaus M, Scott JM, & Wilhere G (2005) How Much is Enough?: The Recurrent Problem of Setti ng Quanti tati ve Objecti ves in Conservati on. BioScience Vol. 55, No. 10, pp. 835-849.
Thieme M, Lehner B, Abell R, Hamilton SK, Kellndorfer J, Powell G & Riveros JC (2007) Freshwater conservati on planning in data-poor areas: An example from a remote Amazonian basin. Biological Conservati on, 135, 484-501.
Thorne JH, Huber PR, Girvetz EH, Quinn J, & McCoy MC (2009) Integrati on of Regional Miti gati on Assessment and Conservati on Planning. Ecology and Society 14(1): 47-63.
UNESCO (2011a) MAB Biosphere Reserves Directory. Available online at htt p://www.unesco.org/mabdb/br/brdir/directory/database.asp.
UNESCO (2011b) World Heritage List. Available online at htt p://whc.unesco.org/en/list.
Urban DL & Keitt T (2001) Landscape connecti vity: a graph-theoreti c perspecti ve. Ecology 82:1205–1218.

Identi fying Conservati on Prioriti es in the Face of Future Development:40
Vostokova EA & Gunin PD (2005) Ecosystems of Mongolia. Russian Academy of Sciences, Mongolian Academy of Sciences, Moscow. GIS data available online at htt p://geodata.mne-ngic.mn:8080/geonetwork/srv/en/main.home.
Wildlife Conservati on Society (WCS) (2007) Draft Mongolian Gazelle Management and Acti on Plan. Ulaanbaatar.
Wilhere G, Goering M & Wang H (2008) Average opti macity: An index to guide site prioriti zati on for biodiversity conservati on. Biological Conservati on, 141, 770-781.
World Bank (2007) Global Economic Prospects 2007: Managing the Next Wave of Globalizati on. Washington DC.
World Wildlife Fund Mongolia Program. (2010) Filling the GAPs to protect the biodiversity of Mongolia. Admon. Ulaanbaatar.
Yu F, Price KP, Ellis J, Feddema JJ, Shi P. (2004) Interannual variati ons of the grassland boundaries bordering the eastern edges of the Gobi Desert in central Asia. Internati onal Journal of Remote Sensing 25: 327-346.
Zhang G, Kang Y, Han G, Sakurai K. (2010) Eff ect of climate change over the past half century on the distributi on, extent and NPP of ecosystems of Inner Mongolia. Global Change Biology: 377-389.

Identi fying Conservati on Prioriti es in the Face of Future Development 41
Appendix 1: Ecological descripti ons of terrestrial ecosystem types
This secti on contains ecological descripti ons of the terrestrial ecosystem types that are the basis for the ecosystem classifi cati on described in secti on 2.2. These 17 ecosystem types are mapped in Figures 5, 6 and 7, and listed in Table 2, which also lists source data and mapping methods.
UPLAND ECOSYSTEM TYPES
Steppe Grasslands
For upland ecosystems, our primary data source was a map developed by Vostokova and Gunin (2005). This map was was re-classifi ed by WWF to produce a nati onal mapped ecosystem classifi cati on (WWF 2010). The Dry Steppe, Moderately Dry Steppe and Meadow Steppe compose the great grasslands of Mongolia’s Eastern Steppe, together covering 80% of the study area. Characteristi c animal species include Mongolian gazelle, Marmot, Great bustard, Steppe eagle, Saker falcon, Mongolian lark.
The grassland steppes have of course been heavily grazed over the centuries, and this has had serious implicati ons for the structure, compositi on, and ecological functi on (nutrient cycling, succession, disturbance regimes) of the system. Overgrazed areas are indicated by high densiti es of Cleistogenes squarrosa, Carex duriuscula, and some prostrate forbs, replacing less resilient grasses. The most severe degradati on could steer some sites toward complete type conversion to annual vegetati on without grasses.
Dry SteppeThis grassland system occurs in fl at or gently sloping valleys the lower elevati ons of the study area, 550 – 1200 meters above sea level. The dry steppe ecosystem forms a landscape mosaic of grass communiti es that are characterized by Sti pa krylovii, Sti pa grandis, Agropyron cristatum, Cleistogenes squarossa, Elymus chinensis, shrubs such as Caragana and Anabasis species, and forbs which are well adapted to arid conditi ons.
In moderately grazed areas, grass species are commonly replaced by Artemisia. Heavilyy grazed areas or areas recovering from droughts will be dominated by annual forbs mainly by Chenopodium spp, and Bassia dasyphylla. In closed basins, the dry steppe mosaic includes patchy salty depressions characterized by Achnatherum spp, Reamuria, Salsola, Nitraria and Allium (mainly A. scenescens A. mongolicum) at the edges. In small rolling hills, there are sparse patches of Populus, Betula, and Salix.
Moderately Dry Steppe: Like the Dry Steppe, this grassland system occurs in fl at or gently sloping valleys, but at slightly higher elevati ons, from 550 – 1600 meters above sea level. The mosaic of plant communiti es include Sti pa, Festuca, Agropyron, Cleistogenes, Poa, Elymus, Koelaria species and other grasses in shift ing proporti ons depending on the subregion of occurrence, soil moisture, level of grazing, and other factors. One community dominated by Filifolium sibiricum and Sti pa baicalensis typifi es this ecosystem type in the very northeast. Another widely occurring community is typifi ed by the tall grasses Sti pa grandis and Elymus chinensis. Caragana shrubs shift in community importance across the steppe region, but favor drier sites and coarser soils; less dry sites share many forbs with the upland meadow steppe, and are oft en underlain by a darker kastanozem with a thicker, strongly organic upper horizon than drier examples.
Meadow Steppe: This meadow system oft en occurs at hilly landscapes at elevati ons just below the forest steppe, from lows of about 650 meters in the northeast of the study area, to more than 1700 meters in the south and west. Meadow Steppe represents a transiti on zone between forest and forest steppe systems and the vast areas of drier grasslands in the Mongolian-Manchurian Grassland Ecoregion. Broad occurrences of this system type also occur in the Pre-Khyangan foothills of eastern Mongolia and on the high hills of the upper Orkhon and Tarnyn Gol watersheds in

Identi fying Conservati on Prioriti es in the Face of Future Development:42
the very west of the region. Annual precipitati on, approximately 300mm, is high enough to support only small scatt ered occurrences of trees (Ulmus and Betulus species), but do support vegetati on communiti es rich in forbs, sedges, and mesophyti c grasses and shrubs. A relati vely moister variant occurs at higher elevati ons and on northern slopes, and a drier variant at lower elevati on and on warmer exposures with shallower soils. Festuca lenensis and F. sibirica, Poa att enuata, and Helichtotrichon schellianum are well-represented. The wide variety of forbs make this a botanically diverse system, including species from the Artemesia, Thalictrum, Aster, Polygonum, Potenti lla, Carex, and Gallium genera. Some of these are characteristi c of larch forests or elm bush, indicati ng that much of this system may well have been converted from forests by cutti ng and overgrazing – and that a return to a more wooded system would be possible if tree cutti ng and grazing were limited.
Desert Steppe: The Desert Steppe ecosystem type covers 2% of the study area at its southern edge, where it represents a transiti onal zone between the Mongolian-Manchurian Grassland Ecoregion and the Eastern Gobi Desert Steppe Ecoregion. This ecosystem type is characteristi c of Eastern Gobi Desert Steppe Ecoregion, which lies between the Alashan Plateau Semi-Desert and the relati vely moist Mongolian-Manchurian Grasslands. The vegetati on tends to be homogenous, consisti ng of drought-adapted shrubs and thinly distributed low grasses.
For more informati on about Desert Steppe and the Eastern Gobi Desert Steppe Ecoregion, see htt p://www.worldwildlife.org/wildworld/profi les/terrestrial/pa/pa1314_full.html
Other Upland Ecosystem Types
Sand Massives: This dynamic sand dune system is stabilized to varying degrees by patchy embedded vegetati on including willows, elm and psammophyti c forbs and grasses. Species include Filifolium sibiricum, Sti pa baicalensis, koeleria
mukdenesis, Cleistogenes kitagawae, Armeniaca sibirica, Ulmus japonicas, Iris dichotomoa, Hemerocallis minor, Leymus chinensis, Bupleurum sorzonerifolium, Galium verum. Hollows formed between dunes capture signifi cant amounts of blowing debris and can sustain moisture from trapped snow drift s – thereby providing microhabitats conducive to more mesic vegetati on communiti es than would otherwise be found in typical dune habitats. Dunes formed by trees and shrubs essenti ally anchoring the sand mounds can provide essenti al habitat for numerous burrowing animals that rely on the structural stability provided by the root systems within the dunes.
Cinder Cones: Cinder cones are historic inacti ve volcanic vents that are distributed in a concentrated patt ern of over 200 cones in the southeastern corner of the Study area in Sukhbaatar Province. Rich volcanic soils greatly increase plant diversity beyond the surrounding grassland steppe ecosystems, and support 28 botanical families, 75 genera and 180 species of both forage and medicinal plants. Cinder cones provide criti cal habitat for numerous small mammals, repti les and bird species while also supporti ng a wide variety of predators, including wolf, foxes and raptors. Ungulates such as Argali sheep and many rodent species can be found on the cones themselves, with Gazelle and Marmots in the valley fl oors between them. Evidence of the importance of these formati ons to humans are the more than 60 “man-stones” that are distributed around the area. One cinder cone has already been designated as a Special Protected Area to protect these historic arti facts.
Boreal Forest: The following six Montane and Alpine Boreal Forest ecosystem types are described in the Nati onal Gap Assessment published by WWF (2010).
High mountain tundra
Alpine meadow and Subalpine woodland
High mountain steppe
Mountainous boreal coniferous forest

Identi fying Conservati on Prioriti es in the Face of Future Development 43
High mountain deciduous-coniferous woodland
Sub-boreal coniferous-deciduous forest
LAKE and WETLAND ECOSYSTEM TYPES
Riverine and palustrine wetlands
To map fl oodplains and riparian wetlands, we used a GIS topographic model that delineates potenti al riverine wetlands based on topography of the stream channel, as described in Secti on 2.2. We classifi ed the resulti ng features as large river fl oodplains or small river riparian areas associated with smaller tributaries and ephemeral streams. We further classifi ed the fl oodplains and wet riparian areas according to major river basin. In the closed endorheic basins of the southern part of the study area, we classifi ed the wet lowland features as ephemerally wet valley bott oms, which typically form salty depressions, and divided these into two bio-geographic zones, as shown in Figure 6 and described in Table 3.
Large River Floodplains: The large rivers in northeastern Mongolia, which include the Kherlen, Onon, Uldz, Khalkh and the major tributaries to the Selenge, have creati ng wide fl oodplains. Historically, these fl oodplains support a broadleaf forest of riverine trees and shrubs. In the absence of overgrazing by domesti c livestock or physical disturbance by natural fl ooding or scouring, succession to gallery Salix shrubs is likely. Soils are generally cryic fl uvisols and gleysols, with kastanozems that have developed in coarse and fi ne alluvial sediments on the lower terraces away from river banks. Species of poplar, birch, and larch are most common in the tree layer, and of willow in the shrub layer. Forbs and grasses typically associated with moist or periodically moist sites can be dense below the trees. Floodplains systems are producti ve, criti cal habitat for many terrestrial and aquati c species and criti cal for maintaining water quality, and are easily damaged by over-grazing, mining and infrastructure development. While hydrologic regimes remain mostly intact in the study area,
in many areas livestock grazing has altered the original fl oodplain vegetati on.
Small river riparian areas: This system forms a linear patt ern of wet meadows along streams that drain into the major rivers (Kherlen, Onon, Uldz, Khalkh and the major tributaries to the Selenge). Soils are cryic gleysols or semi-gleysols, depending on the amount of available groundwater and the length of ti me the soil stays moist, and are predominantly alluvial, of varying textures, with high organic matt er. Vegetati on cover is dense and diverse and plant producti vity is high with graminoids (Poa pratensis, Agrosti s mongholica, Hordeum brevisubulatum, Phragmites, Carex, Eriophorum, Puccinellia, and Juncus species) and forbs (Iris, Geranium, Vicia, Ranunculus, Polygonum, Sanguisorba, and many others). Betula, larch poplar and especially Salix shrubs and small trees can also occur in the system. In the absence of overgrazing by domesti c livestock or physical disturbance by natural fl ooding or scouring, succession to gallery Salix shrubs is likely.
Ephemerally wet depressions: In the dry, closed basins in the southern part of the study area, this system forms in low depressions where the water table is close to the surface. Salty soils support disti nct plant communiti es and habitat. One common indicator plant community is identi fi ed by tall Achnatherum bunchgrass.
Lakes and small water bodies
To map small lakes and waterbodies, we digiti zed the boundaries and point locati ons of water bodies through manual interpretati on of satellite imagery, as described in Secti on 2.2. We classifi ed lakes and water bodies by river basin or biogeographic zone, as shown in Figure 7.
Large Lakes: These are the large lakes in the study area, as mapped by Vostokova and Gunin (2005). The largest examples include Buul Nuur, Yahi Nuur and Khukh Nuur. These Lakes and associated wetlands support unique aquati c biota and are criti cal nesti ng and stopover for waterbirds

Identi fying Conservati on Prioriti es in the Face of Future Development:44
including the Siberian Crane (CR), White Naped Crane (VU), Hooded Crane (VU), Swan Goose (VU), Great Bustard and Relict Gull (VU) (Nyambayar & Tsveenmyadag 2009).
Small lakes and water bodies: In the dry closed basins in the southern part of the study area,
these small waterbodies are oft en saline or alkaline. Like large lakes, these water bodies and associated wetlands typically support disti nct aquati c biota and are criti cal nesti ng and stopover habitat for waterbirds.
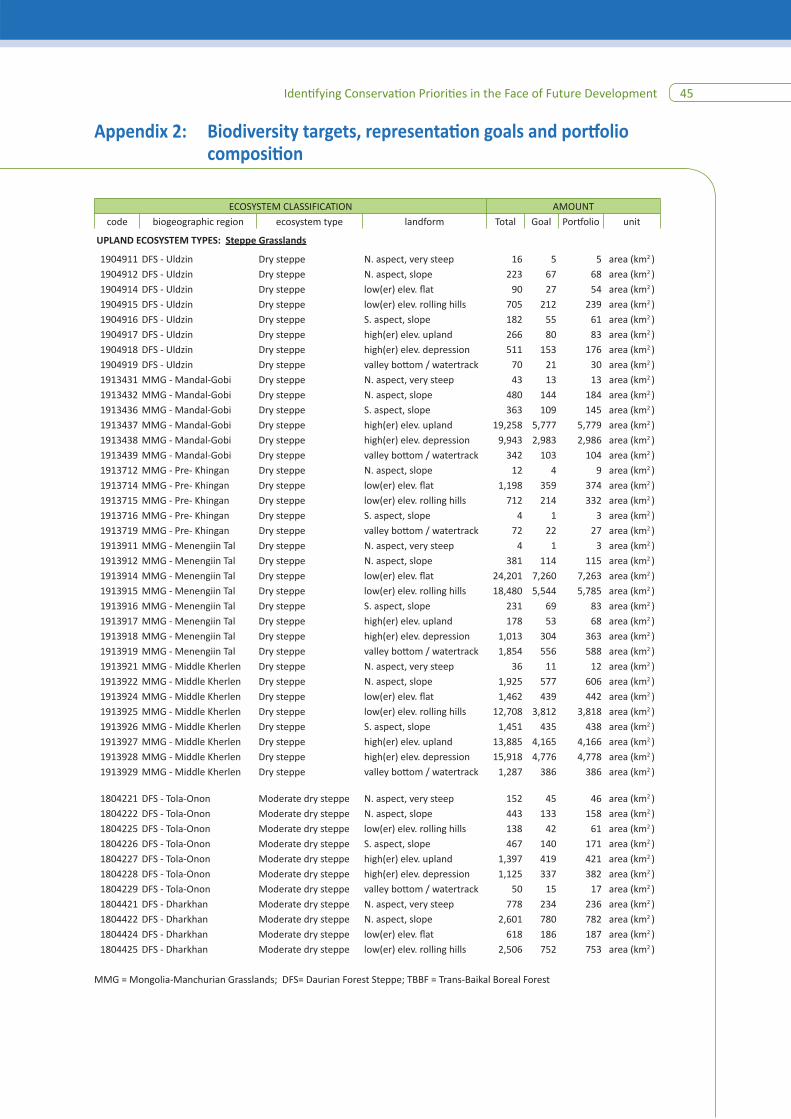
Identi fying Conservati on Prioriti es in the Face of Future Development 45
ECOSYSTEM CLASSIFICATION AMOUNTcode biogeographic region ecosystem type landform Total Goal Portf olio unit
UPLAND ECOSYSTEM TYPES: Steppe Grasslands
1904911 DFS - Uldzin Dry steppe N. aspect, very steep 16 5 5 area (km2 )1904912 DFS - Uldzin Dry steppe N. aspect, slope 223 67 68 area (km2 )1904914 DFS - Uldzin Dry steppe low(er) elev. fl at 90 27 54 area (km2 )1904915 DFS - Uldzin Dry steppe low(er) elev. rolling hills 705 212 239 area (km2 )1904916 DFS - Uldzin Dry steppe S. aspect, slope 182 55 61 area (km2 )1904917 DFS - Uldzin Dry steppe high(er) elev. upland 266 80 83 area (km2 )1904918 DFS - Uldzin Dry steppe high(er) elev. depression 511 153 176 area (km2 )1904919 DFS - Uldzin Dry steppe valley bott om / watertrack 70 21 30 area (km2 )1913431 MMG - Mandal-Gobi Dry steppe N. aspect, very steep 43 13 13 area (km2 )1913432 MMG - Mandal-Gobi Dry steppe N. aspect, slope 480 144 184 area (km2 )1913436 MMG - Mandal-Gobi Dry steppe S. aspect, slope 363 109 145 area (km2 )1913437 MMG - Mandal-Gobi Dry steppe high(er) elev. upland 19,258 5,777 5,779 area (km2 )1913438 MMG - Mandal-Gobi Dry steppe high(er) elev. depression 9,943 2,983 2,986 area (km2 )1913439 MMG - Mandal-Gobi Dry steppe valley bott om / watertrack 342 103 104 area (km2 )1913712 MMG - Pre- Khingan Dry steppe N. aspect, slope 12 4 9 area (km2 )1913714 MMG - Pre- Khingan Dry steppe low(er) elev. fl at 1,198 359 374 area (km2 )1913715 MMG - Pre- Khingan Dry steppe low(er) elev. rolling hills 712 214 332 area (km2 )1913716 MMG - Pre- Khingan Dry steppe S. aspect, slope 4 1 3 area (km2 )1913719 MMG - Pre- Khingan Dry steppe valley bott om / watertrack 72 22 27 area (km2 )1913911 MMG - Menengiin Tal Dry steppe N. aspect, very steep 4 1 3 area (km2 )1913912 MMG - Menengiin Tal Dry steppe N. aspect, slope 381 114 115 area (km2 )1913914 MMG - Menengiin Tal Dry steppe low(er) elev. fl at 24,201 7,260 7,263 area (km2 )1913915 MMG - Menengiin Tal Dry steppe low(er) elev. rolling hills 18,480 5,544 5,785 area (km2 )1913916 MMG - Menengiin Tal Dry steppe S. aspect, slope 231 69 83 area (km2 )1913917 MMG - Menengiin Tal Dry steppe high(er) elev. upland 178 53 68 area (km2 )1913918 MMG - Menengiin Tal Dry steppe high(er) elev. depression 1,013 304 363 area (km2 )1913919 MMG - Menengiin Tal Dry steppe valley bott om / watertrack 1,854 556 588 area (km2 )1913921 MMG - Middle Kherlen Dry steppe N. aspect, very steep 36 11 12 area (km2 )1913922 MMG - Middle Kherlen Dry steppe N. aspect, slope 1,925 577 606 area (km2 )1913924 MMG - Middle Kherlen Dry steppe low(er) elev. fl at 1,462 439 442 area (km2 )1913925 MMG - Middle Kherlen Dry steppe low(er) elev. rolling hills 12,708 3,812 3,818 area (km2 )1913926 MMG - Middle Kherlen Dry steppe S. aspect, slope 1,451 435 438 area (km2 )1913927 MMG - Middle Kherlen Dry steppe high(er) elev. upland 13,885 4,165 4,166 area (km2 )1913928 MMG - Middle Kherlen Dry steppe high(er) elev. depression 15,918 4,776 4,778 area (km2 )1913929 MMG - Middle Kherlen Dry steppe valley bott om / watertrack 1,287 386 386 area (km2 )
1804221 DFS - Tola-Onon Moderate dry steppe N. aspect, very steep 152 45 46 area (km2 )1804222 DFS - Tola-Onon Moderate dry steppe N. aspect, slope 443 133 158 area (km2 )1804225 DFS - Tola-Onon Moderate dry steppe low(er) elev. rolling hills 138 42 61 area (km2 )1804226 DFS - Tola-Onon Moderate dry steppe S. aspect, slope 467 140 171 area (km2 )1804227 DFS - Tola-Onon Moderate dry steppe high(er) elev. upland 1,397 419 421 area (km2 )1804228 DFS - Tola-Onon Moderate dry steppe high(er) elev. depression 1,125 337 382 area (km2 )1804229 DFS - Tola-Onon Moderate dry steppe valley bott om / watertrack 50 15 17 area (km2 )1804421 DFS - Dharkhan Moderate dry steppe N. aspect, very steep 778 234 236 area (km2 )1804422 DFS - Dharkhan Moderate dry steppe N. aspect, slope 2,601 780 782 area (km2 )1804424 DFS - Dharkhan Moderate dry steppe low(er) elev. fl at 618 186 187 area (km2 )1804425 DFS - Dharkhan Moderate dry steppe low(er) elev. rolling hills 2,506 752 753 area (km2 )
MMG = Mongolia-Manchurian Grasslands; DFS= Daurian Forest Steppe; TBBF = Trans-Baikal Boreal Forest
Appendix 2: Biodiversity targets, representati on goals and portf olio compositi on

Identi fying Conservati on Prioriti es in the Face of Future Development:46
ECOSYSTEM CLASSIFICATION AMOUNTcode biogeographic region ecosystem type landform Total Goal Portf olio unit
UPLAND ECOSYSTEM TYPES: Steppe Grasslands (conti nued)
1804426 DFS - Dharkhan Moderate dry steppe S. aspect, slope 2,538 761 781 area (km2 )1804427 DFS - Dharkhan Moderate dry steppe high(er) elev. upland 2,699 810 823 area (km2 )1804428 DFS - Dharkhan Moderate dry steppe high(er) elev. depression 1,745 523 527 area (km2 )1804429 DFS - Dharkhan Moderate dry steppe valley bott om / watertrack 194 58 59 area (km2 )1804911 DFS - Uldzin Moderate dry steppe N. aspect, very steep 36 11 12 area (km2 )1804912 DFS - Uldzin Moderate dry steppe N. aspect, slope 721 216 218 area (km2 )1804914 DFS - Uldzin Moderate dry steppe low(er) elev. fl at 2,139 642 775 area (km2 )1804915 DFS - Uldzin Moderate dry steppe low(er) elev. rolling hills 5,159 1,548 1,739 area (km2 )1804916 DFS - Uldzin Moderate dry steppe S. aspect, slope 635 190 202 area (km2 )1804917 DFS - Uldzin Moderate dry steppe high(er) elev. upland 473 142 156 area (km2 )1804918 DFS - Uldzin Moderate dry steppe high(er) elev. depression 620 186 192 area (km2 )1804919 DFS - Uldzin Moderate dry steppe valley bott om / watertrack 307 92 95 area (km2 )1813421 MMG - Orkhon Moderate dry steppe N. aspect, very steep 167 50 53 area (km2 )1813422 MMG - Orkhon Moderate dry steppe N. aspect, slope 1,199 360 389 area (km2 )1813424 MMG - Orkhon Moderate dry steppe low(er) elev. fl at 221 66 72 area (km2 )1813425 MMG - Orkhon Moderate dry steppe low(er) elev. rolling hills 1,442 433 435 area (km2 )1813426 MMG - Orkhon Moderate dry steppe S. aspect, slope 945 284 298 area (km2 )1813427 MMG - Orkhon Moderate dry steppe high(er) elev. upland 2,602 781 814 area (km2 )1813428 MMG - Orkhon Moderate dry steppe high(er) elev. depression 1,558 467 480 area (km2 )1813429 MMG - Orkhon Moderate dry steppe valley bott om / watertrack 87 26 26 area (km2 )1813431 MMG - Mandal-Gobi Moderate dry steppe N. aspect, very steep 211 63 64 area (km2 )1813432 MMG - Mandal-Gobi Moderate dry steppe N. aspect, slope 1,087 326 342 area (km2 )1813436 MMG - Mandal-Gobi Moderate dry steppe S. aspect, slope 864 259 267 area (km2 )1813437 MMG - Mandal-Gobi Moderate dry steppe high(er) elev. upland 14,693 4,408 4,412 area (km2 )1813438 MMG - Mandal-Gobi Moderate dry steppe high(er) elev. depression 5,801 1,740 1,778 area (km2 )1813439 MMG - Mandal-Gobi Moderate dry steppe valley bott om / watertrack 205 62 62 area (km2 )1813711 MMG - Pre- Khingan Moderate dry steppe N. aspect, very steep 1 0 0 area (km2 )1813712 MMG - Pre- Khingan Moderate dry steppe N. aspect, slope 76 23 27 area (km2 )1813714 MMG - Pre- Khingan Moderate dry steppe low(er) elev. fl at 1,542 463 497 area (km2 )1813715 MMG - Pre- Khingan Moderate dry steppe low(er) elev. rolling hills 1,680 504 752 area (km2 )1813716 MMG - Pre- Khingan Moderate dry steppe S. aspect, slope 40 12 13 area (km2 )1813718 MMG - Pre- Khingan Moderate dry steppe high(er) elev. depression 1 0 0 area (km2 )1813719 MMG - Pre- Khingan Moderate dry steppe valley bott om / watertrack 160 48 55 area (km2 )1813911 MMG - Menengiin Tal Moderate dry steppe N. aspect, very steep 36 11 17 area (km2 )1813912 MMG - Menengiin Tal Moderate dry steppe N. aspect, slope 1,405 422 495 area (km2 )1813914 MMG - Menengiin Tal Moderate dry steppe low(er) elev. fl at 10,207 3,062 3,062 area (km2 )1813915 MMG - Menengiin Tal Moderate dry steppe low(er) elev. rolling hills 14,100 4,230 4,236 area (km2 )1813916 MMG - Menengiin Tal Moderate dry steppe S. aspect, slope 1,099 330 364 area (km2 )1813917 MMG - Menengiin Tal Moderate dry steppe high(er) elev. upland 1,520 456 456 area (km2 )1813918 MMG - Menengiin Tal Moderate dry steppe high(er) elev. depression 1,115 335 352 area (km2 )1813919 MMG - Menengiin Tal Moderate dry steppe valley bott om / watertrack 935 280 281 area (km2 )1813921 MMG - Middle Kherlen Moderate dry steppe N. aspect, very steep 70 21 24 area (km2 )1813922 MMG - Middle Kherlen Moderate dry steppe N. aspect, slope 1,973 592 635 area (km2 )1813924 MMG - Middle Kherlen Moderate dry steppe low(er) elev. fl at 867 260 262 area (km2 )1813925 MMG - Middle Kherlen Moderate dry steppe low(er) elev. rolling hills 5,559 1,668 1,668 area (km2 )1813926 MMG - Middle Kherlen Moderate dry steppe S. aspect, slope 1,521 456 458 area (km2 )1813927 MMG - Middle Kherlen Moderate dry steppe high(er) elev. upland 5,329 1,599 1,606 area (km2 )1813928 MMG - Middle Kherlen Moderate dry steppe high(er) elev. depression 4,095 1,229 1,229 area (km2 )1813929 MMG - Middle Kherlen Moderate dry steppe valley bott om / watertrack 423 127 140 area (km2 )
MMG = Mongolia-Manchurian Grasslands; DFS= Daurian Forest Steppe; TBBF = Trans-Baikal Boreal Forest

Identi fying Conservati on Prioriti es in the Face of Future Development 47
ECOSYSTEM CLASSIFICATION AMOUNTcode biogeographic region ecosystem type landform Total Goal Portf olio unit
UPLAND ECOSYSTEM TYPES: Steppe Grasslands (conti nued)
1704221 DFS - Tola-Onon Meadow steppe N. aspect, very steep 1,739 522 541 area (km2 )1704222 DFS - Tola-Onon Meadow steppe N. aspect, slope 3,663 1,099 1,127 area (km2 )1704224 DFS - Tola-Onon Meadow steppe low(er) elev. fl at 100 30 65 area (km2 )1704225 DFS - Tola-Onon Meadow steppe low(er) elev. rolling hills 784 235 243 area (km2 )1704226 DFS - Tola-Onon Meadow steppe S. aspect, slope 4,458 1,337 1,338 area (km2 )1704227 DFS - Tola-Onon Meadow steppe high(er) elev. upland 6,602 1,981 1,997 area (km2 )1704228 DFS - Tola-Onon Meadow steppe high(er) elev. depression 2,575 773 778 area (km2 )1704229 DFS - Tola-Onon Meadow steppe valley bott om / watertrack 156 47 53 area (km2 )1704421 DFS - Dharkhan Meadow steppe N. aspect, very steep 652 196 201 area (km2 )1704422 DFS - Dharkhan Meadow steppe N. aspect, slope 1,700 510 522 area (km2 )1704424 DFS - Dharkhan Meadow steppe low(er) elev. fl at 348 104 105 area (km2 )1704425 DFS - Dharkhan Meadow steppe low(er) elev. rolling hills 1,245 373 389 area (km2 )1704426 DFS - Dharkhan Meadow steppe S. aspect, slope 1,778 533 587 area (km2 )1704427 DFS - Dharkhan Meadow steppe high(er) elev. upland 1,784 535 547 area (km2 )1704428 DFS - Dharkhan Meadow steppe high(er) elev. depression 644 193 194 area (km2 )1704429 DFS - Dharkhan Meadow steppe valley bott om / watertrack 71 21 24 area (km2 )1704911 DFS - Uldzin Meadow steppe N. aspect, very steep 312 93 125 area (km2 )1704912 DFS - Uldzin Meadow steppe N. aspect, slope 3,159 948 955 area (km2 )1704914 DFS - Uldzin Meadow steppe low(er) elev. fl at 2,081 624 829 area (km2 )1704915 DFS - Uldzin Meadow steppe low(er) elev. rolling hills 7,735 2,320 2,355 area (km2 )1704916 DFS - Uldzin Meadow steppe S. aspect, slope 2,865 859 862 area (km2 )1704917 DFS - Uldzin Meadow steppe high(er) elev. upland 1,574 472 486 area (km2 )1704918 DFS - Uldzin Meadow steppe high(er) elev. depression 1,412 424 432 area (km2 )1704919 DFS - Uldzin Meadow steppe valley bott om / watertrack 379 114 123 area (km2 )1709001 TBBF Meadow steppe N. aspect, very steep 517 155 337 area (km2 )1709002 TBBF Meadow steppe N. aspect, slope 803 241 444 area (km2 )1709004 TBBF Meadow steppe low(er) elev. fl at 44 13 17 area (km2 )1709005 TBBF Meadow steppe low(er) elev. rolling hills 444 133 323 area (km2 )1709006 TBBF Meadow steppe S. aspect, slope 984 295 544 area (km2 )1709007 TBBF Meadow steppe high(er) elev. upland 687 206 330 area (km2 )1709008 TBBF Meadow steppe high(er) elev. depression 403 121 234 area (km2 )1709009 TBBF Meadow steppe valley bott om / watertrack 59 18 34 area (km2 )1713421 MMG - Orkhon Meadow steppe N. aspect, very steep 669 201 213 area (km2 )1713422 MMG - Orkhon Meadow steppe N. aspect, slope 1,974 592 595 area (km2 )1713424 MMG - Orkhon Meadow steppe low(er) elev. fl at 84 25 28 area (km2 )1713425 MMG - Orkhon Meadow steppe low(er) elev. rolling hills 760 228 228 area (km2 )1713426 MMG - Orkhon Meadow steppe S. aspect, slope 1,724 517 520 area (km2 )1713427 MMG - Orkhon Meadow steppe high(er) elev. upland 5,418 1,625 1,670 area (km2 )1713428 MMG - Orkhon Meadow steppe high(er) elev. depression 2,251 675 683 area (km2 )1713429 MMG - Orkhon Meadow steppe valley bott om / watertrack 75 23 24 area (km2 )1713431 MMG - Mandal-Gobi Meadow steppe N. aspect, very steep 209 63 81 area (km2 )1713432 MMG - Mandal-Gobi Meadow steppe N. aspect, slope 756 227 274 area (km2 )1713436 MMG - Mandal-Gobi Meadow steppe S. aspect, slope 706 212 255 area (km2 )1713437 MMG - Mandal-Gobi Meadow steppe high(er) elev. upland 6,638 1,991 2,025 area (km2 )1713438 MMG - Mandal-Gobi Meadow steppe high(er) elev. depression 2,515 754 773 area (km2 )1713439 MMG - Mandal-Gobi Meadow steppe valley bott om / watertrack 132 39 40 area (km2 )1713711 MMG - Pre- Khingan Meadow steppe N. aspect, very steep 100 30 83 area (km2 )1713712 MMG - Pre- Khingan Meadow steppe N. aspect, slope 1,010 303 720 area (km2 )1713714 MMG - Pre- Khingan Meadow steppe low(er) elev. fl at 1,213 364 412 area (km2 )1713715 MMG - Pre- Khingan Meadow steppe low(er) elev. rolling hills 2,720 816 1,290 area (km2 )
MMG = Mongolia-Manchurian Grasslands; DFS= Daurian Forest Steppe; TBBF = Trans-Baikal Boreal Forest
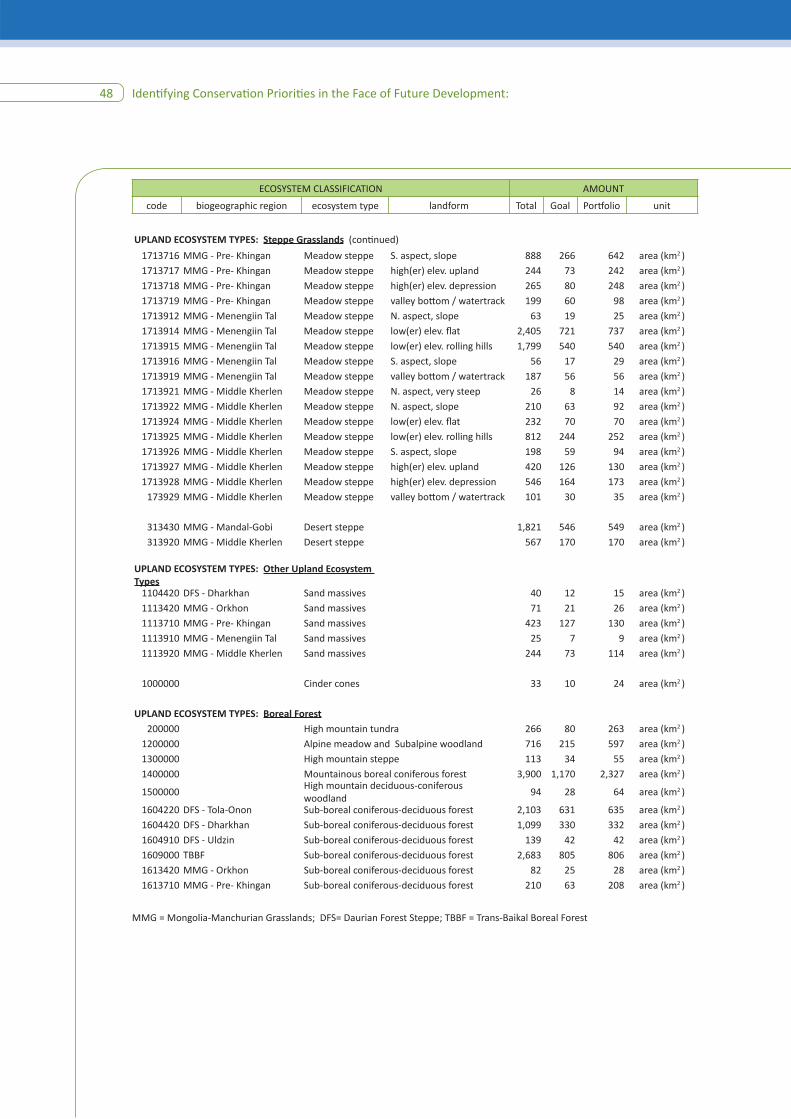
Identi fying Conservati on Prioriti es in the Face of Future Development:48
ECOSYSTEM CLASSIFICATION AMOUNT
code biogeographic region ecosystem type landform Total Goal Portf olio unit
UPLAND ECOSYSTEM TYPES: Steppe Grasslands (conti nued)
1713716 MMG - Pre- Khingan Meadow steppe S. aspect, slope 888 266 642 area (km2 )1713717 MMG - Pre- Khingan Meadow steppe high(er) elev. upland 244 73 242 area (km2 )1713718 MMG - Pre- Khingan Meadow steppe high(er) elev. depression 265 80 248 area (km2 )1713719 MMG - Pre- Khingan Meadow steppe valley bott om / watertrack 199 60 98 area (km2 )1713912 MMG - Menengiin Tal Meadow steppe N. aspect, slope 63 19 25 area (km2 )1713914 MMG - Menengiin Tal Meadow steppe low(er) elev. fl at 2,405 721 737 area (km2 )1713915 MMG - Menengiin Tal Meadow steppe low(er) elev. rolling hills 1,799 540 540 area (km2 )1713916 MMG - Menengiin Tal Meadow steppe S. aspect, slope 56 17 29 area (km2 )1713919 MMG - Menengiin Tal Meadow steppe valley bott om / watertrack 187 56 56 area (km2 )1713921 MMG - Middle Kherlen Meadow steppe N. aspect, very steep 26 8 14 area (km2 )1713922 MMG - Middle Kherlen Meadow steppe N. aspect, slope 210 63 92 area (km2 )1713924 MMG - Middle Kherlen Meadow steppe low(er) elev. fl at 232 70 70 area (km2 )1713925 MMG - Middle Kherlen Meadow steppe low(er) elev. rolling hills 812 244 252 area (km2 )1713926 MMG - Middle Kherlen Meadow steppe S. aspect, slope 198 59 94 area (km2 )1713927 MMG - Middle Kherlen Meadow steppe high(er) elev. upland 420 126 130 area (km2 )1713928 MMG - Middle Kherlen Meadow steppe high(er) elev. depression 546 164 173 area (km2 )
173929 MMG - Middle Kherlen Meadow steppe valley bott om / watertrack 101 30 35 area (km2 )
313430 MMG - Mandal-Gobi Desert steppe 1,821 546 549 area (km2 )313920 MMG - Middle Kherlen Desert steppe 567 170 170 area (km2 )
UPLAND ECOSYSTEM TYPES: Other Upland Ecosystem Types
1104420 DFS - Dharkhan Sand massives 40 12 15 area (km2 )1113420 MMG - Orkhon Sand massives 71 21 26 area (km2 )1113710 MMG - Pre- Khingan Sand massives 423 127 130 area (km2 )1113910 MMG - Menengiin Tal Sand massives 25 7 9 area (km2 )1113920 MMG - Middle Kherlen Sand massives 244 73 114 area (km2 )
1000000 Cinder cones 33 10 24 area (km2 )
UPLAND ECOSYSTEM TYPES: Boreal Forest200000 High mountain tundra 266 80 263 area (km2 )
1200000 Alpine meadow and Subalpine woodland 716 215 597 area (km2 )1300000 High mountain steppe 113 34 55 area (km2 )1400000 Mountainous boreal coniferous forest 3,900 1,170 2,327 area (km2 )
1500000High mountain deciduous-coniferous woodland
94 28 64 area (km2 )
1604220 DFS - Tola-Onon Sub-boreal coniferous-deciduous forest 2,103 631 635 area (km2 )1604420 DFS - Dharkhan Sub-boreal coniferous-deciduous forest 1,099 330 332 area (km2 )1604910 DFS - Uldzin Sub-boreal coniferous-deciduous forest 139 42 42 area (km2 )1609000 TBBF Sub-boreal coniferous-deciduous forest 2,683 805 806 area (km2 )1613420 MMG - Orkhon Sub-boreal coniferous-deciduous forest 82 25 28 area (km2 )1613710 MMG - Pre- Khingan Sub-boreal coniferous-deciduous forest 210 63 208 area (km2 )
MMG = Mongolia-Manchurian Grasslands; DFS= Daurian Forest Steppe; TBBF = Trans-Baikal Boreal Forest

Identi fying Conservati on Prioriti es in the Face of Future Development 49
ECOSYSTEM CLASSIFICATION AMOUNTcode biogeographic region ecosystem type Total Goal Portf olio unit
LAKE and WETLAND ECOSYSTEM TYPES
Riverine and palustrine wetlands2100000 Selinge River Basin large river fl oodplain 4,019 1,206 1,267 area (km2 )2200000 Selinge River Basin small stream riparian 2,200 660 742 area (km2 )3100000 Onon River Basin large river fl oodplain 1,384 415 691 area (km2 )3200000 Onon River Basin small stream riparian 919 276 401 area (km2 )4100000 Kherlen River Basin large river fl oodplain 3,104 931 994 area (km2 )4200000 Kherlen River Basin small stream riparian 2,775 832 845 area (km2 )5100000 Uldz River Basin large river fl oodplain 721 216 310 area (km2 )5200000 Uldz River Basin small stream riparian 1,518 455 546 area (km2 )6100000 Khalkh River Basin large river fl oodplain 792 238 324 area (km2 )6200000 Khalkh River Basin small stream riparian 1,878 563 564 area (km2 )7200000 Gal Tuul River Basin small stream riparian 977 293 303 area (km2 )8200000 Matad East wet depressions 2,866 860 883 area (km2 )9200000 other wet depressions 3,701 1,110 1,127 area (km2 )
Lakes and small water bodies310 NE Dornod water bodies 141 43 74 point locs.320 Selinge water bodies 96 29 41 point locs.330 Onon water bodies 41 13 26 point locs.340 Kherlen water bodies 169 51 106 point locs.350 Uldz water bodies 112 34 131 point locs.360 Buul Nuur water bodies 70 22 57 point locs.370 Gal water bodies 81 25 25 point locs.380 Matad east water bodies 68 21 43 point locs.391 Khalkha water bodies 268 81 168 point locs.392 Middle Kkalkha water bodies 146 44 62 point locs.393 Matad North water bodies 99 30 50 point locs.
3100 NE Dornod large lakes 260 78 149 area (km2 )3200 Selinge large lakes 49 15 29 area (km2 )3300 Onon large lakes 10 3 7 area (km2 )3400 Kherlen large lakes 73 22 31 area (km2 )3500 Uldz large lakes 107 32 91 area (km2 )3600 Buul Nuur large lakes 691 207 576 area (km2 )3700 Gal large lakes 186 56 133 area (km2 )3800 Matad east large lakes 55 16 17 area (km2 )3910 Khalkha large lakes 56 17 17 area (km2 )3920 Middle Kkalkha large lakes 56 17 22 area (km2 )3930 Matad North large lakes 36 11 19 area (km2 )

Identi fying Conservati on Prioriti es in the Face of Future Development:50
APPENDIX 3: Next steps in progress
Off set Planning (compensatory miti gati on) - see secti on 3.1.3. This will demonstrate how current informati on can be used to guide the use of off sets. See Figure 21 for example.
Portf olio site classifi cati on: Classifi cati on of portf olio sites according to protecti on status, threat and recommended conservati on strategy.
i. protected area status1. Nati onal2. Local PAs
ii. other priority-setti ng eff orts1. IBAs2. 1996 Biodiversity Acti on Plan
iii. Threat from mining and petroleum development1. existi ng leases2. strategic mineral/petroleum resources3. avoid areas
iv. Threat from grazing 1. grazing suitability analysis
a. grazing pressure (current)b. grass bank potenti al
Grazing management: Compare regional patt erns of livestock density and grassland producti vity (MODIS 2010) to identi fy:
a. possible overgrazing
b. possible grass banks (emergency forage). A recent study in the Gobi Desert by Hess et al (2011) suggests that in drought years, PAs can provide emergency forage or grass banks for herders, if eff ecti vely managed for that purpose.
c. within portf olio sites, areas in need of grazing management (per a.) and potenti al for grass banks (per b.)
d. impacts of climate change, specifi cally areas that may experience the combined impact of overgrazing and decreased producti vity due to drying trend.
Watershed protecti on designati ons: Develop informati on to support implementati on of the headwaters protecti on law.
a. identi fy “water towers” i.e headwater watersheds that produce the majority of runoff in the Kherlen, Onon and Selinge River Basins, based on global gridded runoff models (Fekete et al. 2002).
b. map acti ve fl oodplain and riparian areas of rivers in the study area. Floodplains and riparian areas are producti ve, criti cal habitat for many terrestrial and aquati c species and criti cal for maintaining water quality, and are easily damaged by over-grazing, mining and infrastructure development.
c. esti mate potenti al impacts of climate change to runoff and river discharge based on global climate forecasts and global gridded runoff models.

Identi fying Conservati on Prioriti es in the Face of Future Development 51
APPENDIX 4: Limitati ons of this study and recommendati ons for improvement
Portf olio Design
Biodiversity Targets
The mapped classifi cati on of ecosystems provides a spati ally consistent and comprehensive representati on of habitat and ecological process patt erns across the study area. With this informati on, we can evaluate a variety of portf olio designs to meet representati on goals. The classifi cati on is not intended to predict species compositi on and distributi on, as species respond to environmental patt erns and processes diff erently and at diff erent scales. Rather, it is intended to describe and map the variety of environmental patt erns and processes that infl uence the formati on and maintenance of habitat and distributi ons of biota at multi ple scales.
Because the ecosystem classifi cati on was strati fi ed across major environmental and biogeographic patt erns, and at a fi ner scale by landforms, the resulti ng portf olio includes areas that we assume support a broad range of common and representati ve biodiversity, based on a coarse-fi lter strategy (Hunter et al., 1988; Hunter, 1991; Groves et al 2002). Thus, the ecosystem classifi cati on plays important role in representi ng the range of habitat, environmental gradients and ecological processes characteristi c of the study area. Given the uncertainty of how species will respond to climate change, setti ng conservati on goals for the range of geophysical setti ngs is a means of representi ng the underlying physical template for species distributi ons and biogeography (Anderson and Ferree 2010, Beier and Brost 2010).
The landform classifi cati on functi oned well as a practi cal way to capture variati on in plant communiti es within the matrix-forming ecosystem types, and to represent the range of environmental gradients. By using a cluster analysis of several topographic indices, rather than landforms defi ned a priori, we were able to defi ne a small, practi cal number of landforms
that characterize the dominant physical setti ngs in the study area. Though we assume that the landform classifi cati on captures diff erences in soil properti es, we plan to analyze how well the portf olio represents the range of characteristi c soil types using existi ng soil maps.
We did not use species data to develop this fi rst portf olio, because we were not able to acquire distributi on data or develop accurate models that provide full coverage of the study area. The only available data for existi ng range of a red-listed species was Reed Parrotbill, which occurs in the Tashgain Tavan Lakes IBA and is included in portf olio. The Gap analysis report (Moore in prep.) produced maps of potenti al habitat of 10 species, based on expert input and existi ng maps of vegetati on types. We chose not to use this informati on for portf olio design because 1) the maps are coarse esti mates of historic range, which in several cases is very diff erent from currently occupied habitat, and 2) the maps were derived from source datasets similar those used in the ecosystem classifi cati on.
Using survey data with strong sampling bias to represent fi ne-fi lter element distributi ons in site selecti on can reduce effi ciency of site selecti on (Grand et al., 2007) and may arti fi cially raise the value of surveyed areas relati ve to un-surveyed areas. Areas diffi cult to survey may also be undeveloped and ecologically intact for the same reason, and will be undervalued if species data drive site selecti on. According to the coarse-fi lter/ fi ne-fi lter strategy, rare species are fi ne-fi lter targets requiring a focus independent of ecosystems (Hunter et al., 1988; Hunter, 1991; Groves et al 2002).
Representati on goals
Our choice of representati on goals was based the goal set by the Mongolia government to protect 30% of natural habitat (The Master Plan for Mongolia’s Protected Areas, 1998). Many regional conservati on plans have also set coarse fi lter goals as 30% of historic areal extent, based

Identi fying Conservati on Prioriti es in the Face of Future Development:52
loosely on the species-area relati onships derived from studies of island biogeography and “habitat islands” (MacArthur & Wilson, 1967; Dobson, 1996; Groves 2003). We do not assume that meeti ng the area goals, or protecti ng the set of portf olio sites, will ensure viability of all the nati ve biodiversity of the study area. Our intent was to identi fy a set of areas that represent the full range of habitat and environmental setti ngs with suffi cient redundancy to withstand current and future threats. As discussed earlier in the methods secti on, representati on goals are initi al esti mates and working hypotheses that provide the basis for adapti ve management.
Cost/conditi on index
The cost/conditi on index is a major factor in MARXAN site selecti on. Therefore, the portf olio design is sensiti ve to (1) the patt ern and accuracy of the source data and (2) our method for calculati ng the index that synthesizes the source data to esti mate cumulati ve anthropogenic impacts. The source datasets that we used to calculate the cost/conditi on index were the best available at the ti me of this study that covered the full extent of the study area at a consistent geographic scale. Though we assume that the cost index functi oned well at a coarse scale for this regional conservati on plan, we suggest the following improvements using new datasets that have become available in the last year:
1. The roads dataset was digiti zed at a coarse map scale (1:1 million), did not include all roads in the study area and did not disti nguish between paved highways and dirt tracks. A more current and comprehensive database of the nati onal roads network has been surveyed with GPS by at least one private GPS vendor.
2. The dataset of herder camp locati ons was useful for esti mati ng the regional patt ern of livestock density, but several similar datasets have been collected more recently that contain a more detailed and complete
inventory of the seasonal herder camps across the study area.
3. The delineati on of urban and agricultural areas is mapped at a coarse scale and based on fi eld survey conducted over 10 years ago (Vostokova and Gunin, 2005). Several land cover maps exist that delineate urban and agricultural areas at a fi ner map scale, based on more recent surveys and satellite images.
Improving representati on of species
The data developed for this study can be useful in the process of compiling data for species distributi ons and ranges. Both the ecosystem classifi cati on and the portf olio are useful for survey design and could be used to guide the survey of key species that could serve as the basis for developing predicti ve species models.
In cases where species survey data are insuffi cient to esti mate occurrence patt erns across the study area, predicti ve models can be developed based on species occurrence, observati on, and available survey data. Where survey date is adequate inducti ve modeling approaches can be att empted. Numerous freeware opti ons are available; for example GIS tool developed at the University of Georgia called the Element Distributi on Modeling Tools for ArcGIS (Nibbelink 2006) are potenti al opti ons. Where suffi cient survey data is lacking for inducti ve models a simpler deducti ve approach can be att empted. Deducti ve models that create binary models of suitable habitat through a series of GIS overlays based on for example: slope, aspect, topographic roughness, elevati on (DEM), stream buff ers, and vegetati on type, height and percent cover which should be available throughout the study area. These deducti ve models should be seen as a hypotheti cal predicti on of potenti al habitat that would need to be validated with survey data but could be used to prioriti ze survey eff orts.

Identi fying Conservati on Prioriti es in the Face of Future Development 53
Cultural and Historic Sites
Many sites with historic, cultural and religious signifi cance in Mongolia also contain high quality habitat because human uses are limited. Examples include Matad Moutain west of Matad Soum Center, which is not sett led and not used for livestock grazing, Shiliin bogd and Vangiin tsagaan uul. Some cultural sites may have less habitat value because of frequent visitors. For example,
Eej Khad, or ‘Mother Rock’ south of Ulaanbaatar, contains potenti al rocky breeding habitat for raptors that is frequently disturbed by people (Nyambayar & Tsveenmyadag 2009). We were not able to review the 100s of cultural and historic sites that occur in the study area. However informati on regarding the locati on and suitability of these sites would be very useful to future iterati ons of portf olio design, parti cularly in the context of land use planning.

Identi fying Conservati on Prioriti es in the Face of Future Development:54
Freshwater Assessment
Eff ecti ve conservati on of freshwater biodiversity, and specifi cally conservati on planning for freshwater biodiversity, must consider factors that are oft en absent from traditi onal terrestrial conservati on planning, and that require a basin-wide perspecti ve(Abell, Allan & Lehner, 2007). These factors include longitudinal connecti vity throughout the drainage network, cumulati ve anthropogenic impacts upstream, fl uvial processes and fl ow regimes. Therefore, protected areas designed for terrestrial biodiversity may not provide the size, confi gurati on, drainage network positi on and management necessary to maintain key ecological att ributes of freshwater systems, such as hydrologic regime or water quality, which can be impacted from areas outside of a designated protected area (Abell, Allan & Lehner, 2007).
We recommend using existi ng aquati c ecosystem classifi cati ons and basin GIS frameworks to design a freshwater conservati on area portf olio for the Selinge, Kherlen and Onon River basins that meets representati on goals for aquati c habitat and opti mize for ecological conditi on and longitudinal connecti vity. Methods exist for regional conservati on planning that have been tailored for freshwater planning for basins (e.g., Abell 2002; Higgins, 2003), and applied in North
America (e.g., Smith et al. 2002; Weitzell et al. 2003; Sowa et al. 2007; Khoury et al. 2011), South America (e.g., Thieme et al., 2007), Africa (e.g., Nel et al., 2007) and Asia (e.g., Heiner et al. 2011). With the HydroSHEDs datasets it is now possible, for all the river basins in Mongolia, to map the hydrographic analysis framework to support freshwater conservati on planning (Lehner, Verdin & Jarvis, 2006).
This freshwater portf olio can support design and management of freshwater protected areas, land use planning that minimizes impact to water quality and hydropower siti ng and operati on that minimizes impacts to fl ow regimes and longitudinal connecti vity of the drainage network. This informati on will also make it possible to incorporate freshwater biodiversity into off set planning, using the freshwater portf olio and aquati c habitat classifi cati on.
Landscape Connecti vity and the Mongolian Gazelle
The Mongolian Gazelle is endemic to the Daurian Forest Steppe and the Mongolian-Manchurian Grassland ecoregions, and plays a major ecological role in the grasslands (Olson 2008). The large populati on, over one million individuals, is a prey base for predators and scavengers. As nomadic ungulates, gazelle redistribute nutrients and may
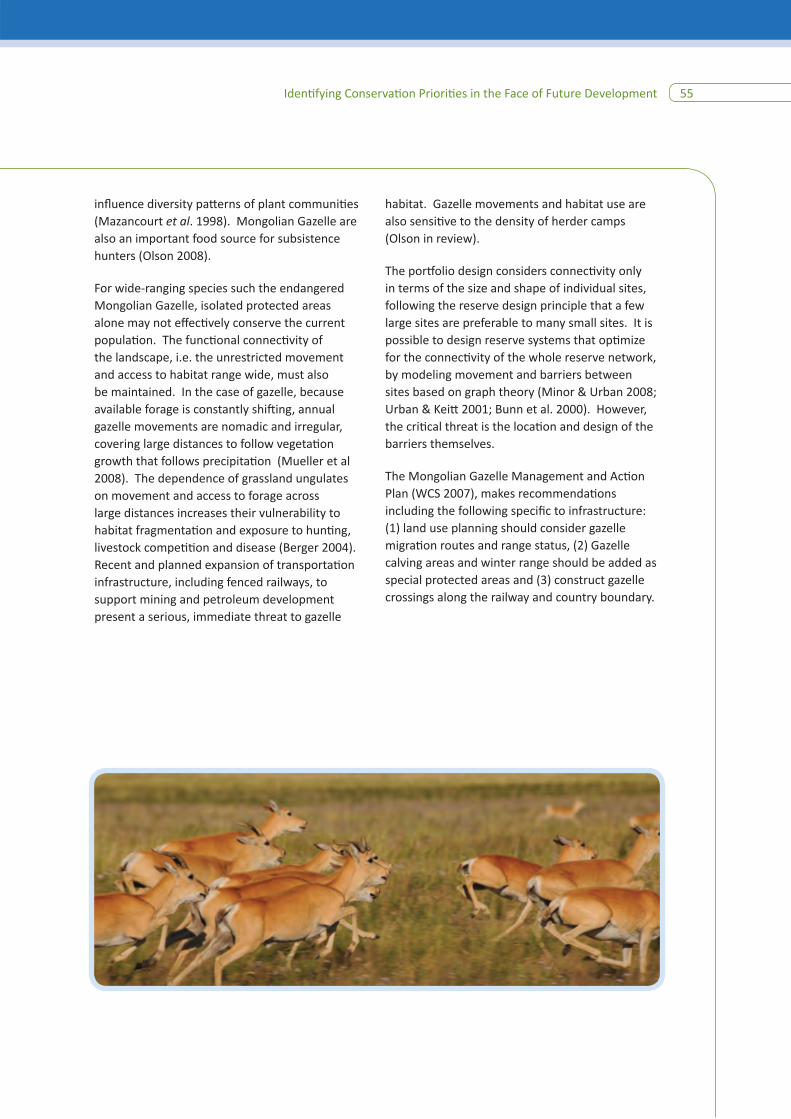
Identi fying Conservati on Prioriti es in the Face of Future Development 55
infl uence diversity patt erns of plant communiti es (Mazancourt et al. 1998). Mongolian Gazelle are also an important food source for subsistence hunters (Olson 2008).
For wide-ranging species such the endangered Mongolian Gazelle, isolated protected areas alone may not eff ecti vely conserve the current populati on. The functi onal connecti vity of the landscape, i.e. the unrestricted movement and access to habitat range wide, must also be maintained. In the case of gazelle, because available forage is constantly shift ing, annual gazelle movements are nomadic and irregular, covering large distances to follow vegetati on growth that follows precipitati on (Mueller et al 2008). The dependence of grassland ungulates on movement and access to forage across large distances increases their vulnerability to habitat fragmentati on and exposure to hunti ng, livestock competi ti on and disease (Berger 2004). Recent and planned expansion of transportati on infrastructure, including fenced railways, to support mining and petroleum development present a serious, immediate threat to gazelle
habitat. Gazelle movements and habitat use are also sensiti ve to the density of herder camps (Olson in review).
The portf olio design considers connecti vity only in terms of the size and shape of individual sites, following the reserve design principle that a few large sites are preferable to many small sites. It is possible to design reserve systems that opti mize for the connecti vity of the whole reserve network, by modeling movement and barriers between sites based on graph theory (Minor & Urban 2008; Urban & Keitt 2001; Bunn et al. 2000). However, the criti cal threat is the locati on and design of the barriers themselves.
The Mongolian Gazelle Management and Acti on Plan (WCS 2007), makes recommendati ons including the following specifi c to infrastructure: (1) land use planning should consider gazelle migrati on routes and range status, (2) Gazelle calving areas and winter range should be added as special protected areas and (3) construct gazelle crossings along the railway and country boundary.

Identi fying Conservati on Prioriti es in the Face of Future Development:56
NOTE

Identi fying Conservati on Prioriti es in the Face of Future Development:Applying Development by Design in the Grasslands of Mongolia
April 2011